Emotional Intelligence of Women Employees: Revealing the ...
20
International Journal of Research in Social Sciences Vol. 7 Issue 12, December 2017, ISSN: 2249-2496 Impact Factor: 7.081 Journal Homepage: http://www.ijmra.us , Email: [email protected] Double-Blind Peer Reviewed Refereed Open Access International Journal - Included in the International Serial Directories Indexed & Listed at: Ulrich's Periodicals Directory ©, U.S.A., Open J-Gage as well as in Cabell‟s Directories of Publishing Opportunities, U.S.A 373 International Journal of Research in Social Sciences http://www.ijmra.us , Email: [email protected] Emotional Intelligence of Women Employees: Revealing the new Dimensions Sugandha Verma * Abstract Emotional intelligence (EI) is an important factor that can measure individuals' performance in their professional lives beyond their daily lives, increase or decrease their success, contribute to the measurement of managerial qualities, and improve organizational communication and interaction. Review of relevant literature revealed that the topic of EI is controversial. The review also made it evident that lack of identifying the dimensions of EI and women specific studies in India, jointly conceive the research gap. Thus, this study tried to identify the new dimensions of EI and proposed them for practical adoption. With the sample of 182 female bank employees from Uttarakhand state, Exploratory Factor Analysis ultimately discovered two dimensions of EI, namely, Felt intelligence and Displayed intelligence. Cronbach‟s alpha values reported the high reliabilities for the dimensions and EI instrument as a whole. At the end, conclusion, limitations and future research agenda have also been discussed. Keywords: Banking sector, Dimensions, Emotional intelligence, Exploratory factor analysis, Women employees. * Research Scholar (Ph.D. Student)Department of Commerce,S.M.J.N. (P.G.) College, Haridwar (Uttarakhand)
Transcript of Emotional Intelligence of Women Employees: Revealing the ...

International Journal of Research in Social Sciences Vol. 7 Issue 12, December 2017,
ISSN: 2249-2496 Impact Factor: 7.081
Journal Homepage: http://www.ijmra.us, Email: [email protected]
Double-Blind Peer Reviewed Refereed Open Access International Journal - Included in the International
Serial Directories Indexed & Listed at: Ulrich's Periodicals Directory ©, U.S.A., Open J-Gage as well as
in Cabell‟s Directories of Publishing Opportunities, U.S.A
373 International Journal of Research in Social Sciences
http://www.ijmra.us, Email: [email protected]
Emotional Intelligence of Women Employees:
Revealing the new Dimensions
Sugandha Verma*
Abstract
Emotional intelligence (EI) is an important factor that can measure individuals' performance in
their professional lives beyond their daily lives, increase or decrease their success, contribute to
the measurement of managerial qualities, and improve organizational communication and
interaction. Review of relevant literature revealed that the topic of EI is controversial. The
review also made it evident that lack of identifying the dimensions of EI and women specific
studies in India, jointly conceive the research gap. Thus, this study tried to identify the new
dimensions of EI and proposed them for practical adoption. With the sample of 182 female bank
employees from Uttarakhand state, Exploratory Factor Analysis ultimately discovered two
dimensions of EI, namely, Felt intelligence and Displayed intelligence. Cronbach‟s alpha values
reported the high reliabilities for the dimensions and EI instrument as a whole. At the end,
conclusion, limitations and future research agenda have also been discussed.
Keywords: Banking sector, Dimensions, Emotional intelligence, Exploratory factor
analysis, Women employees.
* Research Scholar (Ph.D. Student)Department of Commerce,S.M.J.N. (P.G.) College,
Haridwar (Uttarakhand)

ISSN: 2249-2496 Impact Factor: 7.081
374 International Journal of Research in Social Sciences
http://www.ijmra.us, Email: [email protected]
Introduction
Intelligence about emotions plays a major role in ensuring the happiness of the employees. When
an employee stumbles in workplace emotionally, it signifies that intelligence is lagging. An
aspect of emotional intelligence (EI) called social intelligence was first described by Thorndike
in the 1920s as one of many different types of intelligence individuals possess (Cherniss and
Goleman, 2001), yet Wechsler‟s intelligence quotient (IQ) test, developed in the 1950s, had a
greater societal influence. Thus, the next half-century was dominated by IQ testing and the view
of emotions as the antithesis of rationality (Fabian, 1999). Not until the 1980s was the idea of
multiple intelligences revived. Initially described by Gardner (1983), these multiple intelligences
included linguistic, logical-mathematical, bodily-kinesthetic, spatial, musical, inter- personal,
and intrapersonal. Gardner described these intelligences as just as important as the type of
intelligence measured by IQ tests (Cherniss, 2000). After Gardner (1983), terms closer to the
current usage of EI were developed. EI is a topic of importance since 1990s. It is considered as a
concept for handling organizational issues in several contexts.
Goleman (1995) defined EI as having five parts: knowing emotions, managing emotions,
motivating oneself, recognizing emotions in others, and handling relationships (p. 43). Elsewhere
in the book, the definition includes self-awareness, impulse control, delay of gratification,
handling stress and anxiety, and empathy (Goleman, 1995, p. 259). In Goleman and Cherniss‟s
(1998) subsequent book, the five dimensions are further broken down into 25 different emotional
competencies. Some researchers argue that Goleman‟s all-inclusive definition describes
personality rather than intelligence, is not scientific, and adds nothing new to the literature
(Mayer et al., 2000). BarOn (1997) mentioned that EI reflects one‟s ability to deal with daily
environment challenges and helps predict one‟s success in life, including professional and
personal pursuits. Mayer and Salovey (1997) defined EI as, “the ability to perceive accurately,
appraise, and express emotions; the ability to access and/or generate feelings when they facilitate
thought; the ability to understand emotions and emotional knowledge; and the ability to regulate
emotions to promote emotional and intellectual growth.” So, EI is the term, which is used in the
literature of Organizational Behaviour (OB) to express such mental and cognitive aspects of
intelligence on the part of employees.

ISSN: 2249-2496 Impact Factor: 7.081
375 International Journal of Research in Social Sciences
http://www.ijmra.us, Email: [email protected]
This research paper is organized into eight sections. The first section illuminates the introductory
part. Review of literature is presented in the second section and underlines the research gap.
Significance of the study constitutes section three. Fourth and fifth sections state the objectives
and methodology of the paper respectively. Next section reports the results and findings. Seventh
section concludes the study. Finally, limitations and future research agenda have been discussed
in the last (eighth) section.
Review of Literature
Review of antecedent work is being presented under this section. EI has been defined as the
ability to adaptively recognize, understand, manage, and harness emotions both in self and others
(Mayer and Salovey 1995; Schutte et al., 1998) and to use emotion to facilitate cognitive
processing. EI has been conceptualized in the literature both as a relatively enduring trait and as
ability (Petrides and Furnham, 2006). Afolabi (2004) argued that EI is not a single trait or ability
rather; it is a composite of distinct emotion reasoning abilities. An individual‟s emotional
intelligence is an indicator of how an individual perceives, understands and regulates emotions.
The construct of EI incorporates in itself a number of abilities, including the ability to be aware
of one‟s own and of other people‟s emotions, to be able to manage those emotions, and to
understand the complex relationships that can occur between emotions and likely emotional
transitions (Caner and Salovey, 1997). On the whole, the ability called EI is not fixed for life and
can be improved with suitable training (Goleman, 1995; Caner and Salovey, 1997; Salovey and
Caner, 1990). This can mean that the ability called EI is not an innate but acquired ability on the
part of an individual who earned it through rigorous experiences and practices with a number of
interpersonal situations.
In both research and practice, EI is a highly contested construct (Dasborough and Ashkanasy,
2002; Fambrough and Hart, 2008; Zeidner, Matthews and Roberts, 2004). Thus, EI skills training
development interventions are not yet well understood, hence the need for evidence-based
approach to issues pertaining to EI. EI exists not only among the EI researchers themselves but
among their critics who have different views of EI. For example, there is no agreement among
the researchers as to whether EI should be considered as an individual ability or a non-cognitive

ISSN: 2249-2496 Impact Factor: 7.081
376 International Journal of Research in Social Sciences
http://www.ijmra.us, Email: [email protected]
skill, nor yet whether it should be treated as a capability or a competency that influences an
individual‟s competence to cope with life‟s demands and pressures (Akerjordet and Severinsson,
2007; Dulewicz and Higgs, 2000). Questions continue to arise as to the concept of EI, as well as
its definition. Opponents of EI argue that the concept of EI is invalid because it is not a form of
intelligence and because its definition is not only broad but it keeps changing. They also
justifiably question whether EI is simply a theory about personality or a combination of both
intelligence and personality.
A review of relevant literature reveals that the topic of EI is controversial. Moreover, because the
interest in the construct of EI has and continues to grow rapidly, researchers are constantly
amending their own definitions. It is also observed that a few studies in India (Prasad, Dubey and
Mahato, 2015; Puthanikar and Shivakumara, 2016) talk about EI and its constructs. Women
employees‟ oriented studies are almost absent in this regard. Therefore, review makes it evident
that lack of identifying the dimensions of EI and women specific studies in India, jointly
conceive the research gap.
Rationale of the Study
In the absence of empirical evidence regarding EI and its dimensions, the questions being raised
about the construct of EI by Human Resource Development (HRD) scholars and practitioners
remain unresolved, hence the need for this study. EI is emerging as an important construct in
predicting a range of positive outcomes such as improved performance, good work climate,
increased productivity, and career and life success. A growing body of research on EI suggested
that it was possible to help employees to become more emotionally intelligent at work (Cherniss,
Goleman and Emmerling, 1998). Thus, EI required to be explored particularly in Indian context.
Objectives of the Study
This section outlines the objectives set for the study. The objectives are:
to test the validity and reliability of the instrument for measuring EI, and
to identify the new dimensions of EI.

ISSN: 2249-2496 Impact Factor: 7.081
377 International Journal of Research in Social Sciences
http://www.ijmra.us, Email: [email protected]
Research Methodology
The details of methodology adopted for the study are presented in this section. The universe of
the study comprised of women employees, who are working in bank branches of Garhwal region
in Uttarakhand state. Accordingly, 182 respondents selected conveniently from Haridwar district
to constitute the required sample. The measuring instrument of EI surveyed among these female
employees on self-administration basis. The instrument consisted of 10 statements, which were
to be rated on five point Likert scale, ranging from one as strongly disagree to five as strongly
agree. There was a neutral middle point also at the position of point three, which provided
balance to the instrument as equality of negative and positive responses on the left and right sides
respectively. Coding of the 10 statements of the instrument is mentioned in Table 1. Some
demographic variables, such as, age, marital status, type of family, number of dependents and
job experience, were also included in the instrument.
Table 1: Coding of the statements (variables)
Code Statement (Variable)
Q-1 I can let anger „go‟ quickly so that it no longer affects me.
Q-2 I am always able to see things from the other person‟s point of view.
Q-3 Others can rarely tell what kind of mood I am in.
Q-4 I can consciously alter my frame of mind or mood in public.
Q-5 I believe you should do the difficult things first.
Q-6 Other individuals are not „difficult‟ just „different‟.
Q-7 I try to influence other people to get my way.
Q-8 I am good at reconciling differences with other people.
Q-9 Awareness of my emotions is very important to me at all the times.
Q-10 Motivation has been the key to my success.
In addition, a gist of research methodology is being described here.
1. Testing of validity:
The validity of the instrument was confirmed under two categories, viz., internal and external.
Internal validity ensured that all statements belong to the concerned dimensions. While, external

ISSN: 2249-2496 Impact Factor: 7.081
378 International Journal of Research in Social Sciences
http://www.ijmra.us, Email: [email protected]
validity was tested in the form of content and construct validities. Content validity was
determined by experts‟ opinion. To assess the construct validity, Exploratory Factor Analysis
(EFA) was conducted with the help of Statistical Package of Social Sciences (SPSS).
EFA (synonymously Principal Component Analysis) is a technique for identifying groups or
clusters of variables. It has its specialty to construct a questionnaire to measure an underlying
variable. EFA decomposes the original data into a set of linear variates. It ascertains the
contribution of a particular item (statement) to the component (factor). Additionally, EFA is a
psychometrically sound procedure, it is conceptually less complex and it has various similarities
to discriminant analysis (Field, 2009, p. 638). Therefore, it is rational to operate EFA for this
study. Orthogonal rotation (varimax) has been applied to data, as it assumes all the factors are
independent and unrelated. It attempts to maximize the dispersion of loadings within factors
(Field, 2009, p. 644).
2. Testing of reliability:
The most widely used and trusted technique of Cronbach‟s alpha coefficient was applied to
check the reliability status of the main scale (instrument) and sub-scales (factors) as well.
3. Description of sample:
A summary of sample characterization has been depicted in Table 2.
Table 2: Sample description
Demographic Variable Fractions Frequenc
y Percent
Age Up to 30 years 84 46.1
31-40 years 58 31.9
41-50 years 23 12.7
51 years and above 17 9.3
Total 182 100.0
Marital Status Unmarried 73 40.1
Married 97 53.3
Widow or Divorcee 12 6.6

ISSN: 2249-2496 Impact Factor: 7.081
379 International Journal of Research in Social Sciences
http://www.ijmra.us, Email: [email protected]
Total 182 100.0
Type of Family Nuclear 118 64.8
Joint 64 35.2
Total 182 100.0
No. of Dependents None 32 17.6
1-3 87 47.8
4-6 49 26.9
7 and above 14 7.7
Total 182 100.0
Job Experience Up to 5 years 106 58.2
6-10 years 43 23.7
11-20 years 22 12.1
21-30 years 11 6.0
Total 182 100.0
*Source: Author‟s own findings
Results and Findings
This section reports the results of EFA and reliability analyses. It is further divided into three
sub-sections for both analyses and presents the newly revealed dimensions of EI.
1. Exploratory Factor Analysis
To extract the valid factors from the instrument, EFA takes the base of various tests, matrices,
graphs, etc., which are displayed as hereunder.
Correlation: The correlations among 10 statements or variables have been expressed in
Table 3, i.e., Correlation matrix.
Table 3: Correlation matrix a
Q-1 Q-2 Q-3 Q-4 Q-5 Q-6 Q-7 Q-8 Q-9 Q-10
Correlati
on
Q-
1 1.000 .393 .259 .394 .408 .319 .338 .298 .386 .405

ISSN: 2249-2496 Impact Factor: 7.081
380 International Journal of Research in Social Sciences
http://www.ijmra.us, Email: [email protected]
Q-
2 .393 1.000 .420 .374 .343 .470 .454 .434 .472 .457
Q-
3 .259 .420 1.000 .357 .454 .367 .428 .356 .403 .391
Q-
4 .394 .374 .357 1.000 .370 .348 .417 .456 .427 .456
Q-
5 .408 .343 .454 .370 1.000 .401 .448 .442 .391 .371
Q-
6 .319 .470 .367 .348 .401 1.000 .400 .369 .463 .355
Q-
7 .338 .454 .428 .417 .448 .400 1.000 .416 .423 .376
Q-
8 .298 .434 .356 .456 .442 .369 .416 1.000 .438 -.369
Q-
9 .386 .472 .403 .427 .391 .463 .423 .438 1.000 -.322
Q-
10 .405 .457 .391 .456 .371 .355 .376 -.369 -.322 1.000
Sig. (1-
tailed)
Q-
1
.000 .015 .004 .000 .002 .000 .001 .000 .012
Q-
2 .000
.007 .000 .000 .000 .000 .001 .000 .000
Q-
3 .015 .007
.017 .019 .012 .001 .018 .003 .005
Q-
4 .004 .000 .017
.011 .003 .002 .000 .004 .018
Q-
5 .000 .000 .019 .011
.008 .000 .002 .000 .000

ISSN: 2249-2496 Impact Factor: 7.081
381 International Journal of Research in Social Sciences
http://www.ijmra.us, Email: [email protected]
Q-
6 .002 .000 .012 .003 .008
.004 .017 .014 .000
Q-
7 .000 .000 .001 .002 .000 .004
.006 .001 .015
Q-
8 .001 .001 .018 .000 .002 .017 .006
.013 .006
Q-
9 .000 .000 .003 .004 .000 .014 .001 .013
.012
Q-
10 .012 .000 .005 .018 .000 .000 .015 .006 .012
a. Determinant = .164
*Source: SPSS
Output
It is observed from upper part of Table 3 that no value of correlation is nor too small (less than
.2) neither too large (more than .9). Lower part of the table exhibits, all the values are significant
(p<.05). Furthermore, the value of determinant (.164), placed at the footnote of the table, is
greater than the necessary value of .00001 (Field, 2009, p. 648). In short, all statements in the
instrument correlate reasonably well with all others and none of the correlation coefficients are
excessively large. Therefore, multi-collinearity is not a problem for these data and the instrument
does not require any elimination at this stage (Field, 2009, p. 658).
KMO and Bartlett’s Test: The results of the tests of sampling adequacy and sphericity are
shown in Table 4.
Table 4: KMO and Bartlett's test
Kaiser-Meyer-Olkin Measure of Sampling
Adequacy. .828
Bartlett's Test of
Sphericity
Approx. Chi-Square 319.604
df 45
Sig. .000
*Source: SPSS Output

ISSN: 2249-2496 Impact Factor: 7.081
382 International Journal of Research in Social Sciences
http://www.ijmra.us, Email: [email protected]
In Table 4, KMO value is .828, which may be regarded as „great‟ (Field, 2009, p. 659) and
makes it evident that sample size is adequate for EFA. While, Bartlett‟s test value (.000) is
highly significant (p<.001), which confirms the presence of some sort of relationship between
variables and therefore EFA is appropriate (Field, 2009, p. 660).
Anti-Image Matrix: Table 5 displays the KMO values for each individual statement
(variable) on the diagonal of this matrix in bold font.
Table 5: Anti-image matrix
Q-1 Q-2 Q-3 Q-4 Q-5 Q-6 Q-7 Q-8 Q-9 Q-10
Anti-
image
Correlatio
n
Q-1 .791a .010 .017 .004 -.012 -.008 -.018 -.015 -.017 -.007
Q-2 .010 .905a .018 -.023 -.018 -.013 -.014 -.022 -.016 -.009
Q-3 .017 .018 .760a .006 -.007 -.031 -.038 -.026 -.014 -.024
Q-4 .004 -.023 .006 .772a .023 -.028 -.013 -.012 -.005 -.014
Q-5 -.012 -.018 -.007 .023 .895a .026 -.008 -.008 -.003 -.021
Q-6 -.008 -.013 -.031 -.028 .026 .784a .015 -.004 -.009 -.028
Q-7 -.018 -.014 -.038 -.013 -.008 .015 .857a .018 -.015 .019
Q-8 -.015 -.022 -.026 -.012 -.008 -.004 .018 .695a .013 .025
Q-9 -.017 -.016 -.014 -.005 -.003 -.009 -.015 .013 .863a .021
Q-
10 -.007 -.009 -.024 -.014 -.021 -.028 .019 .025 .021 .844
a
a. Measures of Sampling
Adequacy(MSA)
*Source: SPSS Output
As per the Kaiser‟s rule, the values should be above the bare minimum of .5 for all variables. In
Table 5, for these data all values are well above .5. Besides this, the off diagonal elements are
small, which fulfill another demand of a good model (Field, 2009, p. 659).

ISSN: 2249-2496 Impact Factor: 7.081
383 International Journal of Research in Social Sciences
http://www.ijmra.us, Email: [email protected]
Communalities: Values of communalities, as posed in Table 6 for all the variables after
extraction, are greater than the required minimum value of .3. Hence, communalities also support
these data.
Table 6: Communalities
Initial Extraction
Q-1 1.000 .676
Q-2 1.000 .602
Q-3 1.000 .611
Q-4 1.000 .700
Q-5 1.000 .552
Q-6 1.000 .575
Q-7 1.000 .583
Q-8 1.000 .640
Q-9 1.000 .556
Q-10 1.000 .550
Extraction Method:
Principal Component
Analysis.
*Source: SPSS Output
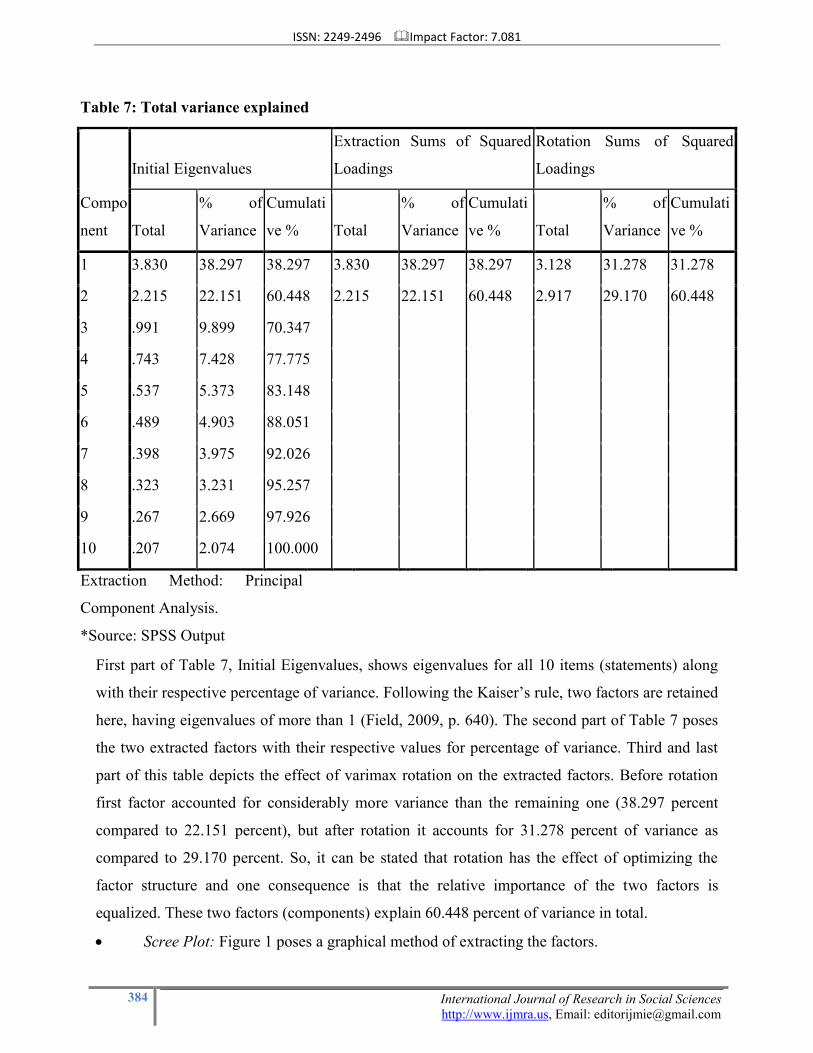
Total Variance Explained: Table 7 presents the total variance explained under three
categories, viz., initial eigenvalues (before extraction of factors), extraction sums of squared
loadings (after extraction, but before rotation applied) and rotation sums of squared loadings
(after rotation).
ISSN: 2249-2496 Impact Factor: 7.081
384 International Journal of Research in Social Sciences
http://www.ijmra.us, Email: [email protected]
Table 7: Total variance explained
Compo
nent
Initial Eigenvalues
Extraction Sums of Squared
Loadings
Rotation Sums of Squared
Loadings
Total
% of
Variance
Cumulati
ve % Total
% of
Variance
Cumulati
ve % Total
% of
Variance
Cumulati
ve %
1 3.830 38.297 38.297 3.830 38.297 38.297 3.128 31.278 31.278
2 2.215 22.151 60.448 2.215 22.151 60.448 2.917 29.170 60.448
3 .991 9.899 70.347
4 .743 7.428 77.775
5 .537 5.373 83.148
6 .489 4.903 88.051
7 .398 3.975 92.026
8 .323 3.231 95.257
9 .267 2.669 97.926
10 .207 2.074 100.000
Extraction Method: Principal
Component Analysis.
*Source: SPSS Output
First part of Table 7, Initial Eigenvalues, shows eigenvalues for all 10 items (statements) along
with their respective percentage of variance. Following the Kaiser‟s rule, two factors are retained
here, having eigenvalues of more than 1 (Field, 2009, p. 640). The second part of Table 7 poses
the two extracted factors with their respective values for percentage of variance. Third and last
part of this table depicts the effect of varimax rotation on the extracted factors. Before rotation
first factor accounted for considerably more variance than the remaining one (38.297 percent
compared to 22.151 percent), but after rotation it accounts for 31.278 percent of variance as
compared to 29.170 percent. So, it can be stated that rotation has the effect of optimizing the
factor structure and one consequence is that the relative importance of the two factors is
equalized. These two factors (components) explain 60.448 percent of variance in total.
Scree Plot: Figure 1 poses a graphical method of extracting the factors.

ISSN: 2249-2496 Impact Factor: 7.081
385 International Journal of Research in Social Sciences
http://www.ijmra.us, Email: [email protected]
In Figure 1, there is clear point of inflexion on third component. After that, the slope of line is
changed. The rule says, we should retain (extract) only factors, which lie on the left of the point
of inflexion. Thus, two factors can be extracted here. Since, the eigenvalues, as per the Kaiser‟s
criterion, also support the extraction of two factors; the same two are extracted (Field, 2009, p.
640).
Reproduced Correlations: Table 8 shows the reproduced correlation matrix.
Table 8: Reproduced correlations
Q-1 Q-2 Q-3 Q-4 Q-5 Q-6 Q-7 Q-8 Q-9 Q-10
Reproduc
ed
Correlatio
n
Q-1 .676a .401 .272 .417 .423 .336 .374 .319 .458 .414
Q-2 .401 .602a .445 .378 .406 .483 .478 .439 .489 .493
Q-3 .272 .445 .611a .368 .473 .379 .452 .417 .410 .406
Q-4 .417 .378 .368 .700a .397 .352 .432 .459 .478 .474
Q-5 .423 .406 .473 .397 .552a .434 .456 .470 .418 .397
Q-6 .336 .483 .379 .352 .434 .575a .459 .383 .469 .372
Q-7 .374 .478 .452 .432 .456 .459 .583a .418 .437 .443

ISSN: 2249-2496 Impact Factor: 7.081
386 International Journal of Research in Social Sciences
http://www.ijmra.us, Email: [email protected]
Q-8 .319 .439 .417 .459 .470 .383 .418 .640a .453 -.434
Q-9 .458 .489 .410 .478 .418 .469 .437 .453 .556a -.354
Q-
10 .414 .493 .406 .474 .397 .372 .443 -.434 -.354 .550
a
Residual b Q-1 -.008 -.013 -.023 -.015 -.017 -.036 -.021 -.072 -.009
Q-2 -.008 -.025 -.004 -.063 -.013 -.024 -.005 -.017 -.036
Q-3 -.013 -.025 -.011 -.019 -.012 -.024 -.061 -.007 -.015
Q-4 -.023 -.004 -.011 -.027 -.004 -.015 -.003 -.051 -.018
Q-5 -.015 -.063 -.019 -.027 -.033 -.008 -.028 -.027 -.026
Q-6 -.017 -.013 -.012 -.004 -.033 -.059 -.014 -.006 -.017
Q-7 -.036 -.024 -.024 -.015 -.008 -.059 -.002 -.014 -.067
Q-8 -.021 -.005 -.061 -.003 -.028 -.014 -.002 -.015 .065
Q-9 -.072 -.017 -.007 -.051 -.027 -.006 -.014 -.015 .032
Q-
10 -.009 -.036 -.015 -.018 -.026 -.017 -.067 .065 .032
Extraction Method: Principal
Component Analysis.
a. Reproduced communalities
b. Residuals are computed between observed and reproduced correlations. There are 7
(15.56%) nonredundant residuals with absolute values greater than 0.05.
*Source: SPSS Output
The upper half of Table 8, i.e., Reproduced Correlation, contains the correlation coefficients
among all the statements based on the factor model. The diagonal of this matrix depicts the
communalities after extraction for each variable. However, the lower half of the table displays
the differences between the observed correlations and correlations based on the model, i.e., the
residuals. As per the footnote summary, there are seven residuals (15.56 percent), which are
greater than .05. This percentage should be less than 50 percent and the smaller, it is the better
(Field, 2009, p. 664). So, the integrity of model is established.

ISSN: 2249-2496 Impact Factor: 7.081
387 International Journal of Research in Social Sciences
http://www.ijmra.us, Email: [email protected]
Rotated Component Matrix: Table 9 denotes the factor loadings of the two extracted
factors after the application of varimax rotation.
Table 9: Rotated component matrix a
Component
1 2
Q-5 .834
Q-2 .810
Q-9 .779
Q-1 .747
Q-10 .741
Q-4 .847
Q-7 .821
Q-6 .732
Q-8 .794
Q-3 .757
Extraction Method: Principal
Component Analysis.
Rotation Method: Varimax with
Kaiser Normalization.
a. Rotation converged in 5 iterations.
*Source: SPSS Output
Factor loadings over .40 have been taken for the analysis as shown in Table 9. The items that
cluster on the same components suggest that Component 1 represents Felt Intelligence (including
items Q-5, 2, 9, 1, 10 and 6) and Component 2 stands for Displayed Intelligence (with items Q-4,
7, 8 and 3).

ISSN: 2249-2496 Impact Factor: 7.081
388 International Journal of Research in Social Sciences
http://www.ijmra.us, Email: [email protected]
2. Reliability Analysis
The two extracted factors, viz., felt intelligence and displayed intelligence, are being assumed as
sub-scales of the EI instrument. Cronbach‟s alpha values have been calculated for each sub-scale
and finally for the entire EI scale as a whole.
Felt Intelligence (FI): It includes total six statements (variables) and Cronbach‟s alpha
value is .834 for this dimension. In social sciences, for Cronbach‟s alpha a minimum value of .7
is considered suitable, and the higher values demonstrate good reliability of the scale (Field,
2009, p. 675). So, the dimension of felt intelligence has the high reliability.
Displayed Intelligence (DI): It consists of remaining four statements (variables) and the
corresponding alpha value is .812, which again indicates good reliability of sub-scale.
Scale (overall): Cronbach‟s alpha value for all 10 statements in the EI scale is observed
as .857, which means that overall reliability of the entire instrument, taken as a whole, is quite
good.
3. New Dimensions of EI
On the basis of analyses carried out two dimensions of EI, namely, felt intelligence and
displayed intelligence have been identified. As per the EFA, the dimensions are defined as:
Management of emotions, feelings about other people, empathetic nature, self-motivation
and emotional awareness are collectively termed as felt intelligence.
The emotional aspects of an individual which can be seen and observed by other persons
and accordingly their adaptation by him or her are represented as displayed intelligence.
The combination of felt and displayed intelligence, jointly presents the status of an
employee on EI scale. Thus, the term „EI‟ refers to the understanding, awareness, management,
adaptation and regulation of emotions, on the part of an employee.
Conclusion
Concisely, both analyses, viz., EFA for validity and Cronbach‟s alpha for reliability revealed,
two underlying scales in the instrument tested. EFA was conducted on 10 items (statements) with
orthogonal rotation (varimax). KMO test confirmed the sampling adequacy (KMO=.828) with a
value being „great‟, according to Field (2009). Further, Bartlett‟s test of sphericity with χ2
value
of 319.604, p<.001, having degrees of freedom as 45, denoted that correlations between items
were sufficiently large for EFA. Two components (factors) had eigenvalues over 1 (as per the

ISSN: 2249-2496 Impact Factor: 7.081
389 International Journal of Research in Social Sciences
http://www.ijmra.us, Email: [email protected]
Kaiser‟s rule) and in combination explained 60.448 percent of the variance. Scree Plot absolutely
verified the extraction of two components (factors). It is also evident that two dimensions, felt
intelligence in 60 percent and displayed intelligence in 40 percent, proportionately contribute to
the assessment of EI.
In addition, these two dimensions (sub-scales), viz., felt intelligence and displayed intelligence,
keep the high reliabilities with the values of Cronbach‟s alpha as .834 and .812 respectively.
Moreover, the overall reliability (.857) of the entire instrument is also high.
Table 10: Summary of EFA results for EI instrument
Rotated Factor Loadings
Item Felt Intelligence Displayed Intelligence
Q-5 .834
Q-2 .810
Q-9 .779
Q-1 .747
Q-10 .741
Q-4 .847
Q-7 .821
Q-6 .732
Q-8 .794
Q-3 .757
Eigenvalues 3.830 2.215
% of Variance
(Before rotation)
38.297 22.151
% of Variance
(After rotation)
31.278 29.170
Alpha .834 .812
*Source: Author‟s own findings
Table 10, in a nutshell, shows the rotated factor loadings, eigenvalues, percentage of variance
(before and after rotation) and Cronbach‟s alpha values for the two extracted factors. Therefore,

ISSN: 2249-2496 Impact Factor: 7.081
390 International Journal of Research in Social Sciences
http://www.ijmra.us, Email: [email protected]
it is concluded that this instrument comprising 10 statements, does not require any addition or
removal of items. Finally, the new dimensions of EI and its corresponding measuring instrument
are proposed for practical adoption.
Limitations and Future Research Directions
Limitations, being the essential part of the studies in social sciences, also required to be stated.
First, debates rage on and questions continue to arise as to the meaning of the concept of EI, as
well as its definition. As noted by van Rooy and Viswesvaran (2004), the difficulty in providing
an operational definition of EI that is accepted by all has been largely due to the differing names
given to EI. Second, the respondents from different sectors of employment may also constitute
the studies in future. However, the dimensions of EI proposed here have their prospect for
adoption in other fields also. The assessment of EI will definitely help HRD practitioners in
discovering the training needs for the human resources of the concerned organizations, so that
their employees may become emotionally intelligent.
References
[1] Afolabi, A. O. 2004. Influence of five-factor personality attributes, need for achievement
and emotional intelligence on work team interaction processes in the Niger-Delta. Unpublished
Ph.D. Thesis, University of Ibadan, Nigeria.
[2] Akerjordet, K., & Severinsson, E. 2007. Emotional intelligence: A review of the literature
with specific focus on empirical and epistemological perspectives. Journal of Clinical Nursing,
Vol. 16, pp. 1405-1416.
[3] BarOn, R. 1997. EQ-i BarOn emotional quotient inventory technical manual. Toronto
(Canada): Multi Health Systems, pp. 38-43.
[4] Caner, J. D., & Salovey, P. 1997. What is emotional intelligence? In P. Salovey & D. J.
Sluyter (Eds.), Emotional development and emotional intelligence: Educational implications.
New York: Basic Books.
[5] Cherniss, C. (Ed.). 2000. Social and emotional competence in the workplace. San Francisco:
Jossey-Bass.
[6] Cherniss, C., & Goleman, D. (Eds.). 2001. Training for emotional intelligence. San
Francisco: Jossey-Bass.

ISSN: 2249-2496 Impact Factor: 7.081
391 International Journal of Research in Social Sciences
http://www.ijmra.us, Email: [email protected]
[7] Cherniss, C., Goleman, D., & Emmerling, R. 1998. Bringing emotional intelligence to the
workplace. Rutgers, NJ: Consortium for Research on Emotional Intelligence in Organizations.
[8] Dasborough, M. T., & Ashkanasy, N. M. 2002. Emotion and attribution of intentionality in
leader-member relationships. The Leadership Quarterly, Vol. 13, pp. 615-634.
[9] Dulewicz, V., & Higgs, M. 2000. Emotional intelligence: A review and evaluation study.
Journal of Managerial Psychology, Vol. 15, pp. 341-368.
[10] Fabian, J. C. 1999. Emotion work as instrumental action: The pursuit of goals in an
organizational context. Unpublished doctoral dissertation, George Washington University,
Washington, DC.
[11] Fambrough, M. J., & Hart, R. K. 2008. Emotions in leadership development: A critique of
emotional intelligence. Advances in Developing Human Resources, Vol. 10, pp. 740-758.
[12] Field, Andy. 2009. Discovering statistics using SPSS (3rd
Edition). California: Sage.
[13] Gardner, H. 1983. Frames of mind. New York: Basic Books.
[14] Goleman, D. 1995. Emotional intelligence: Why it can matter more than IQ. New York:
Bantam Books.
[15] Goleman, D., & Cherniss, G. 1998. Bringing emotional intelligence to the workplace.
Rutgers, NJ: Consortium for Research on Emotional Intelligence in Organizations.
[16] Mayer, J. D., & Salovey, P. 1995. Emotional intelligence and the construction and
regulation of feelings. Applied and Preventive Psychology, Vol. 4, No. 3, pp. 197-208.
[17] Mayer, J. D., Salovey, P., & Caruso, D. R. 2000. Emotional intelligence as zeitgeist, as
personality, and as a mental ability. In R. BarOn & J. Parker (Eds.), The handbook of emotional
intelligence (pp. 92-117). San Francisco: Jossey-Bass.
[18] Mayer, J.D., & Salovey, P. 1997. What is emotional intelligence? In Salovey, P. and
Sluyter, D.J. (Eds), Emotional Development and Emotional Intelligence (pp. 03-31). New York:
Basic Books.
[19] Petrides, K.V., & Furnham, A. 2006. The role of trait emotional intelligence in a gender-
specific model of organizational variables. Journal of Applied Social Psychology, Vol. 36, No. 2,
pp. 552-569.
[20] Prasad, L., Dubey, R., & Mahato, D. 2015. Relevance of emotional intelligence on
performance of sales professionals: An empirical study in Pune. PARIPEX - Indian Journal of
Research, Vol. 4, No. 6, pp. 310-313.

ISSN: 2249-2496 Impact Factor: 7.081
392 International Journal of Research in Social Sciences
http://www.ijmra.us, Email: [email protected]
[21] Puthanikar, L.S., & Shivakumara, K. 2016. Emotional intelligence of post graduate science
and social science students. International Journal of Scientific Research, Vol. 5, No. 3, pp. 205-
208.
[22] Salovey, P., & Caner, J. 1990. Emotional intelligence. Imagination, Cognition, and
Personality, Vol. 9, pp. 185-211.
[23] Schutte, N. S., Malouff, J. M., Hall, L. E., Haggerty, D. J., Cooper, J. T., Golden, C. J., &
Dornheim, L. 1998. Development and validation of a measure of emotional intelligence.
Personality and Individual Differences, Vol. 25, pp. 167-177.
[24] van Rooy, D. L., & Viswesvaran, C. 2004. Emotional intelligence: A meta-analytic
investigation of predictive validity and nomological net. Journal of Vocational Behavior, Vol.
65, pp. 71-95.
[25] www.google.co.in
[26] Zeidner, M., Matthews, G., & Roberts, R. D. 2004. Emotional intelligence in the
workplace: A critical review. Applied Psychology, Vol. 53, pp. 371-399.