Emittance Measurement: Quadrupole Scan C. Tennant USPAS – January 2011.
24
Emittance Measurement: Quadrupole Scan C. Tennant USPAS – January 2011
-
Upload
emmeline-alexander -
Category
Documents
-
view
215 -
download
2
Transcript of Emittance Measurement: Quadrupole Scan C. Tennant USPAS – January 2011.

Emittance Measurement:
Quadrupole ScanC. Tennant
USPAS – January 2011


Quadrupole Scan Formalism
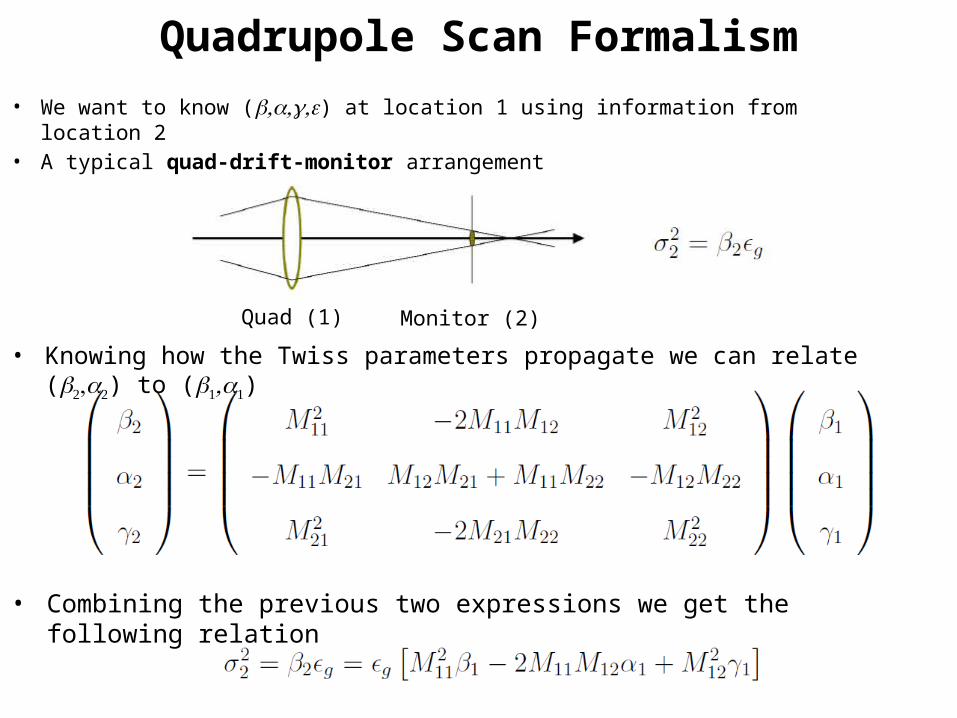
• We want to know ( , , ,b a g e) at location 1 using information from location 2• A typical quad-drift-monitor arrangement
• Knowing how the Twiss parameters propagate we can relate (b2,a2) to (b1,a1)
• Combining the previous two expressions we get the following relation
Monitor (2)Quad (1)

Quadrupole Scan Formalism – Thin Lens
• For a thin lens quadrupole and drift, the transfer matrix is given by
• The beam size (squared) at the “monitor” is then expressed as
• The beam size (squared) at the “monitor” is then expressed as

Simulated Quadrupole Scan
D = +2500 G
(m-2)
RM
S b
eam
siz
e

Simulated Quadrupole Scan
D= +2000 G
(m-2)
RM
S b
eam
siz
e

Simulated Quadrupole Scan
D = +1500 G
(m-2)
bx = 21.90 m
ax = 11.87ex = 7.73 mm-mrad
RM
S b
eam
siz
e

Simulated Quadrupole Scan
D= +1000 G
(m-2)
bx = 18.95 m
ax = 10.25ex = 8.96 mm-mrad
RM
S b
eam
siz
e

Simulated Quadrupole Scan
D = +500 G
(m-2)
bx = 18.38 m
ax = 9.93ex = 9.24 mm-mrad
RM
S b
eam
siz
e

Simulated Quadrupole Scan
D = 0 G
(m-2)
bx = 18.22 m
ax = 9.85ex = 9.32 mm-mrad
RM
S b
eam
siz
e

Simulated Quadrupole Scan
D = -500 G
(m-2)
bx = 18.17 m
ax = 9.82ex = 9.35 mm-mrad
RM
S b
eam
siz
e

Simulated Quadrupole Scan
D = -1000 G
(m-2)
bx = 18.15 m
ax = 9.81ex = 9.36 mm-mrad
RM
S b
eam
siz
e

Simulated Quadrupole Scan
D = -1500 G
(m-2)
bx = 18.15 m
ax = 9.81ex = 9.36 mm-mrad
RM
S b
eam
siz
e

Simulated Quadrupole Scan
D = -2000 G
(m-2)
bx = 18.15 m
ax = 9.81ex = 9.36 mm-mrad
RM
S b
eam
siz
e

Simulated Quadrupole Scan
D = -2500 G
(m-2)
bx = 18.15 m
ax = 9.81ex = 9.36 mm-mrad
RM
S b
eam
siz
e

(courtesy P. Evtushenko)

3500 G 4500 G2500 G 5500 G1500 G
5 m
m
5 mm
Transverse Phase Space Tomography
monitor
obse
rvati
on
poin
t 3F region setup as six 90o matched FODO periods
Scan quad from 1500 G to 5500 G and observe beam at downstream viewer
This generates an effective rotation of 157˚ of the horizontal phase space

Real vs Simulated Data

Measurement in 2F Region• 2F region
2F
2F03 2F04 2F05 2F06
monit
or
obse
rvati
on poin
t
• Compare with multislit and multi-monitor emittance measurement

Transverse Emittance in the FEL
Location in FEL
Norm
aliz
ed
Em
itta
nce
(m
m-m
rad)
2F 6F 8F 5F
PRELIMINARY

Quadrupole Centering
1. Zero BPMs2. Add focusing3. Observe change in BPM4. Steer in the direction of offset5. Return quad to nominal strength6. Iterate Steps (1-5)
BPM

Data Analysis
• Quad Scans possible in 2F– Check quad centering– Be careful about image saturation
• Measure beam size two different ways:– Manually place cursors to make edge-to-edge measurement
(RMS ~ edge-to-edge/6)– use Auto ROI to get RMS value as a function of Cut Level
• how does it affect the emittance measurement?• Compare data to multi-slit and multi-monitor
emittance measurements? Do emittances evolve as you expect?