eminiWorld TREC on TradeStation Strategy Network
14
-
Upload
sauliusg -
Category
Economy & Finance
-
view
726 -
download
1
Transcript of eminiWorld TREC on TradeStation Strategy Network

This eminiWorld TREC presentation is intended only for professional traders and Portfolio Managers with the interest
in 100% quantitative and systematic trading model.
2
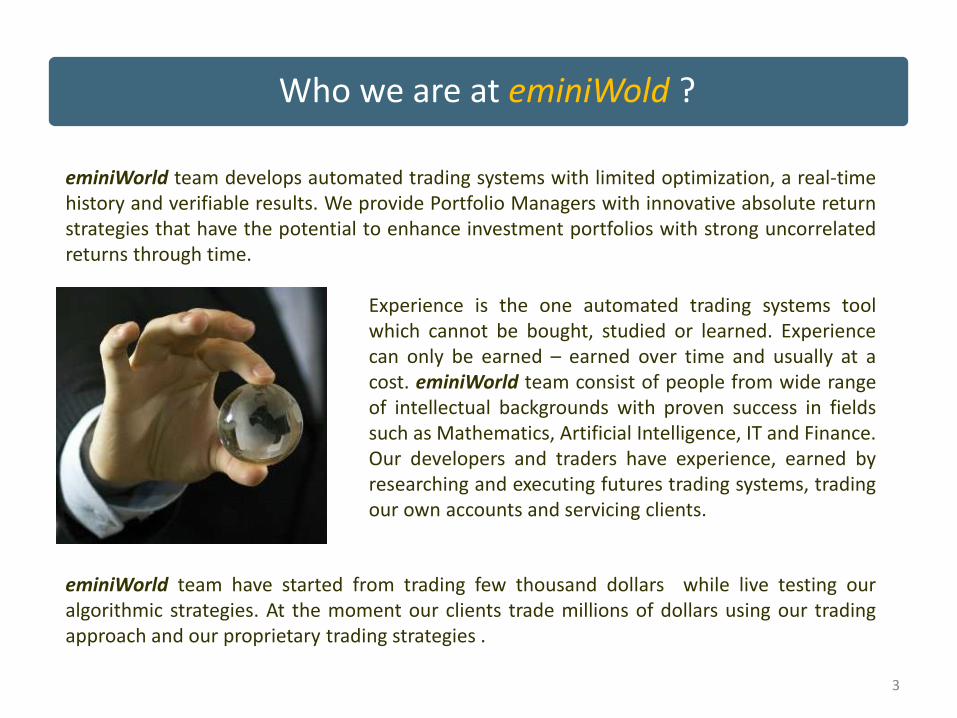
eminiWorld team develops automated trading systems with limited optimization, a real-timehistory and verifiable results. We provide Portfolio Managers with innovative absolute returnstrategies that have the potential to enhance investment portfolios with strong uncorrelatedreturns through time.
Who we are at eminiWold ?
Experience is the one automated trading systems toolwhich cannot be bought, studied or learned. Experiencecan only be earned – earned over time and usually at acost. eminiWorld team consist of people from wide rangeof intellectual backgrounds with proven success in fieldssuch as Mathematics, Artificial Intelligence, IT and Finance.Our developers and traders have experience, earned byresearching and executing futures trading systems, tradingour own accounts and servicing clients.
eminiWorld team have started from trading few thousand dollars while live testing ouralgorithmic strategies. At the moment our clients trade millions of dollars using our tradingapproach and our proprietary trading strategies .
3

Our core trading philosophy is that strategies should capture enduring and explainable marketparticipant behavior. We strongly believe in diversifying risk in every way possible.
We also think that risk is best controlled by taking a large number of small trades versusmaking a few large bets on a small number of trades.
At eminiWold we believe in:
We have constructed model development processon five key pillars:
• Markets are fundamentally inefficient acrossmultiple timeframes.
• Global liquidity drives market behavior acrossasset classes.
• We believe systems outperform discretion.
• Models must be simple and repeatable.
• Models must be grounded in experience.
4
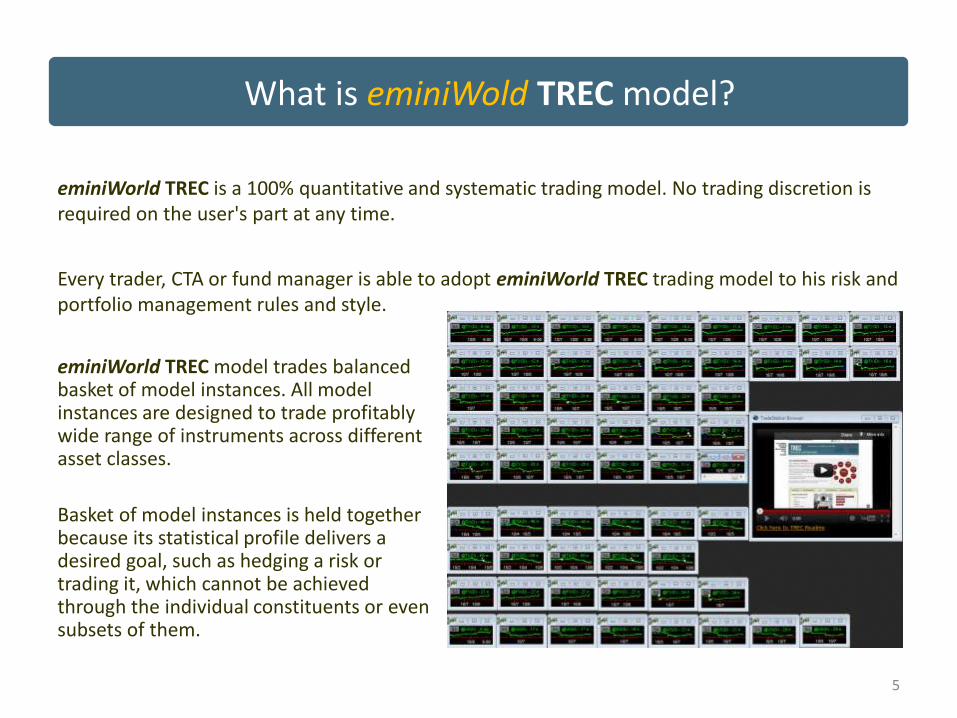
eminiWorld TREC is a 100% quantitative and systematic trading model. No trading discretion is required on the user's part at any time.
Every trader, CTA or fund manager is able to adopt eminiWorld TREC trading model to his risk and portfolio management rules and style.
What is eminiWold TREC model?
eminiWorld TREC model trades balanced basket of model instances. All model instances are designed to trade profitably wide range of instruments across different asset classes.
Basket of model instances is held together because its statistical profile delivers a desired goal, such as hedging a risk or trading it, which cannot be achieved through the individual constituents or even subsets of them.
5
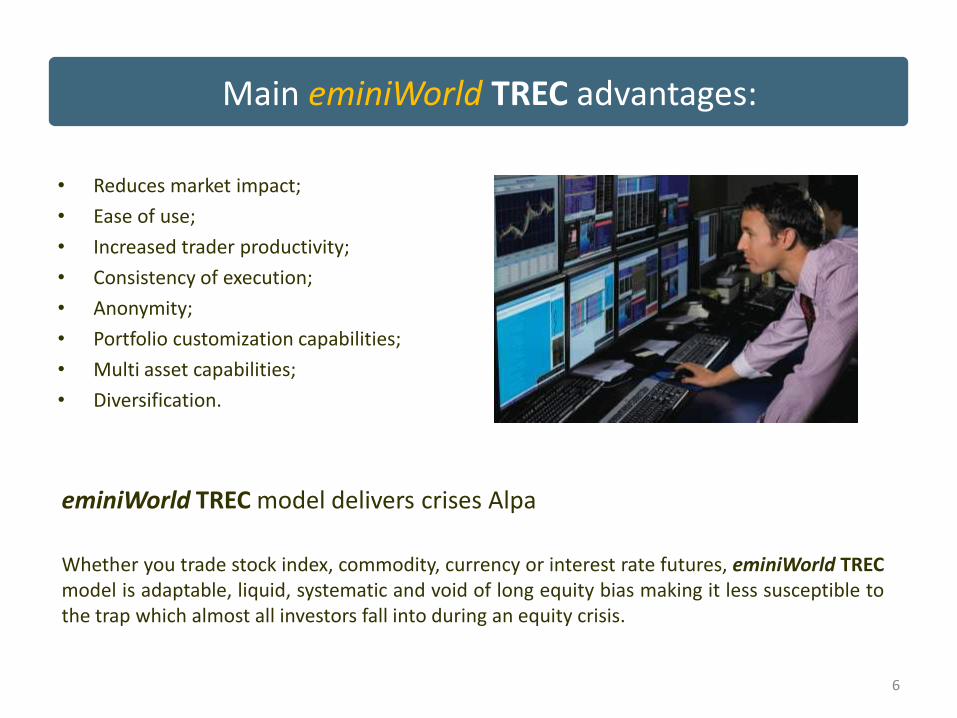
• Reduces market impact;
• Ease of use;
• Increased trader productivity;
• Consistency of execution;
• Anonymity;
• Portfolio customization capabilities;
• Multi asset capabilities;
• Diversification.
Main eminiWorld TREC advantages:
eminiWorld TREC model delivers crises Alpa
Whether you trade stock index, commodity, currency or interest rate futures, eminiWorld TRECmodel is adaptable, liquid, systematic and void of long equity bias making it less susceptible tothe trap which almost all investors fall into during an equity crisis.
6
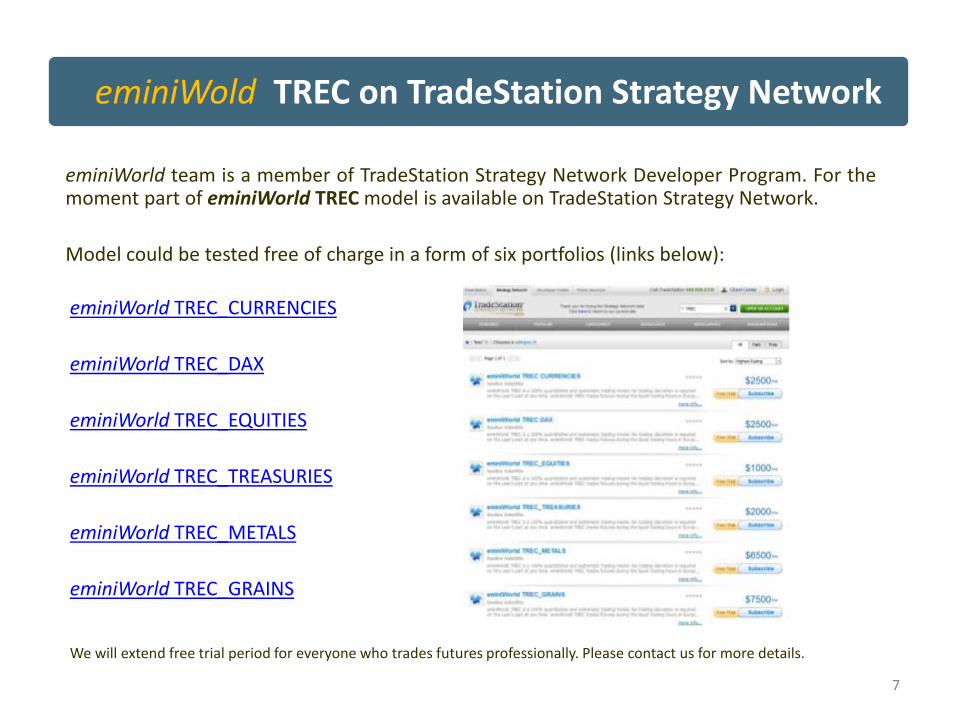
eminiWorld team is a member of TradeStation Strategy Network Developer Program. For themoment part of eminiWorld TREC model is available on TradeStation Strategy Network.
Model could be tested free of charge in a form of six portfolios (links below):
eminiWold TREC on TradeStation Strategy Network
eminiWorld TREC_CURRENCIES
eminiWorld TREC_DAX
eminiWorld TREC_EQUITIES
eminiWorld TREC_TREASURIES
eminiWorld TREC_METALS
eminiWorld TREC_GRAINS
We will extend free trial period for everyone who trades futures professionally. Please contact us for more details.
7

eminiWorld TREC is a 100% quantitative and systematic trading model. No trading discretion is required onthe user's part at any time. eminiWorld TREC trades futures during the liquid trading hours in Europe and theUSA.
The model trades Gold, Silver, Copper, Platinum, German DAX, Mini Russell 2000, Mini Dow Jones, 30-YRT-BOND, 10-YR T-NOTE, 5-YR T-NOTE, 2-YR T-NOTE, Corn, Soybeans, Euro Currency, British Pound andAustralian Dollar.
The strategy is a short to mid-term trend following strategy that has been designed to capture relativelysmall futures price moves using few rules based signal-generating logic. Every position is opened throughmarket order and is closed through three stop orders (fixed stop loss, time stop, trailing stop) or limit order(Profit Target).
Model's average trading frequency: circa 80 times per day per all instruments traded. The strategy is alwaysthe same and applied on charts that are plotted in intraday (3 min, 5 min, 9 min, 11 min, etc) format.However each chart has its unique set of inputs for the same strategy. This multi asset, multi-time frame andmulti-input sets approach ensures significantly more stable performance, reduced risk and low or negativecorrelation between instruments traded.
In addition to low correlation between instruments traded, the model displays a low or negative correlationwith both traditional (portfolios of stocks and bonds) and alternative investments (hedge and CTA funds).
eminiWold TREC description
8

We believe that risk is best controlled by taking a large number of small trades versus making afew large bets on a small number of trades. For all serious traders we insistently recommendtrading all eminiWorld TREC portfolios simultaneously. Accumulated performance of sixeminiWorld TREC portfolios available on TradeStation Strategy Network presented below.
eminiWold TREC_6 PORTFOLIOS Performance
9
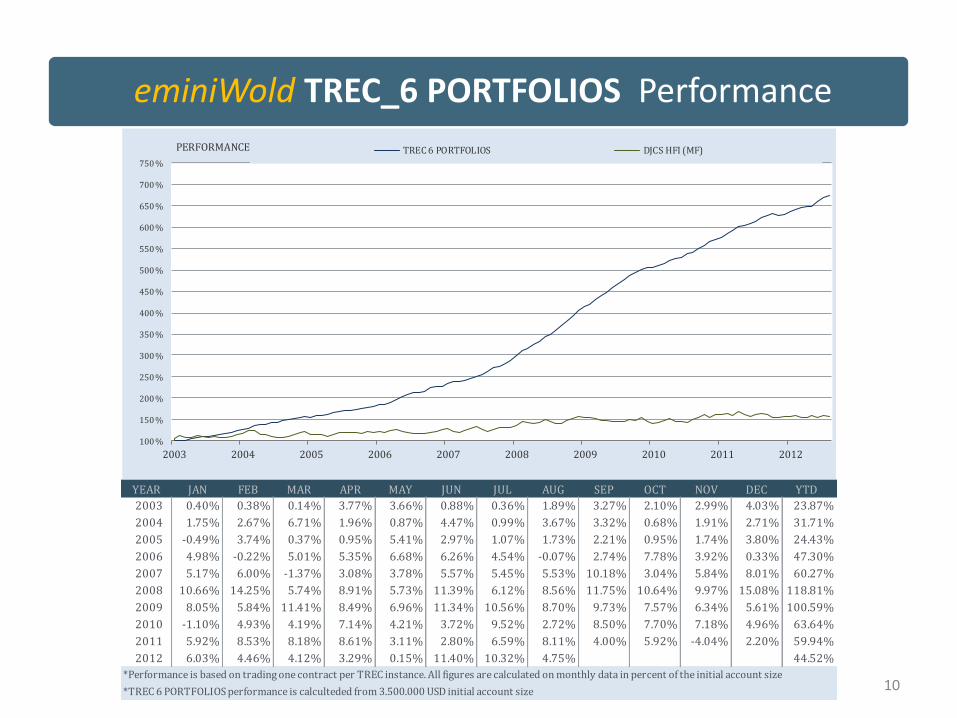
eminiWold TREC_6 PORTFOLIOS Performance
YEAR JAN FEB MAR APR MAY JUN JUL AUG SEP OCT NOV DEC YTD
2003 0.40% 0.38% 0.14% 3.77% 3.66% 0.88% 0.36% 1.89% 3.27% 2.10% 2.99% 4.03% 23.87%
2004 1.75% 2.67% 6.71% 1.96% 0.87% 4.47% 0.99% 3.67% 3.32% 0.68% 1.91% 2.71% 31.71%
2005 -0.49% 3.74% 0.37% 0.95% 5.41% 2.97% 1.07% 1.73% 2.21% 0.95% 1.74% 3.80% 24.43%
2006 4.98% -0.22% 5.01% 5.35% 6.68% 6.26% 4.54% -0.07% 2.74% 7.78% 3.92% 0.33% 47.30%
2007 5.17% 6.00% -1.37% 3.08% 3.78% 5.57% 5.45% 5.53% 10.18% 3.04% 5.84% 8.01% 60.27%
2008 10.66% 14.25% 5.74% 8.91% 5.73% 11.39% 6.12% 8.56% 11.75% 10.64% 9.97% 15.08% 118.81%
2009 8.05% 5.84% 11.41% 8.49% 6.96% 11.34% 10.56% 8.70% 9.73% 7.57% 6.34% 5.61% 100.59%
2010 -1.10% 4.93% 4.19% 7.14% 4.21% 3.72% 9.52% 2.72% 8.50% 7.70% 7.18% 4.96% 63.64%
2011 5.92% 8.53% 8.18% 8.61% 3.11% 2.80% 6.59% 8.11% 4.00% 5.92% -4.04% 2.20% 59.94%
2012 6.03% 4.46% 4.12% 3.29% 0.15% 11.40% 10.32% 4.75% 44.52%
*TREC 6 PORTFOLIOS performance is calculteded from 3.500.000 USD initial account size
*Performance is based on trading one contract per TREC instance. All figures are calculated on monthly data in percent of the initial account size
100%
150 %
200 %
250 %
300%
350%
400%
450 %
500 %
550%
600%
650%
700 %
750 %
2003 2004 2005 2006 2007 2008 2009 2010 2011 2012
PERFORMANCE TREC 6 PORTFOLIOS DJCS HFI (MF)
10

eminiWold TREC_6 PORTFOLIOS Performance
Profit / Year 59.7% Best Month 15.1%
Monthly Volatility 3.6% Worst Month -4.0%
Sharpe Ratio Ann. 4.56 Avg. Month 5.0%
Net Profit 575.1% Best 12 M. 118.8%
YTD 44.5% Best 24 M. 221.8%
Last 12 M. 52.6% Worst 12 M. 23.2%
Last 24 M. 132.8% Worst 24 M. 54.7%
Last 36 M. 197.4%
Last 60 M. 414.6% Max. DDn -4.0%
PORTFOLIO ANALYSIS DISTRIBUTION OF MONTHLY RETURNS
Treynor Ratio* Tracking Error* Information Ratio*
0.43 0.05 0.85
* Benchmark = Dow Jones Credit Suisse Hedge Funds Index (Managed Futures)
Skewness Kurtosis Excess Kurtosis
0.35 2.98 -0.10
Disc la ime r: No representation or warranty as to the accuracy of the information contained in this performance update is made or is to be implied. This
update is for information purposes only, and does not constitute an offering. These materials are not, and under no circumstances are they to be construed
as, a prospectus, advertisement or public offering. Hypothetical performance results - as some of the system results shown on this page - have several
inherent limitations. There is no guarantee that any account will or is likely to achieve profits or losses similar to those shown at this page. There are frequently
differences between hypothetical results and the results achieved by real trading. The shown trading results or performances in the past are no guarantee for
profits in the future. The risk of loss in trading forex and futures can be substantial. You should therefore carefully consider whether such trading is suitable for
you in light of your financial condition.
Account Size: 3.500.000 USD
All figures are calculated on monthly data in percent of the initial account size
AUSTRALIAN DLR.
BRITISH POUND
EURO CURRENCY
GOLD (COMEX)
COPPER (COMEX)
PLATINUM (NYMEX)
SILVER (COMEX)DAX
MINI RUSSELL 2000 (ICE)
MINI DOW JONES ($5)
CORN (CBOT)
SOYBEANS (CBOT)
5-YR T-NOTE
2-YR T-NOTE
10-YR T-NOTE
30-YR T-BOND
0
5
10
15
20
25
30
-6% -4% -2% 0% 2% 4% 6% 8% 10% 12% 14% 16% 18% 20% 22%
11

Initial margin required to trade eminiWold TREC_6 PORTFOLIOS
ASSET CLASS SYMPOL ROOT DESCRIPTION NO OF INSTANCES INITIAL MARGIN/CONTRACT TOTAL INITIAL MARGIN
CURRENCIES @AD AUSTRALIAN DLR. 4 $3,375 $13,500
CURRENCIES @BP BRITISH POUND 3 $2,025 $6,075
CURRENCIES @EC EURO CURRENCY 41 $4,725 $193,725
METALS @GC GOLD (COMEX) 28 $9,113 $255,164
METALS @HG COPPER (COMEX) 20 $5,400 $108,000
METALS @PL PLATINUM (NYMEX) 5 $3,850 $19,250
METALS @SI SILVER (COMEX) 14 $18,900 $264,600
EQUITIES @DAX DAX 28 € 12,440 € 348,320
EQUITIES @TF MINI RUSSELL 2000 (ICE) 8 $6,600 $52,800
EQUITIES @YM MINI DOW JONES ($5) 36 $3,125 $112,500
GRAINS @C CORN (CBOT) 34 $2,363 $80,342
GRAINS @S SOYBEANS (CBOT) 28 $5,063 $141,764
INTEREST RATES @FV 5-YR T-NOTE 6 $878 $5,268
INTEREST RATES @TU 2-YR T-NOTE 11 $371 $4,081
INTEREST RATES @TY 10-YR T-NOTE 36 $1,485 $53,460
INTEREST RATES @US 30-YR T-BOND 8 $3,780 $30,240
310 $1,778,691
eminiWold TREC_6 PORTFOLIOS Correlation MatrixAD BP EC C S TF YM FDAX GC HG PL SI FV TU TY US ALL TREC
AD 1.0000 (0.0098) 0.1631 0.0368 0.0479 0.0956 0.1435 0.0821 0.0825 0.0742 0.0769 0.1010 0.0827 0.0354 0.0633 0.0411 0.2332
BP (0.0098) 1.0000 0.1303 0.0186 (0.0335) 0.0102 (0.0061) 0.0179 0.0286 0.0410 (0.0205) (0.0234) 0.0540 0.0369 0.0590 0.0668 0.0802
EC 0.1631 0.1303 1.0000 (0.0138) 0.0139 0.0289 0.0320 0.0345 0.1280 0.0672 0.0509 0.0583 0.0980 0.0552 0.1011 0.0838 0.3519
C 0.0368 0.0186 (0.0138) 1.0000 0.2893 0.0315 0.0733 0.0412 0.0511 0.0048 0.0311 0.0410 0.0015 (0.0279) (0.0315) (0.0372) 0.3103
S 0.0479 (0.0335) 0.0139 0.2893 1.0000 0.0655 0.0989 0.0465 0.0617 0.0246 0.1340 0.0630 0.0090 (0.0405) (0.0545) (0.0481) 0.4905
TF 0.0956 0.0102 0.0289 0.0315 0.0655 1.0000 0.4399 0.1737 0.0266 0.0666 0.0380 0.0225 (0.0031) (0.0292) (0.0140) (0.0168) 0.2551
YM 0.1435 (0.0061) 0.0320 0.0733 0.0989 0.4399 1.0000 0.2772 0.0505 0.0612 0.0552 0.0871 (0.0224) (0.0736) (0.0395) (0.0507) 0.3790
FDAX 0.0821 0.0179 0.0345 0.0412 0.0465 0.1737 0.2772 1.0000 0.0089 0.1440 0.0582 0.0300 (0.0389) (0.0522) (0.0579) (0.0342) 0.4717
GC 0.0825 0.0286 0.1280 0.0511 0.0617 0.0266 0.0505 0.0089 1.0000 0.0693 0.1716 0.4014 0.0587 0.0141 0.0720 0.0597 0.4373
HG 0.0742 0.0410 0.0672 0.0048 0.0246 0.0666 0.0612 0.1440 0.0693 1.0000 0.0418 0.0592 0.0429 0.0380 0.0306 0.0449 0.3238
PL 0.0769 (0.0205) 0.0509 0.0311 0.1340 0.0380 0.0552 0.0582 0.1716 0.0418 1.0000 0.2004 (0.0152) (0.0406) (0.0358) (0.0455) 0.2612
SI 0.1010 (0.0234) 0.0583 0.0410 0.0630 0.0225 0.0871 0.0300 0.4014 0.0592 0.2004 1.0000 0.0290 0.0160 0.0224 0.0080 0.4456
FV 0.0827 0.0540 0.0980 0.0015 0.0090 (0.0031) (0.0224) (0.0389) 0.0587 0.0429 (0.0152) 0.0290 1.0000 0.4317 0.6779 0.5131 0.3094
TU 0.0354 0.0369 0.0552 (0.0279) (0.0405) (0.0292) (0.0736) (0.0522) 0.0141 0.0380 (0.0406) 0.0160 0.4317 1.0000 0.5315 0.3953 0.2190
TY 0.0633 0.0590 0.1011 (0.0315) (0.0545) (0.0140) (0.0395) (0.0579) 0.0720 0.0306 (0.0358) 0.0224 0.6779 0.5315 1.0000 0.7525 0.3681
US 0.0411 0.0668 0.0838 (0.0372) (0.0481) (0.0168) (0.0507) (0.0342) 0.0597 0.0449 (0.0455) 0.0080 0.5131 0.3953 0.7525 1.0000 0.3144
ALL TREC 0.2332 0.0802 0.3519 0.3103 0.4905 0.2551 0.3790 0.4717 0.4373 0.3238 0.2612 0.4456 0.3094 0.2190 0.3681 0.3144 1.0000
12

eminiWold TREC on TradeStation Strategy Network
There are few basic steps before we recommendstarting trading any eminiworld TREC portfoliowith your live account.
Please contact us after you will start your freetrial. We will arrange a conference call to extendyour free trial.
We assist/consult our potential customers insetting up LIVE SIMULATION to experience andget to know eminiWorld TREC better.
We expect a decision to be made by the end ofextended free trial. If customer agrees to tradeeminiWorld TREC with his live account we willsign an agreement.
It is in our interest to help every customer tomake money on the market as we arecompensated on a performance basis of ouralgorithmic model.
13

Contact Us
For more information and free trial extension please contact us:
Saulius Galatiltis
Tel: +370 698 80738
email: [email protected]
WORKING HOURS:
7:00 a.m. – 5:00 p.m.
(UTC) London, Dublin, Lisbon
We also recommend visiting our website www.eminiworld.com
Our live trading results are available upon request.
14