Emerging economy resilience and vulnerability to adverse ...
118
Emerging economy resilience and vulnerability to adverse exogenous economic shocks: The case of sub-Saharan Africa Xolile Msutwana 10669303 A research project submitted to the Gordon Institute of Business Science, University of Pretoria, in partial fulfilment of the requirements for the degree of Master of Business Administration. 11 November 2013 © 2014 University of Pretoria. All rights reserved. The copyright in this work vests in the University of Pretoria.
Transcript of Emerging economy resilience and vulnerability to adverse ...

Emerging economy resilience and vulnerability to adverse exogenous
economic shocks: The case of sub-Saharan Africa
Xolile Msutwana
10669303
A research project submitted to the Gordon Institute of Business Science,
University of Pretoria, in partial fulfilment of the requirements for the degree of
Master of Business Administration.
11 November 2013
© 2014 University of Pretoria. All rights reserved. The copyright in this work vests in the University of Pretoria.

i
Abstract
The impact of the recent global financial crisis on the global economy has highlighted the
level of integration of economies and the potential spillover effects as a result thereof. The
implications are that the negative effects of the crisis can quickly spread to other
economies through numerous transmission mechanisms. The response of developing or
emerging economies to these unpredictable exogenous shocks becomes a topical issue.
The concepts of economic vulnerability to and resilience against adverse exogenous
shocks for emerging economies have since taken centre stage in many economic forums.
Policy makers for emerging economies have come to the realisation that the increased
economic vulnerability and a lack of economic resilience in their economies can erode the
hard-fought-for gains in economic growth over the past decade and potentially harm their
prospects as attractive destinations for foreign direct investment (FDI).
This research analysed the resilience and vulnerability of emerging economies against
adverse shocks using the sub-Saharan African (SSA) region as a case. The research used
previous literature on emerging economies’ vulnerability and resilience to formulate four
hypotheses around the major overarching themes of vulnerability and resilience. Two
hypotheses looked at two functions of vulnerability, i.e. trade openness and financial
integration, and two functions of resilience, i.e. international reserves accumulation and
economic concentration.
The findings of this research study were that SSA economies were vulnerable and not
resilient against adverse exogenous shocks, and that few economies in the SSA region
were prepared to successfully manoeuvre in an economic crisis. The structure of these
economies inherently rendered these economies vulnerable. However, these economic
structures also allowed the SSA region to achieve the high economic growth experienced
during the past decade. The output of the methodology utilised in this research study
resulted in a model that can be used to reduce the likelihood of an SSA economy being
severely affected by an adverse economic shock.
Keywords: vulnerability, resilience, emerging economies, foreign direct investment, sub-
Saharan Africa
© 2014 University of Pretoria. All rights reserved. The copyright in this work vests in the University of Pretoria.

ii
Declaration
I declare that this research project is my own work. It is submitted in partial fulfilment of the
requirements for the degree of Master of Business Administration at the Gordon Institute of
Business Science, University of Pretoria. It has not been submitted before for any degree
or examination in any other University. I further declare that I have obtained the necessary
authorisation and consent to carry out this research.
Xolile Msutwana
11/11/2013
Date
© 2014 University of Pretoria. All rights reserved. The copyright in this work vests in the University of Pretoria.

iii
Acknowledgements
I would like to thank the following people for their support and encouragement throughout
the research process and the MBA journey.
First and foremost, I would like to send my heartfelt thank you to Zanele – my best friend,
confidante, biggest cheerleader and future wife. At times, you felt as though you were
doing the MBA with me which just goes to show how involved you were throughout my
entire MBA journey, I look forward to spending more time (yes, more Saturdays as well)
with you.
To my mother, Nomaxaba Msutwana, you have always been my pillar of strength and your
constant encouragement kept me going. I could not have asked for a better parent and
your ability to guide me to the right choices still amazes me. Thank you for instilling in me
the perseverance and ambition to succeed.
To Lind Sing, my supervisor, thank you for your patience in helping me to develop this idea
from the first meeting and for your constructive and acute feedback throughout the
research process. It has been an absolute pleasure working with you.
Jeannie van den Heever, my editor, thank you for your professional assistance in putting
together the research report. Your contribution has been invaluable.
To my brother, Mxolisi, with whom I embarked on this MBA journey, it has been an
unbelievable experience and a culmination of an extraordinary journey together. And to my
sister, Thando, thank you for your constant encouragement.
Finally, to my family (and Zukiswa) and friends, thank you for your understanding and I
look forward to spending more time with you.
Xolile
© 2014 University of Pretoria. All rights reserved. The copyright in this work vests in the University of Pretoria.

iv
Table of Contents
Abstract ........................................................................................................................... i
Declaration ..................................................................................................................... ii
Acknowledgements ....................................................................................................... iii
CHAPTER 1 Introduction to research problem ........................................................... 1
1.1 Introduction ............................................................................................................... 3
1.2 Purpose of the research ........................................................................................... 3
1.3 Problem definition ..................................................................................................... 4
1.3.1 Impact on foreign direct investment ........................................................................... 5
1.3.2 Emerging economy vulnerability and resilience ......................................................... 6
1.4 Context ..................................................................................................................... 7
1.4.1 Resilient dynamism .................................................................................................... 7
1.4.2 Exploring economic resilience.................................................................................... 8
1.5 Conclusion ................................................................................................................ 8
CHAPTER 2 Literature review ..................................................................................... 10
2.1 Introduction ............................................................................................................. 10
2.2 The concepts of vulnerability and resilience ............................................................ 10
2.3 Vulnerability theory ................................................................................................. 11
2.3.1 Economic vulnerability ............................................................................................. 15
2.4 Resilience theory .................................................................................................... 15
2.5 Vulnerability and resilience measurement framework ............................................. 17
2.6 Emerging economies theory ................................................................................... 18
2.6.1 Financial integration ................................................................................................. 19
2.6.2 Amplification effects of exogenous shocks ............................................................... 20
2.6.3 Reactions to shocks in emerging economies ........................................................... 21
© 2014 University of Pretoria. All rights reserved. The copyright in this work vests in the University of Pretoria.

v
2.6.4 Emerging economies and foreign direct investment (FDI) ........................................ 22
2.6.5 Economic diversification .......................................................................................... 24
2.7 Summary of literature review .................................................................................. 25
CHAPTER 3 Research hypotheses ............................................................................ 27
3.1 Introduction ............................................................................................................. 27
3.2 Hypotheses ............................................................................................................ 27
3.2.1 Hypothesis 1 Accumulation of international reserves ............................................... 27
3.2.2 Hypothesis 2 Economic concentration ..................................................................... 28
3.2.3 Hypothesis 3 Trade openness ................................................................................. 28
3.2.4 Hypothesis 4 Financial integration ........................................................................... 29
Chapter 4 Research methodology ............................................................................. 30
4.1 Introduction ............................................................................................................. 30
4.2 Research design..................................................................................................... 31
4.2.1 Population................................................................................................................ 31
4.2.2 Unit of analysis ........................................................................................................ 31
4.2.3 Sampling ................................................................................................................. 32
4.2.4 Data gathering process ............................................................................................ 33
4.3 Research instrument .............................................................................................. 34
4.3.1 Accumulation of reserves ......................................................................................... 35
4.3.2 Economic concentration ........................................................................................... 35
4.3.3 Trade openness ....................................................................................................... 36
4.3.4 Financial integration ................................................................................................. 37
4.4 Validity and reliability .............................................................................................. 37
4.5 Data analysis approach .......................................................................................... 38
4.5.1 Regression analysis ................................................................................................. 38
4.5.2 Multiple correlation analysis ..................................................................................... 39
© 2014 University of Pretoria. All rights reserved. The copyright in this work vests in the University of Pretoria.

vi
4.5.3 Multicollinearity ........................................................................................................ 39
4.6 Research limitations ............................................................................................... 40
Chapter 5 Results ........................................................................................................ 41
5.1 Introduction ............................................................................................................. 41
5.2 Descriptive statistics: The sub-Saharan African (SSA) region ................................. 42
5.2.1 GDP growth ............................................................................................................. 42
5.2.2 Trade openness ....................................................................................................... 44
5.2.3 Reserves accumulation ............................................................................................ 45
5.2.4 Financial integration ................................................................................................. 46
5.2.5 Concentration ratio .................................................................................................. 48
5.3 Statistical significance of the resilience and vulnerability model .............................. 49
5.4 Hypothesis testing .................................................................................................. 54
5.4.1 Hypothesis 1 ............................................................................................................ 54
5.4.2 Hypothesis 2 ............................................................................................................ 55
5.4.3 Hypothesis 3 ............................................................................................................ 57
5.4.4 Hypothesis 4 ............................................................................................................ 58
5.5 Multicollinearity results............................................................................................ 59
5.6 Summary of hypotheses results .............................................................................. 61
CHAPTER 6 Discussion of results ............................................................................. 62
6.1 ................................................................................................................................ 62
Introduction .................................................................................................................. 62
6.2 Hypothesis 1 discussion: Accumulation of international reserves ........................... 62
6.2.1 Evaluation of economic performance ....................................................................... 63
6.2.2 Summary of hypothesis findings .............................................................................. 65
6.3 Hypothesis 2 discussion: Economic concentration .................................................. 66
6.3.1 Evaluation of economic performance ....................................................................... 67
© 2014 University of Pretoria. All rights reserved. The copyright in this work vests in the University of Pretoria.

vii
6.3.2 Summary of hypothesis findings .............................................................................. 69
6.4 Hypothesis 3 Discussion: Trade openness ............................................................. 70
6.4.1 Evaluation of economic performance ....................................................................... 71
6.4.2 Summary of hypothesis findings .............................................................................. 75
6.5 Hypothesis 4 Discussion: Financial integration ....................................................... 76
6.5.1 Evaluation of economic performance ....................................................................... 77
6.5.2 Summary of hypothesis findings .............................................................................. 81
6.6 Summary of results ................................................................................................. 82
CHAPTER 7 Conclusion .............................................................................................. 84
7.1 Summary of main findings ...................................................................................... 84
7.2 Research recommendations ................................................................................... 86
7.3 Research limitations ............................................................................................... 88
7.4 Recommendations for future research .................................................................... 89
7.5 Conclusion .............................................................................................................. 89
Reference list ............................................................................................................... 91
Appendix A: Detailed country figures for FDI-to-GDP ratio ......................................... 101
Appendix B: Detailed results for Hypothesis 1 ............................................................ 102
Appendix C: Detailed results for Hypothesis 2 ............................................................ 103
Appendix D: Detailed results for Hypothesis 3 ............................................................ 104
Appendix E: Detailed Results for Hypothesis 4 ........................................................... 105
Appendix F: Detailed Results of Multi- Collinearity ..................................................... 106
Appendix G: Detailed Results of Standardised Coefficients ........................................ 110
© 2014 University of Pretoria. All rights reserved. The copyright in this work vests in the University of Pretoria.
1
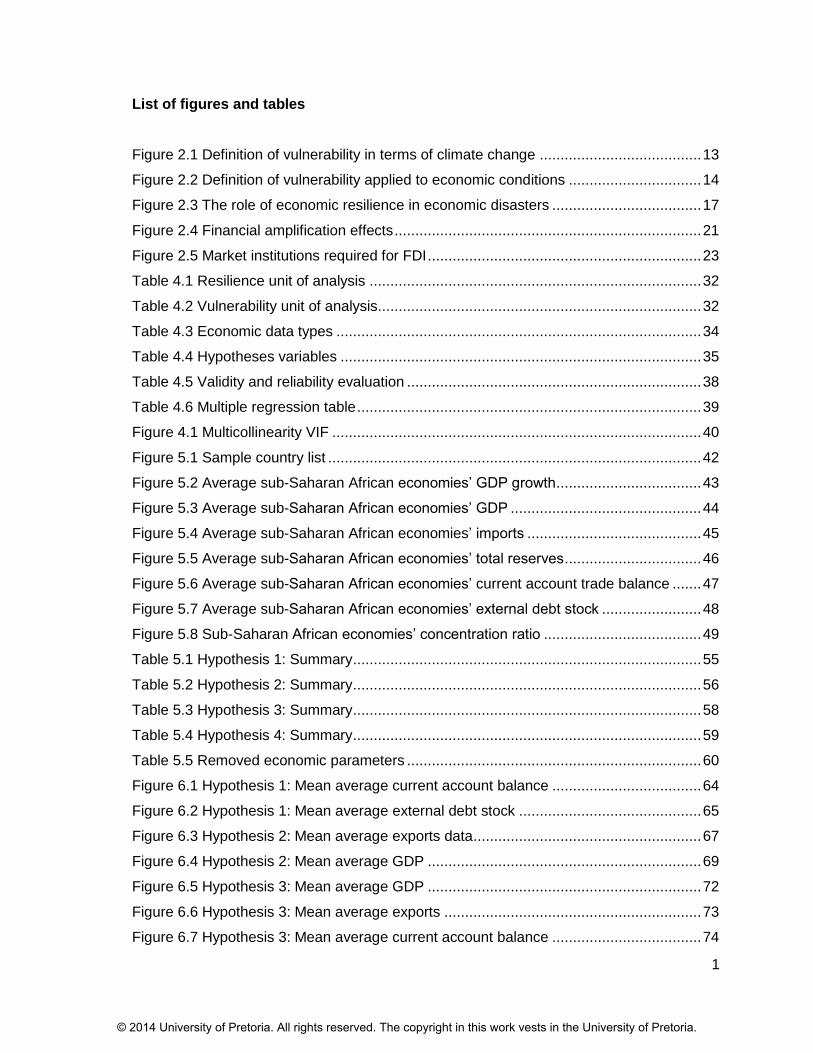
List of figures and tables
Figure 2.1 Definition of vulnerability in terms of climate change ....................................... 13
Figure 2.2 Definition of vulnerability applied to economic conditions ................................ 14
Figure 2.3 The role of economic resilience in economic disasters .................................... 17
Figure 2.4 Financial amplification effects .......................................................................... 21
Figure 2.5 Market institutions required for FDI .................................................................. 23
Table 4.1 Resilience unit of analysis ................................................................................ 32
Table 4.2 Vulnerability unit of analysis.............................................................................. 32
Table 4.3 Economic data types ........................................................................................ 34
Table 4.4 Hypotheses variables ....................................................................................... 35
Table 4.5 Validity and reliability evaluation ....................................................................... 38
Table 4.6 Multiple regression table ................................................................................... 39
Figure 4.1 Multicollinearity VIF ......................................................................................... 40
Figure 5.1 Sample country list .......................................................................................... 42
Figure 5.2 Average sub-Saharan African economies’ GDP growth ................................... 43
Figure 5.3 Average sub-Saharan African economies’ GDP .............................................. 44
Figure 5.4 Average sub-Saharan African economies’ imports .......................................... 45
Figure 5.5 Average sub-Saharan African economies’ total reserves ................................. 46
Figure 5.6 Average sub-Saharan African economies’ current account trade balance ....... 47
Figure 5.7 Average sub-Saharan African economies’ external debt stock ........................ 48
Figure 5.8 Sub-Saharan African economies’ concentration ratio ...................................... 49
Table 5.1 Hypothesis 1: Summary .................................................................................... 55
Table 5.2 Hypothesis 2: Summary .................................................................................... 56
Table 5.3 Hypothesis 3: Summary .................................................................................... 58
Table 5.4 Hypothesis 4: Summary .................................................................................... 59
Table 5.5 Removed economic parameters ....................................................................... 60
Figure 6.1 Hypothesis 1: Mean average current account balance .................................... 64
Figure 6.2 Hypothesis 1: Mean average external debt stock ............................................ 65
Figure 6.3 Hypothesis 2: Mean average exports data ....................................................... 67
Figure 6.4 Hypothesis 2: Mean average GDP .................................................................. 69
Figure 6.5 Hypothesis 3: Mean average GDP .................................................................. 72
Figure 6.6 Hypothesis 3: Mean average exports .............................................................. 73
Figure 6.7 Hypothesis 3: Mean average current account balance .................................... 74
© 2014 University of Pretoria. All rights reserved. The copyright in this work vests in the University of Pretoria.

2
Figure 6.8 Hypothesis 4: Mean average GDP growth ....................................................... 78
Figure 6.9 Hypothesis 4: Mean average external debt stocks ........................................... 79
Figure 6.10 Hypothesis 4: Mean average GDP ................................................................ 80
Figure 6.11 Hypothesis 4: Mean average total reserves ................................................... 81
Figure 7.1 Resilience and vulnerability model for sub-Saharan African economies .......... 86
Table A Sample countries FDI-to-GDP ratios ................................................................. 101
Table B Hypothesis 1: Results........................................................................................ 102
Table C Hypothesis 2: Results ....................................................................................... 103
Table D Hypothesis 3: Results ....................................................................................... 104
Table E Hypothesis 4: Results........................................................................................ 105
Table F1 Mauritius: Pearson correlation ......................................................................... 106
Table F2 Mozambique: Pearson correlation ................................................................... 106
Table F3 Ghana: Pearson correlation ............................................................................. 106
Table F4 Lesotho: Pearson correlation ........................................................................... 107
Table F5 Cape Verde: Pearson correlation .................................................................... 107
Table F6 Namibia: Pearson correlation .......................................................................... 107
Table F7 Gambia: Pearson correlation ........................................................................... 108
Table F8 Nigeria: Pearson correlation ............................................................................ 108
Table F9 Morocco: Pearson correlation .......................................................................... 108
Table F10: Rwanda: Pearson correlation ....................................................................... 109
Table F11 South Africa: Pearson correlation .................................................................. 109
Table G Standardised coefficients .................................................................................. 110
© 2014 University of Pretoria. All rights reserved. The copyright in this work vests in the University of Pretoria.

3
CHAPTER 1 Introduction to research problem
1.1 Introduction
In the past two decades, the global economy has experienced a series of major economic
shocks in the form of the Asian crisis, the global financial crisis and the eurozone crisis.
These economic crises have had major, long-lasting economic impacts on most
economies, and more so on emerging or developing economies. Ravallion and Chen
(2009) estimated that the financial global crisis compounded the issue by adding 53 million
people living on less than $1.25 a day and 64 million people living on less than $2 a day.
Many of the developing countries were affected by a decrease in capital inflows in the form
of foreign direct investment (FDI). Total capital outflows from European markets to
emerging economies decreased from more than $2 trillion in 2007 to less than $200 billion
which indicated less investment in the form of FDI in emerging economies (Suttle, Koepe
& Tiftik, 2012). Most notably, Fitch (2013) mentioned that for sub-Saharan African (SSA)
economies to create an enabling environment for FDI, it would be necessary to reduce
external vulnerabilities and to increase resilience through economic diversification and
developing local debt and credit markets. This brings to the fore the importance of these
two aspects of economic resilience and economic vulnerability that should function in a
reciprocal nature to attract FDI and to withstand external shocks from foreign markets.
The link between economic resilience and economic vulnerability is an important aspect
when evaluating emerging economies. Emerging economies’ reliance on commodities
exposes them to external vulnerabilities, such as price changes and demand factors, and
these economies need to enhance their resilience against these external vulnerabilities.
1.2 Purpose of the research
The aim of this study was to evaluate and assess the economic vulnerability to and
resilience of emerging economies against adverse economic shocks. The research
focused specifically on the SSA region. The 2007/2008 global financial crisis and the 2009
© 2014 University of Pretoria. All rights reserved. The copyright in this work vests in the University of Pretoria.

4
recession that originated in the United States of America quickly spread to other
developed, mainly European, nations due to the integrated nature of the global financial
system (Devarajan & Kasekende, 2011). The spillover effects then spread to a lesser
extent to other economies in Asia and Africa, adversely affecting emerging markets.
Since then, a significant amount of academic research has been undertaken to evaluate
the cause of the global financial crisis, its impact on economies, both developed and
emerging economies, and measures implemented to counter the adverse impact of the
crisis in the form of fiscal and monetary policies. The study of economic vulnerability and
resilience was born out of the need for economies to be able to minimise or withstand the
impact of such shocks. This is of particular importance for the SSA region as economic
resilience and vulnerability of these economies are key determinants of levels of FDI.
Understanding these dimensions for emerging economies is of particular importance
(Cheung & Ito, 2008). It is thus important to evaluate and demonstrate the economic
stability of the region to attract FDI and to be able to provide sufficient returns on
investment.
1.3 Problem definition
Sub-Saharan Africa’s economic performance has been improving steadily according to
Aryeetey and Ackah (2011) who noted that, since 2000, real output in Africa’s economies
has been growing at a rate of above five per cent on average. Indeed, Africa’s growth has
been phenomenal in light of the FDI attracted by SSA countries as well the demand for
their export goods, mainly commodities such as Brent crude oil, copper and coffee. FDI in
the SSA region has played a vital role in stimulating economic activity with net private
capital inflows increasing from US$17.1 billion in 2002 to US$81 billion in 2007 (Aryeetey
& Ackah, 2011). It is also important to note, however, that this growth was spearheaded by
increases in commodity prices where African economies had a competitive advantage
Menson, 2012).
However, the global recession in 2009, caused by the 2007/2008 financial crisis, impeded
the hard-fought-for gains of the region in terms of economic activity and growth. The result
© 2014 University of Pretoria. All rights reserved. The copyright in this work vests in the University of Pretoria.

5
was a slump in the economies of the region with some economies affected more than
others, mainly middle-income economies such as South Africa and Mauritius. The global
crisis highlighted the vulnerability of emerging economies, especially to commodity prices,
and growth appears to have been adversely affected by these economic shocks. Hence,
the manner in which economies respond to these shocks has become critical as they can
destabilise economies and derail economic gains.
1.3.1 Impact on foreign direct investment
Aryeetey and Ackah (2011) observed that the portfolio of economic development in the
form of FDI has been reduced in countries that have been perceived as riskier markets
where economic stability cannot be guaranteed. FDI is particularly important for Africa, the
SSA region to be more precise, in that it is seen to be a vehicle to achieve the United
Nation’s Millennium Development Goals (MDGs), namely to halve poverty in the region by
2015 (Asiedu, 2006). The research conducted by Asiedu (2006) further stated that income
levels in the region are inadequate to achieve the GDP growth levels required to achieve
the MDGs. Hence, FDI in emerging economies is a vital source of investment income.
Based on the empirical work done by these authors, it becomes clear that markets that are
perceived as less risky or better able to withstand economic shocks would attract the FDI
required to fund increased economic activity. Economic stability is important not only for
specific countries, but also for the region in which they are situated as there are significant
spillover effects and synergies among countries in a geographical region due to
globalisation and free trade. For example, Managi and Bwalya (2010) explored the
proposition of FDI and technology transfer through technology spillovers. Their research
explored the relationship between inward FDI and productivity levels. Their proposition
was that FDI increases competition in the local markets, hence increasing the local
economy’s productivity levels. A positive correlation was found between foreign firms
operating in local markets through horizontal channels, intra-industry and productivity
(Managi & Bwalya, 2010). In addition to the correlation were regional effects from FDI in
terms of technology and productivity levels in the Kenyan and Tanzanian region. This
indicated that the concentration of FDI in a region can enhance competitive aspects with
regard to the competitiveness of an economy.
© 2014 University of Pretoria. All rights reserved. The copyright in this work vests in the University of Pretoria.

6
1.3.2 Emerging economy vulnerability and resilience
The United Nations Secretary General, Ban Ki-moon, speaking at the fifth Tokyo
International Conference on African Development (TICAD) in June 2013, emphasised the
need for African economies to become resilient through diversification during a discussion
of investment as an engine for economic development (UN Secretary General, 2013).
This, then, is a shared view that without diversification, African economies could be
rendered vulnerable to exogenous shocks. The South African Minister of Finance also
indicated that African economies were faced with clear vulnerabilities due to a lack of
diversification (Donnelly, 2013).
The indications from the discussions on African economies at TICAD was that while
investors are indeed looking for investment opportunities, resilient economies are
nevertheless essential to ensure that investments are secure in the long run in those
economies. Ban Ki-moon (UN Secretary General, 2013) further emphasised that due to his
views that responsible foreign investors provide more value in terms of development in
Africa than any other form of development method, it is therefore essential to have
economic resilience in emerging markets.
Moody’s rating reports are often used to measure an economy’s attractiveness to foreign
investors. In recent times, an economy’s resilience has been evaluated by Moody’s to
determine an economy’s rating. For example, a report released in May 2013 reflected a B3
rating for Moldova (Moody’s, 2013). A B3 rating means that obligations are considered
speculative and are subject to high credit risk (Moody’s, 2013). One of the key reasons for
the poor rating was low economic resilience. This highlights the importance of encouraging
investor confidence in the resilience of emerging economies in order to be an attractive
destination for foreign investors.
However, this is not where the story ends. An investment needs to be maintained in an
economy as vulnerability may present itself in the form of “hot capital” resulting from large
private capital inflows due to the structure of the economy. The reversal of these capital
inflows may also present vulnerability (Donnelly, 2013). For instance, according to the
2012 Institute of International Finance’s report, net private capital inflows fell to $910 billion
© 2014 University of Pretoria. All rights reserved. The copyright in this work vests in the University of Pretoria.

7
in 2011 from over $1 trillion a year before with a projected recovery to $893 billion for 2013
(Suttle et al., 2012). In this report, Suttle et al. (2012) attributed the shock in capital flows
to transmission mechanisms due to the euro economies’ crisis which demonstrated
vulnerability in terms of connectedness to the European economies.
Hence, research to evaluate the vulnerability and resilience of emerging economies
(specifically in the SSA region) to economic shocks became imperative to:
evaluate the stability of the region
explore its inherent weaknesses and strengths
propose guidelines for the assessment of such vulnerabilities and resilience
provide recommendations on how countries can enhance their investment
attractiveness.
1.4 Context
Rathbone (2013) noted Mexico’s plan to expand its economy by improving its GDP growth
from 4% to 6%. He noted that Mexico’s Reserve Bank Governor mentioned that economic
resilience is one of the aspects that Mexico is investigating in an effort to improve its GDP
growth levels. Economic resilience was mentioned as a necessary condition for GDP
growth levels even though it is not sufficient on its own.
1.4.1 Resilient dynamism
The statement by the Mexican Reserve Bank Governor advances the argument for
economic resilience as a necessary platform for economic growth. Furthermore, the
subject of resilience has gained traction in recent times due to various exogenous shocks
to economies around the world. The World Economic Forum explored the issue at a recent
gathering of countries in Davos in March 2013. The theme of the discussions was resilient
dynamism (Reuttner, 2013). Indeed, the phrase, “resilient dynamism”, seems contradictory
in that resilience suggests an object that withstands pressure and yet dynamism entails
movement and agility. The theme of resilient dynamism was central to the Davos agenda
where it was mentioned in connection with efforts to restore economic growth and
© 2014 University of Pretoria. All rights reserved. The copyright in this work vests in the University of Pretoria.
8
confidence in markets facing incipient economic and political shocks (WEF, 2013). In an
article on resilience of financial systems, Reuttner (2013) suggested that economies
should look at shifting their focus from anticipating and preparing for known events to
preparing for unknown events.
1.4.2 Exploring economic resilience
Recently, more and more economists have been exploring the subject of economic
resilience in various economic publications. This is due, in part, to the recent exogenous
shocks suffered by the global financial and monetary systems. Most notably, the 1997
Asian financial crisis and the 2009 global recession have drawn attention to the impact of
these crises and have subsequently initiated debates on how best to shield or minimise
the impact of such exogenous shocks on economies. Panitchpakdi (2013), at the United
Nations Conference on Trade and Development (UNCTAD), underlined the need to
understand the factors that determine economic vulnerability, especially focusing on the
developing economies. In an effort to understand some of these factors, it became
apparent from the outcome of the conference that many countries were using the
accumulation of reserves as a measure to counter instability in the markets. However, this
is a costly policy exercise which many developing countries cannot afford (Panitchpakdi,
2013). The question that then needs to be asked is how emerging or developing countries
could shape their economies to withstand exogenous shocks.
1.5 Conclusion
This chapter highlighted the importance of the macroeconomic stability of developing or
emerging economies through the implementation of policies to enhance economic
resilience and to reduce economic vulnerability. These concepts are principally important
for SSA economies since they rely heavily on commodities which are volatile in nature
while they simultaneously endeavour to develop economies that are sufficiently stable and
sustainable to attract the FDI required to increase economic growth. It was also noted that
emerging economies are vulnerable to exogenous economic shocks. SSA economies
therefore need to formulate and entrench policies that can increase economic resilience
© 2014 University of Pretoria. All rights reserved. The copyright in this work vests in the University of Pretoria.

9
and reduce economic vulnerability to achieve economic growth since integration in the
global economy is inevitable.
This subject is also gaining much attention from world economic organisations in light of
the financial crises which have occurred during the past 20 years and which have often
spilled over into other economies due to the integrated nature of the global economy. The
impact of these crises has often been more severe for emerging economies and their
hard-fought-for economic gains have been eroded. Finally, resilient dynamism was
discussed as a theme that emerging economies need to adopt to manage unknown
exogenous shocks as well as the manner in which the economies are structured for agility
with increased resilience and reduced vulnerability in anticipation of unknown economic
events.
© 2014 University of Pretoria. All rights reserved. The copyright in this work vests in the University of Pretoria.

10
CHAPTER 2 Literature review
2.1 Introduction
This chapter provides the literature review of the concepts and various constructs of
economic resilience and vulnerability in the context of emerging economies. It also
provides definitions of economic resilience and vulnerability, and explores their
applicability in the context of emerging or developing economies. Further, the chapter
explores the effects of exogenous shocks with a specific focus on economic vulnerability
and resilience concepts and frameworks in the context of emerging economies in light of
their heavy reliance on commodities (Eichengreen, 2002).
Much of the research in this area focused on biological systems and their ability to adapt to
changes. There has been much interest in this area as a result of the recent financial
crises of the past two decades with specific reference to the impact of exogenous shocks
on emerging economies. This chapter also explores the manifestation and amplification
effects of exogenous shocks on emerging economies as highlighted by Korinek (2011).
Finally, this chapter uses frameworks initially designed to explain exogenous shocks in the
context of climate change such as those proposed by Mechler, Hochrainer, Pflug, Lotsch
and Williges (2010), and adapts these frameworks to the macroeconomic context of
resilience and vulnerability.
2.2 The concepts of vulnerability and resilience
As the concept of resilience “originated in environmental studies, it described the biological
capacity to adapt and thrive under adverse environmental conditions” (Christopherson,
Michie & Tyler, 2010, p. 1). The concept has since been applied to various fields, including
regional economics. Guillaumont (2010) acknowledged that the study of macroeconomic
resilience theory first developed over 40 years ago, with a specific focus on developing
countries in light of international prices of primary exports. However, the subject has
© 2014 University of Pretoria. All rights reserved. The copyright in this work vests in the University of Pretoria.

11
received less attention since then and has only emerged again as a result of the recent
global financial crises with specific focus on developing countries.
Briguglio (2003) first developed the concept called the “Singapore Paradox” which refers to
a country that is highly exposed to exogenous shocks but is sufficiently resilient to achieve
constantly high economic growth levels. Briguglio, Cordina, Farrugia and Vella (2009)
further studied the Singapore phenomenon in later research and discovered that
Singapore posed a “contradiction that a country can be highly exposed to exogenous
shocks, rendering it economically vulnerable, and yet still manage to attain high levels of
GDP per capita” (p. 230). Briguglio (2003) developed this concept after an extensive study
of Singapore as it is an island that is highly exposed to external economic shocks and yet
is able to maintain a high GDP per capita. Jayaraman (2006) conceded that this concept is
not easily replicable as Singapore is recognised as an economy that is committed to high
economic growth with strong discipline along with restricted political freedom. However,
there are lessons that can be extracted from the Singapore Paradox and that provide
theories and frameworks based on the literature with regard to this area of addressing
vulnerabilities and building resilience into emerging economies.
Pamungkas (2012) defined the two terms, namely vulnerability and resilience –
“vulnerability reflects pre-disaster condition whereas resilience reflects post-disaster
condition” (p. 8). These conditions are conversely reinforcing in nature in that the
improvement of resilience can mitigate or lessen the vulnerability of an economic system
to future shocks. In this research paper, both terms were analysed and integrated into
frameworks which can be used to evaluate the stability of the microenvironment of
emerging economies. This is important, particularly since South Africa and the SSA region
form part of these emerging economies that are starting to trade with each other as in the
case of the BRICS (Brazil, Russia, India, China and South Africa).
2.3 Vulnerability theory
The empirical study of vulnerability has only received attention in recent times and there is
no consensus on the definition of vulnerability (Harttgen & Günther, 2006). Until recently,
© 2014 University of Pretoria. All rights reserved. The copyright in this work vests in the University of Pretoria.

12
vulnerability theory had been largely applied to poverty and households’ risks to poverty,
but still with no agreement on the implications of the concept of vulnerability (Harttgen &
Günther, 2006). However, the concept of vulnerability has gained some traction with some
researchers aiming to define it and also to present it as a study that can be applied across
many disciplines. Naudé, Santos-Paulino and McGillivray (2009) defined vulnerability as a
risk to a system that can be applied across various disciplines to households, regions or
countries that can be affected by specific distresses. These distresses would result in a
negative change to the system (Naudé et al., 2009). There is consensus among various
researchers in this field that vulnerability would result in different definitions depending on
the subject to which the vulnerability concept is applied (Hoddinott & Quisumbing, 2008;
Naudé et al., 2009).
More recent studies have attempted to define and introduce frameworks for the
measurement of vulnerability. Mechler et al. (2010) studied vulnerability in the context of
climate change and its impact on households, and viewed the concept as the likelihood of
experiencing stress due to exogenous shocks. Limitations were highlighted in the study
with regard to this narrow view of the concept since its premise was based on climate
change. In economic terms, the risk was highlighted as the risk facing households of falling
into poverty due to idiosyncratic or covariate shocks (Naudé et al., 2009).
More in-depth research into the components of vulnerability revealed underlying instances
that could be viewed as a function of vulnerability. Mechler et al. (2010) stated that
vulnerability was a function of exposure to hazards and sensitivity of the system, while risk
was a potential hazard and its potential consequences, this being exposure and sensitivity.
Clearly, this separated vulnerability and risk, whereas Naudé et al. (2009) viewed risk as
the probability of a hazard negatively affecting a system.
In Figure 2.1, Mechler et al. (2010) defined vulnerability in the context of climate change
that negatively affects an economy which is more highly exposure due to geographical
location. The impact would expose the vulnerabilities inherent in the economy. Adaptation
and mitigation explored the reactionary factors, including social and governmental
responses, which were used intentionally or unintentionally induced to minimise the impact
and to return the system to its normal state.
© 2014 University of Pretoria. All rights reserved. The copyright in this work vests in the University of Pretoria.

13
Figure 2.1 Definition of vulnerability in terms of climate change
Source: Mechler, Hochrainer, Pflug, Lotsch & Williges (2010)
Indeed, risk and vulnerability are ambiguous terms. Figure 2.2 was adapted from the
model of climate vulnerability theory in Figure 2.1 (Mechler et al., 2010) to demonstrate
vulnerability in economic terms. The model in Figure 2.2 applies the concept of
vulnerability to economic conditions as a function of the potential impacts along with
society’s capacity to adapt to the changes. Figure 2.2 demonstrates how exposure to
exogenous shocks has a cascading effect at a macroeconomic level. The adaptability of
an economy is thus crucial in minimising the impact of exogenous shocks, along with
mitigation measures which largely rely on fiscal policies.
In the adapted model in Figure 2.2, the global financial crisis was seen as an exogenous
shock instead of climate change. The openness and integrated nature of the economy
(used for illustration purposes) to the global economy makes it possible for the financial
global crisis to be transmitted to such an economy. The impact of this crisis can be
© 2014 University of Pretoria. All rights reserved. The copyright in this work vests in the University of Pretoria.

14
transmitted to an emerging economy, as illustrated in Figure 2.2, through the emerging or
developing economy’s dependence on trade with the developed economies. The results
are that trade is reduced for local businesses with the consequence of less income for
these businesses due to less demand for products destined for export markets. Net
impacts would result in businesses retrenching staff or closing down, thus causing an
increase in unemployment. Loss of employment increases the unemployment rate and
reduces economic activity, causing the economy to go into recession. This demonstrates
the vulnerability of an emerging economy due to its trade openness and dependence on
developed markets for trade and economic activity. The ensuing economic recession
would stimulate a policy response from the government concerned. Economic resilience of
the economy would be measures instituted by the government such as fiscal policies that
increase spending on infrastructure projects or stimulus packages to bail out local
businesses in order to retain employees.
Figure 2.2 Definition of vulnerability applied to economic conditions
Source: Adapted from Mechler, Hochrainer, Pflug, Lotsch & Williges (2010)
© 2014 University of Pretoria. All rights reserved. The copyright in this work vests in the University of Pretoria.

15
2.3.1 Economic vulnerability
Briguglio et al. (2009) ascribed economic vulnerability “to inherent conditions affecting a
country’s exposure to exogenous shocks” (p. 230). The inherent conditions could manifest
as the size of the country and degree of openness to trade, among other conditions.
Further arguments presented mention the high degree of economic vulnerability of small
island countries due to the openness of their economies to trade (Briguglio et al. 2009).
According to Briguglio et al. (2009), the study of economic vulnerability was first evidenced
in the early 1990s. This was supported by Guillaumont (2010) who mentioned the Asian
crisis, also in the 1990s. Even though the study of economic instability originated some 40
years ago according to Guillaumont (2010), vulnerability economic theory was only
developed later in the light of structural instability symptoms on a macroeconomic level
which were underlined by various economic crises.
Economic and resilience theory often mention exogenous shocks to an economic system
or economy. These exogenous shocks can be categorised into two categories, namely
natural environmental shocks such as earthquakes and floods, and shocks such as
changes in demand for a commodity, trade prices and global crises as noted by
Guillaumont (2010). These latter shocks are the main sources of economic vulnerability.
2.4 Resilience theory
Resilience theory describes a system’s ability to adapt and reorganise itself as a result of a
sudden shock. Dos Santos and Partidário (2011) defined resilience “as the capacity of
socio-ecological systems to support disturbances and reorganise, [and that it] assumes a
crucial role to avoid disruptions and collapses” (p. 1). This definition is congruent with
Rose’s (2009) definition that resilience is the amount of disturbance a system can absorb
without it changing its state. This definition is at the heart of resilience theory as it can be
applied across systems, natural environments and macroeconomics.
© 2014 University of Pretoria. All rights reserved. The copyright in this work vests in the University of Pretoria.
16
This subject has received much attention from an ecological and natural disaster
perspective. Rose and Liao (2005) conducted their research in the area of the coping
behaviour of business, the non-linear adaptive response of organisations and community
resilience to natural disasters. Ecologists were the first to embrace the concept of
resilience more than 30 years ago (Rose, 2009). Other empirical research has emerged
since then that has incorporated this term in various studies. Manyena (2009) introduced
the concept of the mobilisation of resources to maintain the structure of a system. From
the research thus far, it is evident that much of the literature in this area focused mainly on
resilience as a function of natural disasters and many studies did not consider other
exogenous shocks, such as a rise in oil prices, food shortages, and financial and global
crises, as a function of resilience.
According to Rose (2009), resilience has three properties that are evident on deeper
inspection. The first property is the reduced probability of failure which refers to mitigation
measures. The second property is reduced consequences from failure and the third is
reduced time to recovery. These three properties illustrate a more in-depth approach to the
two types of resilience systems, namely inherent and adaptive capabilities.
Pamungkas (2012) posited vulnerability as a pre-disaster condition and resilience as a
post-disaster condition. Figure 2.3 illustrates the interrelationship between resilience and
vulnerability, and how mitigation strategies affect the overall economic output focusing on
disaster management systems (Pamungkas, 2012). The model implies that every structure
has inherent resilient qualities which are enhanced by the reduced vulnerabilities in the
structure. Reduced vulnerability also enhances inherent resilience in the structure. In turn,
mitigation measures reduce vulnerabilities and the probability of failure at the most
fundamental level of resilience.
© 2014 University of Pretoria. All rights reserved. The copyright in this work vests in the University of Pretoria.

17
Figure 2.3 The role of economic resilience in economic disasters
Source: Rose (2009)
2.5 Vulnerability and resilience measurement framework
There have been developments in the measurement of economic vulnerability and
resilience, for instance the framework developed by Briguglio et al. (2009). The framework
entails grouping countries or regions by classifying them according to specific criteria.
Countries can be grouped into four categories, namely best case, worst case, self-made
and prodigal son. The computation is performed using regression analysis with the inputs
being macroeconomic stability, fiscal deficit, inflation and unemployment, external debt
and macroeconomic market efficiency, among others. Each input looks in detail at
economic ratios for each country or region.
Gnangnon (2012) advocated that this framework be used in economic resilience theory
and noted empirical work done by other authors in deriving models of such analysis.
Subsequently, Gnangnon (2012) pointed to another method first developed in 2003 and
© 2014 University of Pretoria. All rights reserved. The copyright in this work vests in the University of Pretoria.

18
revised in 2009 called the vulnerability index. This economic vulnerability index “captures
vulnerability caused by structural factors” (Gnangnon, 2012, p. 8) and the framework is
called the “Economic Vulnerability Index (EVI)” (p. 8). In addition, the author suggested
that this framework could be used to measure the economic structure of an economy that
is beyond the control of policy, but is affected by the global economy.
2.6 Emerging economies theory
Emerging economies, also referred to as developing or transition economies, is a term that
was first developed by Van Agtmael to describe fast-growing economies in the 1970s
(Bluen, 2012). These economies were differentiated from other economies in terms of
economic attributes in that they displayed rapid growth when compared to developing
nations and third-world countries. Hoskisson, Eden, Lau and Wright (2000) defined
emerging economies as economies that satisfy two criteria, namely a rapid pace of
economic development and government policies that favour market liberalisation and the
free market system. Bluen (2012) noted that the emerging market economies that were
originally covered by the description were Asian economies. They were commonly referred
as the Asian Tigers, and included countries such as China, Singapore, South Korea and
Taiwan. These economies have since developed economically as well in the manner in
which they have developed their institutions. However, the term “emerging economies” is
still applicable to economies that are growing rapidly.
Samoilenko and Osei-Bryson (2010) argued that there is no list of economies that are
defined as emerging economies and preferred the term “transition economies”. These
economies are moving from a centralised planning system to a free market system. These
empirical studies noted that transition economies share characteristics of both developed
and less developed economies (Samoilenko and Osei-Bryson, 2010). This view was
supported by various other authors. Bluen (2012) also mentioned that the term “emerging
economies” has become outdated since it was first coined to describe the Asian Tiger
economies that have since emerged. Hence, this term is currently being questioned by
different schools of thoughts as to its relevance.
© 2014 University of Pretoria. All rights reserved. The copyright in this work vests in the University of Pretoria.

19
According to empirical studies by Eichengreen (2002), emerging economies have certain
structural features that define them. The author cited structural features such as using
commodities to drive economic growth, large capital inflows and unpredictability in the
economies themselves. However, each of these features could potentially introduce
vulnerabilities in an emerging economy since many of these features are externally
orientated. Even though the term “emerging economies” was derived more than three
decades ago, there are few studies that define emerging economies or that provide clear
guidelines on how to ascertain whether an economy is classified as an emerging
economy, including the three characteristics identified as rapid growth in GDP, capital
flows and certain unpredictability (Eichengreen, 2002).
2.6.1 Financial integration
The concept of financial integration refers to various links that an economy has to capital
economies (Mougani, 2012). Empirical research acknowledged that financial integration
has two major benefits, these being the allocation of capital across capital economies and
the ability to enable countries to share or reduce risk by reducing consumption volatility
(Kose, Prasad & Terrones, 2006). Financial integration occurs in many forms and some
examples may include, but are not limited to, financial systems, internationalisation of
financial assets and liabilities, banking systems and market institutions (Mougani, 2012).
Kose et al. (2006) argued that financial integration is critical for emerging economies as it
provides access to capital for emerging economies to enable them to diversify their
production efforts. In time, financial integration leads emerging economies to specialisation
which results in competitive advantages.
However, the production specialisation of emerging economies results in industry-specific
vulnerabilities although macroeconomic volatilities in emerging economies cannot be
clearly linked to financial integration according to Kose et al. (2006). Korinek (2011)
concurred with this idea that emerging market economies that are integrated in the global
economy face vulnerabilities. Further, Korinek (2011) stated that these economies are
exposed to the boom-bust cycles of the global economy, especially since these economies
are heavily reliant on capital inflows into their economies
© 2014 University of Pretoria. All rights reserved. The copyright in this work vests in the University of Pretoria.

20
There are various arguments as to the type of impact financial integration has on emerging
economies. On the one hand, in a study conducted on SSA economies, Kose et al. (2006)
found links of positive economic growth in developing countries that are financially
integrated and also found other attributes that emerge apart from economic growth, such
as foreign direct investment, skills transfer and technology spillovers. On the other hand,
Mougani (2012) stated that there has been no finding that financial integration results in
positive effects on economic growth for emerging economies.
2.6.2 Amplification effects of exogenous shocks
Demir (2009) noted that developing countries experienced significant capital flows during
the 1990s. Due to the interest of emerging economies in the global economy, there is a
heightened concern about reversals in the capital flows. This can also be seen as a
vulnerability for emerging economies as it could quickly turn into a financial crisis for these
economies (Choi, Sharma & Strömqvist, 2009). Empirical research by Korinek (2011)
produced a model that demonstrated the amplification effects that may be caused an
exogenous shock to an emerging economy. Since Eichengreen (2002) had established
that emerging economies were heavily dependent on commodities, Korinek (2011) created
a model, demonstrated in Figure 2.4, where he stated that when such an emerging
economy experiences a shock in the form of a decline in the aggregate demand of a
commodity, the exchange rate would fall and the asset price would fall. This would result in
adverse balance sheet effects. Korinek (2011) called this financial amplification as such a
shock could also result in the emerging economy not being able to access external finance
which would force a cut-back in spending. In turn, a feedback loop is created in the
economy which amplifies the effects of an exogenous shock.
© 2014 University of Pretoria. All rights reserved. The copyright in this work vests in the University of Pretoria.

21
Figure 2.4 Financial amplification effects
Source: Korinek (2011)
Korinek (2011) saw the financial amplification effects as a by-product of external financing
and, as such, they introduced financial fragility into emerging economies. Recently, Choi et
al. (2009) noted that emerging economies had accumulated more financial reserves when
compared with their more developed counterparts as measured by the average reserves-
to-GDP ratio.
2.6.3 Reactions to shocks in emerging economies
The stockpiling of reserves occurred directly after the Asian crisis. This action was taken
by emerging economies to reduce their vulnerabilities to exogenous shocks. Choi et al.
(2009) revealed that emerging economies that were concerned about an exogenous shock
in the form of a sudden stop to capital flows have been using net capital flows to build up
their reserves since these countries do not have the same access as advanced economies
to capital at relatively low costs. This action can be viewed as a resilience mechanism
which these emerging economies have built into their economic systems.
Demir (2009) concluded that the reason for the stockpiling was the volatility of capital flows
to emerging economies as this volatility affected investment by changing the prices of
goods which distorted price signals. This view was also supported by Eichengreen (2002)
© 2014 University of Pretoria. All rights reserved. The copyright in this work vests in the University of Pretoria.
22
who stated that the openness of emerging economies had a direct impact on the
exogenous shocks experienced by these economies as they were vulnerable to
commodity and financial shocks. This argument was not supported by research studies
conducted by Duval, Elmeskov and Vogel (2007) who established in their research on the
Singaporean economy that openness actually enhances resilience and reduces economic
vulnerability.
Demir (2009) concluded that during the past few decades, there had been volatility in the
micro and macro environments globally that had had an impact on emerging economies in
the form of boom-bust cycles, lower investments and a reversal of funds from developing
to developed countries. These conclusions were in line with those of Choi et al. (2009)
who stated that advanced economies have better access to capital markets as they can
withdraw capital investment made in other countries, for example, while emerging
economies do not have such options available to them and as such must accumulate large
capital reserves. However, Korinek (2011) argued against this notion of building up
precautionary reserves in favour of reducing them and increasing the amount of borrowing.
This notion requires certain shifts in an emerging economy in that Korinek (2011)
suggested shifting labour into the tradable sector to appreciate the country’s exchange
rate and to relax its borrowing constraints. In conclusion, Korinek (2011) advocated that
emerging economies should “internalize such externalities and coordinate the actions of
market participants toward a lower level of financial fragility” (p. 557).
2.6.4 Emerging economies and foreign direct investment (FDI)
FDI has increasingly played an important role in the development and growth of many
emerging economies. Wright, Filatotchev, Hoskisson and Peng (2005) noted that a key
characteristic of emerging economies is the significant amount of FDI they attract. As
such, there has also been a change in attitude in emerging economies towards FDI
(Gerschewski, 2013). These economies have begun to appreciate the role which FDI plays
in the development of an economy, not only in monetary terms but also in terms of
spillover effects. As noted by Gerschewski (2013), governments of emerging economies
welcome these investments since they also boost the productivity of local firms. Adewumi
© 2014 University of Pretoria. All rights reserved. The copyright in this work vests in the University of Pretoria.
23
(2006) studied the impact of FDI on emerging economies’ GDP and concurred that FDI
has a positive contribution and that it was the most resilient factor during the Latin-
American financial crisis in the 1980s and also during the 1997/1998 Asian crisis. These
studies highlighted the importance of FDI in emerging economies and as such resilience
and FDI in emerging economies is of paramount important to sustain high GDP growth
levels. It was also noted that emerging economies with high and resilient growth levels
attract higher levels of FDI than emerging economies that cannot achieve high growth
levels and have not proved to be resilient during economic downturns (Adewumi, 2006).
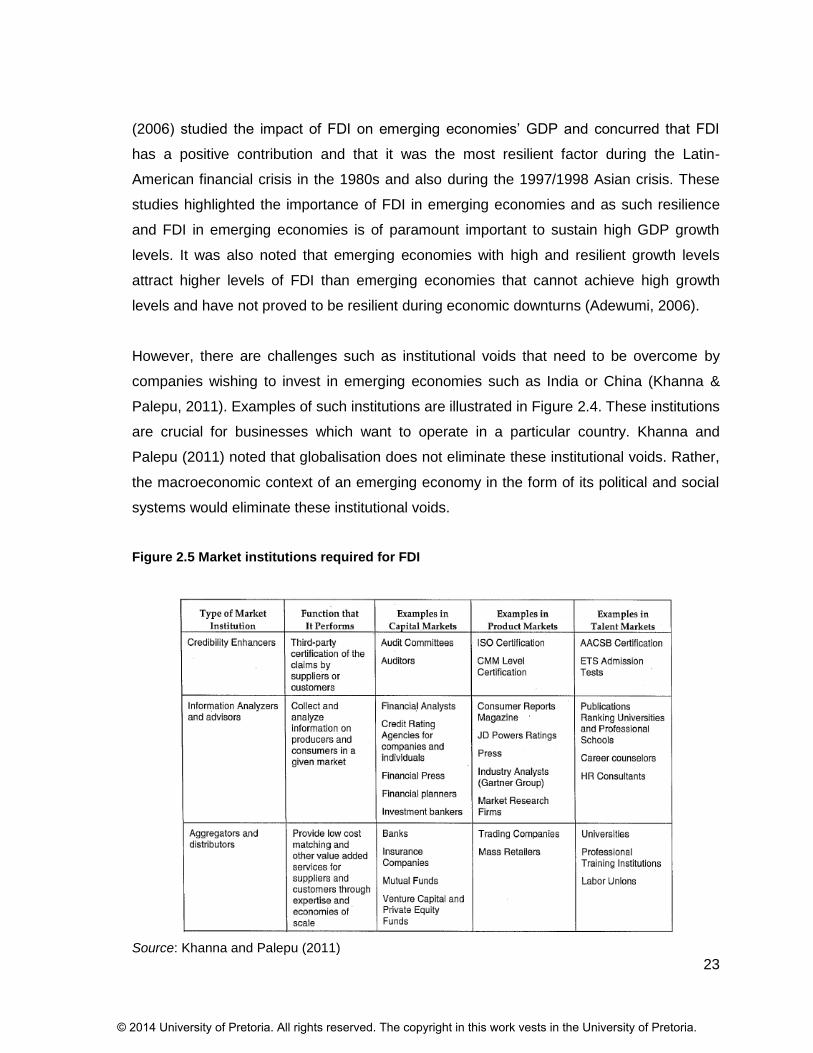
However, there are challenges such as institutional voids that need to be overcome by
companies wishing to invest in emerging economies such as India or China (Khanna &
Palepu, 2011). Examples of such institutions are illustrated in Figure 2.4. These institutions
are crucial for businesses which want to operate in a particular country. Khanna and
Palepu (2011) noted that globalisation does not eliminate these institutional voids. Rather,
the macroeconomic context of an emerging economy in the form of its political and social
systems would eliminate these institutional voids.
Figure 2.5 Market institutions required for FDI
Source: Khanna and Palepu (2011)
© 2014 University of Pretoria. All rights reserved. The copyright in this work vests in the University of Pretoria.

24
2.6.5 Economic diversification
Economic diversification has long been a study of interest to economists with the aim of
promoting economic stability. Seigel, Johnson and Alwang (1995) defined economic
diversification as “the process of structural transformation as resources are shifted out of
primary (natural resource-based) sectors into secondary (manufacturing) and tertiary
(services) sectors.” (p. 263). Mayer (1996) argued against the notion of economic
diversification in that the concept of diversification, even though it is a mechanism to
reduce risk, tends to erode an economy’s competitive advantage.
It has been established that emerging economies, along with those of the SSA region, are
heavily reliant on commodities due to an abundance of natural resources (Eichengreen,
2002). As such, exports and commodity prices are critical to economic growth. Hosein
(2010) put forward a case for economic diversification and the reduction of economic
concentration for mineral-rich countries, more so for emerging economies, to reduce the
impact of exogenous shocks in the form of prices of minerals resulting from cyclical and
volatility changes in economies. These observations gained support from Papageorgiou
and Spatafora (2012) in their studies, with economic reform recommendations to promote
macroeconomic stability through diversification. The underlying assumptions are that
structural transformational processes result in an imbalance in favour of certain sectors
against others. Their findings concluded that economies with more diversified economic
structures faced less volatility in international prices and levels of consumption, and further
increased their economic resilience to external shocks. The argument was explored further
to enhance resilience through geographic diversification of export goods to reduce the
impact of regional economic failures on emerging economies (Papageorgiou & Spatafora,
2012).
Economic diversification is a process that requires human and physical capital becoming
more mature in terms of skills for the structural transition of an economy from exporting
unprocessed goods to exporting manufactured goods (Mayer, 2006). Emerging economies
are therefore faced with this challenge of diversifying their economies by upgrading their
human capital in terms of the skills required for the manufacturing or processing of primary
resources into manufactured goods.
© 2014 University of Pretoria. All rights reserved. The copyright in this work vests in the University of Pretoria.

25
2.7 Summary of literature review
Previous studies introduced the concepts of resilience and vulnerability, focusing on
developing or emerging economies, more so on Asian economies. These studies were as
a result of the Asian crisis that engulfed the Asian economies and how they set out to
reduce their vulnerabilities to exogenous shocks and enhance their resilience to unknown
shocks. Examples of Asian economies that managed to attain high levels of growth were
mentioned in previous studies, particularly Singapore as its economy defied its high
exposure to exogenous shocks. As a result, Briguglio (2003) devised a concept termed the
Singapore Paradox.
A previous research study approached the concept of vulnerability from its most
fundamental level. The study revealed that vulnerability is a function of exposure to
exogenous shocks and the economy’s sensitivity to these shocks, which then incorporated
the resilience dimension. There was consensus from all previous research studies in this
field that all economies are vulnerable to exogenous shocks and much attention was paid
to reducing these vulnerabilities and increasing resilience while not restricting the
economies’ ability to achieve high economic growth.
Emerging or developing economies were identified as economies that achieve high
economic growth and are able to attract significant FDI. These economies were also
identified as economies that are at high risk and are highly exposed to exogenous shocks.
In addition, many of these emerging economies lack control mechanisms to cope
effectively with these shocks. The paradox that is facing emerging or developing
economies is that as much as they attract significant FDI, investors still prefer economies
that are achieving high growth rates and are stable and less volatile. Previous research
revealed that Asian economies managed to build resilience and reduce their vulnerabilities
to exogenous shocks through diversifying their economies, building reserve buffers, being
less dependent on borrowings and managing their trade openness while ensuring their
financial openness to enable financing of their international reserves. The end result was
the attraction of significant amounts of FDI and an ability to achieve high economic growth
rates.
© 2014 University of Pretoria. All rights reserved. The copyright in this work vests in the University of Pretoria.

26
Evaluated research literature lacked findings on SSA economies when incorporating the
resilience and vulnerability concepts. This research aimed to contribute to the body of
research in this area and to provide a case for SSA economies.
© 2014 University of Pretoria. All rights reserved. The copyright in this work vests in the University of Pretoria.

27
CHAPTER 3 Research hypotheses
3.1 Introduction
The aim of the study was to evaluate the economic resilience and vulnerability of emerging
markets with a specific focus on a select few economies, the selection of which was based
on the criteria discussed in Chapter 4. The hypotheses were based on the literature review
from Chapter 2 where certain features of economies were highlighted that might render
economies resilient or vulnerable. The hypotheses aimed to establish whether any
relationships exist between the two concepts and the reciprocal relationships that
ultimately drive economic performance when emerging economies experience economic
shocks.
3.2 Hypotheses
3.2.1 Hypothesis 1 Accumulation of international reserves
Korinek (2011), Choi et al. (2009) and Demir (2000) suggested that emerging economies
were stockpiling reserves in an effort to build resilience against exogenous shocks. They
concluded that these reserves were built to withstand volatilities in the global economy.
Hence, the first hypothesis evaluated this notion for emerging economies.
Null hypothesis ( ):
Accumulating international reserves or stock-piling is a useful means of building resilience
for emerging economies.
Alternative hypothesis ( ):
Accumulating international reserves or stock-piling is not a useful means of building
resilience for emerging economies.
© 2014 University of Pretoria. All rights reserved. The copyright in this work vests in the University of Pretoria.

28
3.2.2 Hypothesis 2 Economic concentration
Demir (2009) suggested that emerging economies are susceptible to exogenous shocks in
the form of boom-bust cycles and commodities. This observation combined with the notion
that emerging markets are mainly export-driven economies (Duval et al., 2007) suggests
that economic diversification or lack of sector concentration becomes a critical factor in
building a resilient emerging economy.
Null hypothesis ( ):
Reducing economic concentration is a useful means of building resilience for emerging
economies.
Alternative hypothesis ( ):
Reducing economic concentration is not a useful means of building resilience for emerging
economies.
3.2.3 Hypothesis 3 Trade openness
In Chapter 2, it was mentioned that the degree of openness to economic trade renders an
economy vulnerable (Briguglio et al. 2009). This view was also supported by Eichengreen
(2002) in that the openness of an emerging economy exposes the economy to exogenous
shocks in the form of commodity shocks. However, Duval et al. (2007) argued against
these observations by citing Singapore in what was termed the Singapore Paradox as this
country has a high degree of openness with an export-driven economy and yet built a high
degree of resilience.
Null hypothesis ( ):
Trade openness to the global economy does not render emerging economies vulnerable to
exogenous shocks.
Alternative hypothesis ( ):
Trade openness to the global economy renders emerging economies vulnerable to
exogenous shocks.
© 2014 University of Pretoria. All rights reserved. The copyright in this work vests in the University of Pretoria.

29
3.2.4 Hypothesis 4 Financial integration
Korinek (2011) mentioned in his study that the level of integration of an emerging economy
in the global economy exposed it to various exogenous shocks such as boom-bust cycles.
However, Duval et al. (2007) argued against this observation, using Singapore as a case
in point.
Null hypothesis ( ):
Financial integration in the global economy renders emerging economies vulnerable to
exogenous shocks.
Alternative hypothesis ( ):
Financial integration in the global economy does not render emerging economies
vulnerable to exogenous shocks.
© 2014 University of Pretoria. All rights reserved. The copyright in this work vests in the University of Pretoria.

30
Chapter 4 Research methodology
4.1 Introduction
The research methodology was based on a quantitative design using secondary data as a
data source. A quantitative approach was selected as an appropriate tool since the
performance data on the macroeconomic level was in the form of numerical performance
indicators. These data were obtained from multiple sources to form a new data set
(Saunders & Lewis, 2012). The main reason for this approach was that relevant
macroeconomic performance indicators were embedded in different databases.
The data were collected over a period of time. Hence, longitudinal data were selected
since the study intended to track and analyse selected variables used in the four
hypotheses. The selected variables were then observed while tracking the performance of
selected economies as the economies experienced economic shocks. A longitudinal
analysis was performed over a period of 17 years from 1995 to 2011 inclusive. This
allowed the capture of economic performance during the normal phase of the global
economy when economic output of the selected countries was optimal as well as the
capture of economic performance during the recent global financial crises that affected
most emerging economies.
Saunders and Lewis (2012) introduced the research onion in 1997 to describe the
unpacking of different layers in the research process. This process was used to chart the
research design and methodology. The inner layer entailed the data collection method. For
this research, secondary data sources were used to collect data. Mixed data methods
were used as the data were obtained from different sources which conformed to the
research hypotheses and also to cross-reference the accuracy of the data sources.
The research type was explanatory as described by Saunders and Lewis (2012) in that it
“takes a descriptive research a stage further by looking for an explanation behind a
particular occurrence through the discovery of causal relationships between key variables”
(p. 113). The aim of this research was to find causal relationships between variables
© 2014 University of Pretoria. All rights reserved. The copyright in this work vests in the University of Pretoria.

31
through the analysis of the hypotheses stated in Chapter 3 and a historical analysis was
thus deemed to be the appropriate method.
4.2 Research design
The research design was based on the deductive approach which “involves the testing of a
theoretical proposition by using a research strategy specifically designed for the purpose
of its testing” (Saunders & Lewis, 2012, p. 108). Research hypotheses and existing
economic vulnerability and resilience theories and frameworks were used to obtain
verification or otherwise of the stated hypotheses using the stated theories and
frameworks.
4.2.1 Population
Population was defined as “the complete set of group members” by Saunders and Lewis
(2012, p. 132) and is also known as the universe. For the relevance of this study, all SSA
economies formed part of the population. There are 48 SSA countries and therefore this
was taken as the population of the study (World Bank, 2011).
4.2.2 Unit of analysis
A unit of analysis could be an organisation, system or artefact of the study (Hasan and
Banna, 2010). The research focused on two units of analysis, namely the resilience of an
economy and the vulnerability of an economy. Each of these units of analysis contained
measurements as listed in Table 4.1 and Table 4.2 respectively.
© 2014 University of Pretoria. All rights reserved. The copyright in this work vests in the University of Pretoria.

32
Table 4.1 Resilience unit of analysis
Resilience
Variables Ratio Unit
Capital reserves or stock-piling Reserve-to-GDP ratio Percentage
Economic concentration Economic concentration ratio Index
Table 4.2 Vulnerability unit of analysis
Vulnerability
Variables Ratio Unit
Economic openness Import and export-GDP ratio Percentage
Financial integration Assets and liabilities-to-GDP ratio Percentage
4.2.3 Sampling
According to Saunders and Lewis (2012), a sample is a subgroup of the population or the
selected universe. The selected population of the study was all economies in the SSA
region. This region was selected as a case for study due to the growing FDI activity in the
region, with the region’s global share of FDI rising from 3.2% in 2007 to 5.6% in 2012
(Ernst & Young, 2013). The study was mainly interested in these emerging economies
since they maintain trade partnerships with other economies through these links.
Since a complete list of countries or populations was obtained, probability sampling
techniques were used (Saunders and Lewis, 2012). The total list of countries that were
listed in the population was 48 SSA economies. A systematic probability sampling
technique was selected so that the countries could be ranked according to their
attractiveness to FDI relative to the size of their economies. The study was interested in
assessing the resilience and vulnerabilities of emerging economies by evaluating their
economic performance against exogenous shocks, using the 2007/2008 financial global
crisis as a contextual milieu and their ability to attract FDI inflows under these conditions.
© 2014 University of Pretoria. All rights reserved. The copyright in this work vests in the University of Pretoria.
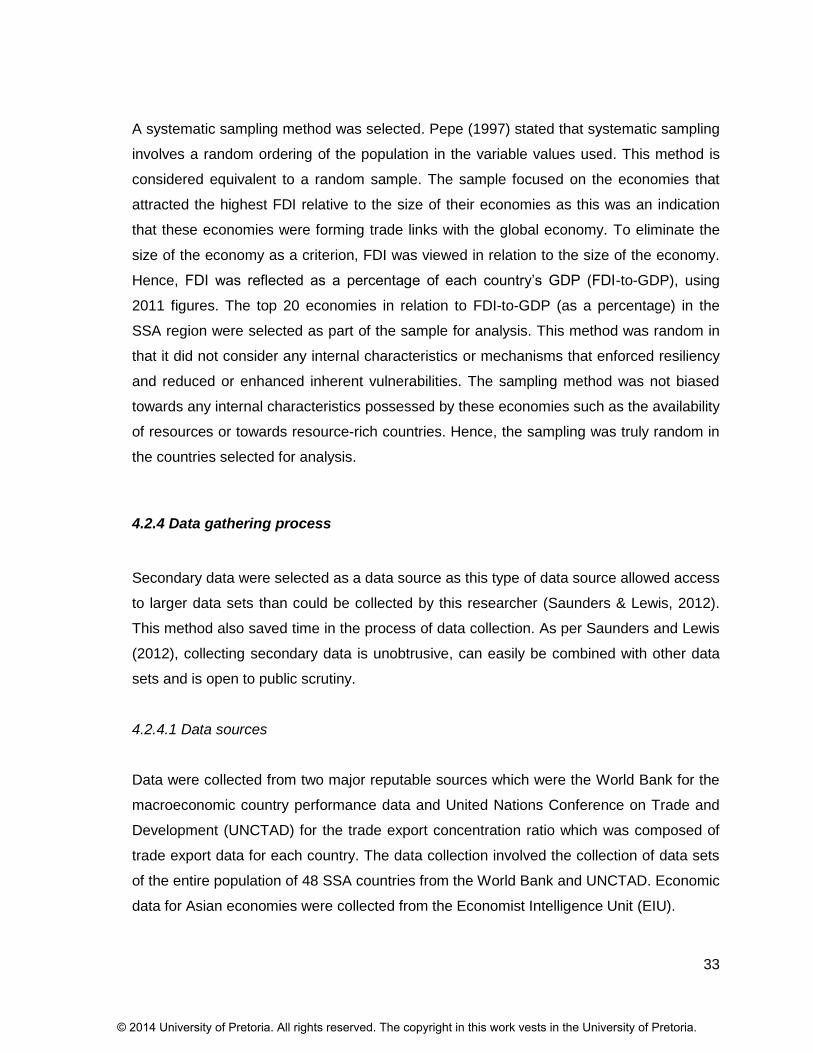
33
A systematic sampling method was selected. Pepe (1997) stated that systematic sampling
involves a random ordering of the population in the variable values used. This method is
considered equivalent to a random sample. The sample focused on the economies that
attracted the highest FDI relative to the size of their economies as this was an indication
that these economies were forming trade links with the global economy. To eliminate the
size of the economy as a criterion, FDI was viewed in relation to the size of the economy.
Hence, FDI was reflected as a percentage of each country’s GDP (FDI-to-GDP), using
2011 figures. The top 20 economies in relation to FDI-to-GDP (as a percentage) in the
SSA region were selected as part of the sample for analysis. This method was random in
that it did not consider any internal characteristics or mechanisms that enforced resiliency
and reduced or enhanced inherent vulnerabilities. The sampling method was not biased
towards any internal characteristics possessed by these economies such as the availability
of resources or towards resource-rich countries. Hence, the sampling was truly random in
the countries selected for analysis.
4.2.4 Data gathering process
Secondary data were selected as a data source as this type of data source allowed access
to larger data sets than could be collected by this researcher (Saunders & Lewis, 2012).
This method also saved time in the process of data collection. As per Saunders and Lewis
(2012), collecting secondary data is unobtrusive, can easily be combined with other data
sets and is open to public scrutiny.
4.2.4.1 Data sources
Data were collected from two major reputable sources which were the World Bank for the
macroeconomic country performance data and United Nations Conference on Trade and
Development (UNCTAD) for the trade export concentration ratio which was composed of
trade export data for each country. The data collection involved the collection of data sets
of the entire population of 48 SSA countries from the World Bank and UNCTAD. Economic
data for Asian economies were collected from the Economist Intelligence Unit (EIU).
© 2014 University of Pretoria. All rights reserved. The copyright in this work vests in the University of Pretoria.
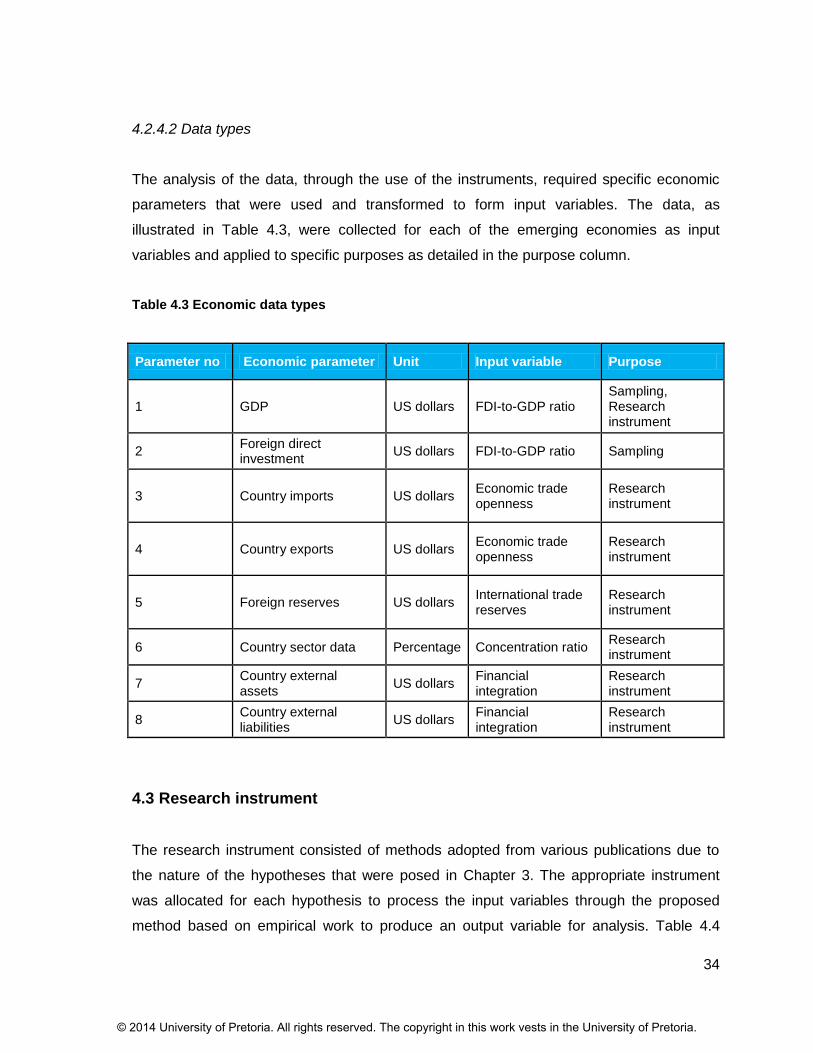
34
4.2.4.2 Data types
The analysis of the data, through the use of the instruments, required specific economic
parameters that were used and transformed to form input variables. The data, as
illustrated in Table 4.3, were collected for each of the emerging economies as input
variables and applied to specific purposes as detailed in the purpose column.
Table 4.3 Economic data types
Parameter no Economic parameter Unit Input variable Purpose
1 GDP US dollars FDI-to-GDP ratio Sampling, Research instrument
2 Foreign direct investment
US dollars FDI-to-GDP ratio Sampling
3 Country imports US dollars Economic trade openness
Research instrument
4 Country exports US dollars Economic trade openness
Research instrument
5 Foreign reserves US dollars International trade reserves
Research instrument
6 Country sector data Percentage Concentration ratio Research instrument
7 Country external assets
US dollars Financial integration
Research instrument
8 Country external liabilities
US dollars Financial integration
Research instrument
4.3 Research instrument
The research instrument consisted of methods adopted from various publications due to
the nature of the hypotheses that were posed in Chapter 3. The appropriate instrument
was allocated for each hypothesis to process the input variables through the proposed
method based on empirical work to produce an output variable for analysis. Table 4.4
© 2014 University of Pretoria. All rights reserved. The copyright in this work vests in the University of Pretoria.

35
summarises the hypotheses, the measurement variables used and the input data used for
each measurement variable.
Table 4.4 Hypotheses variables
Hypothesis no. Hypothesis Measurement variable Input data
1 Accumulation of reserves
International reserves Foreign reserves (US$), GDP (US$)
2 Economic concentration
Herfindahl-Hirchman Index
Economic sector data
3 Trade openness
Trade openness Import (US$), Export (US$), GDP (US$)
4 Financial integration
Financial integration Assets (US$), Liabilities (US$), GDP (US$)
The instruments that were used for each research question are discussed below.
4.3.1 Accumulation of reserves
The instrument that was used to obtain international reserves was that formulated by
Hur and Kondo (2013) where foreign reserves are all foreign assets, except for gold, that
are controlled by the state. The instrument used was formulated by Cheung and Ito (2008)
and was stated as:
=
The input variables to the instrument were the foreign reserves (excluding gold), calculated
as a percentage of GDP at a point in time and measured in US dollars.
4.3.2 Economic concentration
There have been many models developed over the years to measure economic industry
concentration or diversification, for instance the concentration ratio (Rhoades, 2011).
However, the Herfindahl-Hirchman Index (HHI) has become the primary measure that was
© 2014 University of Pretoria. All rights reserved. The copyright in this work vests in the University of Pretoria.

36
developed to measure the concentration of firms or industries in an economy (Calkins,
2002). This instrument was used to measure an economy’s concentration and was
denoted as:
∑( )
The input variables to the instrument were the industry sector sizes of the economy, with
the larger industries contributing more to the Herfindahl-Hirchman Index or concentration
coefficient.
The economic diversification instrument was the inverse of the HHI as stated below:
=
This instrument highlighted the diverse nature of the economy.
4.3.3 Trade openness
Research was conducted by Cheung and Ito (2008) on modelling an instrument that could
be used to measure an economy’s average propensity to import and export, and which
measures the economy’s openness to the global economy. This model was supported by
Down (2007) and determines that trade openness is reflected as imports plus exports as a
percentage of an economy’s GDP. The formula to measure an economy’s trade openness
is stated below:
= ( )
This formula consisted of input variables of an economy’s import, export and GDP values
measured in US dollars.
© 2014 University of Pretoria. All rights reserved. The copyright in this work vests in the University of Pretoria.

37
4.3.4 Financial integration
The model that was constructed to measure financial integration was developed by Lane
and Milesi-Ferretti (2006) and offered a volume-based measure of international financial
integration. This instrument was further developed by Choi et al. (2009) to estimate the
effects of financial integration on emerging economies. The instrument is stated below:
= ( )
This instrument consisted of input variables of the stock of external assets (FA), as
measured by the current account balance (Lane and Milesi-Ferretti, 2003) with the stock of
external liabilities (FL) and the economy’s GDP, as measured in dollars.
4.4 Validity and reliability
Validity of the research methodology refers to the accuracy of the method used to
measure what it is supposed to measure, while reliability refers to the consistency of the
results should the process of measurement be repeated (Saunders & Lewis, 2012). The
evaluation of vulnerability and resilience of emerging economies against exogenous
shocks was evaluated in the context of the FDI that SSA economies were able to attract as
this singularity reflected the economies’ integration into the global economy and is one of
the factors that drives economic growth in these economies.
The performance of the SSA economies’ vulnerability and resilience against exogenous
shocks was evaluated in the context of the recent financial global crisis that affected all
economies across all continents. Table 4.5 summarises the evaluation of the research
methodology’s validity and reliability.
© 2014 University of Pretoria. All rights reserved. The copyright in this work vests in the University of Pretoria.

38
Table 4.5 Validity and reliability evaluation
Factor Evaluation
Subject Selection
Size of the countries’ GDP was not a factor, along with the internal structuring of the economies
History There are no specific events that occurred during the history of the research
Testing Quantitative data were collected over the same period from the same sources (World Bank, UNCTAD) for all countries sampled
Subject error Data were collected over the same period
Subject bias Data reflected quantitatively from the input data to the output data
4.5 Data analysis approach
Data analysis was performed using two methods for each hypothesis. The output
measurement of the impact of the exogenous shocks was based on the economies’ output
GDP. Hence, this was treated as an independent variable for both approaches. The first
method of regression analysis determined whether there was a relationship between each
of the four hypotheses. The second method of multiple correlation analysis determined the
strength of correlation between each of the four independent variables and the dependent
variable, namely the GDP output.
4.5.1 Regression analysis
Weiers (2010) stated that regression analysis provides a “best fit” mathematical equation
for two variables. This type of regression analysis involved the use of a dependent (y) and
independent (x) variable to perform correlation analysis, of which the strength of the
relationship between the variables was measured. As mentioned by Weiers (2010), since
the research study was evaluating multiple variables, a multiple regression and correlation
approach was more appropriate and was used for the analysis.
A linear relationship was examined with economic GDP growth as the dependent variable
and the four variables as independent variables. The multiple regression analysis was
computed as reflected in Table 4.6.
© 2014 University of Pretoria. All rights reserved. The copyright in this work vests in the University of Pretoria.

39
Table 4.6 Multiple regression table
Dependent variable (y) Independent variables (x's)
GDP growth
International reserves
Economic concentration
Trade openness
Financial integration
Each of the linear multiple regression tests were computed at a 95% confidence level to
test for significance of the variables in determining the output GDP growth.
4.5.2 Multiple correlation analysis
The coefficient of multiple determinations (R2) was calculated as the variation in the GDP
growth (dependent variable) that was explained by the multiple regression equation with
the independent variables (Weiers, 2010). The R2 was calculated for each of the sample
SSA countries over a period of 17 years, from 1995 to 2011, using the multiple regression
equation to evaluate which of these economies’ GDP growth rate was explained by the
four independent variables.
4.5.3 Multicollinearity
Multicollinearity occurs when one or more independent variables are highly correlated with
one another in a multiregression analysis (Ethington, 2005). This was a critical
phenomenon in that highly correlated independent variables caused by type 2 errors in the
interpretation of the regression analysis result, and this may lead to inaccurate coefficients
estimates and standard errors which may lead to inference errors (Grewal, Cote &
Baumgarter, 2002). Lynch (2003) used the variance inflation factor (VIF) to explore the
issue of multicollinearity as highly correlated independent variables will render the VIF very
large. Lynch (2003) indicated a threshold VIF value of 10 to be the threshold value for
independent value correlation which corresponds to an R2 regression of 0.9 correlation
value. Beyond this value, the regression becomes unstable as illustrated in Figure 4.1.
© 2014 University of Pretoria. All rights reserved. The copyright in this work vests in the University of Pretoria.

40
The VIF value used as a threshold to detect multicollinearity was defined as 10 and any
variable equivalent to an R2 of 0.9 was removed from the regression analysis to minimise
multicollinearity.
Figure 4.1 Multicollinearity VIF
4.6 Research limitations
There were limitations to using secondary data for the research in that the data might not
be completely suitable for the research hypotheses and would have to be processed
through various research instruments since the data were originally collected for a different
purpose to this research study. In addition, there might also be questions around how the
data were collected by the sources (Saunders & Lewis, 2012). The research also focused
on SSA economies in the context of inward FDI to assess the resilience and vulnerability
of these economies. As such, the selection criteria might not be applicable to all emerging
economies since the selected emerging economies attracted high levels of inward FDI.
© 2014 University of Pretoria. All rights reserved. The copyright in this work vests in the University of Pretoria.

41
Chapter 5 Results
5.1 Introduction
Chapter 4 detailed the methodology that was used to collect and analyse the data. This
chapter presents the results and findings of the collected data, and also presents results
based on the hypotheses posed in Chapter 3. The secondary data were collected from
credible sources, namely the World Bank, the United Nations Conference on Trade and
Development (UNCTAD) and the Economic Intelligence Unit (EIU).
The aim of the research study was to evaluate emerging economy resilience to and
vulnerability against adverse economic shocks using the SSA region as the case in point.
A sample was used of 20 performing countries in terms of attracting FDI as a percentage
of each economy’s GDP. This removed the bias of focusing only on the size of the
economies. In addition, the research study was undertaken against the backdrop of the
importance of attracting FDI and maintaining return on investment through measures that
seek to address economic structural issues pertaining to the economies’ resilience to and
vulnerabilities against exogenous economic shocks.
The data were collected and analysed over a 17-year period from 1995 to 2011. The 17-
year period allowed the study to track the economic changes through the various phases
within the context of global economic performance, including important periods such as the
most recent global recession. The data also allowed the study to evaluate the trends of
these economies with respect to trade openness, financial integration in the global
economy, economic or GDP growth, and trade diversification. These were important
issues to explore and form part of the rationalising of the results in Chapter 6 as well as
the recommendations for the SSA region in improving economic resilience while reducing
vulnerability against shocks that are beyond their sphere of control.
The next section describes the economic trends observed from the collected data for the
SSA region as a collective.
© 2014 University of Pretoria. All rights reserved. The copyright in this work vests in the University of Pretoria.

42
5.2 Descriptive statistics: The sub-Saharan African (SSA) region
This section describes the economic performance trends for the SSA region as a whole
over a 17-year period (1995 to 2011) for the 20 selected countries. Figure 5.1 illustrates
the SSA sampled countries based on their FDI-to-GDP ratio. Refer to Appendix A for
detailed figures.
Figure 5.1 Sample country list
5.2.1 GDP growth
The collected dataset of 20 SSA economies over a 17-year period indicated boom-bust
economic growth with mild volatility levels during the period under observation. It was
evident from the mid- to late 1990s that SSA economies’ GDP output reached levels as
high as 10%. However, there was an immense decline in 2001 with GDP levels dropping
© 2014 University of Pretoria. All rights reserved. The copyright in this work vests in the University of Pretoria.

43
as low as 3% before a recovery of around 6% during the first decade of the twenty-first
century.
There was a decline in economic growth across SSA economies during the 2008/2009
global recession although the impact appears to be less than the slump of 2001/2002 as a
result of the recession in the US economy, as demonstrated in Figure 5.2.
Figure 5.2 Average sub-Saharan African economies’ GDP growth
According to Figure 5.3, it was evident from the data collected that GDP levels for the
sampled SSA economies from the mid-1990s to the early twenty-first century were
stagnant based on the average mean of these economies. From the early 2000s, SSA
economies experienced sharp increases in the sizes of their GDPs with slight GDP
contractions in 2009 due to the global financial crisis with signs of economic recovery from
2010.
© 2014 University of Pretoria. All rights reserved. The copyright in this work vests in the University of Pretoria.

44
Figure 5.3 Average sub-Saharan African economies’ GDP
5.2.2 Trade openness
The dataset collected revealed that imports in the SSA economies coincided with their
economic growth levels as imports experienced a sharp increase from the early 2000s
until the economic recession in 2008/2009, according to the dataset compiled in Figure
5.4.
As illustrated in Figure 5.4, trade exports revealed similar trends to imports as SSA
economies started exporting more commodities and services to the global economy from
mid-2000. However, it appeared that exports from these economies were affected slightly
more than imports as SSA economies traded with the global economy that demanded less
of their products. As of 2011, the data revealed that SSA economies’ imports and exports
had fully recovered and were well above the previous levels prior to the global recession
even though they were now importing more than they were exporting.
© 2014 University of Pretoria. All rights reserved. The copyright in this work vests in the University of Pretoria.
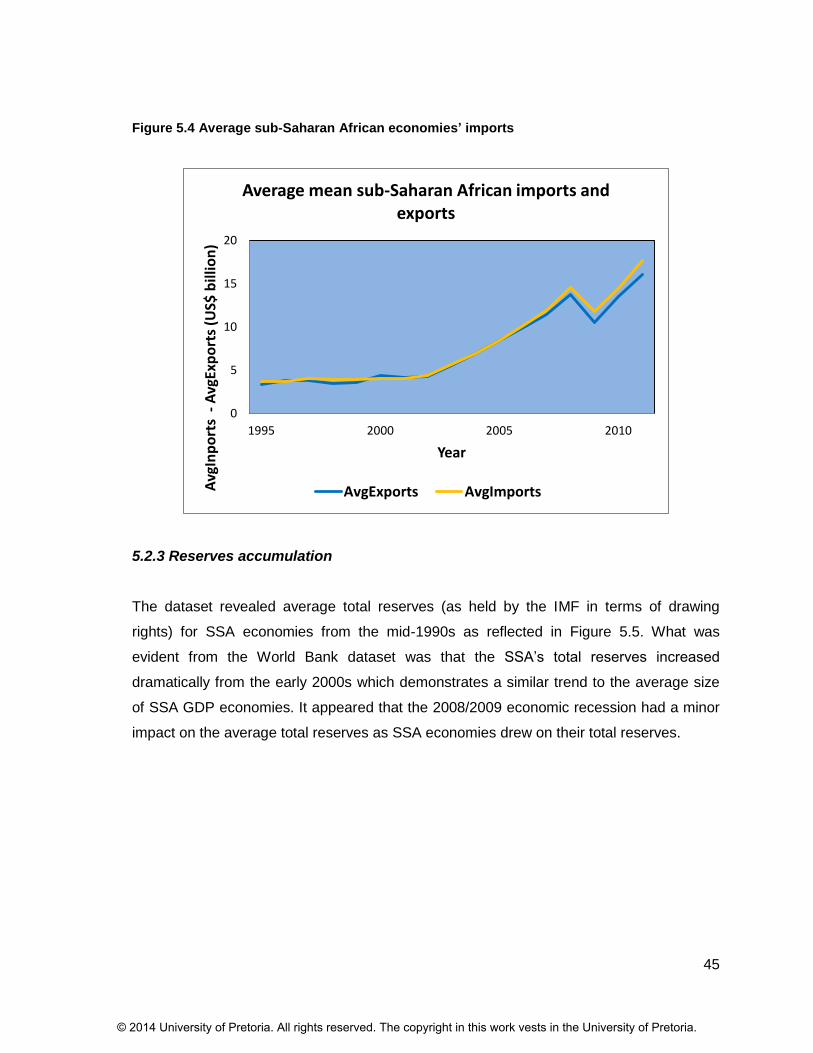
45
Figure 5.4 Average sub-Saharan African economies’ imports
5.2.3 Reserves accumulation
The dataset revealed average total reserves (as held by the IMF in terms of drawing
rights) for SSA economies from the mid-1990s as reflected in Figure 5.5. What was
evident from the World Bank dataset was that the SSA’s total reserves increased
dramatically from the early 2000s which demonstrates a similar trend to the average size
of SSA GDP economies. It appeared that the 2008/2009 economic recession had a minor
impact on the average total reserves as SSA economies drew on their total reserves.
0
5
10
15
20
1995 2000 2005 2010
Avg
Inp
ort
s -
Avg
Exp
ort
s (U
S$ b
illio
n)
Year
Average mean sub-Saharan African imports and exports
AvgExports AvgImports
© 2014 University of Pretoria. All rights reserved. The copyright in this work vests in the University of Pretoria.

46
Figure 5.5 Average sub-Saharan African economies’ total reserves
5.2.4 Financial integration
The collected dataset suggested that SSA economies were functioning with trade deficits,
based on the country mean average, until the year 2000. According to Figure 5.6, in 2005,
however, the SSA economies had, on mean average, the highest trade surplus and had
accumulated significant external assets of approximately US$1 billion. Since 2007, the
World Bank data indicated that the SSA economies have been running average mean
trade deficits and there is no sign of the current account balance turning positive as the
trend indicates that these economies are continuing to have trade deficits. This could be
attributed to the flow of FDI into these economies.
© 2014 University of Pretoria. All rights reserved. The copyright in this work vests in the University of Pretoria.

47
Figure 5.6 Average sub-Saharan African economies’ current account trade balance
According to Figure 5.7, SSA economies’ average external debt stocks have been on the
rise for the past 17 years. The early 2000s and late 2000s dataset suggested a slight curb
on external debt levels with an exponential increase in debt levels on average for SSA
economies.
© 2014 University of Pretoria. All rights reserved. The copyright in this work vests in the University of Pretoria.

48
Figure 5.7 Average sub-Saharan African economies’ external debt stock
5.2.5 Concentration ratio
The concentration ratio data (UNCTAD, 2012) that detailed the lack of export
diversification in SSA individual economies revealed highly concentrated economies in
1995. By the early 2000s, the average concentration ratio had decreased by a quarter,
suggesting that SSA economies had diversified their export sectors. Throughout the mid-
2000s, the data revealed that the concentration ratio had increased and by 2010 it had
dropped to its lowest levels throughout the SSA economies, according to Figure 5.8.
© 2014 University of Pretoria. All rights reserved. The copyright in this work vests in the University of Pretoria.
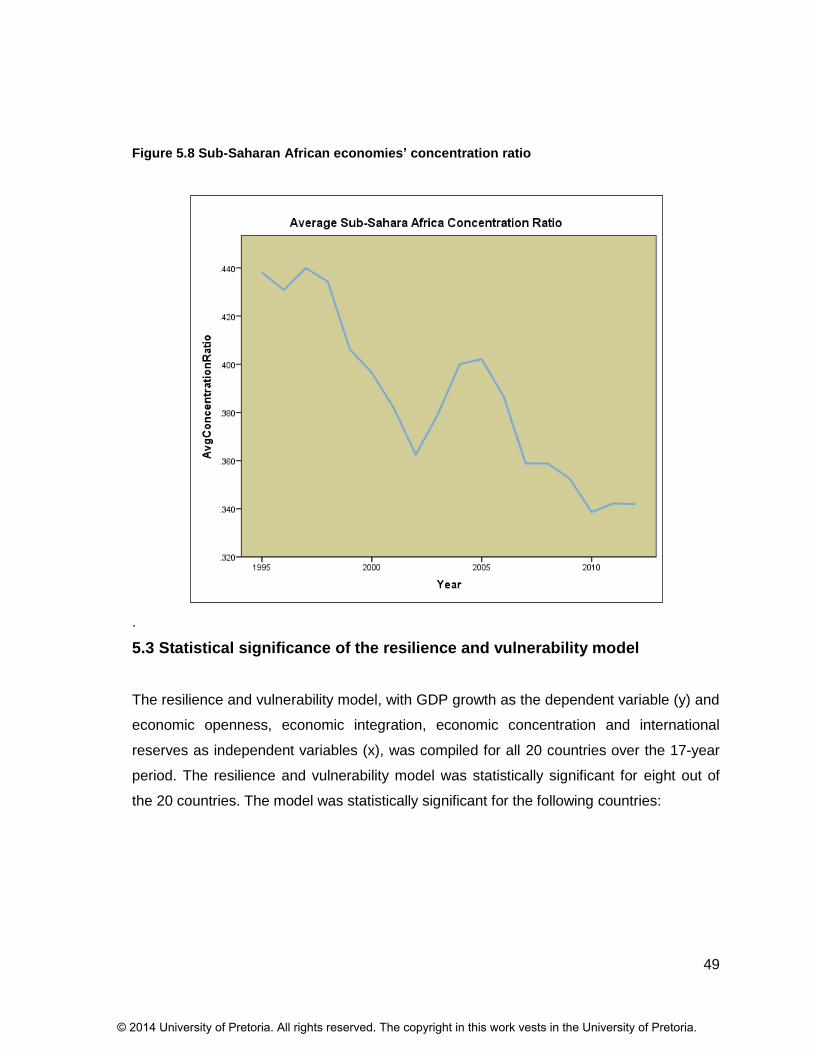
49
Figure 5.8 Sub-Saharan African economies’ concentration ratio
.
5.3 Statistical significance of the resilience and vulnerability model
The resilience and vulnerability model, with GDP growth as the dependent variable (y) and
economic openness, economic integration, economic concentration and international
reserves as independent variables (x), was compiled for all 20 countries over the 17-year
period. The resilience and vulnerability model was statistically significant for eight out of
the 20 countries. The model was statistically significant for the following countries:
© 2014 University of Pretoria. All rights reserved. The copyright in this work vests in the University of Pretoria.

50
Mauritius – International reserves removed
The model was statistically significant for Mauritius with a statistical significance of 0.0001 at a 95% confidence level (0.0001 < 0.05)
with a correlation of 0.791.
Model summary
Model R R2 Adjusted R
2 Std. error of the
estimate Change statistics
country = Mauritius
R2 change F change df1 df2 Sig. F change
1 .911a .830 .791 .86415 .830 21.182 3 13 .000
Cape Verde – International reserves and financial integration removed
The model was statistically significant for Cape Verde with a statistical significance of 0.023 at a 95% confidence level (0.023 < 0.05)
with a correlation of 0417.
Model summary
Model R R2 Adjusted R
2 Std. error of the
estimate Change statistics
country = Cape_Verde
R2 change F change df1 df2 Sig. F change
1 .646a .417 .334 1.74794 .417 5.003 2 14 .023
© 2014 University of Pretoria. All rights reserved. The copyright in this work vests in the University of Pretoria.

51
Lesotho – Trade openness and international reserves removed
The model was statistically significant for Lesotho with a statistical significance of 0.001 at a 95% confidence level (0.001 < 0.05)
with a correlation of 0.623.
Model summary
Model R R2 Adjusted R
2 Std. error of the
estimate Change statistics
country = Lesotho
R2 change F change df1 df2 Sig. F change
1 .789a .623 .569 1.09824 .623 11.566 2 14 .001
Mozambique – International reserves removed
The model was statistically significant for Mozambique with a statistical significance of 0.002 at a 95% confidence level (0.002 <
0.05) with a correlation of 0.66.
Model summary
Model R R2 Adjusted R
2 Std. error of the
estimate Change statistics
country = Mozambique
R2 change F change df1 df2 Sig. F change
1 .813a .660 .582 1.71559 .660 8.423 3 13 .002
© 2014 University of Pretoria. All rights reserved. The copyright in this work vests in the University of Pretoria.

52
Nigeria
The model was statistically significant for Nigeria with a statistical significance of 0.006 at a 95% confidence level (0.006 < 0.05) with
a correlation of 0.673.
Model summary
Model R R2 Adjusted R
2 Std. error of the
estimate Change statistics
country = Nigeria R2 change F change df1 df2 Sig. F change
1 .820a .673 .564 1.90957 .673 6.168 4 12 .006
Tanzania
The model was statistically significant for Tanzania with a statistical significance of 0.0001 at a 95% confidence level (0.0001 < 0.05)
with a correlation of 0.833.
Model summary
Model R R2 Adjusted R
2 Std. error of the
estimate Change statistics
country = Tanzania
R2 change F change df1 df2 Sig. F change
1 .913a .833 .777 .69220 .833 14.963 4 12 .000
© 2014 University of Pretoria. All rights reserved. The copyright in this work vests in the University of Pretoria.

53
Uganda – Trade openness removed
The model was statistically significant for Uganda with a statistical significance of 0.0001 at a 95% confidence level (0.0001 < 0.05) with
a correlation of 0.904.
Model summary
Model R R2 Adjusted R
2 Std. error of the
estimate Change statistics
country = Uganda R2 change F change df1 df2 Sig. F change
1 .951a .904 .881 .74761 .904 40.610 3 13 .000
Ghana – International reserves and financial integration removed
The model was statistically significant for Ghana with a statistical significance of 0.009 at a 95% confidence level (0.009 < 0.05) with
a correlation of 0.492.
Model summary
Model R R2 Adjusted R
2 Std. error of the
estimate Change statistics
country = Ghana R2 change F change df1 df2 Sig. F change
1 .701a .492 .419 1.99326 .492 6.772 2 14 .009
© 2014 University of Pretoria. All rights reserved. The copyright in this work vests in the University of Pretoria.

54
5.4 Hypothesis testing
Chapter 3 described four hypotheses to be tested for resilience and vulnerability in
emerging economies using SSA countries to test the hypotheses. The discussion below
describes the results of the four tests that were conducted as well as the results from the
hypotheses.
5.4.1 Hypothesis 1
5.4.1.1 Testing of accumulation of international reserves
The first hypothesis tested whether the accumulation of international reserves of emerging
economies was a form of resilience against exogenous shocks. For this test, linear
regression was used to test the impact of international reserves as an independent
variable and the emerging economies’ GDP output as the dependent variable. Below are
the two hypotheses:
Null hypothesis ( ):
Accumulating international reserves or stock-piling is a useful means of building resilience
for emerging economies.
Alternative hypothesis ( ):
Accumulating international reserves or stock-piling is not a useful means of building
resilience for emerging economies.
5.4.1.2 Hypothesis 1: Testing results
The results for hypothesis testing for international reserves or stock-piling as a useful
means of building resilience as the NULL hypothesis are presented on Table 5.1 for each
country. Refer to Appendix B for detailed results.
© 2014 University of Pretoria. All rights reserved. The copyright in this work vests in the University of Pretoria.

55
Table 5.1 Hypothesis 1: Summary
Country Statistical significance (α)
p-value Result
Liberia 0.05 0.984 NULL hypothesis rejected
Sierra Leone 0.05 0.966 NULL hypothesis rejected
Guinea 0.05 0.994 NULL hypothesis rejected
Namibia 0.05 0.22 NULL hypothesis rejected
Sudan 0.05 0.555 NULL hypothesis rejected
Uganda 0.05 0.00005 Failed to reject NULL hypothesis
Tanzania 0.05 0.068 NULL hypothesis rejected
Zambia 0.05 0.778 NULL hypothesis rejected
Nigeria 0.05 0.636 NULL hypothesis rejected
Morocco 0.05 0.907 NULL hypothesis rejected
Ethopia 0.05 0.988 NULL hypothesis rejected
Rwanda 0.05 0.278 NULL hypothesis rejected
South Africa 0.05 0.274 NULL hypothesis rejected
5.4.2 Hypothesis 2
5.4.2.1 Testing of economic concentration
The second hypothesis tested whether the reduction of the export economic concentration
of emerging economies was a form of resilience against exogenous shocks. For this test,
linear regression was used to test the impact of economic concentration as an
independent variable and the emerging economies’ GDP output as the dependent
variable. Below are the two hypotheses:
Null hypothesis ( ):
Reducing economic concentration is a useful means of building resilience for emerging
economies.
© 2014 University of Pretoria. All rights reserved. The copyright in this work vests in the University of Pretoria.

56
Alternative hypothesis ( ):
Reducing economic concentration is not a useful means of building resilience for emerging
economies.
5.4.2.2 Hypothesis 2: Testing results
The results for hypothesis testing for reducing export economic concentration as a useful
means of building resilience as the NULL hypothesis are presented in Table 5.2 for each
country. Refer to Appendix C for detailed results.
Table 5.2 Hypothesis 2: Summary
Country Statistical significance (α) p-value Result
Mauritius 0.05 0.021 Failed to reject NULL hypothesis
Liberia 0.05 0.349 NULL hypothesis rejected
Sierra Leone 0.05 0.578 NULL hypothesis rejected
Guinea 0.05 0.978 NULL hypothesis rejected
Mozambique 0.05 0.861 NULL hypothesis rejected
Ghana 0.05 0.759 NULL hypothesis rejected
Namibia 0.05 0.388 NULL hypothesis rejected
Lesotho 0.05 0.861 NULL hypothesis rejected
Cape Verde 0.05 0.335 NULL hypothesis rejected
Sudan 0.05 0.143 NULL hypothesis rejected
Gambia 0.05 0.824 NULL hypothesis rejected
Uganda 0.05 0.149 NULL hypothesis rejected
Tanzania 0.05 0.976 NULL hypothesis rejected
Zambia 0.05 0.893 NULL hypothesis rejected
Nigeria 0.05 0.799 NULL hypothesis rejected
Ethiopia 0.05 0.454 NULL hypothesis rejected
Rwanda 0.05 0.561 NULL hypothesis rejected
South Africa 0.05 0.638 NULL hypothesis rejected
© 2014 University of Pretoria. All rights reserved. The copyright in this work vests in the University of Pretoria.

57
5.4.3 Hypothesis 3
5.4.3.1 Testing of trade openness
The third hypothesis tested whether the degree of openness to trade in emerging
economies rendered the economy vulnerable to exogenous shocks. For this test, linear
regression was used to test the impact of openness of an economy as an independent
variable and the emerging economies’ GDP output as the dependent variable. Below are
the two hypotheses:
Null hypothesis ( ):
Trade openness to the global economy does not render emerging economies vulnerable to
exogenous shocks.
Alternative hypothesis ( ):
Trade openness to the global economy renders emerging economies vulnerable to
exogenous shocks.
5.4.3.2 Hypothesis 3: Testing results
The results for hypothesis testing for trade openness showed that this phenomenon does
not result in economic vulnerability as shown by the NULL hypotheses presented in Table
5.3 for each country. Refer to Appendix D for detailed results.
© 2014 University of Pretoria. All rights reserved. The copyright in this work vests in the University of Pretoria.
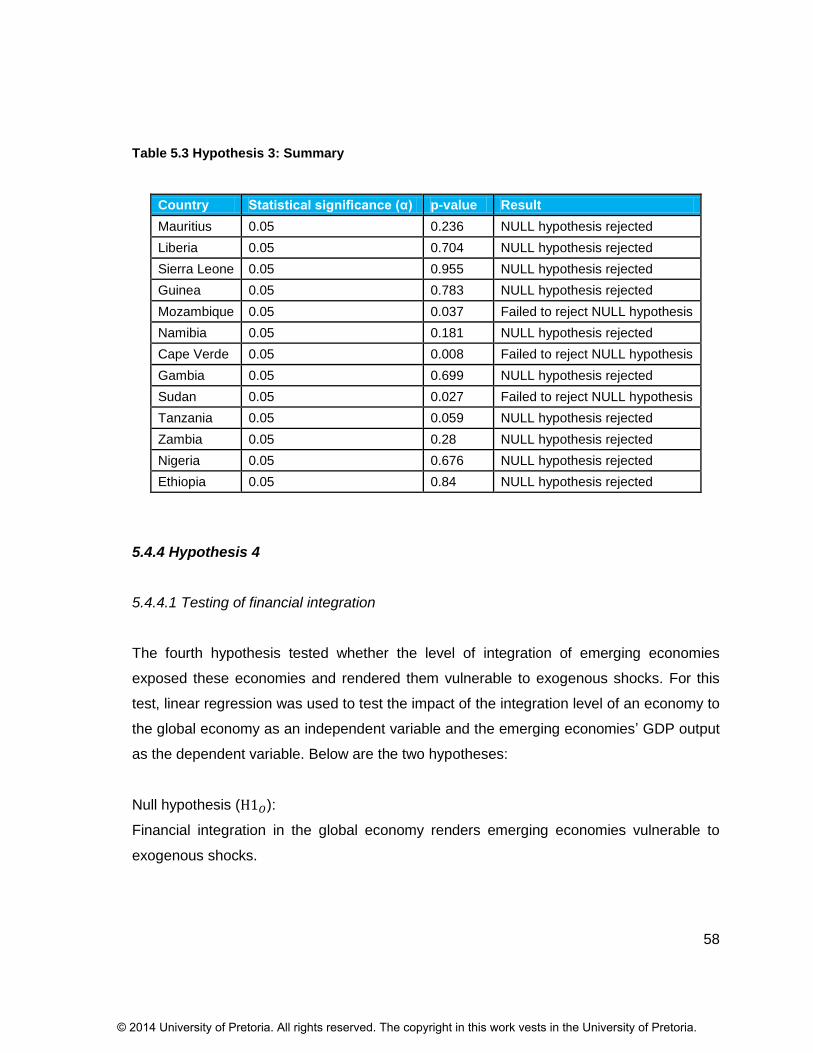
58
Table 5.3 Hypothesis 3: Summary
Country Statistical significance (α) p-value Result
Mauritius 0.05 0.236 NULL hypothesis rejected
Liberia 0.05 0.704 NULL hypothesis rejected
Sierra Leone 0.05 0.955 NULL hypothesis rejected
Guinea 0.05 0.783 NULL hypothesis rejected
Mozambique 0.05 0.037 Failed to reject NULL hypothesis
Namibia 0.05 0.181 NULL hypothesis rejected
Cape Verde 0.05 0.008 Failed to reject NULL hypothesis
Gambia 0.05 0.699 NULL hypothesis rejected
Sudan 0.05 0.027 Failed to reject NULL hypothesis
Tanzania 0.05 0.059 NULL hypothesis rejected
Zambia 0.05 0.28 NULL hypothesis rejected
Nigeria 0.05 0.676 NULL hypothesis rejected
Ethiopia 0.05 0.84 NULL hypothesis rejected
5.4.4 Hypothesis 4
5.4.4.1 Testing of financial integration
The fourth hypothesis tested whether the level of integration of emerging economies
exposed these economies and rendered them vulnerable to exogenous shocks. For this
test, linear regression was used to test the impact of the integration level of an economy to
the global economy as an independent variable and the emerging economies’ GDP output
as the dependent variable. Below are the two hypotheses:
Null hypothesis ( ):
Financial integration in the global economy renders emerging economies vulnerable to
exogenous shocks.
© 2014 University of Pretoria. All rights reserved. The copyright in this work vests in the University of Pretoria.

59
Alternative hypothesis ( ):
Financial integration to the global economy does not render emerging economies
vulnerable to exogenous shocks.
5.4.4.2 Hypothesis 4: Testing results
The results for hypothesis testing showed that the level of financial integration level has an
impact on emerging economies as the NULL hypotheses are presented in Table 5.4 for
each country. Refer to Appendix E for detailed results.
Table 5.4 Hypothesis 4: Summary
Country Statistical significance (α) p-value Result
Mauritius 0.05 0.001 Failed to reject NULL hypothesis
Liberia 0.05 0.794 NULL hypothesis rejected
Sierra Leone 0.05 0.828 NULL hypothesis rejected
Mozambique 0.05 0.053 Failed to reject NULL hypothesis
Ghana 0.05 0.007 Failed to reject NULL hypothesis
Lesotho 0.05 0 Failed to reject NULL hypothesis
Cape Verde 0.05 0.168 NULL hypothesis rejected
Sudan 0.05 0 Failed to reject NULL hypothesis
Uganda 0.05 0 Failed to reject NULL hypothesis
Tanzania 0.05 0.005 Failed to reject NULL hypothesis
Zambia 0.05 0.644 NULL hypothesis rejected
Nigeria 0.05 0.015 Failed to reject NULL hypothesis
Morocco 0.05 0.562 NULL hypothesis rejected
5.5 Multicollinearity results
Multicollinearity tests were conducted and a number of economic parameters were found
to be highly correlated and were removed from the multiregression model. As indicated in
the methodology section in Chapter 4, an independent variable with an R2 of 0.9
© 2014 University of Pretoria. All rights reserved. The copyright in this work vests in the University of Pretoria.

60
introduced multicollinearity in the model and was therefore removed. Table 5.5 illustrates
all the independent variables that were removed due to multicollinearity for each country.
Refer to Appendix F for detailed results.
Table 5.5 Removed economic parameters
Country International reserves
Economic concentration
Trade openness
Financial integration
Mauritius X
Mozambique X
Ghana X X
Lesotho X X
Cape Verde X X
Namibia X
Gambia, The X X
Nigeria
Morocco X X
Rwanda X
South Africa X
© 2014 University of Pretoria. All rights reserved. The copyright in this work vests in the University of Pretoria.

61
5.6 Summary of hypotheses results
Table 5.6 summarises all results from the hypotheses tests that were performed.
Table 5.6 Summary of hypotheses results
Country Hypothesis 1 Reserves Hypothesis 2 Concentration Hypothesis 3 Openness Hypothesis 4 Integration
Mauritius Failed to reject NULL hypothesis NULL hypothesis rejected Failed to reject NULL hypothesis
Liberia NULL hypothesis rejected NULL hypothesis rejected NULL hypothesis rejected NULL hypothesis rejected
Sierra Leone NULL hypothesis rejected NULL hypothesis rejected NULL hypothesis rejected NULL hypothesis rejected
Guinea NULL hypothesis rejected NULL hypothesis rejected NULL hypothesis rejected Failed to reject NULL hypothesis
Mozambique NULL hypothesis rejected Failed to reject NULL hypothesis NULL hypothesis rejected
Ghana NULL hypothesis rejected Failed to reject NULL hypothesis
Namibia NULL hypothesis rejected NULL hypothesis rejected NULL hypothesis rejected
Lesotho NULL hypothesis rejected Failed to reject NULL hypothesis
Cape Verde NULL hypothesis rejected Failed to reject NULL hypothesis
Sudan NULL hypothesis rejected NULL hypothesis rejected Failed to reject NULL hypothesis Failed to reject NULL hypothesis
Uganda Failed to reject NULL hypothesis NULL hypothesis rejected NULL hypothesis rejected Failed to reject NULL hypothesis
Tanzania NULL hypothesis rejected NULL hypothesis rejected NULL hypothesis rejected Failed to reject NULL hypothesis
Zambia NULL hypothesis rejected NULL hypothesis rejected NULL hypothesis rejected NULL hypothesis rejected
Gambia, The NULL hypothesis rejected NULL hypothesis rejected
Nigeria NULL hypothesis rejected NULL hypothesis rejected NULL hypothesis rejected Failed to reject NULL hypothesis
Morocco NULL hypothesis rejected NULL hypothesis rejected
Ethiopia NULL hypothesis rejected NULL hypothesis rejected NULL hypothesis rejected NULL hypothesis rejected
Rwanda NULL hypothesis rejected NULL hypothesis rejected NULL hypothesis rejected
South Africa NULL hypothesis rejected NULL hypothesis rejected NULL hypothesis rejected
© 2014 University of Pretoria. All rights reserved. The copyright in this work vests in the University of Pretoria.

62
CHAPTER 6 Discussion of results
6.1 Introduction
Chapter 3 formulated hypotheses that were evaluated against a sample of 20 SSA
countries. The research methodology used for the evaluation of the hypotheses was
formulated in Chapter 4. The data results were presented in Chapter 5.
The aim of this chapter is to draw conclusions based on the results presented in Chapter 5
and also to gain a better understanding of these results. The overall objective of this
research study was to evaluate emerging economy resilience to and vulnerability against
adverse economic shocks through the use of four specific macroeconomic determinants
based on previous emerging economy research. These determinants were used and
applied to a sample of 20 SSA economies that attracted a significant amount of FDI in
relation to their size of economies.
The period under evaluation was from 1995 to 2011 (17 years). This was largely
determined by the availability of the data that were required to evaluate the stated
hypotheses in Chapter 3, specifically the concentration ratio that was compiled by the
UNCTAD based on the sector export concentration for SSA countries. This data collection
commenced in 1995.
6.2 Hypothesis 1 discussion: Accumulation of international reserves
The first hypothesis stated:
H1: Accumulating international reserves or stock-piling is a useful means of
building resilience for emerging economies.
The accumulation of international reserves has been observed in emerging economies
recently as a means of creating a barrier against exogenous shocks (Choi et al., 2009).
This trend has been noticed with regard to many emerging economies, more specifically
the Asian economies after the 1997 Asian financial crisis. Choi et al. (2009) noted that
© 2014 University of Pretoria. All rights reserved. The copyright in this work vests in the University of Pretoria.
63
relative to the size of their economies, these emerging economies had accumulated more
reserves than most developed economies. Demir (2009) attributed some reasons for the
stock-piling of international reserves to the volatility of international markets, mainly in the
prices of commodity goods which severely affected emerging economies. Emerging
economies are particularly vulnerable to these changes due to their dependence on
commodities which are susceptible to price and demand factors.
Choi et al. (2009) also attributed the international reserve accumulation to the emerging
economies not having access to capital at relatively low costs as compared to advanced
economies. Hence, the international reserve accumulation brings forth the critical issue of
access to capital access when required as a result of exogenous shocks being
experienced by these economies. However, it was advocated that emerging economies
resist stock-piling of international reserves and instead increase the amount of borrowing
by means of a shift to the economy’s tradable sector in order to relax borrowing constraints
(Korinek, 2011).
A sample of 20 SSA countries was evaluated for the hypothesis to test whether the
accumulation of international reserves has a statistically significant positive influence on
SSA economies’ economic performance. Six countries were removed from the analysis of
this parameter due to multicollinearity in the regression model. Thirteen of the evaluated
economies rejected the NULL hypothesis (p-value > 0.05) with only Uganda failing to
reject the NULL hypothesis. These results suggested that the accumulation of international
reserves did not provide a useful mechanism for the building of resiliency for SSA
economies.
6.2.1 Evaluation of economic performance
Time-series data analysis over the 17-year period (from 1995 until 2011) for international
reserves accumulation indicated that SSA economies accumulated minimal international
reserves and have been running current account deficits since 2007 as illustrated in Figure
6.1, showing mean average international reserves for each country. A time-series analysis
© 2014 University of Pretoria. All rights reserved. The copyright in this work vests in the University of Pretoria.

64
plotted on the same graph indicated a significant and increasing amount of international
reserves. There was a sharp decrease of these reserves during the 2008/09 financial
global crisis, which indicated that these reserves were tapped into as a form of resilience
mechanism. As illustrated in Figure 6.1, SSA economies did not have international
reserves to dampen the impact of the 2008/09 financial global crisis compared with the
Asian Tigers which successfully utilised reserves as a barrier against sudden shortages of
capital (Choi et al., 2009). This would explain the insignificance of international reserves as
a form of resilience against exogenous shocks for SSA economies.
Figure 6.1 Hypothesis 1: Mean average current account balance
Even though international reserve accumulation was statistically insignificant for SSA
economies, spurious positive standardised coefficients mean average of 0.23 indicated
that international reserves do not have a significant influence on the dependent variable,
the economic growth. Rather, Figure 6.2 indicated that SSA economies relied heavily on
increasing their debt stock to cushion the impact of the 2008/09 global financial crisis even
in the aftermath of the crisis.
© 2014 University of Pretoria. All rights reserved. The copyright in this work vests in the University of Pretoria.

65
Figure 6.2 Hypothesis 1: Mean average external debt stock
6.2.2 Summary of hypothesis findings
From the analysis, it is evident that the concept of utilising international reserves as a
resilience factor against exogenous shocks was found not to be applicable. This suggests
that SSA economies did not build up sufficient international reserves when compared with
other emerging economies such as the Asian Tigers as demonstrated in Figure 6.1. Choi
et al. (2009) suggested that emerging economies build up international reserves on which
they could draw in the event of an exogenous shock. The research concluded that the
international reserves accumulation by the Asian economies was due to the economies
not being able to access funding like the developed economies. However, this conclusion
was not substantiated for the SSA economies in that they did not use this measure as a
form of resilience. Korinek (2011) suggestion that emerging economies decrease the
amount of international reserves in favour of borrowing was evidenced by these
economies.
© 2014 University of Pretoria. All rights reserved. The copyright in this work vests in the University of Pretoria.

66
6.3 Hypothesis 2 discussion: Economic concentration
The second hypothesis stated:
H2: Reducing economic concentration is a useful means of building economic
resilience for emerging economies.
It has been argued that economic diversification in terms of exports from an emerging
economy is a form of resilience and protects an emerging economy from exogenous
shocks (Hosein, 2010). This is largely due to the heavy reliance of emerging economies on
minerals and natural resources (Eichengreen, 2002). Exogenous shocks are exerted in
two forms on these emerging economies, the first being the sudden changes in prices of
these commodities and the second being the demand factors for these commodities which
affect the income normally generated from minerals and other natural resources. Reducing
the economic concentration of an emerging economy principally means that should one
commodity or service suffer either of the above-mentioned shocks, this would not
necessarily devastate economic growth but would be minimised through the diversification
process. Empirical studies have developed recommendations for economic export
diversification as a driver of economic stabilisation which builds economic resilience
(Papageorgiou & Spatafora, 2012). In similar studies, there were, however, opposing
insights that argued that reducing economic concentration would essentially mean that the
emerging economy forfeits its economic competitive advantage (Mayer, 2006).
A sample of 20 SSA economies was evaluated. Morocco was excluded from this
hypothesis evaluation since this country did not have economic concentration data. The
hypothesis evaluated whether the reduction of economic concentration had any resilience
or significantly positive impacts on the countries’ economic growth. The hypothesis was
rejected for 18 (p-value < 0.05) of the 19 economies, with only Mauritius failing to reject the
hypothesis (p-value > 0.05). This suggested that reducing economic concentration or
increasing economic diversification had no significant impact on the resilience of SSA
economies.
© 2014 University of Pretoria. All rights reserved. The copyright in this work vests in the University of Pretoria.

67
6.3.1 Evaluation of economic performance
Economic performance from 1995 to 2011 for all SSA economies that rejected and failed
to reject the NULL hypothesis (that reducing economic concentration is a useful means of
building economic resilience) was plotted on a time-series graph, as shown in Figure 6.3.
Figure 6.3 Hypothesis 2: Mean average exports data
From the mean export data for countries grouped according to their results for Hypothesis
2, it was evident that exports for countries that rejected the NULL hypothesis are more
vulnerable to global economic changes as can be seen with the impact of the global
financial crisis in 2008/2009. The country that failed to reject the NULL hypothesis
experienced a minor drop in export figures, suggesting that lower economic concentration
was effectively used as a mechanism to increase economic resilience against the
exogenous shock of the 2008/2009 global financial crisis. The economic concentration
data also supported this finding as the economic concentration ratio for economies that
were statistically significant and that failed to reject the NULL hypothesis was significantly
© 2014 University of Pretoria. All rights reserved. The copyright in this work vests in the University of Pretoria.

68
lower (mean concentration ratio = 0.26) compared to economies that were not statistically
significant and that rejected the NULL hypothesis (mean concentration ratio = 0.362). This
indicated that the lower the economic concentration was, the less impact exogenous
shocks would have on exports.
When evaluating the standardised coefficient, Freud and Littell (2000) stated that it is
“useful in ascertaining the relative importance of the effects of independent variables not
affected by the scales of measurement” (p. 29). For the countries that failed to reject the
NULL hypothesis, economic concentration was the second most influential factor on the
independent variable (GDP economic growth) with a positive 0.636 standardised
coefficient. This implied that the lower concentration ratio had had a positive change on
the GDP economic growth.
Observing the mean export figures for the two groups of economies in Figure 6.4, it was
apparent that less economic concentration for SSA economies resulted in less export
growth. The economies where the concentration ratio was not significant experienced an
exponentially higher export growth. The exponential export growth also resulted in a much
higher mean GDP growth. Figure 6.4 also strengthened the argument that a lower
concentration ratio insulated the economies from the 2008/2009 financial global crisis.
© 2014 University of Pretoria. All rights reserved. The copyright in this work vests in the University of Pretoria.

69
Figure 6.4 Hypothesis 2: Mean average GDP
Observing the mean export figures for the two groups of economies in Figure 6.3, it was
apparent that less economic concentration for SSA economies resulted in less export
growth. Economies where the concentration ratio was not significant experienced an
exponentially higher export growth. The exponential export growth also resulted in much
higher mean GDP growth (figure 6.4). Figure 6.4 also strengthened the argument that a
lower concentration ratio insulated the economies from the 2008/2009 financial global
crisis.
6.3.2 Summary of hypothesis findings
The concentration ratio was not an effective means of building resilience in most of the
SSA economies. There were significant differences in economic performance between
economies where the concentration ratio played a positive role in the economic growth of
an economy and those where the concentration ratio displayed no significant impact.
Hosein (2010) argued that less economic concentration ensures economic stabilisation
© 2014 University of Pretoria. All rights reserved. The copyright in this work vests in the University of Pretoria.

70
and increased economic resilience for emerging economies. This was observed with the
data analysis performed in this study. These economies displayed economic resilience
where an exogenous shock had a minimal adverse impact. However, the data also
demonstrated that less economic concentration resulted in the slow growth in exports and
GDP which supported the research by Mayer (2006) that competitive advantage for
emerging economies is forfeited through decreased economic concentration. This
argument could provide a probable explanation in the observed slow growth in exports for
low economic concentration economies.
6.4 Hypothesis 3 Discussion: Trade openness
The third hypothesis stated:
H3: Trade openness to the global economy does not render emerging economies
vulnerable to exogenous shocks.
There have been various arguments relating to the impact of openness relative to
macroeconomic performance when exogenous shocks are exerted. There are two schools
of thoughts on the subject of the degree of openness of an economy, The first is that of
Duval et al. (2007) who, in their research on this topic, concluded that the degree of
openness of an economy enhances the resilience of the economy and reduces
vulnerability to exogenous shocks, citing the Singaporean economy in what was termed
the Singapore Paradox. They argued that the high degree of openness essentially
contributed to the high resilience experienced by this economy. This finding disputed the
outcomes of research conducted on emerging economies by Eichengreen (2002). This
research concluded that openness rendered emerging economies vulnerable since these
economies are heavily reliant on commodities. Eichengreen (2002) argued that these
exogenous shocks in the form of demand and price changes could easily be transmitted to
emerging economies with severe consequences.
© 2014 University of Pretoria. All rights reserved. The copyright in this work vests in the University of Pretoria.

71
A sample of 20 SSA economies was evaluated for this hypothesis. Gambia was excluded
from the evaluation since the country did not have import and export data to compute the
trade openness input variable. The hypothesis aimed to evaluate whether trade openness
had a significant impact on the economic output of the SSA economies. The NULL
hypothesis was rejected (p-value > 0.05) for 11 of the 19 economies with the remainder of
economies removed due to multicollinearity. This suggested that the degree of trade
openness did render most SSA economies vulnerable to adverse economic shocks.
6.4.1 Evaluation of economic performance
The NULL hypothesis that trade openness does not render SSA economies vulnerable to
exogenous shocks, using economic data over a 17-year period, was rejected for 11 of the
19 economies. The economies that failed to reject the NULL hypothesis were separated
from the economies that rejected the NULL hypothesis. Average means were computed to
evaluate these economies against adverse economic shocks to track and extrapolate
findings from their economic performance. Figure 6.5 demonstrates the differences in
terms of GDP growth between these economies, particularly during the two exogenous
shocks of the twenty-first century (the 2001/2002 and 2008/2009 economic crises).
Trade liberalisation has often been advocated by the World Bank and the IMF as a major
source of economic growth via the Washington Consensus which promotes a pro-
globalisation approach (Cavallo & Frankel, 2007) as it encourages economic activity and
competition (Yahikkaya, 2002). The view advocated by the IMF is that trade openness is
associated with economic growth. In the case of SSA economies, it was clear that those
economies that were not vulnerable experienced higher economic growth. Furthermore,
from the research results, economies that rejected the NULL hypothesis, in other words,
economies that were rendered vulnerable to exogenous shocks (which in this case were
11 of the 19 economies) were badly affected by the two exogenous shocks and economic
growth was volatile with a boom-bust cycle while also experiencing lower economic
growth, as illustrated in Figure 6.5. Yet, the statically significant economies experienced
© 2014 University of Pretoria. All rights reserved. The copyright in this work vests in the University of Pretoria.

72
higher and more stable economic growth with no notable impact as a result of the global
financial crisis.
Figure 6.5 Hypothesis 3: Mean average GDP
Yahikkaya (2002) stated that economies with a higher share of trade experience higher
economic growth. In this study, trade volumes in the form of exports traded by SSA
economies that were vulnerable to exogenous shocks and trade volumes are plotted in
Figure 6.6.This graph illustrates that economies that were vulnerable to exogenous shocks
traded or exported higher volumes than economies that were statistically significant and
that were not rendered vulnerable to exogenous shocks. It was also evident that these
economies tended to have a much better rate of recovery in exports once the exogenous
shock had ceased. Cavallo and Frankel (2007) offered a plausible explanation for this
recovery, namely that more openness may reduce the cost of the trade deficit and
encourage FDI to facilitate more commercial trade in the developing economies.
© 2014 University of Pretoria. All rights reserved. The copyright in this work vests in the University of Pretoria.

73
Figure 6.6 Hypothesis 3: Mean average exports
Indeed, the observations by Cavallo and Frankel (2007) that openness tends to encourage
FDI in economies especially post-crisis was the case in those SSA economies that were
more open to trade and rendered more vulnerable to exogenous shocks. This can be seen
in Figure 6.7 in the trade deficit experienced by these economies in the aftermath of the
global financial crisis.
© 2014 University of Pretoria. All rights reserved. The copyright in this work vests in the University of Pretoria.

74
Figure 6.7 Hypothesis 3: Mean average current account balance
The trade openness standardised coeifficients affected the three statistically significant
economies (Mozambique, Cape Verde and Sudan) differently. Since standardised
coefficients measure the strength of the impact of the independent variable on the
dependent variable in absolute units (Freud and Littell, 2000), this measure was used to
assess the impact of trade openness on these economies. For Mozambique, trade
openness had a standardised coefficient of –0.459, implying that trade openness heavily
influenced Mozambique’s economic performance. However, the minus sign (–) meant that
trade openness had a fundamentally adverse impact on economic performance. This was
a similar finding for Cape Verde with a standardised coefficient of –0.632. For Sudan,
trade openness had a standardised coefficient of 0.69, which signified that trade openness
had a significant positive impact on Sudan’s economic performance.
© 2014 University of Pretoria. All rights reserved. The copyright in this work vests in the University of Pretoria.

75
6.4.2 Summary of hypothesis findings
Trade openness rendered most SSA economies vulnerable to exogenous shocks as the
NULL hypothesis (that trade openness does not render SSA economies vulnerable to
exogenous shocks) was rejected for 11 of the 19 economies. Further, the economies were
separated into two groups based on their statistical significance to compare and assess
the impact of the global financial crisis on these economies. This offered deeper insights
into these two types of economies. Evidence from the data analysis implied that the
economies that were vulnerable due to trade openness to the global economy tended to
export more than the economies that were not vulnerable due to trade openness. This
signified greater economic growth. Prasad, Rogoff, Wei and Kose (2006) confirmed that
trade openness contributes greatly to promote economic growth, a phenomenon which
was observed in the time-series analysis.
Economic growth volatility was also evident for economies that were vulnerable due to
trade openness. This alluded to the finding that trade openness often resulted in output
volatility for developing economies. This finding was supported by Prasad et al. (2003)
who argued that an increase in trade openness leads to higher output volatility for
developing countries. This is another factor of vulnerability to adverse shocks (Di Giovanni
& Levchenko, 2007). Data analysis also illustrated that economies that were vulnerable
due to trade openness had greater external assets. During the global financial crisis, these
economies accumulated financial deficits which suggested that they were accessing their
financial assets and borrowing with the current account deficit increasing significantly after
2010. This signalled global economic recovery, resulting in greater FDI in these
economies, and was consistent with the hypothesised positive relationship between trade
openness and FDI (Asiedu, 2002).
© 2014 University of Pretoria. All rights reserved. The copyright in this work vests in the University of Pretoria.

76
6.5 Hypothesis 4 Discussion: Financial integration
The fourth hypothesis stated:
H4: Financial integration in the global economy renders emerging economies
vulnerable to exogenous shocks.
Kose et al. (2006) argued that financial integration is essential for emerging economies to
increase economic growth as it provides emerging economies with access to capital
markets. Indeed, access to capital markets is critical for emerging economies since they
rely heavily on FDI to grow their economies. However, other findings indicated that
financial integration is often beneficial for middle-income and wealthy countries rather than
for developing economies (Mougani, 2012). Emerging economies, such as those in SSA,
are heavily reliant on commodities which are adversely affected by demand and price
changes with boom-bust cycles transmitted through financial integration (Korinek, 2011).
Kose et al. (2006) observed that emerging economies that are financially integrated in the
global economy experience high growth but also experience significant volatility and are
thus vulnerable to transmitted economic shocks.
Initially, a sample of 20 countries was used to evaluate the fourth hypothesis. From the
collected data, three countries (Mozambique, Namibia and Gambia) were removed from
the hypothesis analysis due to missing data. Seven countries (Mauritius, Guinea, Ghana,
Sudan, Uganda, Tanzania and Nigeria) failed to reject the NULL hypothesis (p < 0.05)
(whether financial integration renders emerging economies vulnerable to exogenous
shocks) since it was statistically significant. Therefore, there was no outright consensus for
this hypothesis as almost the same number of countries rejected the NULL hypothesis as
those that failed to reject the NULL hypothesis.
© 2014 University of Pretoria. All rights reserved. The copyright in this work vests in the University of Pretoria.

77
6.5.1 Evaluation of economic performance
The hypothesis was statistically significant (p-value < 0.05) for seven SSA economies
which failed to reject the NULL hypothesis. These economies were Mauritius, Guinea,
Ghana, Sudan, Uganda, Tanzania and Nigeria. The statistically significant economies
were observed using time-series data over a 17-year period (1995 to 2011) to discern the
phenomena that have been associated with financial integration of emerging economies
with the SSA economies as performance measures. The economies that were statistically
significant displayed lower economic growth than the economies that were not rendered
vulnerable by financial integration with the global economy, as illustrated in Figure 6.8, by
the mean growth rate year-on-year.
These results for statistically significant SSA economies were not consistent with Korinek
(2011) who argued that emerging economies are vulnerable to boom-bust cycles and
volatility in their economic growth. However, for SSA economies that rejected the NULL
hypothesis, this finding was consistent with Kose et al. (2006) in that these economies
experienced high levels of economic growth with high volatility. Figure 6.8 also indicates
that the 2008/09 global financial crisis affected both sets of economies equally, with the
economies that were vulnerable to exogenous shocks displaying a faster recovery rate
after the crisis.
© 2014 University of Pretoria. All rights reserved. The copyright in this work vests in the University of Pretoria.

78
Figure 6.8 Hypothesis 4: Mean average GDP growth
Mougani (2012) stated that financial integration provides emerging economies with access
to capital markets, and this enables economies with capital allocation across capital
markets. SSA economies that were statistically significant (p-value < 0.05) for the NULL
hypothesis, and hence rendered vulnerable to exogenous shocks due to their financial
integration in the global economy, illustrated higher external liabilities pre-2004. This is
seen in Figure 6.9 showing the mean external debt stocks for statistically significant
economies.
The observation by Mougani (2012) for financially integrated economies was
demonstrated by the sharp decrease in external debt stocks, as illustrated in Figure 6.9.
According to The World Bank (2005), a Multilateral Debt Review Relief Initiative was
undertaken at a G8 summit meeting in Gleneagles, Scotland to cancel the debt of heavily
indebted developing countries of which many of the SSA countries were recipients. This
had a significant impact for the statistically significant economies in that the average mean
external debt stocks decreased from US$12 billion in 2004 to under US$6 billion. This
© 2014 University of Pretoria. All rights reserved. The copyright in this work vests in the University of Pretoria.

79
occurrence displayed one of the advantages that emerging economies enjoy as a result of
their financial integration in the global economy even though these economies are
vulnerable to global economic shocks as well.
Figure 6.9 Hypothesis 4: Mean average external debt stocks
Reviewed literature on the subject of financial integration of emerging economies, such as
Korinek (2011), Mougani (2012) and Kose et al. (2006), explored the impact of financial
integration on emerging economies’ economic growth, increased volatility and impact on
FDI. However, in this study based on the SSA region, a critical observation was
discovered based on the economies that were rendered vulnerable (statistically significant
p-value) to exogenous shocks due to their financial integration in the global economy.
Figure 6.9 illustrates the inflection point in 2005 when debt relief was granted to heavily
indebted developing economies by the G8. This point was the same inflection point in
2005 when, according to Figure 6.9, these economies surpassed the mean average GDP
of SSA economies that were not vulnerable to exogenous shocks (statistically insignificant
p-value). This illustrated causation, bearing in mind the influence of other economic
factors, as decreasing these economies’ debt stocks led to significant increases in the size
© 2014 University of Pretoria. All rights reserved. The copyright in this work vests in the University of Pretoria.

80
of these economies. Results illustrated on a time-series analysis in Figure 6.10 were also
consistent with Korinek (2011) who argued that emerging economies that are financially
integrated in the global economy are exposed to global economic cyclical changes. It was
evident from Figure 6.10 that the 2008/09 financial global crisis caused a contraction in the
sampled SSA economies.
Figure 6.10 Hypothesis 4: Mean average GDP
The SSA economies that were found to be vulnerable to exogenous shocks due to their
financial integration were able to accumulate more international reserves, as shown in
Figure 6.11, than the economies that were not vulnerable to exogenous shocks or
statistically not significant. This finding was consistent with that of Kose et al. (2006) that
these economies, even though they were vulnerable to economic shocks, had more
access to capital markets.
© 2014 University of Pretoria. All rights reserved. The copyright in this work vests in the University of Pretoria.

81
Figure 6.11 Hypothesis 4: Mean average total reserves
6.5.2 Summary of hypothesis findings
Almost the same number of SSA economies was vulnerable due to financial integration as
those that were not. Numerous aspects of these economies were explored to evaluate the
conventional emerging economics theories against those of the SSA region. Korinek
(2011) purported that emerging economies are exposed to boom-bust cycles owing to their
financial integration. From the data analysis, this finding was detected although exposure
was to a lesser extent when compared to SSA economies that were not seen as
vulnerable to exogenous shocks due to financial integration in the global economy.
However, findings were consistent with Korinek (2011) on the exposure of the statistically
significant emerging economies to the 2008/09 global financial crisis. Kose et al. (2006)
noted that emerging financially integrated economies experienced higher economic growth
rates.
© 2014 University of Pretoria. All rights reserved. The copyright in this work vests in the University of Pretoria.
82
This research concurred with the finding that statistically significant SSA economies
experienced higher GDP growth rates although the eternal debt stocks were much lower.
This finding was also influenced by the critical decision by the G8 in 2005 to provide debt
relief to many of the SSA economies, providing a turning point for the economies that had
a statistically significant p-value for the hypothesis.
6.6 Summary of results
The analysis of the four hypotheses contributed to understanding the dynamics between
the four selected economic factors that contribute to strengthening economic vulnerability
and resilience of SSA economies. These factors were assessed with economic growth in
mind as they have proved to be essential ingredients to attract FDI to the region according
to the literature review. In the first hypothesis, SSA countries, contrary to the Asian
economies, did not effectively utilise international reserves as a means of enhancing their
resilience but instead relied heavily on borrowings through accumulation of external debt
stocks. The Asian economies were able to accumulate international reserves while SSA
economies were incurring current account deficits which would indicate investment in
infrastructure or large amounts of FDI inflow.
The second hypothesis discovered that economic concentration was also not a useful
means of enhancing resilience for SSA economies. Data analysis indicated that SSA
economies were rendered vulnerable to demand changes in commodities and were
severely affected by the global financial crisis. However, the low economic diversification
allowed these economies to build competitive advantage in the products or commodities
they exported with the exports fuelling rapid economic growth. The data suggested that
enhancing resilience in the case of SSA economies essentially meant that these
economies could not harness competitive advantage to ensure high GDP growth.
Mauritius as the economy that was economically diversified achieved lower GDP growth,
but managed to attract the highest amount of FDI relative to its GDP. This highlighted that
investors were willing to investment in more economically stable SSA economies.
© 2014 University of Pretoria. All rights reserved. The copyright in this work vests in the University of Pretoria.

83
Trade openness was the third hypothesis that was assessed and indications were also
that SSA economies were rendered vulnerable to exogenous shocks and were also
severely affected by the financial global crisis as a result. Trade openness also meant
lower growth rates for SSA economies, even though these economies managed to
achieve high exports and build up current account surpluses. However, even these current
account surpluses were quickly eroded during the global financial crisis while current
account deficits increased beyond the global economic recovery, suggesting that trade
openness allowed these economies to access their financial assets.
Financial integration, the fourth hypothesis, provided mixed results with integration
rendering the same number of SSA economies vulnerable to exogenous shocks as those
that rejected this hypothesis. The economies that were rendered vulnerable to exogenous
shocks were those that had significant FDI relative to their GDPs, signalling that
investment capital could be easily withdrawn during a financial crisis, as was evident in the
data analysed. These economies also experienced higher volatility in their GDP growth as
a result. The economies that were not rendered vulnerable to exogenous shocks as a
result of financial integration were not affected by the global financial crisis. However, they
could also not benefit from financial relief efforts by global financial bodies such as the
World Bank and the IMF.
Overall, through the methodology undertaken to study the vulnerability and resilience of
SSA economies, the model was significant and applicable across seven of the economies.
© 2014 University of Pretoria. All rights reserved. The copyright in this work vests in the University of Pretoria.

84
CHAPTER 7 Conclusion
7.1 Summary of main findings
The increased importance of the SSA region in the context of FDI flow in the global
economy, more so in the aftermath of the global financial global crisis, has been
highlighted to be of paramount importance. The literature review suggested that investors
do not only seek high returns but also secure, stable returns on their investments when
investing in emerging or developing economies. Resilience and vulnerability concepts
emerged as topics of interest in improving SSA economies’ stability since the majority of
these economies have been achieving high economic growth outputs. However, the global
financial crisis eroded hard-fought-for gains in the growth of these economies. The
literature review also revealed that emerging economies still rely heavily on commodities
to grow their economies. This is a concern for the finance ministers of these economies
with formal agendas in the recently held World Economic Forum formulating strategies to
enhance dynamic resilience for developing economies.
Possible predictors that would have a direct impact on vulnerability and resilience of
emerging economies were selected as hypotheses. Most of the predictors were
extrapolated from Asian economies where extensive research had been undertaken. The
four constructs centred on the accumulation of international reserves, economic
diversification, openness to trade and integration of the financial sector in the global
economy. These predictors were of interest to emerging economies primarily because the
global financial crisis was as a result of a failure in the the financial system of developed
economies which had spillover effects for emerging or developing economies.
The main finding was that SSA economies were vulnerable to exogenous shocks and
were volatile even though they had managed to achieve high economic growth rates.
Unlike the Asian economies that had accumulated large amounts of international reserves
after the Asian crisis as a resilience mechanism, SSA economies did not accumulate these
© 2014 University of Pretoria. All rights reserved. The copyright in this work vests in the University of Pretoria.

85
external assets but instead relied on external debt to cope with the recent economic shock.
The finding on the non-accumulation of international reserves was that it did not render
SSA economies vulnerable to exogenous shocks. This was supported by the financial
integration of these economies in the global financial system in that the SSA economies
were able to access credit lines and increased their external debt stocks.
In light of the heavy reliance of emerging or developing economies on commodities, with
SSA economies being no exception, most research studies advocated economic
diversification as a form of resilience since commodities are highly volatile due to price and
demand changes. Fewer research studies suggested maintaining competitive advantage
through less economic diversification. The finding in the case of the SSA region was that
SSA economies were highly concentrated and resilience was compromised as a result.
However, the high economic concentration allowed these economies to increase
exponentially their exports due to the competitive advantage that they had managed to
establish. Volatility in exports and economic growth was also found to be very high. The
few economies that managed to diversify, such as Mauritius, achieved very low exports
along with correspondingly low economic growth output. However, this economy
reinforced the notion that investors are indeed looking for stable emerging or developing
markets as the economy attracted the largest FDI in the SSA region.
Most SSA economies were highly open to trade and, as a result, were highly exposed to
exogenous shocks. This, together with the high economic concentration factor, rendered
most SSA economies vulnerable. The few economies that were not exposed to exogenous
shocks were found to be protectionist economies based on the low trade export volumes
and GDP growth was thus stable with no signs of economic recession during the financial
global crisis. Financial integration presented mixed results in the evaluation of vulnerability
due to SSA economies’ integration in the financial global economy. The results were not
conclusive for financial integration as economies that attracted significant amounts of FDI
were rendered vulnerable to exogenous shocks. Although negatively affected by the global
financial crisis, the recovery in economic growth output was instantaneous, signalling
investors were willing to re-invest in the economies. Financial integration also allowed SSA
© 2014 University of Pretoria. All rights reserved. The copyright in this work vests in the University of Pretoria.

86
economies to access borrowings in the form of external debt stocks, which compensated
the lack of international reserves.
7.2 Research recommendations
Results from Chapter 6 provided insight into resilience and vulnerability levers for SSA
economies. An application model, illustrated in Figure 7.1 and based on the results from
Chapter 6, is recommended for managers and investors who could use the model to
assess the drivers of resilience and vulnerability on which investment decisions can be
based. The model can also be used as a guideline for monetary and fiscal policy
formulation for SSA countries and as a predictor based on the four economic pillars under
evaluation.
Figure 7.1 Resilience and vulnerability model for sub-Saharan African economies
© 2014 University of Pretoria. All rights reserved. The copyright in this work vests in the University of Pretoria.

87
The model combines all the concepts under evaluation and their overall impact on the
stability and performance of SSA economies. The model assumes that vulnerability can
either be reduced or can expose the economy to exogenous shocks, while resilience can
either be enhanced or compromised.
For vulnerability, trade openness and financial integration are viewed as drivers. According
to the model, an increase in trade openness results in an increase in vulnerability with mild
volatile economic growth. A decrease in trade openness with the global economy
decreases the economy’s vulnerability with stable, relatively high economic growth.
The model suggests that an increase in financial integration in the global economy
introduces more vulnerability to exogenous shocks with volatile high economic growth as a
consequence. A decrease in financial integration reduces vulnerability and exposure to
exogenous economic shocks with an output of low but stable economic growth.
For resilience, the model uses international reserves and economic concentration as
levers. Data evaluated for SSA economies suggests that increasing international reserves
compromises and reduces the economy’s resilience to exogenous shocks with low volatile
economic growth output. A decrease in international assets or reserves enhances the
economy’s resilience against shocks with stable high economic growth output.
The second driver of resilience is economic concentration. An increase in economic
concentration (in other words, an over-reliance on main products, services or
commodities) reduces the economy’s resilience to exogenous shocks and results in high
but volatile economic growth. A decrease in economic concentration (diversifying the
country’s exports) enhances resilience against exogenous economic shocks and results in
mild but stable economic growth output.
The model also provides recommendations for SSA policy makers by bringing all the
pillars together to propose high-level actions to produce stable, mild economic growth by
reducing vulnerability while enhancing economic resilience by reducing trade openness,
© 2014 University of Pretoria. All rights reserved. The copyright in this work vests in the University of Pretoria.

88
reducing financial integration, reducing international reserves and reducing economic
concentration. On the other end of the spectrum, to produce high economic growth output,
policy makers can (as the model suggests) increase trade openness, increase financial
integration and increase economic concentration for competitive advantage. However, with
this approach, the ensuing result would be reduced resilience and increased vulnerability
to exogenous shocks.
7.3 Research limitations
Due to the limited scope of the study, limitations to the study were identified and are listed
below:
The study focused on emerging economies and the SSA region was used as a
case in point. Hence, the findings may not be applicable to other regions or
developing economies as they may have inherently different structures to the
economies assessed in this study.
The selected methodology used to evaluate the economies was a multiregression
analysis instead of regression analysis to assess each country on an individual
basis so as to eliminate any possibility of multicollinearity.
It is possible that there are many more economic parameters that may render
economies vulnerable or resilient apart from the four that were selected for this
assessment. The model was developed based on the results of these economic
parameters. As such, the model may not be entirely accurate as there are many
other factors that may influence or determine economic vulnerability and resilience.
The results of regression analysis may not prove causality but may determine
correlation between the input variables.
© 2014 University of Pretoria. All rights reserved. The copyright in this work vests in the University of Pretoria.

89
A number of economic evaluations for the stated hypotheses were not statistically
significant. Therefore, had more economies been included in the study, then
different results might have been obtained.
7.4 Recommendations for future research
Limitations of this research study were identified above. The following suggestions could
be implemented in future research to add to the body of research in this area:
Expand the number of economies in the study to increase the statistical
significance and accuracy of the results.
Select more variables that were considered in this research study and compare the
results with the results obtained in this study.
Emerging or developing economies from different continents could be selected to
reduce the likelihood of studying homogeneous economies and to eliminate strong
characteristics associated with the SSA economic region so that the results are
applicable across a wider context.
A different research methodology could be selected to improve the reliability and
validity of results, and to eliminate auto-correlation that is associated with
evaluating numerous independent variables when using regression analysis.
7.5 Conclusion
The aim of this study was to evaluate and assess the economic vulnerability and resilience
of emerging economies to adverse exogenous shocks using the SSA region as a case in
point. The outcomes of this research have expanded the body of research on the concepts
© 2014 University of Pretoria. All rights reserved. The copyright in this work vests in the University of Pretoria.
90
of vulnerability and resilience for the SSA region as most of the previous research had
focused on emerging or developing economies in Asia and Latin America.
The model developed from this research provides the basis for a decision-making
framework for macroeconomic policy formulation which can later be expanded through
future research in this area. Analysis using the methodology followed has added to
existing literature in the area of developing strategies for developing economies to be
better prepared for unknown future adverse events and to minimise the loss of hard-
fought-for economic gains.
© 2014 University of Pretoria. All rights reserved. The copyright in this work vests in the University of Pretoria.

91
Reference list
Adewumi, S. (2006). The impact of FDI on growth in developing countries: An African
experience. (Master’s thesis, Jönköping International Business School). Retrieved
from http://hj.diva-portal.org/smash/get/diva2:4440/FULLTEXT01
Aryeetey, E., & Ackah, C. (2011). The global financial crisis and African economies:
Impact and transmission channels. African Development Review, 23(4), 407–420.
doi:10.1111/j.1467-8268.2011.00295.x
Asiedu, E. (2006). Foreign direct investment in Africa: The roles of natural resources,
market size, government policy, institutions and political instability. World
Economy, 29(1), 63–77. doi:10.1111/j.1467-9701.2006.00758.x
Bluen, S. (2012). Talent management in emerging markets. Johannesburg: Knowres
Publishing.
Briguglio, L. (2003). The Vulnerability Index and small island developing states: A review
of conceptual and methodological issues. University of Malta. Retrieved from
http://www.um.edu.mt/__data/assets/pdf_file/0019/44137/vulnerability_paper_sep0
3.pdf
Briguglio, L., Cordina, G., Farrugia, N., & Vella, S. (2009). Economic vulnerability and
resilience: Concepts and measurements. Oxford Development Studies, 37(3), 229–
247. doi:10.1080/13600810903089893
Calkins, S. (2002). The new merger guidelines and the Herfindahl-Hirschman Index,
California Law Review, 71(2), 402–429. Retrieved from
http://scholarship.law.berkeley.edu/cgi/viewcontent.cgi?article=2149&context=califo
rnialawreview
© 2014 University of Pretoria. All rights reserved. The copyright in this work vests in the University of Pretoria.
92
Cavallo, E. A. & Frankel, J. A. (2007). Does openness to trade make countries more
vulnerable to sudden stops, or less? Using gravity to establish. Econstor Working
Paper. Inter-American Development Bank. Retrieved from
http://www.econstor.eu/handle/10419/51509
Cheung, Y. & Ito, H. (2008). Hoarding of international reserves: A comparison of the Asian
and Latin American experiences. HKIMR Working Paper No.7/2008. Hong Kong
Institute of Monetary Research. Retrieved from
http://www.hkimr.org/uploads/publication/166/ub_full_0_2_176_hkimr-working-
paper-no-7_bw.pdf
Choi, W. G., Sharma, S. & Strömqvist, M. (2009). Net capital flows, financial integration,
and international reserve holdings: The recent experience of emerging markets and
advanced economies. International Monetary Fund Staff Papers,56, 516–540.
doi:10.1057/imfsp.2008.35
Christopherson, S., Michie, J., & Tyler, P. (2010). Regional resilience: Theoretical and
empirical perspectives. Cambridge Journal of Regions, Economy and Society, 3(1),
3–10. doi:10.1093/cjres/rsq004
Demir, F. (2009). Volatility of short term capital flows, financial anarchy and private
investment in emerging markets. Journal of Development Studies, 45(5), 672–692.
Retrieved from http://faculty-staff.ou.edu/D/Firat.Demir-
1/Demir_JDS09_Volatility_of_Capital_Flows_and_Private_Investment.pdf
Devarajan, S., & Kasekende, L. A. (2011). Africa and the global economic crisis: Impacts,
policy responses and political economy. African Development Review, 23(4), 421–
438. doi:10.1111/j.1467-8268.2011.00296.x
© 2014 University of Pretoria. All rights reserved. The copyright in this work vests in the University of Pretoria.

93
Di Giovanni, J. & Levchenko, A. A. (2007). Trade openness and volatility. International
Monetary Fund. Retrieved from
http://www.imf.org/external/pubs/ft/wp/2008/wp08146.pdf
Donnelly, L. (2013, May 10). Gordhan warns of Africa’s ‘vulnerability’ despite economic
growth. Mail & Guardian. Retrieved from http://mg.co.za/article/2013-05-10-
gordhan-warns-of-africas-vulnerability-despite-economic-growth
Dos Santos, F. T., & Partidário, M. R. (2011). SPARK: Strategic planning approach for
resilience keeping. European Planning Studies, 19(8), 1517–1536.
doi:10.1080/09654313.2011.533515
Down, I. (2007). Trade openness, country size and economic volatility: The compensation
hypothesis revisited. Business and Politics, 9(2), 1–22. Retrieved from
http://www.unc.edu/depts/europe/conferences/tgsw/iandown-trade_openness.pdf
Duval, R. D., Elmeskov, J., & Vogel, L. (2007, July). Structural policies and economic
resilience to shocks. OECD Economics Department Working Paper No. 567.
Organisation for Economic Co-operation and Development. Retrieved from
http://search.oecd.org/officialdocuments/displaydocumentpdf/?doclanguage=en&co
te=eco/wkp(2007)27
Eichengreen, B. (2002, February). Can emerging markets float? Should they inflation
target? Banco Central Do Brasil, Working Paper Series 36, 1–49. Retrieved from
http://www.bcb.gov.br/pec/wps/ingl/wps36.pdf
Ernst & Young. (2013, May 6) Press release: Africa’s share of global FDI increases over
the last five years. Retrieved from http://www.ey.com/GL/en/Newsroom/News-
releases/News_Africa-share-of-global-FDI-increases-over-the-last-five-years
Ethington, B. (2005). Multicollinearity. Memphis: University of Memphis.
© 2014 University of Pretoria. All rights reserved. The copyright in this work vests in the University of Pretoria.

94
Fitch. (2013, May 22). Sub-Saharan Africa has gradual upgrade potential. Reuters.
Retrieved from http://www.reuters.com/article/2013/05/22/fitch-sub-saharan-africa-
has-gradual-upg-idUSFit65679220130522
Freund, R. J., & Littell, R. C. (2000). SAS system for regression. Cary, NC: SAS Institute.
Gerschewski, S. (2013). Do local firms benefit from foreign direct investment? An analysis
of spillover effects in developing countries. Asian Social Science, 9(4), 67–76.
doi:10.5539/ass.v9n4p67
Gnangnon, S. K. (2012). Does structural economic vulnerability matter for public
indebtedness in developing countries. CERDI, Etudes et Documents, n° 36,
September 2012. Retrieved from http://halshs.archives-
ouvertes.fr/docs/00/74/94/69/PDF/2012.36.pdf
Grewal, R., Cote, J. A. & Baumgartner, H. (2004) Multicollinearity and measurement error
in structural equation models: Implications for theory testing. Marketing Science, 23
(4), 519–529. doi: 10.1287/mksc.1040.0070
Guillaumont, P. (2010). Assessing the economic vulnerability of small island developing
states and the least developed countries. Journal of Development Studies, 46(5),
828–854. doi: 10.1080/00220381003623814
Harttgen, K., & Günther, I. (2006, October). Households' vulnerability to covariate and
idiosyncratic shocks. Proceedings of the German Development Economics
Conference. Conference conducted at the meeting of Verein für Socialpolitik,
Research Committee Development Economics, Berlin.
© 2014 University of Pretoria. All rights reserved. The copyright in this work vests in the University of Pretoria.

95
Hasan, H. & Banna, S. (2010). The unit of analysis in IS theory: The case for activity.
University of Wollongong, Faculty of Commerce – Papers. Retrieved from
http://ro.uow.edu.au/cgi/viewcontent.cgi?article=1824&context=commpapers
Hoddinott, J., & Quisumbing, A. R. (2008, May). Methods for microeconometric risk and
vulnerability assessments. Washington, DC: International Food Policy Research
Institute. Retrieved from
http://papers.ssrn.com/sol3/papers.cfm?abstract_id=1281055
Hosein, R. (2010). Booming mineral resources and the imperative of economic
diversification. The West Indian Journal of Engineering, 32(1,2), 76–84. Retrieved
from http://sta.uwi.edu/eng/wije/vol3201-
02_jan2010/documents/EconomicDiversification.pdf
Hoskisson, R. E., Eden, L., Lau, C. M., & Wright, M. (2000) Strategy in emerging
economies. Academy of Management Journal, 43(3), 249–267. Retrieved from
http://www.voxprofessori.com/eden/Publications/strategyinemergingeconomies.pdf
Jayaraman, T. K. (2006). Macroeconomic reform and resilience building in small states. In
E. J. Kisanga, G. Cordina, & L. Brigugulio (Eds.), Building the economic resilience
of small states (pp. 33–38). Blata I-Bajda: Formatek.
Khanna, T., & Palepu, K. G. (2011). Winning in emerging markets: Spotting and
responding to institutional voids. World Financial Review, May–June, 18–20.
Retrieved from http://www.worldfinancialreview.com/?p=483
Hur, S. & Kondo, I. O. (2013). A theory of rollover risk, sudden stops, and foreign reserves.
FRB International Finance Discussion Paper No. 1073. Retrieved from
http://ssrn.com/abstract=2243568 or http://dx.doi.org/10.2139/ssrn.2243568
© 2014 University of Pretoria. All rights reserved. The copyright in this work vests in the University of Pretoria.

96
Korinek, A. (2011). The new economics of prudential capital control: A research agenda.
International Monetary Fund Economic Review, 59(3), 523–561.
doi:org/10.1057/imfer.2011.19
Kose, M. A., Prasad, E. S., & Terrones, M. E. (2006). How do trade and financial
integration affect the relationship between growth and volatility? The Institute for
the Study of Labor. Retrieved from
http://www.imf.org/external/pubs/ft/wp/2005/wp0519.pdf
Lane, P. R., & Milesi-Ferretti, G. M. (2006). The external wealth of nations Mark II: Revised
and extended estimates of foreign assets and liabilities, 1970-2004. International
Monetary Fund Working Paper WP/06/69. Retrieved from
http://www.imf.org/external/pubs/ft/wp/2006/wp0669.pdf
Lynch, S. M. (2003). Multicollinearity. Retrieved from
http://www.princeton.edu/~slynch/soc504/multicollinearity.pdf
Managi, S., & Bwalya, S. M. (2010). Foreign direct investment and technology spillovers in
sub-Saharan Africa. Applied Economics Letters, 17(6), 605–608. doi:
10.1080/13504850802167173
Manyena, S. B. (2009). Disaster resilience in development and humanitarian interventions.
(Doctoral dissertation, Northumbria University). Retrieved from
nrl.northumbria.ac.uk/661/1/manyena.siambabala_phd.pdf
Mayer, J. (2006), Learning sequences and structural diversification in developing
countries. Journal of Development Studies, 33(2), 210–229. Retrieved from
http://www.tandfonline.com/doi/abs/10.1080/00220389608422463
Mechler, R., Hochrainer, S., Pflug, G., Lotsch, A., & Williges, K. (2010). Assessing the
financial vulnerability to climate-related natural hazards. World Bank, Policy
© 2014 University of Pretoria. All rights reserved. The copyright in this work vests in the University of Pretoria.

97
Research Working Paper 5232, March 2010. Retrieved from
https://openknowledge.worldbank.org/bitstream/handle/10986/3718/WPS5232.txt?
sequence=2
Menson, E. A. (2012). Infrastructure, export-led growth and economic development in sub-
Saharan Africa: An empirical analysis. The IUP Journal of Managerial Economics.
vol. 0(1), pages 46-78. Retrieved from
http://ideas.repec.org/a/icf/icfjme/v10y2012i1p46-78.html
Moody's Investor Service. (May 2013). Moldova's B3 rating reflects low economic
resilience and political instability. Retrieved from
https://www.moodys.com/research/Moodys-Moldovas-B3-rating-reflects-low-
economic-resilience-and-political--PR_273278
Moody’s Standing Committee on Rating Systems & Practices. (June 2009). Moody’s
Rating Symbols & Definitions. Retrieved from
https://www.moodys.com/sites/products/AboutMoodysRatingsAttachments/Moodys
RatingsSymbolsand%20Definitions.pdf
Mougani, G. (2012). An analysis of the impact of financial integration on economic activity
and macroeconomic volatility in Africa within the financial globalization context.
African Development Bank Group. Retrieved from
http://www.afdb.org/fileadmin/uploads/afdb/Documents/Publications/WPS%20No%
20144%20An%20Analysis%20of%20the%20Impact%20of%20Financial%20Integr
ation%20on%20Economic%20Activity%20and%20Macroeconomic%20Volatility%2
0in%20Africa%20%20SS.pdf
Naudé, W., Santos-Paulino, A. & McGillivray, M. (2009). Measuring vulnerability across
outcomes and levels: An overview and Introduction. Oxford Development Studies,
37(3), 183–191. Retrieved from http://website1.wider.unu.edu/lib/files1/ODS-37-3-
09-1-Naude.pdf
© 2014 University of Pretoria. All rights reserved. The copyright in this work vests in the University of Pretoria.

98
Pamungkas, B. (2012). Economic resilience of agribusiness households in Putih River
region following the 2010 Merapi volcanism events. (Double masters thesis,
Gadjah Mada University and University of Twente). Retrieved from
http://www.itc.nl/library/papers_2012/msc/aes/pamungkas.pdf
Panitchpakdi, S. (2013, May 9). Developing resilience to financial shocks. Inter Press
Service News Agency. Retrieved from http://www.ipsnews.net/2013/05/developing-
resilience-to-financial-shocks/
Papageorgiou, C. & Spatafora, N. (2012, December 14). Economic diversification in LICs:
Stylized facts and macroeconomic implications. International Monetary Fund Staff
Discussion Note, December 14, 2012, SDN/12/13. Retrieved from
http://www.imf.org/external/pubs/ft/sdn/2012/sdn1213.pdf
Pepe, J. W. (1997). Demonstrating systematic sampling. University of Central Florida.
Retrieved from
http://www2.sas.com/proceedings/sugi22/POSTERS/PAPER213.PDF
Prasad, E. S., Kenneth, R., Wei, S., & Kose, M. A. (2003). Effects of financial globalization
on developing countries: Some empirical evidence. International Monetary Fund.
Retrieved from http://www.imf.org/external/np/res/docs/2003/031703.pdf
Rathbone, J. P. (2013, February 25). Mexico-US trade: the Tijuana logjam. Financial
Times. Retrieved from http://blogs.ft.com/beyond-brics/2013/02/25/mexico-us-
trade-the-tijuana-logjam/?Authorised=false#axzz2jtxe1wWE
Ravallion, M., & Chen, S. (2009, April 30) The impact of the global financial crisis on the
world’s poorest. VOX. Retrieved from http://www.voxeu.org/article/impact-global-
financial-crisis-world-s-poorest
© 2014 University of Pretoria. All rights reserved. The copyright in this work vests in the University of Pretoria.

99
Reuttner, I. (2013, January 16). How can financial systems be truly resilience? World
Economic Forum. Retrieved from http://forumblog.org/2013/01/how-can-financial-
systems-be-truly-resilient/
Rose, A. Z. (2009). Economic resilience to disasters. Published Articles & Papers. Paper
75. Retrieved from http://research.create.usc.edu/published_papers/75
Rose, A., & Liao, S. (2005). Modeling regional economic resilience to disasters: A
computable general equilibrium analysis of water service disruptions. Journal of
Regional Science, 45(1), 75–112. doi:10.1111/j.0022-4146.2005.00365.x
Samoilenko, S. & Osei-Bryson, K-M. (2010). Linking investments in telecoms and
productivity growth in the context of transition economies within the framework of
neoclassical growth accounting: Solving endogeneity problem with structural
equation modeling. Proceedings of 18th European Conference on Information
Systems, Pretoria, South Africa, June 6-9, 2010.
Saunders, M. N. K., & Lewis, P. (2012). Doing research in business and management: An
essential guide to planning your project (pp. 1–233). Harlow: Pearson.
Siegel, P. B., Johnson, T. G. & Alwang, J. (1995). Regional economic diversity and
diversification. Growth and Change, 26(2), 261–284. doi:10.1111/j.1468-
2257.1995.tb00171.x
Suttle, P., Koepke, R. & Tiftik, E. (2012, June 7). Capital flows to emerging market
economies. Institute of International Finance. Retrieved from
https://www.google.co.za/search?sourceid=navclient&ie=UTF-
8&q=Suttle%2C+P.%2C+Koepke%2C+R.+%26+Tiftik%2C+E.+(2012).+Capital+Fl
ows+to+Emerging+Market+Economies.+Institute+of+International+Finance+
© 2014 University of Pretoria. All rights reserved. The copyright in this work vests in the University of Pretoria.

100
World Bank. (2011). The Multilateral Debt Relief Issue.
http://web.worldbank.org/WBSITE/EXTERNAL/TOPICS/EXTDEBTDEPT/0,,content
MDK:20634753~menuPK:64166739~pagePK:64166689~piPK:64166646~theSiteP
K:469043,00.html
UN Secretary General urges integration of Africa into the global economy. (2013, June 2).
Cocorioko Newspaper. Retrieved from http://www.cocorioko.net/?p=48144
Weiers, R. M. (2010). Introductory business statistics. Cengage Learning
Wright, M., Filatotchev, I., Hoskisson, R. E., & Peng, M. W. (2005) Strategy research in
emerging economies: Challenging the conventional wisdom. Journal of
Management Studies, 42(1), 1–33. doi: http://dx.doi.org/10.1111/j.1467-
6486.2005.00487.x
Yanikkaya, H. (2003). Trade openness and economic growth: a cross-country empirical
investigation. Journal of Development Economics, 57–89. Retrieved from
http://www.elsevier.com/locate/econbase
© 2014 University of Pretoria. All rights reserved. The copyright in this work vests in the University of Pretoria.

101
Appendix A: Detailed country figures for FDI-to-GDP ratio
Appendix A provides the FDI-to-GDP ratio for each of the SSA countries sampled from the
SSA region as discussed in Section 5.2.
Table A Sample countries FDI-to-GDP ratios
Country name Country code Indicator name FDI-to-GDP (%)
Mauritius MUS Foreign direct investment (% of GDP) 119.0666729
Liberia LBR Foreign direct investment (% of GDP) 84.94215122
Sierra Leone SLE Foreign direct investment (% of GDP) 24.04865279
Guinea GIN Foreign direct investment (% of GDP) 18.76888267
Mozambique MOZ Foreign direct investment (% of GDP) 16.37734931
Sao Tome and Principe STP Foreign direct investment (% of GDP) 13.97687941
Seychelles SYC Foreign direct investment (% of GDP) 12.90846621
Ghana GHA Foreign direct investment (% of GDP) 8.15540319
Namibia NAM Foreign direct investment (% of GDP) 7.584165744
Lesotho LSO Foreign direct investment (% of GDP) 5.608355665
Cape Verde CPV Foreign direct investment (% of GDP) 5.457383953
Sudan SDN Foreign direct investment (% of GDP) 4.772190513
Uganda UGA Foreign direct investment (% of GDP) 4.740949149
Tanzania TZA Foreign direct investment (% of GDP) 4.588229531
Zambia ZMB Foreign direct investment (% of GDP) 4.329366108
Gambia, The GMB Foreign direct investment (% of GDP) 4.007468168
Nigeria NGA Foreign direct investment (% of GDP) 3.289171006
Morocco MAR Foreign direct investment (% of GDP) 2.268329384
Ethiopia ETH Foreign direct investment (% of GDP) 2.071286776
Rwanda RWA Foreign direct investment (% of GDP) 1.666071239
South Africa ZAF Foreign direct investment (% of GDP) 1.480196295
© 2014 University of Pretoria. All rights reserved. The copyright in this work vests in the University of Pretoria.

102
Appendix B: Detailed results for Hypothesis 1
Appendix B provides detailed results for Hypothesis 1 referred to in Section 5.4.1.
Table B Hypothesis 1: Results
Country Parameter
Unstandardised coefficients
Standardised coefficients
t Sig.
95.0% Confidence interval for B
Correlations
B Std. error
Beta Lower bound
Upper bound
Zero-order
Partial Part
Liberia internationalreserves -2.99E-
08 0 -0.018
-0.021
0.984 0 0 -0.127 -0.006 -0.006
Sierra Leone internationalreserves -5.77E-
09 0 -0.026
-0.043
0.966 0 0 0.113 -0.012 -0.012
Guinea internationalreserves 2.11E-10 0 0.005 0.008 0.994 0 0 -0.208 0.002 0.002
Namibia internationalreserves 2.12E-08 0 0.857 1.288 0.22 0 0 -0.014 0.336 0.332
Sudan internationalreserves -1.85E-
09 0 -0.078
-0.608
0.555 0 0 -0.008 -0.173 -0.061
Uganda internationalreserves -1.33E-
08 0 -0.752
-5.821
0 0 0 -0.334 -0.85 -0.501
Tanzania internationalreserves 5.94E-09 0 0.65 2.004 0.068 0 0 0.596 0.501 0.236
Zambia internationalreserves 4.15E-09 0 0.155 0.289 0.778 0 0 0.598 0.083 0.061
Nigeria internationalreserves -1.96E-
10 0 -0.17
-0.486
0.636 0 0 -0.01 -0.139 -0.08
Morocco internationalreserves 6.34E-11 0 0.045 0.119 0.907 0 0 -0.118 0.032 0.031
Ethopia internationalreserves -2.67E-
10 0 -0.007
-0.016
0.988 0 0 -0.129 -0.005 -0.004
Rwanda internationalreserves -5.35E-
08 0 -0.35
-1.133
0.278 0 0 -0.544 -0.3 -0.255
South Africa internationalreserves 4.64E-10 0 1.095 1.142 0.274 0 0 0.018 0.302 0.28
© 2014 University of Pretoria. All rights reserved. The copyright in this work vests in the University of Pretoria.

103
Appendix C: Detailed results for Hypothesis 2
Appendix C provides detailed results for Hypothesis 2 referred to in Section 5.4.2
Table C Hypothesis 2: Results
Model Parameter Coefficients
Standardised coefficients t Sig.
95.0% Confidence interval for B
Correlations
B Std. error Beta Lower Upper Zero- Partial Part
Mauritius concentration_ratio1 22.82 8.7 0.623 2.623 0.021 4.024 41.617 0.261 0.588 0.3
Liberia concentration_ratio1 -77.973 79.99 -0.358 -0.975 0.349 -252.255 96.31 -0.122 -0.271 -0.268
Sierra Leone concentration_ratio1 -12.764 22.316 -0.217 -0.572 0.578 -61.387 35.86 -0.198 -0.163 -0.161
Guinea concentration_ratio1 -0.377 13.639 -0.015 -0.028 0.978 -30.093 29.339 0.268 -0.008 -0.007
Mozambique concentration_ratio1 0.731 4.094 0.032 0.179 0.861 -8.113 9.575 0.234 0.049 0.029
Ghana concentration_ratio1 3.107 9.953 0.066 0.312 0.759 -18.24 24.455 0.365 0.083 0.059
Namibia concentration_ratio1 18.115 20.273 0.303 0.894 0.388 -25.683 61.912 0.05 0.241 0.23
Lesotho concentration_ratio1 1.227 6.877 0.029 0.178 0.861 -13.522 15.976 -0.057 0.048 0.029
Cape Verde concentration_ratio1 6.123 6.138 0.205 0.998 0.335 -7.041 19.287 0.145 0.258 0.204
Sudan concentration_ratio1 -4.851 3.096 -0.403 -1.567 0.143 -11.595 1.894 0.052 -0.412 -0.158
Gambia concentration_ratio1 1.504 6.623 0.066 0.227 0.824 -12.701 15.709 0.02 0.061 0.06
Uganda concentration_ratio1 -2.143 1.399 -0.196 -1.532 0.149 -5.164 0.879 0.113 -0.391 -0.132
Tanzania concentration_ratio1 0.335 10.945 0.006 0.031 0.976 -23.512 24.182 -0.675 0.009 0.004
Zambia concentration_ratio1 -1.451 10.561 -0.048 -0.137 0.893 -24.462 21.559 0.112 -0.04 -0.029
Nigeria concentration_ratio1 7.111 27.344 0.094 0.26 0.799 -52.466 66.688 -0.263 0.075 0.043
Ethopia concentration_ratio1 -13.251 17.135 -0.304 -0.773 0.454 -50.584 24.082 -0.389 -0.218 -0.198
Rwanda concentration_ratio1 11.828 19.845 0.166 0.596 0.561 -31.044 54.7 0.243 0.163 0.134
South Africa concentration_ratio1 -30.118 62.439 -0.268 -0.482 0.638 -165.01 104.775 0.227 -0.133 -0.118
© 2014 University of Pretoria. All rights reserved. The copyright in this work vests in the University of Pretoria.

104
Appendix D: Detailed results for Hypothesis 3
Appendix D provides detailed results for Hypothesis 3 referred to in Section 5.4.3.
Table D Hypothesis 3: Results
Country Parameter
Unstandardised Standardise
d t Sig.
95.0% Confidence interval for B
Correlations
B Std. error
Beta Lower Upper Zero Partial Part
Mauritius openness -3.40E-10 0 -0.246 -1.244 0.236 0 0 -0.74 -0.326 -0.142
Liberia openness -1.64E-07 0 -0.363 -0.389 0.704 0 0 -0.147 -0.112 -0.107
Sierra Leone openness 2.70E-09 0 0.04 0.057 0.955 0 0 0.148 0.016 0.016
Guinea openness -7.75E-10 0 -0.235 -0.282 0.783 0 0 -0.381 -0.081 -0.075
Mozambique openness -2.31E-09 0 -0.459 -2.326 0.037 0 0 -0.71 -0.542 -0.376
Namibia openness -2.91E-09 0 -0.846 -1.412 0.181 0 0 -0.156 -0.365 -0.364
Cape Verde openness -1.01E-08 0 -0.632 -3.083 0.008 0 0 -0.613 -0.636 -0.629
Gambia openness -2.73E-09 0 -0.114 -0.394 0.699 0 0 -0.088 -0.105 -0.105
Sudan openness 1.03E-09 0 0.69 2.525 0.027 0 0 -0.196 0.589 0.255
Tanzania openness -1.19E-09 0 -0.557 -2.09 0.059 0 0 0.274 -0.517 -0.247
Zambia openness 2.44E-09 0 0.555 1.132 0.28 0 0 0.664 0.311 0.238
Nigeria openness 9.80E-11 0 0.237 0.428 0.676 0 0 -0.242 0.123 0.071
Ethiopia openness 6.82E-10 0 0.083 0.206 0.84 0 0 0.099 0.059 0.053
© 2014 University of Pretoria. All rights reserved. The copyright in this work vests in the University of Pretoria.

105
Appendix E: Detailed Results for Hypothesis 4
Appendix E provides detailed results for Hypothesis 4 referred to section 5.4.4.
Table E Hypothesis 4: Results
Country Parameter
Unstandardised coefficients
Standardised coefficients t Sig.
95.0% Confidence interval for B
Correlations
B Std. Error Beta Lower Upper Zero Partial Part
Mauritius integration -9.42E-09 0 -0.873 -4.367 0.001 0 0 -0.557 -0.771 -0.499
Liberia integration 2.79E-08 0 0.132 0.268 0.794 0 0 -0.045 0.077 0.074
Sierra Leone integration 3.20E-09 0 0.088 0.222 0.828 0 0 0.036 0.064 0.062
Mozambique integration -8.53E-10 0 -0.454 -2.124 0.053 0 0 -0.719 -0.508 -0.343
Ghana integration -4.01E-09 0 -0.669 -3.142 0.007 0 0 -0.699 -0.643 -0.599
Lesotho integration -3.59E-09 0 -0.792 -4.797 0 0 0 -0.789 -0.788 -0.787
Cape Verde integration -4.68E-08 0 -0.882 -1.469 0.168 0 0 -0.692 -0.39 -0.282
Sudan integration -2.41E-09 0 -1.158 -8.064 0 0 0 -0.892 -0.919 -0.815
Uganda integration -7.14E-09 0 -0.912 -10.073 0 0 0 -0.74 -0.942 -0.868
Tanzania integration -2.16E-09 0 -0.687 -3.409 0.005 0 0 -0.877 -0.701 -0.402
Zambia integration 6.04E-10 0 0.144 0.474 0.644 0 0 0.096 0.135 0.1
Nigeria integration -4.11E-10 0 -0.923 -2.842 0.015 0 0 -0.816 -0.634 -0.469
Morocco integration -9.65E-11 0 -0.225 -0.594 0.562 0 0 -0.193 -0.157 -0.156
Ethiopia integration -1.25E-09 0 -0.29 -0.552 0.591 0 0 -0.3 -0.157 -0.141
Rwanda integration -8.56E-09 0 -0.274 -0.941 0.364 0 0 -0.405 -0.252 -0.212
South Africa integration -1.69E-10 0 -1.085 -1.497 0.158 0 0 -0.241 -0.383 -0.367
© 2014 University of Pretoria. All rights reserved. The copyright in this work vests in the University of Pretoria.

106
Appendix F: Detailed Results of Multi- Collinearity
Appendix F provides detailed analysis for multicollinearity analysis as discussed in Section
5.5.
Table F1 Mauritius: Pearson correlation
GDP
change Concentration
ratio International
reserves Trade
openness Economic integration
Pearson correlation
GDP change 1 0.261 -0.717 -0.74 -0.557
Concentration ratio
0.261 1 -0.624 -0.559 0.573
International reserves
-0.717 -0.624 1 0.952 0.112
Trade openness
-0.74 -0.559 0.952 1 0.167
Economic integration
-0.557 0.573 0.112 0.167 1
Table F2 Mozambique: Pearson correlation
GDP
change Concentration
ratio International
reserves Trade
openness
Economic integratio
n
Pearson correlation
GDP change 1 0.234 -0.666 -0.71 -0.719
Concentration ratio
0.234 1 -0.138 -0.057 -0.388
International reserves
-0.666 -0.138 1 0.962 0.619
Trade openness
-0.71 -0.057 0.962 1 0.549
Economic integration
-0.719 -0.388 0.619 0.549 1
Table F3 Ghana: Pearson correlation
GDP
change Concentratio
n ratio International
reserves Trade
openness Economic integration
Pearson correlation
GDP change 1 0.365 0.288 0.285 -0.699
Concentration ratio
0.365 1 0.79 0.661 -0.446
International reserves
0.288 0.79 1 0.902 -0.284
Trade openness
0.285 0.661 0.902 1 -0.357
Economic integration
-0.699 -0.446 -0.284 -0.357 1
© 2014 University of Pretoria. All rights reserved. The copyright in this work vests in the University of Pretoria.

107
Table F4 Lesotho: Pearson correlation
GDP
change Concentratio
n ratio International
reserves Trade
openness Economic integration
Pearson correlation
GDP change
1 -0.057 -0.819 -0.793 -0.789
Concentration ratio
-0.057 1 0.075 0.008 0.11
International reserves
-0.819 0.075 1 0.934 0.902
Trade openness
-0.793 0.008 0.934 1 0.954
Economic integration
-0.789 0.11 0.902 0.954 1
Table F5 Cape Verde: Pearson correlation
GDP
change Concentratio
n ratio International
reserves Trade
openness Economic integration
Pearson correlation
GDP change
1 0.145 -0.529 -0.613 -0.692
Concentration ratio
0.145 1 0.076 0.095 0.105
International reserves
-0.529 0.076 1 0.965 0.877
Trade openness
-0.613 0.095 0.965 1 0.94
Economic integration
-0.692 0.105 0.877 0.94 1
Table F6 Namibia: Pearson correlation
GDP
change Concentratio
n ratio International
reserves Trade
openness Economic integration
Pearson correlation
GDP change
1 0.05 -0.014 -0.156
Concentration ratio
0.05 1 -0.459 -0.165
International reserves
-0.014 -0.459 1 0.864
Trade openness
-0.156 -0.165 0.864 1
Economic integration
1
© 2014 University of Pretoria. All rights reserved. The copyright in this work vests in the University of Pretoria.

108
Table F7 Gambia: Pearson correlation
GDP
change Concentratio
n ratio International
reserves Trade
openness Economic integration
Pearson
correlatio
n
GDP change
1 0.02 -0.056 -0.088 -0.069
Concentration ratio
0.02 1 0.387 0.397 0.302
International reserves
-0.056 0.387 1 0.992 0.965
Trade openness
-0.088 0.397 0.992 1 0.975
Economic integration
-0.069 0.302 0.965 0.975 1
Table F8 Nigeria: Pearson correlation
GDP
change Concentratio
n ratio International
reserves Trade
openness Economic integration
Pearson correlation
GDP change
1 -0.263 -0.01 -0.242 -0.816
Concentration ratio
-0.263 1 -0.433 -0.633 0.304
International reserves
-0.01 -0.433 1 0.763 -0.022
Trade openness
-0.242 -0.633 0.763 1 0.314
Economic integration
-0.816 0.304 -0.022 0.314 1
Table F9 Morocco: Pearson correlation
GDP
change Concentratio
n ratio International
reserves Trade
openness Economic integration
Pearson correlation
GDP change
1 -0.118 -0.15 -0.193
Concentration ratio
1
International reserves
-0.118 1 0.948 0.723
Trade openness
-0.15 0.948 1 0.854
Economic integration
-0.193 0.723 0.854 1
© 2014 University of Pretoria. All rights reserved. The copyright in this work vests in the University of Pretoria.

109
Table F10: Rwanda: Pearson correlation
GDP
change Concentratio
n ratio International
reserves Trade
openness Economic integration
Pearson correlation
GDP change
1 0.243 -0.544 -0.528 -0.405
Concentration ratio
0.243 1 -0.385 -0.399 0.211
International reserves
-0.544 -0.385 1 0.993 0.473
Trade openness
-0.528 -0.399 0.993 1 0.457
Economic integration
-0.405 0.211 0.473 0.457 1
Table F11 South Africa: Pearson correlation
GDP
change Concentratio
n ratio International
reserves Trade
openness Economic integration
Pearson
correlatio
n
GDP change
1 0.227 0.018 -0.196 -0.241
Concentration ratio
0.227 1 0.677 0.256 0.227
International reserves
0.018 0.677 1 0.783 0.826
Trade openness
-0.196 0.256 0.783 1 0.961
Economic integration
-0.241 0.227 0.826 0.961 1
© 2014 University of Pretoria. All rights reserved. The copyright in this work vests in the University of Pretoria.

110
Appendix G: Detailed Results of Standardised Coefficients
Appendix G refers to detailed analysis for standardized coefficient analysis, as discussed in
chapter 6.
Table G Standardised coefficients
concentration_ratio international_reserves openness integration
Cape Verde 0.228 0.559 -0.345 -0.882
Ethiopia -0.304 -0.007 0.083 -0.29
Gambia 0.151 2.061 -2.861 0.686
Ghana -0.104 0.424 -0.289 -0.728
Guinea -0.015 0.005 -0.235 -0.199
Lesotho 0.022 -0.602 0.066 -0.31
Liberia -0.358 -0.018 -0.363 0.132
Mauritius 0.637 0.053 -0.287 -0.879
Morocco . 0.06 -0.021 -0.218
Mozambique 0.077 1.002 -1.361 -0.562
Namibia 0.303 0.857 -0.846 .
Nigeria 0.094 -0.17 0.237 -0.923
Rwanda 0.18 -1.197 0.854 -0.268
Sierra Leone -0.217 -0.026 0.04 0.088
South Africa -0.532 1.534 0.953 -2.303
Sudan . -0.135 0.319 -1.024
Tanzania 0.006 0.65 -0.557 -0.687
Uganda -0.201 -0.774 0.02 -0.91
Zambia -0.048 0.155 0.555 0.144
Avg Mean -0.005 0.233 -0.213 -0.507
© 2014 University of Pretoria. All rights reserved. The copyright in this work vests in the University of Pretoria.