Emergency Department Patient Flow Simulation at HealthAlliance · i Emergency Department Patient...
240
i Emergency Department Patient Flow Simulation at HealthAlliance Major Qualifying Project Proposal completed in partial fulfillment of the Bachelor of Science degree at Worcester Polytechnic Institute, Worcester, MA Submitted by: ______________________________ Carl Anderson ______________________________ Christopher Butcher ______________________________ Amanda Moreno December 16 th , 2010 In Cooperation With: Lori Pelletier, UMass Memorial Healthcare, Director, Process Improvement Tze Chiam, UMass Memorial Medical Center, Process Improvement Specialist Nicholas Comeau, UMass Memorial Medical Center, Process Improvement Specialist __________________________ Professor Renata Konrad, Advisor
Transcript of Emergency Department Patient Flow Simulation at HealthAlliance · i Emergency Department Patient...

i
Emergency Department Patient Flow Simulation at
HealthAlliance
Major Qualifying Project Proposal completed in partial fulfillment
of the Bachelor of Science degree at Worcester Polytechnic Institute, Worcester, MA
Submitted by:
______________________________
Carl Anderson
______________________________
Christopher Butcher
______________________________
Amanda Moreno
December 16th, 2010
In Cooperation With:
Lori Pelletier, UMass Memorial Healthcare, Director, Process Improvement Tze Chiam, UMass Memorial Medical Center, Process Improvement Specialist
Nicholas Comeau, UMass Memorial Medical Center, Process Improvement Specialist
__________________________
Professor Renata Konrad, Advisor

ii
Abstract
One of the challenges faced by the healthcare industry is the growing number of patients,
which has caused an increase in wait time and staff utilization. These effects greatly influence
patient flow, resulting in unnecessary costs. For this project, we used discrete event simulation to
study and improve processes within the Emergency Department at HealthAlliance Hospital in
Leominster, Massachusetts.

iii
Acknowledgements
Many individuals contributed to the success of our project. First, we would like to thank
the Process Improvement team for their guidance and assistance throughout the duration of the
project. We would also like to thank the staff at HealthAlliance for being so accommodating and
friendly during our observations, interviews, and visits. Lastly, we would like to thank our
project advisor, Renata Konrad, for her continuous guidance and contributions to our project.
iv
Authorship
Carl Anderson
Carl focused on the experimental design of the simulation model received from the Process
Improvement Team. He contributed to the interview process and assisted in time studies.
Christopher Butcher
Christopher was the analyst for all gathered data. He led the data collection efforts through
interviews, observations, and time studies. He also parsed data received from the UMass Process
Improvement team.
Amanda Moreno
Amanda was the coordinator of the group, ensuring meetings were scheduled and action items
were accomplished. She was responsible for validating and verifying the simulation model
received from the Process Improvement Team, and was also involved in observations.
v
Table of Contents
Abstract ......................................................................................................................................................... ii
Acknowledgements ...................................................................................................................................... iii
Authorship ................................................................................................................................................... iv
Table of Figures ......................................................................................................................................... viii
Table of Tables ............................................................................................................................................ ix
Executive Summary ...................................................................................................................................... 1
Background ............................................................................................................................................... 1
Research Methodology .............................................................................................................................. 1
Results and Conclusions ........................................................................................................................... 2
Chapter 1: Introduction ................................................................................................................................. 3
Chapter 2: Literature Review ....................................................................................................................... 5
2.1 Lean in Healthcare ............................................................................................................................. 5
2.2 Challenges Facing Emergency Departments ...................................................................................... 7
2.3 Addressing Patient Flow Issues .......................................................................................................... 8
2.3.1 Queuing Analysis ......................................................................................................................... 8
2.3.2 Markov Processes ........................................................................................................................ 9
2.3.3 Simulation .................................................................................................................................... 9
2.4 Conclusion ........................................................................................................................................ 12
Chapter 3: Methodology ............................................................................................................................. 13
3.1 Data Collection and Analysis ........................................................................................................... 13
3.1.1 Patient Data ................................................................................................................................ 14
3.1.2 Interviews ................................................................................................................................... 14
3.2 Testing the Arena Simulation Model ................................................................................................. 15
3.3 Experimental Design ......................................................................................................................... 16
3.4 Conclusion ........................................................................................................................................ 18
Chapter 4: Results ....................................................................................................................................... 19
4.1 Data Collection and Analysis ........................................................................................................... 19
4.1.1 Patient Data ................................................................................................................................ 19
4.1.2 Interviews ................................................................................................................................... 23
4.2 Testing the Arena Simulation Model ................................................................................................. 25
4.3 Experimental Design ......................................................................................................................... 25

vi
4.4 Conclusion ........................................................................................................................................ 28
Chapter 5: Future Work .............................................................................................................................. 29
5.1 Redesign Emergency Department Layout ......................................................................................... 29
5.2 Integration of Lean ........................................................................................................................... 30
5.3 Improvement to Pre-Admittance Processes ...................................................................................... 30
5.4 Conclusion ........................................................................................................................................ 32
Chapter 6: Conclusion ................................................................................................................................. 33
6.1 Limitations of the Project .................................................................................................................. 33
6.2 Recommendations ............................................................................................................................. 34
6.2.1 Data Collection & Analysis ....................................................................................................... 34
6.2.2 Testing the Arena Simulation Model ......................................................................................... 35
6.2.3 Experimental Design .................................................................................................................. 36
6.3 Final Remarks ................................................................................................................................... 37
References ................................................................................................................................................... 38
Appendix A: Glossary of Terms ................................................................................................................. 43
Appendix B: Process Flow Map ................................................................................................................. 45
Appendix C: Consent Form for Interviews ................................................................................................. 46
Appendix D: Interview Questions............................................................................................................... 47
General ................................................................................................................................................... 47
Charge Nurse .......................................................................................................................................... 47
Triage Nurse ........................................................................................................................................... 47
Radiologist .............................................................................................................................................. 48
Nurse ....................................................................................................................................................... 49
Physicians ............................................................................................................................................... 49
Housekeeping Employee ......................................................................................................................... 49
Appendix E: Summary of Interviews and Observations ............................................................................. 51
Staffing Nurse.......................................................................................................................................... 51
Head Nurse ............................................................................................................................................. 51
Physician ................................................................................................................................................. 51
Housekeeping .......................................................................................................................................... 52
Triage Nurse ........................................................................................................................................... 52
Director of Radiology ............................................................................................................................. 52
Appendix F: Simulation Test Matrices ....................................................................................................... 53
vii
Allowable Conditions .............................................................................................................................. 53
Non-Allowable Conditions ...................................................................................................................... 54
Appendix G: Simulation Model Run Reports ............................................................................................. 65
Appendix H: Experimentation Plan .......................................................................................................... 210
Experimentation Phase 1 (Original Model v. Plus One Nurse) ............................................................ 210
Experimentation Phase 2 (Four Scenarios) .......................................................................................... 211
Experimentation Phase 3 (combinations Based on Four Input Variables) .......................................... 212
Appendix I: Experimentation Results ....................................................................................................... 214
Experimentation Phase 1 (Original Model v. Plus One Nurse) ............................................................ 214
Experimentation Phase 2 (Four Scenarios) .......................................................................................... 215
Experimentation Phase 3 (Combinations Based on Four Input Variables).......................................... 216
Appendix J: Relationship Chart ................................................................................................................ 218
Appendix K: Parsed Data .......................................................................................................................... 220
Patient Patterns Over Time .................................................................................................................. 220
Average Patient Distributions Over Time ............................................................................................. 222
Length of Stay ....................................................................................................................................... 222
Arrival Method Acuity Distribution ...................................................................................................... 223
Admitted Patient Acuity Distribution .................................................................................................... 223
Treatment Distribution .......................................................................................................................... 224
Treatment Combinations ....................................................................................................................... 224
Staffing Requirements and Emergency Department Patient Patterns .................................................. 225
Sunday Staffing Model ..................................................................................................................... 225
Monday Staffing Model .................................................................................................................... 226
Tuesday Staffing Model .................................................................................................................... 227
Wednesday Staffing Model ............................................................................................................... 228
Thursday Staffing Model .................................................................................................................. 229
Friday Staffing Model ....................................................................................................................... 230
Saturday Staffing Model ................................................................................................................... 231

viii
Table of Figures
Figure 1: Spaghetti Diagram (Mortland & Mortland)................................................................................... 6
Figure 2: Outline of Methodology .............................................................................................................. 13
Figure 3: Average Daily Patients per Month .............................................................................................. 20
Figure 4: Average Daily Patients per Day .................................................................................................. 20
Figure 5: Mental Health Patient Arrival per Month .................................................................................... 21
Figure 6: Patient Throughput Comparison ................................................................................................ 214
Figure 7: Patient Throughput Across Scenarios ....................................................................................... 215
Figure 8: Monthly Patient Patterns ........................................................................................................... 220
Figure 9: Daily Patient Patterns ................................................................................................................ 220
Figure 10: Monthly Mental Health Patient Patterns ................................................................................. 221
Figure 11: Average Daily Patient Arrival by Day .................................................................................... 222
Figure 12: Average Daily Patient Arrival by Month ................................................................................ 222
Figure 13: Hourly Patterns of Emergency Department Patients on Sunday ............................................. 225
Figure 14: Nurse Staffing Comparison for Sunday................................................................................... 225
Figure 15: Hourly Patterns of Emergency Department Patients on Mondays .......................................... 226
Figure 16: Nurse Staffing Comparison for Monday ................................................................................. 226
Figure 17: Hourly Patterns of Emergency Department Patients on Tuesdays .......................................... 227
Figure 18: Nurse Staffing Comparison for Tuesday ................................................................................. 227
Figure 19: Hourly Patterns on Emergency Department Patients on Wednesdays .................................... 228
Figure 20: Nurse Staffing Comparison for Wednesday ............................................................................ 228
Figure 21: Hourly Patterns of Emergency Department Patients on Thursdays ........................................ 229
Figure 22: Nurse Staffing Comparison for Thursday ............................................................................... 229
Figure 23: Hourly Patterns of Emergency Department Patients on Fridays ............................................. 230
Figure 24: Nurse Staffing Comparison for Friday .................................................................................... 230
Figure 25: Hourly Patterns of Emergency Department Patients on Saturdays ......................................... 231
Figure 26: Nurse Staffing Comparison for Saturday ................................................................................ 231
ix
Table of Tables
Table 1: Weighted Length of Stay for Emergency Department Patients .................................................... 21
Table 2: Acuity Distribution for Walk-In and Ambulance Patients ........................................................... 22
Table 3: Patient Admittance Distribution ................................................................................................... 22
Table 4: Acuity Distribution for Admitted Patients .................................................................................... 22
Table 5: Acuity Distribution for Treatments ............................................................................................... 23
Table 6: Total Treatments Performed ......................................................................................................... 23
Table 7: Treatment Combinations............................................................................................................... 23
Table 8: Two Scenario Comparison ............................................................................................................ 26
Table 9: Four Scenario Comparison ........................................................................................................... 26
Table 10: Optimal Control Combinations ................................................................................................... 27
Table 11: Recommended Control Combinations ........................................................................................ 36
Table 12: Test Matrix for Allowable Conditions ........................................................................................ 53
Table 13: Test Matrix for Non-Allowable Conditions ................................................................................ 54
Table 14: Two Scenario Comparison ........................................................................................................ 214
Table 15: Four Scenario Comparison ....................................................................................................... 215
Table 16: Optimal Control Combinations ................................................................................................. 216
Table 17: Maximum Throughput .............................................................................................................. 217
Table 18: OptQuest Constraints ................................................................................................................ 217
Table 19: A Side Relationship Chart ........................................................................................................ 218
Table 20: B Side Relationship Chart......................................................................................................... 219
Table 21: Weighted Length of Stay for Emergency Department Patients ................................................ 222
Table 22: Acuity Distribution for Walk-In and Ambulance Patients........................................................ 223
Table 23: Patient Admittance Distribution ............................................................................................... 223
Table 24: Acuity Distribution for Admitted Patients ................................................................................ 223
Table 25: Acuity Distribution for Treatments ........................................................................................... 224
Table 26: Total Treatments Performed ..................................................................................................... 224
Table 27: Treatment Combinations........................................................................................................... 224

1
Executive Summary
The Emergency Department at the HealthAlliance Hospital in Leominster, MA, does not
currently have the capacity or manpower to help its clients quickly enough. This has led to
patient flow delays, disruptions, and inefficiencies, and it has caused some patients to leave
before being served, resulting in a loss of potential revenue and safety concerns for these
patients. In order to combat these challenges, we analyzed data and conducted interviews to
establish a comprehensive understanding of the hospital’s emergency department, strengthened
the existing Arena simulation model through verification and validation, and performed
experimentation of the model to improve operations and patient flow.
Background
HealthAlliance Hospital has been providing community care since 1902. In order to
provide ―clinical and service excellence to individuals in [its] diverse communities‖
(HealthAlliance), constant improvement efforts to quality and safety of care have been
undertaken. To improve on the processes in the hospital, resource flow and allocation must be
identified. Analysis of flow and the tracking of resource allocation is challenging because of
numerous emergency department processes and varying acuity levels for patients. To analyze
flow while combating these issues, our group used simulation modeling.
Simulation provides a model of a real life process, or series of processes, that can be used
to see how entities flow through a system. Changes can then be made to the process and the
effects can be seen without the commitment of any physical resources or interruption of the
system. This form of evaluation has become an effective tool for many healthcare
institutions. By identifying constraints, bottlenecks, and inefficiencies within healthcare
systems, simulation has proven to be a valuable resource in saving time and money while
improving the quality of care.
Research Methodology
To identify potential improvements in the Emergency Department at HealthAlliance, we
analyzed patient flow data, performed interviews, and conducted observations. Through the use
2
of visual aids such as value stream maps and spaghetti diagrams, we were able to understand
patient flow in the emergency department.
After the model was built, we tested the model to ensure it ran correctly and accurately
depicted the emergency department’s patient flow. We did this first through verification, in
which we debugged the model and checked that it ran as intended. After verification, we
validated the model, which means that we ensured that it behaved as the emergency department
did in real life. We developed test matrices, in which we defined what we were looking for, to
organize the model testing process.
Once we verified and validated model, we performed experiments on the model to
identify possible constraints and bottlenecks within the system. We determined which of the
possible parameters and structural assumptions had the greatest effect on the selected
performance measure of patient flow. To accomplish this, we grouped these input parameters,
conducted production runs, and observed the effects on the groups as we carried out these runs
through different levels (values assigned to inputs).
Results and Conclusions
During data analysis, we discovered that some of the hospital’s beliefs about patient flow
patterns were correct, but we also discovered that others were not. The data analysis painted a
clear picture of the emergency department’s operations and helped us to identify potential areas
for improvement. Because patient flow varies throughout the week, we recommend that
HealthAlliance create a staffing schedule that better matches the patient arrival distribution.
During testing, we discovered that the model was accurate but had room for improvement.
During experimentation, we conducted hundred of simulation runs in which we changed the
values of staffing and structural inputs within the simulation to find an optimal input
combination that maximized patient throughput.

3
Chapter 1: Introduction
Healthcare is essential to the general welfare of society. It provides for the prevention,
treatment, and management of illness and the preservation of mental and physical well-being
through the services offered by medical and allied health professions (Houghton Mifflin
Company, 2007). Today, the issue of healthcare is receiving much attention through the media
and politics. Healthcare is faced with unprecedented challenges, such as staffing shortages
(American Nurses Association, Inc., 2010) (Cornerstone Communications Group, 2001), an
aging population (Hellmich, 2008), rising costs (Bodenheimer, 2010), and inefficient hospital
processes (New England Healthcare Institute, 2010). In light of these challenges, a need for
review and reform of our healthcare practices has become apparent.
Lean is one way in which these issues can be addressed. The basic concept of lean is
―using less to do more‖ (Institute for Healthcare Improvement, 2005). For healthcare, in
particular, one can apply the principles of lean thinking to improve such processes as patient wait
time, levels of staffing, and quality of care. Improvements to such processes can greatly impact
the health of the community.
HealthAlliance Hospital, a member of UMass Memorial Healthcare located in
Leominster, Massachusetts, is facing issues common in the healthcare industry. These issues
include staffing, scheduling, and perceived inefficient operations. HealthAlliance’s Emergency
Department is currently understaffed by six employees, but they cannot hire additional staff due
to a hiring freeze. As a result, their emergency department staff feels overworked. Furthermore,
the Emergency Department at HealthAlliance has a bed turnover rate of 1900 patients per bed
per year, which is high compared to the national average of 1400 patients per bed per year.
Patients must wait several hours before entering the emergency department, which has caused
patients to leave without being served. The national average for patients leaving without being
seen is about 2% (Agency for Healthcare Research and Quality, 2007). To address these issues
and provide a higher quality of care, HealthAlliance is examining its processes within the
emergency department. The objective of our project was to:
Collect and analyze data in order to accurately define the current state of patient
flow at the HealthAlliance Emergency Department.
4
Verify and validate the existing simulation model, which was created by the
UMass Process Improvement team, to ensure that the model behaved as intended
and that it accurately represented the emergency department’s current state.
Perform experimentation to explore potential improvements to the HealthAlliance
Emergency Department.
In Chapter 2, we included an overview of literature about lean applications in healthcare,
problems facing the nation’s emergency departments, and methods used to improved patient
flow. In Chapter 3, we explain our methodology, which includes data collection and analysis,
testing of the Arena simulation model to ensure its functionality and validity, and
experimentation to explore the affects of changing metrics in the HealthAlliance Emergency
Department. In Chapter 4, we present the results we obtained after implementing our
methodology. In Chapter 5, we suggest areas to explore in the future to improve the
HealthAlliance Emergency Department. Lastly, in Chapter 6, we discuss the implications of our
project, identify limitations present, and make recommendations.

5
Chapter 2: Literature Review
Before we could implement improvements in the Emergency Department at
HealthAlliance, we first needed to develop a solid understanding of lean applications in
healthcare and methods to address patient flow issues. Accordingly, this section discusses the
concepts of lean thinking, implementing lean into an organization, and successes lean has had
within healthcare. We then discuss various methods to model the patient flow and identify waste
within the process, including queuing analysis, Markov processes, and simulation.
2.1 Lean in Healthcare
The general principle behind lean is ―using less to do more‖ (Institute for Healthcare
Improvement, 2005). The concept of lean thinking was developed by the Japanese as a way to
describe the elimination of muda, or waste, in their manufacturing processes. Waste
encompasses any action that does not add value to the product or service from the perspective of
the customer and anything for which the customer is not willing to pay (Hadfield, 2006). For
example, ―a patient does not want to pay for a second surgical tray if only one instrument was
used from it‖ (Hadfield, 2006).
The first step in lean thinking is the identification of value-added activities. An activity is
considered to add value only if it is essential to meeting the needs of the customer. For example,
if a patient goes to a hospital for a blood test, the only thing the customer is willing to pay for is
the test results (England, 2010).The second step is the identification of non-value-added
activities, or waste. The eight chief wastes in healthcare are ―unnecessary services or
overproduction, mistakes or defects, delays or waiting, unnecessary motion or movement, over-
processing, excess inventory, excess transport, and unused creativity‖ (Hadfield, 2006). In the
blood test example, there are several steps that must happen before the lab results can be
determined. Waste is often ―baked into those steps—such as movement to different stations to
complete registration, waiting for a registration person, waiting for an open room, moving to a
different room, etc.‖ (England, 2010).
Two process mapping tools—value stream maps and spaghetti diagrams—can help
identify value-added and non-value-added activities. A value stream map, which is a tool used to

6
follow the flow of resources,
creates a visual representation
of both value and non-value
added processes (Kaisen
Institute Lean Advisors, 2010).
Without a value stream map,
obvious waste, and even
hidden waste, could not be
identified. An example of
obvious waste is repeated
activities, and an example of
hidden waste is managing
inventories and the costs
associated with them (Young &
McClean, 2009). A spaghetti diagram, as shown in Figure 1, can also create visual
representations by drawing the ―actual flow‖ of a process through a system. Through this
drawing, distances travelled can be determined to provide baseline performance (Six-Sigma-
Material.com, 2007).
The entire company must be actively engaged and involved in lean applications, as their
input and acceptance of lean initiatives are necessary for success. There must be a top-down
transformation, with the full commitment from the entire workforce (Gioia & Herman).
According to HealthMEDX, ―for every dollar spent on healthcare, over 75 cents is spent
on the non-patient care activities of communicating, scheduling, coordinating, supervising, and
documenting care (Hadfield, 2006).‖ This indicates that there is a huge amount of activity that is
not essential to the needs of the customer and illustrates a great potential for improvement to
healthcare operations.
There are a number of successful examples of lean applications in hospitals. At Avera
McKennan [a hospital in Sioux Falls, South Dakota], a team observed emergency department
patients to identify value-added time and waiting time. While the average length of stay was 140
Figure 1: Spaghetti Diagram (Mortland & Mortland)
7
minutes, the team discovered that two-thirds of that time was spent waiting. The department
reconfigured its triage process, ensuring each patient would be initially seen within 20 minutes of
arrival (Graban, 2009).
Virginia Mason Medical Center in Seattle, Washington, is a leader for applying lean to
healthcare. Through the development of the Virginia Mason Production System (VMPS), a
―management methodology based on principles of lean management from the Toyota Production
System (Virginia Mason Management Principles, 2006)‖, the hospital has continually improved
patient care while also saving money. While designing a new Center for Hyperbaric Medicine,
the team at Virginia Mason was able to save $2 million in construction costs and also provided
treatment to more patients. Virginia Mason Chairman and CEO Gary Kaplan, MD, told the
Institute for Healthcare Improvement that the hospital is ―continually identifying ways to provide
quality care and eliminating non-value-added elements of the patient experience‖ (Virginia
Mason Management Principles, 2006).
2.2 Challenges Facing Emergency Departments
There are a number of issues present in the nation’s emergency departments. Problems
include lack of resources, long wait times, overuse of emergency departments, the high stress
work environment, medical errors, and staff dissatisfaction. The United States Center for Disease
Control (CDC) and the American College of Emergency Physicians both found that emergency
departments, in general, tend to be overcrowded and have a lack of resources such as beds. This
has caused long wait times, even for ambulance patients, sometimes resulting in death
(AFSCME, 2006) (American College of Emergency Physicians, 2010). Another problem facing
emergency departments is their overuse; patients visit the emergency department for non-urgent
care. Reasons include mental health issues, the patients’ desire to not wait for an appointment,
and lack of primary care (Dr. Erik Steele, 2009). The short time allowed for decision making and
the fact that many processes occur simultaneously cause a high stress environment in the
Emergency Department; as a result, employees may feel pressured to make quick decisions and
not have much time to make the most efficient decision leading to wasted time and processes
(Croskerry, Cosby, Schenkel, & Wears, 2008). Another issue plaguing American emergency
departments is staff dissatisfaction, which includes overworked staff and nurse burnout (Vahey,
Aiken, Sloane, Clarke, & Vargas, 2004). Lastly, these conditions may contribute to medical

8
errors, such as misdiagnosis, incorrect procedures, and incorrect prescriptions (Fordyce, et al.,
2003). The extent and impact of these issues may vary from place to place, but they are present
nonetheless and contribute to difficulties in emergency departments across the country.
2.3 Addressing Patient Flow Issues
Patient flow, which is the progression of patients through healthcare institutions
(Kucukyazici, Verter, Nadeau, & Mayo, 2007), is one area that can be examined to identify non-
value-added activities. Patient and admissions, patient routing, flow schemes, and scheduling and
availability of resources can significantly impact on patient flow (Jacobson, Hall, & Swisher,
2006). A number of quantitative approaches exist to document, analyze, and ultimately improve
these three areas affecting patient flow. The following subsection discusses three such
approaches used to measure, analyze and describe patient flow—queuing theory, Markov
processes and discrete event simulation.
2.3.1 Queuing Analysis
One method to document and analyze patient flow is the use of queuing models. Queuing
analysis is ―a set of analytic techniques in the form of closed mathematical formulas to describe
properties of the processes with a random demand and supply‖ (Alexander Kolker).
Queuing analysis is useful to determine layout planning, resource allocation, and
―appropriate levels of staff, equipment, and beds‖ (Green, 2006). Queuing analysis offers certain
modeling advantages. Outputs of a queuing model are fairly easy to understand and utilize when
predicting performance measures‖ (Green, 2006). Because of these strengths, queuing analyses
can be used without incurring a high cost and are more accurate at predicting optimal solutions
than simply ―estimating the system performance for a given scenario‖ (Green, 2006).
A disadvantage of queuing analysis is that ―a number of simplifying assumptions must be
made to derive equations for parameters of interest‖ (Stallings, 2000). One problem for this is
that a queuing model can only be effective when patient arrivals are entirely random; however,
patient arrivals tend to be ―non-ordinary and non-stationary, a process for which queuing
[models] are not valid‖ (Alexander Kolker). In turn, if multiple patients were admitted
simultaneously, queuing analysis would only account for one patient in the model.

9
2.3.2 Markov Processes
Markov analysis considers a set of states or events and analyzes the tendency of one
event to be followed by another. Through Markov analysis, a new series of random yet related
events can be created (Fuqua, Markov Analysis, 2003). There are two different methods for
Markov analysis: Markov Chain and Markov Process. The Markov Chain ―assumes discrete
states and a discrete time parameter; with the Markov Process, states are continuous‖ (Fuqua,
Markov Analysis, 2003).
Markov modeling offers several advantages. For example, Markov models can be used
to easily determine the probability of one event resulting from another event or a sequence of
sub-events (Fuqua, Markov Analysis, 2003). Markov models can also easily perform system
reconfiguration due to failures.
A major drawback of Markov modeling is the exponential growth of the number of states
within the model as the system increases. Large systems have many different processes, which
are not only complicated and challenging to construct but are also ―computationally extensive‖
(Fuqua, Markov Analysis, 2003). Markov models can be used when analyzing smaller ―pseudo-
systems‖ with strong dependencies, and other analysis techniques can analyze the entire system
using ―simpler probabilistic calculation techniques‖ (Fuqua, Markov Analysis, 2003).
2.3.3 Simulation
Fundamentally, simulation is a model of a process or system over a period of time.
Within the last 30 years, simulation has become one of the most popular tools in evaluating a
given system. Its popularity can be attributed to the fact that most complex, real-world systems
with stochastic, or random, elements require more than analytical mathematical models to
describe their behavior. Thus, simulation provides for an effective method in solving these kinds
of problems.
Simulation has many advantages over other common operation research tools like linear
programming and queuing theory. For example, simulation allows for the testing of various
system scenarios without the commitment of physical resources. This, in turn, generally proves
to be a wise long-term investment. Arena Basic Edition, a popular simulation software, has an
initial cost of $1900. It is not uncommon for companies to make a profit of ten times this initial
10
cost after implementation of solutions offered by simulation. Another strength is the ability of
time compression and expansion for evaluating a system at a given time. For instance, with
simulation software, a user can observe all of the details of a process within a one second time
frame; likewise, the user can view all of the data of a process for a day, month, or even year
timeframe.
Although there are many benefits when using simulation software, there are some
disadvantages as well. Simulation may be costly to initially develop; the cost of the software and
the training to use it may prove to be too expensive for some businesses. In addition, the
construction and validation of a simulation model may be costly and time consuming, as some
models require thousands of data points. Another challenge of simulation is that the user needs to
establish the inputs of the simulation model; if the correct inputs are not identified, then the
model will not provide an accurate portrayal of real life. This could result in a company choosing
unjust solutions and therefore wasting money.
Apart from the advantages and disadvantages of simulation, there are several ways to
classify simulation models. It may, however, be easiest to organize them into three
classifications: static vs. dynamic, continuous vs. discrete, and deterministic vs. stochastic
(Kelton, Sadowski, & Sturrock, 2007):
A static model does not consider time. It is a representation of a system at a particular
time or a system in which time plays no role. Dynamic models, on the other hand,
represent systems that evolve over time. They are the most common operational models.
In a continuous model, the state of the system changes constantly over time (e.g. the level
of a reservoir as water flows in and is let out). In a discrete model, however, change can
occur only at separated events in time. These events can be can be defined as
instantaneous occurrences that may change the state of a system (e.g. arrival of
customers).
Deterministic models are those that have no random inputs. An example would be an
agency that has a fixed schedule for a given day. In contrast, stochastic models are those
that operate with at least some inputs being random. Often, in computer-based
simulations these random inputs are accounted for through the use of probability
distributions (Kelton, Sadowski, & Sturrock, 2007).
11
Despite the differences among these kinds of simulations, the processes required to
conduct these studies remain relatively the same. The first steps in conducting a simulation
study begin with the formulation of a problem and a plan of the study. Every study must begin
with a clear statement of the study’s overall objectives and specific issues to be addressed. This
provides for a clear vision that is essential for success. The overall study should then be planned
in terms of the people, the cost, and the time required for each aspect (Law & Kelton, 1991).
The next step in performing a simulation study is to collect data and define the model.
Information and data should be collected on the system of interest and used to specify operating
procedures and probability distributions for the random variables used in the model. Once
enough data is collected, one can start building and validating the model. When building a
model, it is imperative to involve people in the study who are intimately familiar with the
operations of the actual system. This will ensure the accuracy, credibility, and validity of the
study. Once enough information is gathered about the system, construction can begin through the
use of a computer program. Software, like Arena, can provide alternative and interchangeable
templates of graphical simulation modeling and analysis modules that can combine to build a
fairly wide variety of simulation models (Law & Kelton, 1991).
Pilot runs should then be made once the model is verified. These runs can be used to test
the sensitivity of the model’s output to small changes in the inputs. If the outputs change greatly,
the user must obtain a better estimate of the input parameters (Law & Kelton, 1991).
One can design experiments if the pilot runs confirm the validity of the simulation model.
The first step in the design process is to find out which of the many potential parameters and
structural assumptions have the greatest effect on a performance measure; in other words, the
user must determine which set of model specifications appears to lead to optimal performance.
Once this information is established, decisions need to be made on issues, such as initial
conditions for the simulation runs, the length of the warm-up period (if any), the length of the
simulation run, and the number of independent simulation runs to make for each alternative (Law
& Kelton, 1991).
Production runs can take place to provide performance data on the system designs of
interest once the experiments are established. Statistical techniques are used to analyze the data

12
generated from the production runs. The analysis is then used to decide which simulated system
is best, relative to some specified measure of performance. Finally, the results are documented,
presented, and if all goes well implemented (Law & Kelton, 1991)
2.4 Conclusion
This knowledge provided for a solid foundation for the rest of the evaluation process as it
established a framework to help in executing the three phases of our methodology. Our
comprehension of the application of lean principles in healthcare directly affected the quality of
our process observations and staff interviews—both essential parts of the data collection phase of
our methodology. Our understanding of simulation and the steps involved in conducting a
simulation study gave us a strong base for verifying and validating the simulation model. Lastly,
our awareness of the challenges facing emergency departments and the techniques associated
with addressing patient flow provided us with insight when establishing the parameters of our
experiments.
13
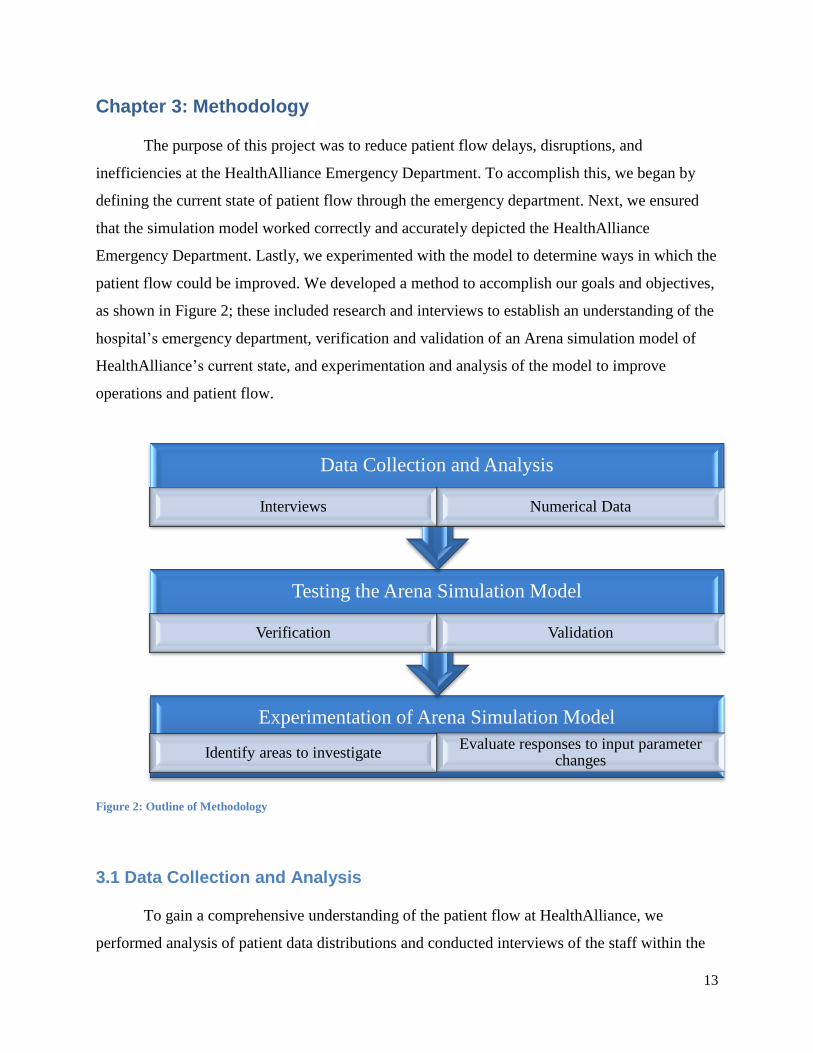
Chapter 3: Methodology
The purpose of this project was to reduce patient flow delays, disruptions, and
inefficiencies at the HealthAlliance Emergency Department. To accomplish this, we began by
defining the current state of patient flow through the emergency department. Next, we ensured
that the simulation model worked correctly and accurately depicted the HealthAlliance
Emergency Department. Lastly, we experimented with the model to determine ways in which the
patient flow could be improved. We developed a method to accomplish our goals and objectives,
as shown in Figure 2; these included research and interviews to establish an understanding of the
hospital’s emergency department, verification and validation of an Arena simulation model of
HealthAlliance’s current state, and experimentation and analysis of the model to improve
operations and patient flow.
Figure 2: Outline of Methodology
3.1 Data Collection and Analysis
To gain a comprehensive understanding of the patient flow at HealthAlliance, we
performed analysis of patient data distributions and conducted interviews of the staff within the
Experimentation of Arena Simulation Model
Identify areas to investigate Evaluate responses to input parameter
changes
Testing the Arena Simulation Model
Verification Validation
Data Collection and Analysis
Interviews Numerical Data

14
emergency department. This was important because the quality of a simulation is judged on its
―ability to imitate the behavior of a particular system‖ (Blake, Carter, & Richardson, 1996).
3.1.1 Patient Data
First, we analyzed data that the Process Improvement Team from UMass Memorial had
already acquired from HealthAlliance. There was three years of fiscal year data from October
2007 through September 2010. It included patient arrival and departure times, a CPT billing code
and description, and the mental health classification of the patient (as applicable). The patient
data consisted of emergency room patients and urgent care patients. When performing analysis
on the data, we eliminated urgent care patients from the data set.
The data was parsed, identifying the patient arrival rates that vary from month to month,
as shown in Figure 3, and day to day, as shown in Figure 4. The weekly patient arrival
distribution was also identified.
We received a second set of patient data spanning 12/04/09 to 11/30/10 from the Process
Improvement Team; this set of patient data contained information regarding arrival time, arrival
method, acuity level, whether the patient was admitted or not, any tests the patient received, and
patient departure time. The time a patient left the emergency department was only recorded for
admitted patients, which limited length of stay calculations.
We also calculated the amount of treatments administered to patients. For the different
treatments, we identified the total number performed and a breakdown of treatments by acuity
levels. We evaluated the distribution of patients receiving multiple treatments. We determined
the ratio of patient admittance and then separated it by acuity level. We identified the number of
patients arriving by ambulance, also separated by acuity level.
3.1.2 Interviews
After gaining a general understanding of patient arrival distribution in the Emergency
Department through fiscal year data, we conducted interviews of various emergency department
staff, including doctors, nurses, and technicians. There were three chief goals that we
accomplished throughout the interview process:
15
1. A general understanding of HealthAlliance hospital, its operations, and its employees.
2. Identification of potential staff to follow for observations.
3. Identification of issues faced by the emergency department.
We conducted in-person open-ended interviews to complete these goals. As suggested by
the UMass Process Improvement team, we asked role-specific questions to all interviewees to
understand each step a patient takes within the emergency department and to ensure the
interviewees were confident in the answers they provided us. Our questions were open-ended as
to avoid limiting responses. Interviewees were encouraged to clarify answers when needed, but
the interviews were conducted in a ―question and answer‖ type of session (Suler). Because we
asked the same questions to interviewees with similar roles, ―this approach facilitated faster
interviews that were more easily analyzed and compared‖ (Valenzuela & Shrivastava).
When conducting the interviews, we were sure to eliminate interview bias. This was
important because if bias had been present, our results would have been jeopardized and we
would have received an inaccurate perception of the hospital (Valenzuela & Shrivastava). In
order to reduce bias, we began by ensuring that our questions did not lead the interviewees to
answer in a certain way. Next, we avoided the use of double-barreled questions (multi-part
questions). Double-barreled questions could have led to confusion if interviewees answered one
but not all of the questions or if they agreed with part of the question (Dana Lynn Driscoll &
Brizee, 2010). Our questions were designed with simplicity in mind, to reduce the deviation of
the interviewees’ interpretation. In compliance with the Institutional Review Board (IRB)
agreement, interviewees completed consent forms, as shown in Appendix C.
3.2 Testing the Arena Simulation Model
We tested the Arena simulation model, created by the UMass Process Improvement team,
to ensure that it was functional and accurate. We had two major test stages—verification and
validation. First, we performed verification to debug the model and ensure that it performed as
intended (Macal, 2005). Next, we completed validation of the model to ensure that it behaved as
it would in real life and that it accurately represented the patient flow at the HealthAlliance
Emergency Department.
16
To verify the model, we created a test plan identifying both allowable conditions (or
situations that should be represented in the model) and non-allowable conditions (or situations
that were undesirable in the model). The test plan included various types of conditions, including
those related to patient flow order, entrance and departure of the system, times in queue, and
service times. In the test plan, we also identified a method to evaluate the conditions present in
the model. We identified the presence of the conditions in a variety of ways; our methods
included checking the organization of and specifications in the modules in the simulation model,
evaluating data produced in the Run Report, and graphing various metrics (e.g. patient entry
patterns) when running the model. We checked each condition three times, by running three
replications of the model, to ensure the accuracy of our results. See Appendix F for all test cases.
To validate the model, the team compared the simulation results to real-life data, spoke
with emergency department employees, and conducted observations of the emergency
department. To compare the simulation results to the data from HealthAlliance’s Emergency
Department, we identified two metrics: (1) the patient times from point of entry to discharge
from the emergency department and (2) the number of patients through the system in a given
amount of time. We compared the metrics from the simulation to information obtained through
the data analysis portion of our project. We also visited HealthAlliance to confirm the validity of
the model. We met with HealthAlliance Emergency Department employees and asked questions
to validate that our model was an accurate representation of their emergency department. We
asked them about how patients move through the emergency department, verifying that the flow
and layout of the model were correct. Additionally, we conducted observations to strengthen our
comprehension of the Emergency Department and to identify processes that were not accurately
depicted in the model.
3.3 Experimental Design
After verification and validation, we then evaluated the model for different scenarios in
order to identify possible constraints and bottlenecks within the emergency department.
Identifying these areas of concern helped to determine a set of model specifications that could
potentially lead to improved performance for the HealthAlliance Emergency Department (Law &
Kelton, 1991). We were able to compare the responses, or performance outputs, from hundreds
of different scenarios using Arena’s Output Analyzer, Process Analyzer (PAN), and OptQuest
17
functions in order to establish a set of input parameters that maximized patient flow. The
procedure used is located in Appendix H.
When comparing two different scenarios (e.g. the original model versus the original
model with one more nurse per shift), we used the Output Analyzer application. The Output
Analyzer was used to confirm any significant statistical differences between the original model
and the model with one added nurse per shift. In addition, it provided a quantified magnitude of
these differences. For example, with one more nurse per shift, we expected an increase in patient
flow and a reduction in waiting time for patients. However, we were not sure of the total
throughput enabled by this addition and to what extent wait time would be reduced. We
performed a number of replications for each scenario because more runs with a tight confidence
interval generally results in a more accurate average. Through this, the Output Analyzer was able
to determine the impacts on patient throughput and wait time.
To evaluate the responses of many different scenarios at once, we used the Process
Analyzer application. The Process Analyzer helped in managing the practical mechanics of
making the model changes for all the different scenarios. It also proved beneficial in evaluating
responses in a statistically valid way to sort out which scenarios differ significantly from others,
which scenarios may be better than others, and which scenario would be best for our objective
(Kelton, Sadowski, & Sturrock, 2007). To gain perspective, we considered the hypothetical
situation that the Health Alliance Emergency Department was given $120,000 to help in
improving patient flow. With this money they were allowed to do any of the following: add two
nurses, add two rooms, add a nurse and a room, or improve the COW computer systems to run
faster. Once we entered these different scenarios into the Process Analyzer, PAN executed each
scenario delivering the response results for each one in a table. Therefore, we had a table
featuring each scenario with their respective responses. In addition, we created bar charts to
clearly see which scenario yielded the highest numerical value for patient throughput.
We also considered the situation in which we were free to explore all possibilities (in
terms of staffing and number of beds, without budget restriction) with the goal of maximizing
patient flow. For this scenario, we had four input control variables: nurses, physicians, lab
technicians, and beds. This scenario yielded thousands of possibilities that would take weeks to
evaluate. Arena, however, has an application called OptQuest that uses heuristics known as ―tabu

18
search‖ and ―scatter search‖ to move around intelligently in the input-control space and converge
quickly to an optimal point (Kelton, Sadowski, & Sturrock, 2007). In other words, OptQuest
looked through the model for potential controls (different combinations of our four defined input
variables) and responses (the results relative to different control combinations) and sought a
combination that optimized a defined objective (maximum patient flow).
3.4 Conclusion
By fulfilling the above phases, our group was able to obtain a comprehensive
understanding of HealthAlliance’s Emergency Department operations, successfully analyze the
effectiveness of the simulation model, and then recommend improvements to reduce delays,
disruptions, and inefficiencies.

19
Chapter 4: Results
The three phases of our methodology—data collection, simulation model testing, and
experimentation—were completed in sequential order with the objective of improving patient
throughput as well as patient and staff satisfaction. The first segment established information
(e.g. arrival rates, busiest days, and staff to observe) that helped in verifying and validating the
simulation model. Once the simulation model testing was complete and its accuracy ensured,
different scenarios were implemented into the model and the respective results were recorded.
From these experiments, we were able to determine an optimal combination of inputs that
maximized patient flow while promoting patient and staff satisfaction.
4.1 Data Collection and Analysis
Through patient data analysis and interviews, we were able to collect the necessary
information for the testing and experimentation of the simulation model.
4.1.1 Patient Data
We calculated average daily patient arrivals using the fiscal year data from October 2007
to September 2010. As shown in Figure 3, September was the busiest month for the emergency
department, with the fewest number of patients arriving in December. We also discovered that
weekly patient arrival patterns increase on Sunday, peak on Monday, then begin decreasing on
Tuesday. As shown in Figure 4, this downward trend continues through the rest of the week,
until the arrival pattern increases the following Sunday. The annual bed turnover rate, or the
number of patients seen by the emergency department per bed, was 1900. HealthAlliance has an
average of 128 patients per day and an average of 7.4 mental health patients arriving daily. As
shown in Figure 5, the arrival distribution of mental health patients is relatively symmetric
throughout the year. The average length of stay for non-mental health patients is just over three
hours, while the average length of stay for mental health patients is over nine hours. A weighted
length of stay was calculated to determine the total average length of stay for a patient within the
emergency department, as shown in Table 1.

20
Figure 3: Average Daily Patients per Month
Figure 4: Average Daily Patients per Day
110.00
115.00
120.00
125.00
130.00
135.00
140.00
Month
Average Patients Per Day
110.00
115.00
120.00
125.00
130.00
135.00
140.00
145.00
Monday Tuesday Wednesday Thursday Friday Saturday Sunday
Weekday
Average Patients Per Day

21
Figure 5: Mental Health Patient Arrival per Month
Table 1: Weighted Length of Stay for Emergency Department Patients
Non-Psych Psych
Count 39735 2536
Percentage 94% 6%
Length of Stay 3:48 10:11
Weighted Length of Stay 4:10
The second data set received from the Process Improvement Team allowed for the
identification of arrival patterns by acuity level, along with treatments given to patients within
the emergency department. There were 11,102 patients who entered through the ambulance
doors and 31,163 patients who entered through the waiting room. As shown in Table 2, the
acuity level distributions for each were also calculated. It was identified that a majority of acuity
level 4 patients enter the emergency department through the waiting room, while nearly all
acuity 1 patients arrive by ambulance. Admitted patients were differentiated from patients who
were not admitted, and the acuity distribution for admitted patients was identified.
0.00
50.00
100.00
150.00
200.00
250.00
300.00
Month
Mental Health Patients Per Month

22
Table 2: Acuity Distribution for Walk-In and Ambulance Patients
Walk-In Patients Ambulance Patients
Acuity Count Acuity Count
1 15 1 172
2 4123 2 2779
3 13745 3 7198
4 12945 4 942
5 335 5 12
TOTAL 31163 TOTAL 11103
Table 3: Patient Admittance Distribution
Count
Admitted 4856
Not Admitted 37415
Total 42271
Table 4: Acuity Distribution for Admitted Patients
Along with patient arrivals, we identified the frequency of treatments performed. We
tracked four treatments: CT scan, Diagnostic Imaging, EKG, and MRI. We calculated the acuity
level distribution for each treatment and the number of patients who received multiple
treatments. Of the 42,271 patients who visited between December 2009 and November 2010,
19,883 did not receive any treatment. A total of 236 patients received all four treatments.
Admitted Patients
Acuity Count
1 64
2 1876
3 2819
4 95
5 1

23
Table 5: Acuity Distribution for Treatments
Table 6: Total Treatments Performed
Count
CT Scan 6665
Diagnostic lmaging 16138
EKG 11795
MRI 476
None 19883
Table 7: Treatment Combinations
If CT If Diagnostic lmaging
If EKG If MRI
Diagnostic lmaging
3292 CT 3292 CT 3516 CT 340
EKG 3516 EKG 7923 Diagnostic lmaging
7923 Diagnostic lmaging
333
MRI 340 MRI 333 MRI 401 EKG 401
4.1.2 Interviews
During the interview process, we identified 6 roles impacting flow within the emergency
department. These included: head nurse, staffing nurse, triage nurse, physician, housekeeping,
and director of radiology.
Acuity CT Scan Diagnostic Imaging EKG MRI
1 48 109 109 3
2 1872 3639 4153 197
3 4303 7387 7275 263
4 439 4995 255 13
5 3 6 1 0
24
The staffing nurse provided us with information regarding mental health patients, which
was confirmed by the head nurse. A majority of the time (75%), a mental health patient requires
a ―sitter‖ to monitor the patient, ensuring the patients safety. The two factors affecting room
selection were identified. These factors are the acuity level of the patient and equipment required
by the patient.
The triage nurse was also very helpful during the interview process, providing us with
some rough estimates that were implemented into the simulation model. It was estimated that
10% of patients going through triage do not return to the waiting room and are brought directly
into the emergency department. It was also estimated that triage takes roughly 5 minutes to
complete, with age and acuity level being the primary causes of delays.
During the interview process, we discovered that the emergency department at one time
had a greeter that would document the basic information of patients in the waiting room, prior to
entering triage. This reduced the time of the triage process. Another issue identified through
interviews was the portable computers within the emergency department. The nursing staff has
difficulty transporting the computers around the emergency department as they are bulky and
heavy. In addition, the hardware within the computers appeared to be outdated, as there were
numerous delays during patient data entry caused by a non-responsive computer.
The director of radiology provided us with crucial data concerning the interaction
between the emergency department and the radiology department. Roughly half of all patients
who flow through the radiology department originated in the emergency department.
Additionally, patients within the emergency department have preferential treatment, allowing
them to bypass the queue of the radiology equipment for tests. A more detailed summary of the
interview results can be found in Appendix E.
.

25
4.2 Testing the Arena Simulation Model
During the verification process, we found that the model met a majority of the
requirements for the allowable conditions and non-allowable conditions. However, we
encountered one issue with patient entry into the system. We found that the ―Create‖ module
(how entities enter the simulation model) limited the number of entities that could enter the
system in a given run. This negatively impacted the model because resource utilization was
unusually low (0 for many of the items) and we were unable to perform functional runs when
conducting warm up period. This issue was fixed after we changed the number of maximum
arrivals to ―Infinite‖. More details about the final test results can be found in Appendices E and
F.
During the validation process, we found that the model closely mimicked the operations
of the HealthAlliance Emergency Department. However, we did identify areas in which the
model could improve to better represent reality. Most of the discrepancies between the model
and reality were caused by the difference between deterministic process times and stochastic
process times. In the model, the modules times are deterministic, or constant, instead of
stochastic with random variability. For example, in the original model, patients entered the
system at a continuous rate of 1 patient every 15 minutes. In reality, patients do not enter at a
consistent rate (e.g. multiple patients could enter at once or there could be no patients that enter
the Emergency Department for an extended period of time). Patients also require varying
amounts of time to complete processes; however, in the model, the times are the same for all
patients. Additionally, as we discovered in the data analysis portion of the project, the number of
patients in the Emergency Department vary by time of day, days of the week, and months in the
year.
4.3 Experimental Design
Through the use of Arena’s three response analysis applications—Output Analyzer,
Process Analyzer, and OptQuest—we found a combination of input variables that maximized
patient flow relative to our defined inputs. The experiments were designed as a three-step
process to promote familiarity with Arena’s experimentation tools and to ensure an optimal set of
input parameters were identified.
26
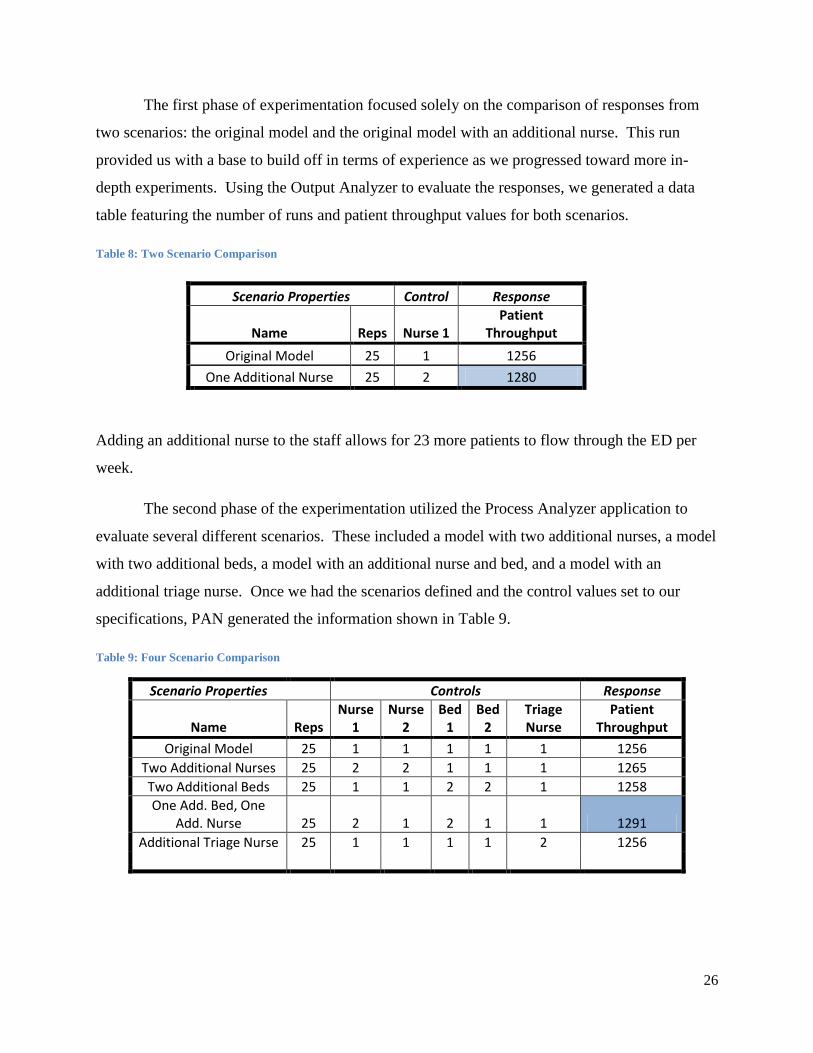
The first phase of experimentation focused solely on the comparison of responses from
two scenarios: the original model and the original model with an additional nurse. This run
provided us with a base to build off in terms of experience as we progressed toward more in-
depth experiments. Using the Output Analyzer to evaluate the responses, we generated a data
table featuring the number of runs and patient throughput values for both scenarios.
Table 8: Two Scenario Comparison
Adding an additional nurse to the staff allows for 23 more patients to flow through the ED per
week.
The second phase of the experimentation utilized the Process Analyzer application to
evaluate several different scenarios. These included a model with two additional nurses, a model
with two additional beds, a model with an additional nurse and bed, and a model with an
additional triage nurse. Once we had the scenarios defined and the control values set to our
specifications, PAN generated the information shown in Table 9.
Table 9: Four Scenario Comparison
Scenario Properties
Controls Response
Name Reps Nurse
1 Nurse
2 Bed
1 Bed
2 Triage Nurse
Patient Throughput
Original Model 25 1 1 1 1 1 1256
Two Additional Nurses 25 2 2 1 1 1 1265
Two Additional Beds 25 1 1 2 2 1 1258
One Add. Bed, One Add. Nurse 25 2 1 2 1 1 1291
Additional Triage Nurse 25 1 1 1 1 2 1256
Scenario Properties Control Response
Name Reps Nurse 1 Patient
Throughput
Original Model 25 1 1256
One Additional Nurse 25 2 1280

27
The addition of a bed and a nurse to Health Alliance’s Emergency Department can potentially
allow for 1291 patients to be admitted, treated, and discharged throughout a given week.
The third and final phase of the experimentation considered four input variables: nurses,
physicians, lab technicians, and beds. Using the OptQuest application, we sought a combination
of these inputs that maximized patient flow. After defining the input variables and constraints,
we ran 400 different combinations of simulation and yielded a maximum patient throughput per
week of 1475.667. The 172nd
combination produced this throughput. The following represents
the input variables that yielded this result:
Table 10: Optimal Control Combinations
Controls
Control Name Best Value Control Name Best Value
Bed 1 1 Bed 5 2
Bed 10 1 Bed 6 1
Bed 11 2 Bed 7 2
Bed 12 1 Bed 8 2
Bed 13 1 Bed 9 1
Bed 14 1 MD 1 2
Bed 15 1 MD 2 1
Bed 16 2 MD 3 2
Bed 17 1 MD 4 1
Bed 18 1 MD 5 2
Bed 2 2 Nurse 1 2
Bed 20 1 Nurse 2 1
Bed 21 1 Nurse 3 1
Bed 22 1 Nurse 4 1
Bed 23 1 Nurse 5 2
Bed 24 2 Tech 1 2
Bed 25 2 Tech 2 1
Bed 3 2 Tech 3 2
Bed 4 2

28
4.4 Conclusion
Through the analysis of fiscal data provided to us by the UMass Process Improvement
Team, we were able to identify several descriptive values (e.g. average patients per day, acuity
level distributions) crucial in the development of the simulation model. In addition, the parsed
data provided us with the busiest times of operation within the Emergency Department. We
scheduled our observations, time studies, and interviews during these times and in turn received
more data (e.g. nursing schedule, facility layout) that helped in the progression of the simulation
model. Once the verification and validation was established, we began experimenting with the
model. After adjusting and redefining the input variables of the simulation model, we used
Arena’s response analysis applications to find an optimal combination of inputs that maximized
patient flow.
29
Chapter 5: Future Work
After our observations, interactions, and analysis of the HealthAlliance Emergency
Department, we discovered methods, not necessarily related to our project, through which they
could improve patient flow and overall operations. These include redesigning the floor layout,
further integration of lean, and improving the pre-admittance processes.
5.1 Redesign Emergency Department Layout
As requested by the Process Improvement Team, a relationship chart for the emergency
department, shown in Table 19, was created. Based on the relationship chart, the mental health
rooms were identified as having an undesirable relationship with: the ambulance entrance, the
trauma room, treatment rooms 3-16, and the family waiting room. Due to these undesirable
relationships, an alternative layout should be developed. Facility layout design requires several
inputs (McGraw-Hill Companies, 2006):
Specification of output objectives of the system
Estimation of service demand
Processing requirements ―in terms of number of operations and amount of flow‖ between
entities.
Space requirements for entities
Space availability within the department or facility.
Two types of facility layout design, which can be applied to the HealthAlliance
Emergency Department, are cellular manufacturing layout and fixed position layout. The cellular
manufacturing layout process groups machines into work centers (or cells) that are designed to
perform a specific set of processes. For example, radiology equipment (such as CT, MRI, EKG,
etc.) can be grouped together, as they have the same impact on patient flow. Fixed position
layout is used for arranging product entities in a fixed position, and it transports workers,
materials, and machines (U Texas). Treatment rooms would be an example of a fixed position
entity. A hybrid layout, or one that incorporates both cellular manufacturing and fixed position
layout designs, would be ideal for HealthAlliance.
When comparing various layouts, the cost of the layout must be determined. Layout cost
is the sum of the flow cost, which is calculated as:

30
CijFijDij
C is the flow cost from I to J, F is the frequency of flow between I and J, and D is the
distance between I and J.
5.2 Integration of Lean
Lean integration is a ―natural way to solve many cross-organizational issues by applying
principles such as waste elimination, team empowerment, and optimization of the whole rather
than the parts‖ (Schmidt, 2010). A shared vision is required to eliminate waste, which can be
challenging due to the ―diverse range of incentives to all actors‖ within the process (Schmidt,
2010).
One way to ensure that there is a shared goal is to ―empower the team‖. Lean Integration
requires ―bottom-up rather than top-down changes, driven by front-line staff‖ (Schmidt, 2010).
Due to the disconnect between upper management and ―day-to-day realities of work‖, the
workforce must be ―empowered to drive change‖. Two ways to assist the workforce is to provide
them with the project plan and to support their ideas with the ―appropriate tools and resources‖
(Schmidt, 2010).
5.3 Improvement to Pre-Admittance Processes
After conducting emergency department observations during the data collection portion
of the project, we noticed that there was a backup in the waiting room and pre-admittance
processes (triage and registration). HealthAlliance could improve their pre-admittance processes
through a variety of methods, including electronic devices, different staffing schedules, and
alternative approaches to the triage process.
One approach to shorten the time in triage is through the use of technology. First,
HealthAlliance could implement the use of emergency department smart cards, like the ones
used at Wellington Regional Medical Center in Florida, which would be free to its patients and
keep track of patient information, such as contact information, medications, and medical
conditions (Wood, 2008). Using smart cards would eliminate many questions asked in the triage

31
process and would improve the emergency department’s quality of care by alerting the nurse to
underlying conditions that could affect patient treatments. HealthAlliance could also improve
their Emergency Department with technology by adding a kiosk machine for triaging patients.
The kiosk would increase the hospital’s capacity to serve patients and could automatically place
patients in a queue depending on arrival time and severity of condition. This would reduce the
burden on hospital staff. HealthAlliance could also shorten its pre-admittance processes by
upgrading its computer system and computer units. Since the computers are older, they take a
while to boot and often crash or freeze on the operator. A more modern and functional computer
system would reduce time wasted waiting for these machines to function. Although these
technology solutions could improve patient flow and the overall operations of HealthAlliance,
they all require a significant financial investment. Therefore, they may not currently be feasible
for the hospital given their budget cuts and hiring freeze.
Another approach to shorten the time in triage and registration is through the use of
different staffing schedules for those areas. First, HealthAlliance could once again create a
greeter position, which was recently terminated. The greeter would welcome the patients as they
arrive, register patients, enter patients’ basic information into the computer system, and serve as
a liaison between patients and emergency department staff. The greeter position would relieve
some of the burden from the triage nurses and speed up the triage process. Another option for
shortening the pre-admittance processes is to implement a pull system for staffing the triage
station. Once there were a certain number of patients in the waiting room, the charge nurse
would assign a nurse to open an additional triage station. When the number of patients in the
waiting room fell below a certain level or the emergency department reached a determined
capacity, the triage area would return to its standard staffing of one nurse.
In improving a system like triage it is important to view it as a function and not a place
(Jensen & Crane, 2008). By doing so, we can establish what components add value, what
components can be performed more efficiently or effectively at other points in the encounter, and
if this function is a bottleneck. Team triage and a fast track are two scenarios that could increase
patient flow. Team triage is a program in which patients are quickly assessed by a team with a
physician, a nurse, and a paramedic. Patients with urgent problems are promptly moved to a
treatment room. Patients with non-urgent problems are tested and/or treated in the area where
32
triage takes place; they are then released or they return to the waiting area until test results and a
treatment room are available. This system provides an effective one-in-process queue in which
patients experience a one-stage assessment, treatment, and discharge process (Slovis &
Lemonds, 2005). Another solution, emergency department fast-track systems, ―stream‖ patients
with non-urgent complaints to treatment in a dedicated area and aim to decrease waiting times
and emergency department length of stay, reduce overcrowding, and increase patient and staff
satisfaction. Fast-track systems are designed to improve emergency department capacity during
peak demand. Fast-track systems are usually staffed by senior medical and nursing personnel
underpinned by the notion that senior staff can make timely discharge decisions and that limiting
staff running fast track will expedite care by decreasing handovers and fragmentation of care
(Considine, Kropman, Kelly, & Winter, 2008).
Because there are many potential options for improving patient flow in the pre-
admittance processes, HealthAlliance will need to evaluate these alternatives by considering the
ease of implementation, costs, and the compatibility of these options with the culture at
HealthAlliance and its patients.
5.4 Conclusion
We believe that HealthAlliance and the UMass Memorial Process Improvement team
could greatly improve patient flow at the HealthAlliance Emergency Department if they choose
to act on all (or even some) of these potential projects for the future. They could consider cost,
ease of implementation, time required, and the team members’ strengths and skills when
deciding which projects to carry out.

33
Chapter 6: Conclusion
Many hospitals are addressing issues within the emergency department as a means to
improve efficiency, safety, and both patient and staff satisfaction. Health Alliance is evaluating
the current operations of its Emergency Department through the creation of a simulation model.
The objectives of this project were to use the simulation model to define the current state and
identify ways to improve patient throughput while enhancing patient and staff satisfaction. To do
this, we analyzed data and conducted interviews to establish a comprehensive understanding of
the hospital’s emergency department, strengthened the existing Arena simulation model through
verification and validation, and performed experimentation of the model to improve operations
and patient flow.
6.1 Limitations of the Project
Although we are confident in our work and recommendations, we do recognize that they
may not perfectly reflect the conditions in the Emergency Department at HealthAlliance. One
limitation of the simulation model, and subsequently the testing and experimentation, is that we
only accounted for one acuity level (or a ranking system of the severity of the patient’s ailment)
in the model. In reality, a patient’s acuity level can affect the length of stay, type of treatment
used, and type of care required. Because these things may vary when adding the additional acuity
levels, the results found in the experimentation may have a greater or lesser impact on overall
patient flow. The primary reason for only including one acuity level in the model is that
verification and validation would have been much more complex with additional acuity levels as
those would have been additional factors to consider. We also did not have data regarding how
different acuity levels affected the use of resources and equipment.
During the data collection process, we encountered issues that compromised the validity
of the simulation model. At each observation, the patient flow in the emergency department was
quite low, restricting the amount of data we were able to collect. In addition, after receiving a
constructed simulation model and associated input data from our sponsor, we realized that there
was an issue with the arrival of patients. The data began tracking the arrival of patients once they
began registration. In reality, patients must wait, complete the triage process, and then potentially
wait again for registration. The data we received did not report any of the time preceding

34
registration, and it would have been more realistic if it starting tracking patients once they
entered the emergency department.
These issues reflected a key concern that we had when verifying and validating the
simulation model in that the outputs of the model were only going to be as good as the inputs. In
other words, the results and recommendations we presented from our study were only as reliable
as the accuracy of the model. Therefore, if we could not locate data concerning critical elements
of the model, then we could not place the upmost degree of confidence in the accuracy of our
conclusions.
6.2 Recommendations
Based on the data analysis, simulation model tests, and experimentation, we were able to
formulate recommendations for HealthAlliance and the UMass Process Improvement team.
These recommendations included nurse allocation, facility layout, changes to the simulation
model, and resource adjustment to improve patient flow.
6.2.1 Data Collection & Analysis
After analyzing the hourly distribution data for patients in the emergency department, we
were able to calculate the average number of patients within the emergency department for each
hour. In addition, we were able to calculate the minimum number of nurses required to satisfy a
4:1 patient to nurse ratio. Based on the figures shown in Appendix K HealthAlliance may want
to investigate with a slightly modified staffing model, staffing 1 less nurse between the hours of
7 AM and 9 AM in order to better handle the increased patient flow between 2 PM and 5 PM.
When developing a new facility layout, the analyst should pay particular attention to the
positioning of mental health rooms. Based off of interview results, we discovered that mental
health rooms cause a disturbance to the emergency department. The current location of these
mental health rooms is in the center of the emergency department, affecting not only treatment
rooms 3 through 8 but also treatment rooms 14-16. A location for the mental health rooms that
reduces the disturbance to the emergency department while minimizing the flow cost of the
layout would be very beneficial to the HealthAlliance Emergency Department.

35
6.2.2 Testing the Arena Simulation Model
After validating the model, we identified ways to improve the simulation model so it
more realistically represented the Emergency Department at HealthAlliance. The pattern of
patients entering the system could be more realistic by implementing a schedule based on the
day-to-day patterns we found in data collection. Additionally, instead of constant times for
patient entry into the system and a set amount of time spent at the various emergency department
processes, the times could be changed to a stochastic distribution. The easiest way to do
stochastic times is by selecting a triangular distribution, where the minimum, mean, and
maximum times are set at each module. Although this may not be a perfect representation of the
entry and flow of patients, it would be more accurate than a constant, non-changing time. To
determine a more exact time distribution, one can input a set of times (e.g. the time that patients
spend at a process or the times that patients enter the system) into an ASCII file and create a
histogram in the Input Analyzer of Arena. The user can then use the ―Best Fit‖ option to identify
the best distribution for the module.
The test matrices can also be used in the future. The Process Improvement team can rerun
the tests after modifying the simulation model to ensure that it runs without bugs and as an
accurate depiction of the HealthAlliance Emergency Department. Additionally, the current test
conditions could be used as a basis when creating additional test conditions in the future.
Steps could be taken to combat the problem of ensuring the validity of the model. The
recommended approach would be to observe patients from the moment that they walk into the
emergency department to their initial interaction with registration. The times we record for each
process between these parameters could then be implemented into the model and fitted along
distributions over a period of several runs. However, if members of the Process Improvement
team were unable to observe this period of time prior to registration and had no way of receiving
this information, they could rely on fairly arbitrary assumptions or guesses known as ―ad hoc
data.‖ In this scenario, they could choose deterministic values for inputs like time delays and run
a sensitivity analysis over a range of values to see if the system’s performance changed
significantly. If it did, then they could adjust that value accordingly. For unknown inputs like
patient arrival times, probability distributions would be most appropriate. By using patient
interarrival time data from similar hospitals, they could supplement distributions into the model

36
for this previously unknown factor. In the end, however, observing and recording the process
times of the real system will always provide the best alternative.
6.2.3 Experimental Design
The OptQuest for Arena application seeks a combination of defined inputs that optimizes
an objective. Using an input structure focused on the utilization of beds, nurses, physicians, and
lab tests, we used OptQuest to determine what combination of these variables would allow for
the most patients to flow through the Health Alliance Emergency Department in a given week.
The input structure, as shown in Table 11, assumes a maximum of 40 rooms for the ED and 26
staff members per shift.
Table 11: Recommended Control Combinations
Controls
Control Name Best Value Control Name Best Value
Bed 1 1 Bed 5 2
Bed 10 1 Bed 6 1
Bed 11 2 Bed 7 2
Bed 12 1 Bed 8 2
Bed 13 1 Bed 9 1
Bed 14 1 MD 1 2
Bed 15 1 MD 2 1
Bed 16 2 MD 3 2
Bed 17 1 MD 4 1
Bed 18 1 MD 5 2
Bed 2 2 Nurse 1 2
Bed 20 1 Nurse 2 1
Bed 21 1 Nurse 3 1
Bed 22 1 Nurse 4 1
Bed 23 1 Nurse 5 2
Bed 24 2 Tech 1 2
Bed 25 2 Tech 2 1
Bed 3 2 Tech 3 2
Bed 4 2

37
6.3 Final Remarks
Over the course of several months, we have gained invaluable real world experience by
having the opportunity to apply our academic knowledge to the Emergency Department at
HealthAlliance. We were exposed to a large corporate culture and interactions among
professionals. We helped the UMass Process Improvement team to evaluate the patient flow at
HealthAlliance and identified areas for improvement. We greatly benefited from this project and
the insight provided by our sponsor.

38
References 6 Sigma Statistical Process Control . (2005). Non-value adding activity. Retrieved 2010 йил 11-October
from Six Sigma SPC: http://www.sixsigmaspc.com/dictionary/non-value-adding-activity.html
AFSCME. (2006 йил Spring). Two Studies Expose Emergency Department Problems. Retrieved 2010
йил 14-November from AFSCME: http://www.afscme.org/publications/4203.cfm
Agency for Healthcare Research and Quality. (2007). National Healthcare Quality Report, 2007.
Retrieved December 5, 2010, from Agency for Healthcare Research and Quality:
http://www.ahrq.gov/qual/nhqr07/Chap4.htm
Alexander Kolker, P. Queuing Analytic Theory and Discrete Events Simulation for Healthcare: Right
Application for the Right Problem. Children’s Hospital of Wisconsin.
American College of Emergency Physicans. (2010). Emergency Department Wait Times. Retrieved 2010
йил 15-November from American College of Emergency Physicans:
http://www.acep.org/patients.aspx?id=25908
American College of Emergency Physicians. (2010). How Overcrowding Affects Your Access to
Emergency Care. Retrieved 2010 йил 15-November from American College of Emergency Physicians:
http://www.acep.org/pressroom.aspx?LinkIdentifier=id&id=25906&fid=3496&Mo=No
American Nurses Association, Inc. (2010). Nurse Staffing. Retrieved 2010 йил 2-November from
American Nurses Association:
http://www.nursingworld.org/MainMenuCategories/ThePracticeofProfessionalNursing/workplace/NurseS
hortageStaffing/Staffing.aspx
American Society for Quality. (2010). Continuous Improvement - Learn About Quality . Retrieved 2010
йил 2-October from American Society for Quality: http://asq.org/learn-about-quality/continuous-
improvement/overview/overview.html
Barnes, C., Benson, C., Quiason, J., & McGuiness, D. (1997). Success Stories in Simulation in Health
Care. Winter Simulation Conference , 1280-1285.
Blake, J. T., Carter, M. W., & Richardson, S. (1996, November). An Analysis of Emergency Room Wait
Time Issues Via Computer Simulation. INFOR , pp. 263-273.
Bodenheimer, T. (2010). High and Rising Health Care Costs. Part 1: Seeking an Explanation. Retrieved
2010 йил 1-November from Annals of Internal Medicine: http://www.annals.org/content/142/10/847.full
Bridgefield Group Inc. (2006). Supply Chain Glossary. Retrieved 2010 йил 14-October from Bridgefield
Group ERP: http://www.bridgefieldgroup.com/bridgefieldgroup/glos9.htm
Considine, J., Kropman, M., Kelly, E., & Winter, C. (2008, May 2). Retrieved December 8, 2010, from
Emergency Medicine Journal: http://emj.bmj.com/content/25/12/815.full
Cornerstone Communications Group. (2001 йил 6-February). Analysis of American Nurses Association
Staffing Surve. Retrieved 2010 йил 2-November from American Nurses Association:

39
http://www.nursingworld.org/MainMenuCategories/ThePracticeofProfessionalNursing/workplace/NurseS
hortageStaffing/Staffing/SatffingSurvey.aspx
Croskerry, P., Cosby, K. S., Schenkel, S. M., & Wears, R. L. (2008). Patient Safety in Emergency
Medicine. Lippincott Williams & Wilkins.
Dana Lynn Driscoll, & Brizee, A. (2010 йил 17-April). Creating Good Interview and Survey Questions.
Retrieved 2010 йил 16-September from Purdue Online Writing Lab:
http://owl.english.purdue.edu/owl/resource/559/06/
Dr. Erik Steele. (2009 йил 23-March). Solutions needed for ED overuse. Retrieved 2010 йил 16-
November from Bangor Daily News: http://www.bangordailynews.com/detail/102195.html
England, S. (2010, April 30). Lean Practice: Value-added vs. non-value-added activity. Retrieved from
Southern Business Journal: http://www.thesouthern.com/business/local/article_eefc7186-5487-11df-
8977-001cc4c002e0.html
Fordyce, J., Blank, F. S., Pekow, P., Smithline, H. A., Ritter, G., Gehlbach, S., et al. (2003). Errors in a
busy emergency department. Annals of Emergency Medicine , 324-333.
Fuqua, N. (2003). Markov Analysis. From Selected Topics in Assurance Related Technologies;The
Reliability Analysis Center: http://src.alionscience.com/pdf/MARKOV.pdf
Fuqua, N. (2003). Markov Analysis. From The Reliability Information Analysis Center:
http://www.theriac.org/DeskReference/viewDocument.php?id=95&Scope=journal&year=2003&Q=3
Gioia, J. L., & Herman, R. E. (n.d.). Shifting Corporate Culture: From Lean Mean to Lean Meaningful.
From 7pengineering: http://www.7pengineering.com/pdfs/crm498rh.pdf
Graban, M. (2009). Lean Hospitals: Improving Quality, Patient Safety, and Employee Satisfaction. New
York: Productivity Press.
Green, L. (2006). Queuing Analysis in Healthcare. In P. F. Delivery, Randolph Hall (pp. 281-307). New
York: Springer.
Hadfield, D. (2006). The Lean Healthcare Pocket Guide: Tools for the Elimination of Waste in Hospitals,
Clinics, and Other Healthcare Facilities. MCS Media, Inc.
HealthAlliance. (n.d.). Retrieved from HealthAlliance Hospital:
http://www.umassmemorial.org/HealthAllianceHP.cfm?id=9
Hellmich, N. (2008 йил 7-August). Aging population making more visits to the doctor's. Retrieved 2010
йил 1-November from USA Today: http://www.usatoday.com/news/health/2008-08-06-er_N.htm
Hendrich, A., Chow, M. P., Skierczynski, B. A., & Lu, Z. (2008). A 36-Hospital Time and Motion Study:
How Do Medical-Surgical Nurses Spend Their Time? The Permanente Journal .
Houghton Mifflin Company. (2007). The American Heritage® Medical Dictionary. Houghton Mifflin
Company.
40
Ideal Media LLC. (2008). Time Study Worksheet. Retrieved 2010 йил 11-October from iSixSigma:
http://store.isixsigma.com/product.asp?P_ID=197
Improvement, I. f. (2005). Going Lean in Health Care. IHI Innovation Series white paper .
Institute for Healthcare Improvement. (2005). Going Lean in Health Care. IHI Innovation Series white
paper .
Institute for Healthcare Improvement. (2005). Going Lean in Healthcare. Cambridge, MA: IHI
Innovation Series white paper.
Jacobson, S. H., Hall, S. N., & Swisher, J. R. (2006). Discrete-Event Simulation of Health Care Systems.
In R. Hall, Patient Flow: Reducing Delay in Healthcare Delivery (pp. 211-252). New York: Swisher.
James Benneyan, M. H. (1994). Using Computer Simulation to Help Reduce Patient Waits. Healthcare
Information and Management Systems Society , 323-342.
Jensen, K., & Crane, J. (2008, November). Improving patient flow in the emergency department: there
are nine strategies hospitals can incorporate to more effectively manage patient flow in the emergency
department without sacrificing quality of care. Retrieved September 21, 2010, from Bnet - The CBS
Interactive Business Network: http://findarticles.com/p/articles/mi_m3257/is_11_62/ai_n31334484/
Kaisen Institute Lean Advisors. (2010). Lean Definitions - Value Stream Mapping. Retrieved 2010 йил 6-
October from Kaisen Institute Lean Advisors:
http://www.leanadvisors.com/index.php/what/glossary_defn/value_stream_mapping/
Kelton, W. D., Sadowski, R. P., & Sturrock, D. T. (2007). Simulation with Arena (Fourth Edition ed.).
McGraw-Hill.
Kucukyazici, B., Verter, V., Nadeau, L., & Mayo, N. E. (2007). A scenario based approach to the
improvement of Health Care delivery to stroke patients in the community. In J. Lang, Operational
Research for Health Policy: Making Better Decisions (pp. 253-263). Montreal, Quebec, Canada:
International Academic Publishers.
Law, A. M., & Kelton, W. D. (1991). Simulation Modeling and Analysis (Second Edition ed.). (E. M.
Munson, & M. Luhrs, Eds.) McGraw-Hill, Inc.
Macal, C. M. (2005 йил 7-9-April). Model Verification & Validation. Retrieved 2010 йил 28-10 from
University of Chicage: http://jtac.uchicago.edu/conferences/05/resources/V&V_macal_pres.pdf
McGraw-Hill Companies. (2006). Technical Note 5: Facility Layout. McGraw-Hill.
Merkuryev, Y., & Pecher, J. (2005 йил 21-November). Discrete Event Simulation: Methodology and
Practice. Retrieved 2010 йил 1-October from Politechnika Warszawska:
http://pelincec.isep.pw.edu.pl/doc/
Mortland, K. K., & Mortland, D. B. (n.d.). Lean Architecture Basics . Retrieved from Advanceweb.com:
http://laboratory-manager.advanceweb.com/web-extras/online-extras/lean-architectural-basics-for-
labs.aspx?CP=2

41
NCSA. (1995 йил 21-October). Glossary. Retrieved 2010 йил 5-October from University of Illinois:
http://archive.ncsa.illinois.edu/Cyberia/MetaComp/MetaGlossary.html
New England Healthcare Institute. (2010). Waste and Inefficiency in Health Care. Retrieved 2010 йил 1-
November from New England Healthcare Institute:
http://www.nehi.net/programs/17/waste_and_inefficiency_in_health_care
Novak, G. S. (n.d.). CS 315: Vocabulary. Retrieved 2010 йил 5-October from University of Texas:
http://www.cs.utexas.edu/users/novak/cs315vocab.html
ProModel Corporation. (2010). Why ProModel Healthcare Simulation Solutions? Retrieved 2010 йил 9-
October from ProModel: http://www.promodel.com/solutions/healthcare/whatis/why.asp
QAD Inc. (2010). The Lean Manufacturing Resource Guide. Retrieved 2010 йил 3-October from QAD
Inc.: http://www.leanqad.com/
Riley, R. H. (2008). Manual of Simulation in Healthcare. Oxford: Oxford University Press.
Rockwell. (2010). Arena Simulation Software by Rockwell. Retrieved 2010 йил 3-October from Arena
Simulation: http://www.arenasimulation.com/
Schmidt, J. G. (2010, August 10). Lean Integration for Health Care: Healthy Data for the Future.
Retrieved December 11, 2010, from informIT Web site:
http://www.informit.com/articles/article.aspx?p=1621871
Six-Sigma-Material.com. (2007). Spaghetti Diagram. From Six Sigma Material: http://www.six-sigma-
material.com/Spaghetti-Diagram.html
Slovis, C., & Lemonds, B. (2005, July). Retrieved December 8, 2010, from AHRQ Health Care
Innovations Exchange: http://www.innovations.ahrq.gov/content.aspx?id=1735a
Stallings, W. (2000). Queuing Analysis. William Stallings; WilliamStallings.com/StudentSupport.html.
Suler, J. (n.d.). Using Interviews in Research. Retrieved 2010 йил 17-September from Rider University:
http://www-usr.rider.edu/~suler/interviews.html#structured
Tague, N. R. (2004). Fishbone Diagram - ASQ. Retrieved 2010 йил 1-October from American Society
for Quality: http://asq.org/learn-about-quality/cause-analysis-tools/overview/fishbone.html
U Texas. (n.d.). Facility Layout. Retrieved December 5, 2010, from me.utexas.edu:
http://www.me.utexas.edu/~jensen/ORMM/omie/design/unit/layout/layout.pdf
Vahey, D. C., Aiken, L. H., Sloane, D. M., Clarke, S. P., & Vargas, D. (2004). Nurse Burnout and Patient
Satisfaction. National Institute of Health .
Valenzuela, D., & Shrivastava, P. (n.d.). Interview as a Method for Qualitative Research. Retrieved 2010
йил 18-September from Regional Workbench: http://regionalworkbench.org/sequence_09-
07/files/ppt/www-public-asu-edu-kroel_interviews.pdf

42
Virginia Mason Management Principles. (2006 йил 20-1). From Institute for Healthcare Improvement:
http://www.ihi.org/IHI/Topics/Improvement/ImprovementMethods/ImprovementStories/VirginiaMason
MedicalCenterImplementsLeanManagementPrinciplestoDriveOutWaste.htm
Wood, D. (2008). ER Smart Card Speeds Triage Time. Retrieved December 1, 2010, from NurseZone:
http://www.nursezone.com/nursing-news-events/devices-and-technology/ER-Smart-Card-Speeds-Triage-
Time_24204.aspx
Young, T., & McClean, S. (2009). Some challenges facing Lean Thinking in healthcare. International
Journal for Quality in Health Care , 309-310.

43
Appendix A: Glossary of Terms
Bottleneck: A limiting factor on the rate of an operation
Continuous improvement: ―an ongoing effort to improve products, services or
processes‖; can be ongoing or breakthrough (American Society for Quality, 2010).
Current state model: ―Version of a value stream map that shows how things work today
(Hadfield, 2006).‖
Discrete event simulation: ―A simulation in terms of events, in which the highest-
priority (least time) event is removed from an event queue and executed, which may have
the effect of scheduling future events (Novak).‖
Future state model: ―Version of a value stream map that shows how things can, should,
or will work in the future (Hadfield, 2006).‖
FMEA: ―Failure Modes and Effects Analysis. A method for brainstorming and
analyzing potential defects or errors in a system, for the sake of prioritizing improvement
activities (Graban, 2009).‖
Lean: ―An overall methodology that seeks to minimize the resources required for
production by eliminating waste (non-value added activities) that inflate costs, lead times
and inventory requirements, and emphasizing the use of preventive maintenance , quality
improvement programs, pull systems and flexible work forces and production facilities
(QAD Inc., 2010).‖
Lean healthcare: ―The application of the Toyota Production System tools and concepts
to the healthcare industry (Hadfield, 2006).‖
Markov processes: A method to improve patient flow.
Non-value-added activity: ―[An action or activity] in a process, procedure, or service
that do not add value to the external customer… Not profitable activities (6 Sigma
Statistical Process Control , 2005).‖ Should be reduced.
Object-oriented programming: ―[A] method of programming that depends on sets of
data objects, each capable of responding to a group of commands targeted at it (NCSA,
1995).‖
Patient flow: The systematic process of attending to patients, from the time they walk
into a medical facility to the time they check out for discharge. Patient flow includes both
medical and administrative functions, which may often overlap.
PCDA: An acronym for Plan-Do-Check-Act. A lean tool and continuous improvement
model (American Society for Quality, 2010).
Queuing analysis: A method to improve patient flow.
Simulation
Spaghetti Diagram: ―A pictorial representation of an employee or product movement
through a physical area (Hadfield, 2006).‖
Time Study: ―A structured process of directly observing and measuring work in order to
establish the time and effort required for completion (Ideal Media LLC, 2008).‖
Value-added activity: A process or operation that increases the worth of a good or
service as perceived by the internal or external customer, as opposed to an operation that
may simply incur costs due to the performance of an activity (Bridgefield Group Inc.,
2006).
44
Value Stream Mapping (VSM): A quality improvement tool that documents the steps
in a process, the activities that take place, the information required for the process to be
completed, the time required for each process and step, and the amount of waiting time
between each process step (Graban, 2009) (Hadfield, 2006).
Waste: Something that does not add value to the product or service from the perspective
of the customer and anything for which the customer is not willing to pay (Hadfield,
2006).
What If analysis: “The simulation of the outcome of various scenarios and alternatives
when changes to the inputs and parameters is done.‖

45
Appendix B: Process Flow Map
Enter Backroom Shows signs
of poor
symptoms?
Yes
No
Yes
Patient arrives
Enters via
ED
ambulance
No
Patient signs in
Are
symptoms
severe?
Patient enters ED
No
Triage
Waiting Room
Yes
Insurance
Registration
Waiting Room
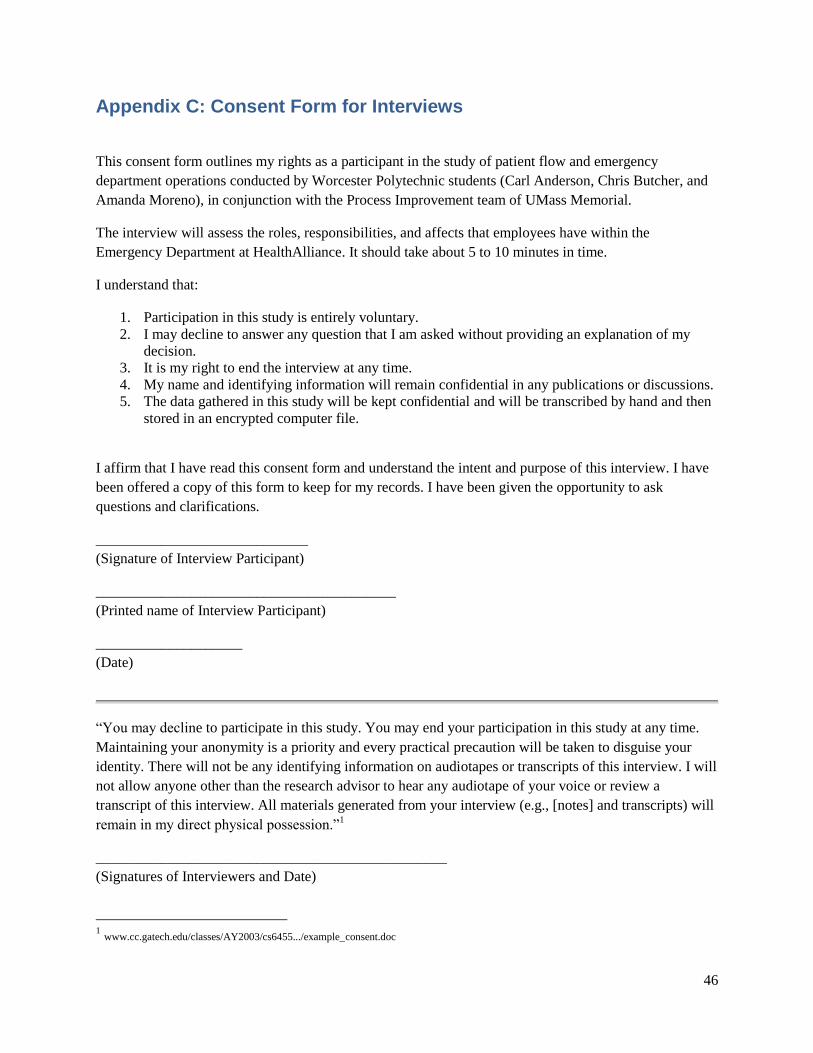
46
Appendix C: Consent Form for Interviews
This consent form outlines my rights as a participant in the study of patient flow and emergency
department operations conducted by Worcester Polytechnic students (Carl Anderson, Chris Butcher, and
Amanda Moreno), in conjunction with the Process Improvement team of UMass Memorial.
The interview will assess the roles, responsibilities, and affects that employees have within the
Emergency Department at HealthAlliance. It should take about 5 to 10 minutes in time.
I understand that:
1. Participation in this study is entirely voluntary.
2. I may decline to answer any question that I am asked without providing an explanation of my
decision.
3. It is my right to end the interview at any time.
4. My name and identifying information will remain confidential in any publications or discussions.
5. The data gathered in this study will be kept confidential and will be transcribed by hand and then
stored in an encrypted computer file.
I affirm that I have read this consent form and understand the intent and purpose of this interview. I have
been offered a copy of this form to keep for my records. I have been given the opportunity to ask
questions and clarifications.
_____________________________
(Signature of Interview Participant)
_________________________________________
(Printed name of Interview Participant)
____________________
(Date)
―You may decline to participate in this study. You may end your participation in this study at any time.
Maintaining your anonymity is a priority and every practical precaution will be taken to disguise your
identity. There will not be any identifying information on audiotapes or transcripts of this interview. I will
not allow anyone other than the research advisor to hear any audiotape of your voice or review a
transcript of this interview. All materials generated from your interview (e.g., [notes] and transcripts) will
remain in my direct physical possession.‖1
________________________________________________
(Signatures of Interviewers and Date)
1 www.cc.gatech.edu/classes/AY2003/cs6455.../example_consent.doc
47
Appendix D: Interview Questions
General
1. When do you first interact with the patient? In what other processes do you interact with
the patients?
a. How long does each process take?
i. Is the process time consistent from patient to patient?
ii. If it is not consistent, what causes variability in this process?
b. What task(s) do you perform the most?
2. Do you also interact with the patient’s visit indirectly (e.g. not face-to-face)?
Charge Nurse
1. How does the staffing model change throughout the week (day by day)?
a. What is the physician-to-nurse ratio?
b. What is the nurse-to-patient ratio?
2. How many rooms/beds are there? (To our understanding there are 25 rooms and 27
available beds.)
3. How do you determine room selection?
4. How are mental health patients classified?
a. How many rooms/beds are reserved for mental health patients?
b. What additional resources or training is required for mental health patients?
5. Is there ever a time in which someone comes through the ambulance door but there are no
open beds for the patient?
a. If so, what happens? What do you do in this situation?
Triage Nurse
1. Do you have data on distribution of patients of each acuity level?
2. How do you determine whether patients go back to waiting room after triage or straight
to exam room?
3. Who takes patient to the waiting room/exam room? (Is it you or someone else?)
a. If someone else does it, how do you notify that person where/when the patient is
ready to go?
i. How long does it take for that person to get the notification and pick up
the patient?
4. How long does it take for a patient to go through triage?
a. Is the process time consistent from patient to patient? (Does the time differ
depending on acuity level? Does the time differ even among differ types of
patients within the same acuity?)
i. What causes these differences in time?

48
b. How many triage nurses are there? Does this number change (e.g. according to
time of day, day of week, weekend vs. weekday)?
5. How many triage rooms are there?
a. If there are multiple rooms, are all of the rooms staffed?
i. Are the rooms fully staffed during certain days/times but unstaffed at other
times?
ii. If a triage room is unstaffed, how is the room used?
Radiologist
1. What types of services do you perform for ED patients (e.g. X-ray, MRI, CT scans, etc.)?
a. How long does it take to perform each kind of service?
2. How do you know when a digital imaging (DI) service is needed? (Are you notified via
pager, Soarian, another computer system, etc?)
a. How long does it take to respond to these requests?
b. How often do requests come in?
c. How often does each kind of examination come in? (For example, if x-rays the
most common, by roughly how much?)
3. How are patients transported to diagnostic imaging?
a. Who transports patients here?
b. Are portable machines ever used so that you examine the patient outside of
diagnostic imaging?
i. If so, how long does this process take compared to the patient receiving an
examination at diagnostic imaging?
4. When a patient is transported to DI, does the patient usually receive DI service right
away?
a. If no, what are the wait times?
5. How many of each type of patients from ED do you usually have? (How many level 1
patients need x-ray, how many level 2 patients need CT, etc.?)
6. Do you have DATA on:
a. Each type of request?
b. Response time?
c. Service time (broken down by type of service)?
d. Queue time?
e. Staffing?
f. Etc?
7. How often do the machines or equipment fail to work?
a. What happens in this situation?
49
Nurse
1. What are the typical tasks you have to do for each type of patient? (Please feel free to
break down the tasks in a manner that is most sensible to you, whether by acuity level,
conditions present, etc.)
a. If it is easiest to break down the tasks by acuity level, what are the typical tasks
performed for each acuity level?
b. If it is easiest to break down the tasks by condition:
i. What are the most common conditions?
ii. What are the typical tasks for each condition?
iii. How long does it take for each task?
iv. Do you ever need to delay performing a task due to limited resources
(because another staff member is using the resource you need)?
c. Who draws the patient blood? (Do you, the phlebotomist, or another staff member
do this?)
i. If you draw the patient’s blood:
1. How much time does it take to draw blood for regular patients?
2. How much time does it take to draw blood for ―hard stick‖
patients?
ii. If a phlebotomist draws the patient’s blood:
1. What is the process of notifying the phlebotomist?
2. How long does it take for phlebotomist to get to the patient in the
ED?
a. Does it vary by time of day, day of week etc?
Physicians
1. How many ED physicians are on staff at a given time?
2. What information do you document?
a. How long does each piece of information take?
b. Is information documentation/gathering done simultaneously with other
processes?
c. Is any information documented by multiple people or at multiple times?
3. Do patients with varying acuity levels require varying levels of care?
a. If yes, what are the potential differences?
Housekeeping Employee
1. How are you informed that a room is ready to be cleaned/turned down?
2. What do you need to do when preparing a room for a new patient?
a. How long does this process take?
b. Is there anything that would cause process time variation?

50
3. Where are the cleaning materials and supplies located?
4. Do you dispense of the soiled linens in a container within each room, or is there a
location within the ED?

51
Appendix E: Summary of Interviews and Observations
Staffing Nurse
Nursing shifts: 7am-3pm, 7am-7pm, 9am-7pm, 10am-10pm, 11am-11pm, 1pm-1am,
3pm-3am, 7pm-7am.
Scheduling is the same every day.
There are 25 rooms and 27 beds. Occasionally have beds in the hallway.
Room selection is based on equipment needed, or if the patient needs to be close to a
nurse, etc.
Mental health patients have an acuity system based on symptoms. There is a risk
assessment also.
o 3 rooms reserved for mental health (17, 18, 19).
o Sitters are needed for certain mental health patients. No special training.
Often times when beds aren’t available, they use the hallway.
Head Nurse
The shifts are staggered. Start with 6 nurses, as 2 more at 9am, 10am, and 11am. Add 1
nurse at 1pm. 5 nurses are left at 3am.
There is always a floater nurse and a breaker nurse.
They can have up to 6 beds in hallways.
Room selection is based on acuity level, equipment needed.
Rooms 1-4, 6-8, and 9-11 have heart monitors in them for patients that require them.
There is a risk screening tool for Psych patients (computer program). They use the risk
assessment if the screening number is greater than 6.
75% of psych patients need a sitter.
When a trauma patient comes in, all available personnel converge to accomplish every
task ASAP.
Physician
First encounters patient after the nurse assigns them a room. Patient goes through triage
(nursing assessment) and registration first.
Reviews the patients chart prior to speaking with them. Every doctor has their own
method.
The day begins with 1 physician, by 1pm there are 3 on duty.
Amount of care changes based off of acuity level. There is a correlation between time
required and acuity level. It takes roughly 10-20 minutes to review a patient’s medical
history.
Acuity level is documented by the nurse at triage.
52
Physicians will return to non psych patients after the initial visit to discuss either
discharge or further treatment.
Housekeeping
Everyone assists in changing the sheets. Takes roughly 2 minutes.
Every room is supposed to be completely cleaned at least once per day. Takes up to 10
minutes.
Triage Nurse
Distribution data can be found in the computer.
Symptoms are what determine whether a patient goes into the ER or returns to the
waiting room. 10% of patients go right into the ER.
If a patient is in the waiting room, a nurse will notify them when it is their turn to enter
the emergency department. A nurse may select a chart when they are free or if the charge
nurse directs them to do so.
Triage takes roughly 5 minutes.
o Age and acuity level have a big impact on triage time. The younger a patient is,
the longer they take.
o Occasionally 2 nurse’s may be doing triage simultaneously, in which case room
25 on B side will; be used as a second triage station.
The triage area is restocked during downtime, and they try to ensure that adequate
supplies are always available. Unusual items can sometimes be difficult to find.
Director of Radiology
Dept. of Radiology covers the entire hospital, not just the emergency department.
There are 6 technicians and 3 radiologists on duty during the day.
If a machine is not available 24/7, then people are on call.
Scan time can depend on if any prep is involved, such as the consumption of contrast
solution. A CT scan, for example, would only take 10minutes due to the lack of prep time
needed.
The transportation staff or aids will transport patients. Someone from radiology will bring
the patient back. It mostly depends on which department is the least busy when
determining if radiology will go and get the patient.
There are 4 stand-alone x-ray machines, as well as 2 portable x-ray machines.
The average time spent in radiology is 15 minutes. The body part that is being scanned
can alter the time spent scanning.
Radiology will always take an emergency department patient with no waiting or delay.
40-50% of the patients who come through radiology are from the emergency department.
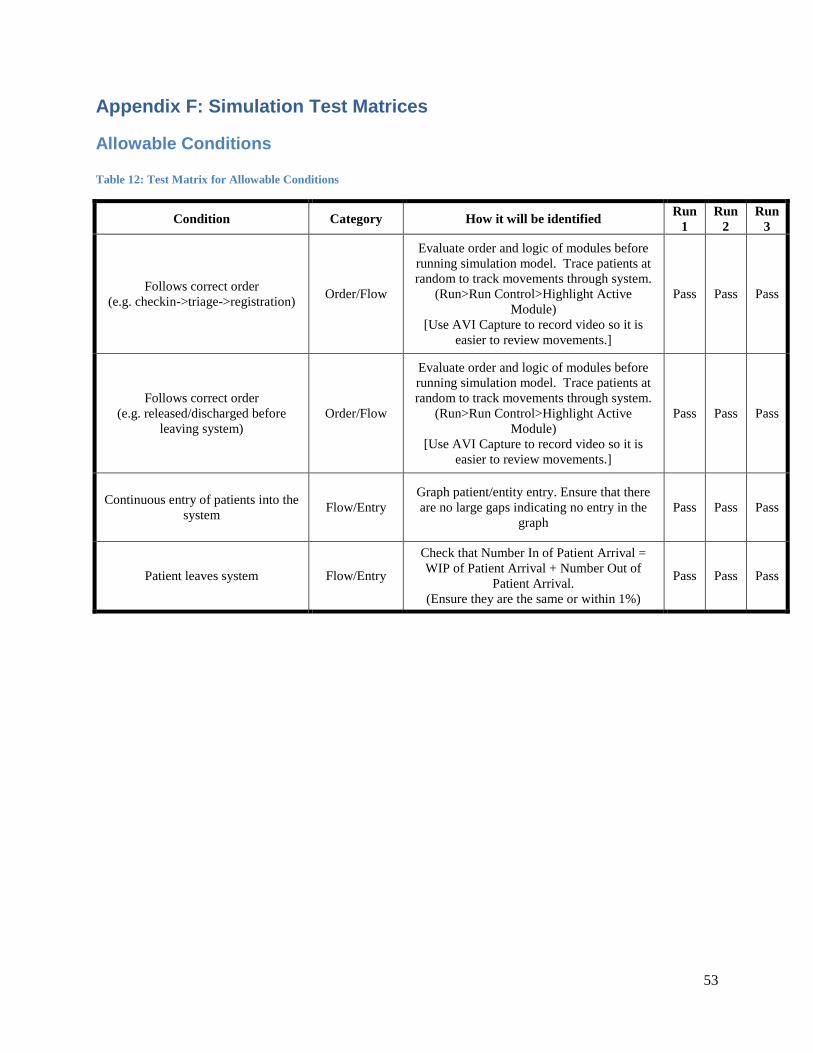
53
Appendix F: Simulation Test Matrices
Allowable Conditions
Table 12: Test Matrix for Allowable Conditions
Condition Category How it will be identified Run
1
Run
2
Run
3
Follows correct order
(e.g. checkin->triage->registration) Order/Flow
Evaluate order and logic of modules before
running simulation model. Trace patients at
random to track movements through system.
(Run>Run Control>Highlight Active
Module)
[Use AVI Capture to record video so it is
easier to review movements.]
Pass Pass Pass
Follows correct order
(e.g. released/discharged before
leaving system)
Order/Flow
Evaluate order and logic of modules before
running simulation model. Trace patients at
random to track movements through system.
(Run>Run Control>Highlight Active
Module)
[Use AVI Capture to record video so it is
easier to review movements.]
Pass Pass Pass
Continuous entry of patients into the
system Flow/Entry
Graph patient/entity entry. Ensure that there
are no large gaps indicating no entry in the
graph
Pass Pass Pass
Patient leaves system Flow/Entry
Check that Number In of Patient Arrival =
WIP of Patient Arrival + Number Out of
Patient Arrival.
(Ensure they are the same or within 1%)
Pass Pass Pass

54
Non-Allowable Conditions
Table 13: Test Matrix for Non-Allowable Conditions
Condition Category How it will be identified Run
1
Run
2
Run
3
Incorrect sequence
(e.g. discharge -> triage) Order/Flow
Evaluate order and logic of modules before
running simulation model. Trace patients at
random to track movements through system.
(Run>Run Control>Highlight Active
Module)
[Use AVI Capture to record video so it is
easier to review movements.]
Pass Pass Pass
Incorrect sequence
(e.g. discharge -> registration) Order/Flow
Evaluate order and logic of modules before
running simulation model. Trace patients at
random to track movements through system.
(Run>Run Control>Highlight Active
Module)
[Use AVI Capture to record video so it is
easier to review movements.]
Pass Pass Pass
Incorrect sequence
(e.g. discharge -> tech) Order/Flow
Evaluate order and logic of modules before
running simulation model. Trace patients at
random to track movements through system.
(Run>Run Control>Highlight Active
Module)
[Use AVI Capture to record video so it is
easier to review movements.]
Pass Pass Pass
Incorrect sequence
(e.g. discharge -> MD eval) Order/Flow
Evaluate order and logic of modules before
running simulation model. Trace patients at
random to track movements through system.
(Run>Run Control>Highlight Active
Module)
[Use AVI Capture to record video so it is
easier to review movements.]
Pass Pass Pass
Incorrect sequence
(e.g. discharge -> seize room) Order/Flow
Evaluate order and logic of modules before
running simulation model. Trace patients at
random to track movements through system.
(Run>Run Control>Highlight Active
Module)
[Use AVI Capture to record video so it is
easier to review movements.]
Pass Pass Pass
Incorrect sequence
(e.g. tech -> seize room) Order/Flow
Evaluate order and logic of modules before
running simulation model. Trace patients at
random to track movements through system.
(Run>Run Control>Highlight Active
Module)
[Use AVI Capture to record video so it is
easier to review movements.]
Pass Pass Pass

55
Incorrect sequence
(e.g. MD eval -> seize room) Order/Flow
Evaluate order and logic of modules before
running simulation model. Trace patients at
random to track movements through system.
(Run>Run Control>Highlight Active
Module)
[Use AVI Capture to record video so it is
easier to review movements.]
Pass Pass Pass
Incorrect sequence
(e.g. tech -> triage) Order/Flow
Evaluate order and logic of modules before
running simulation model. Trace patients at
random to track movements through system.
(Run>Run Control>Highlight Active
Module)
[Use AVI Capture to record video so it is
easier to review movements.]
Pass Pass Pass
Incorrect sequence
(e.g. MD eval -> triage) Order/Flow
Evaluate order and logic of modules before
running simulation model. Trace patients at
random to track movements through system.
(Run>Run Control>Highlight Active
Module)
[Use AVI Capture to record video so it is
easier to review movements.]
Pass Pass Pass
Incorrect sequence
(e.g. MD eval -> registration) Order/Flow
Evaluate order and logic of modules before
running simulation model. Trace patients at
random to track movements through system.
(Run>Run Control>Highlight Active
Module)
[Use AVI Capture to record video so it is
easier to review movements.]
Pass Pass Pass
Incorrect sequence
(e.g. registration -> triage) Order/Flow
Evaluate order and logic of modules before
running simulation model. Trace patients at
random to track movements through system.
(Run>Run Control>Highlight Active
Module)
[Use AVI Capture to record video so it is
easier to review movements.]
Pass Pass Pass
Do not have 50 patients entering
system at once Flow/Entry
Check "Entities per Arrival" in the Create
module for Patients. Generate a graph
showing patients entering system and ensure
that number of patients in graph rise evenly
and that there is not a large influx at a given
point in time.
[Click Plot button. Select Add button. For
expression, choose "Build Expression and
then Basic Process Variables>Entity>Number
In with Entity Type: Patient Arrival.]
Pass Pass Pass

56
Patient spends no more than 0.5 hour
in triage Times/Queue
Check delay parameters on process module.
Include Process in Statistics Collection &
check Run Report to ensure the Maximum
does not exceed designated limit. (Category
by Replication>Process>Time per
Entity>Total Time per Entity>Triage Area)
[Can also create a table showing entity time at
process and ensure that time at any given
point does not exceed designated limit.]
Pass Pass Pass
Patient spends no more than 0.5 hour
in registration Times/Queue
Check delay parameters on process module.
Include Process in Statistics Collection &
check Run Report to ensure the Maximum
does not exceed designated limit. (Category
by Replication>Process>Time per
Entity>Total Time per Entity>Registration
and Insurance)
[Can also create a table showing entity time at
process and ensure that time at any given
point does not exceed designated limit.]
Pass Pass Pass
Patient spends no more than 0.5 hour
in bedside registration Times/Queue
Check delay parameters on process module.
Include Process in Statistics Collection &
check Run Report to ensure the Maximum
does not exceed designated limit. (Category
by Replication>Process>Time per
Entity>Total Time per Entity>Bedside
Registration Side A)
[Can also create a table showing entity time at
process and ensure that time at any given
point does not exceed designated limit.]
Pass Pass Pass
Patient spends no more than 0.5 hour
in CT Scan Times/Queue
Check delay parameters on process module.
Include Process in Statistics Collection &
check Run Report to ensure the Maximum
does not exceed designated limit. (Category
by Replication>Process>Time per
Entity>Total Time per Entity>CT Scan)
[Can also create a table showing entity time at
process and ensure that time at any given
point does not exceed designated limit.]
Pass Pass Pass

57
Patient spends no more than 0.5 hour
in MRI Times/Queue
Check delay parameters on process module.
Include Process in Statistics Collection &
check Run Report to ensure the Maximum
does not exceed designated limit. (Category
by Replication>Process>Time per
Entity>Total Time per Entity>MRI)
[Can also create a table showing entity time at
process and ensure that time at any given
point does not exceed designated limit.]
Pass Pass Pass
Patient spends no more than 0.5 hour
in Xray Times/Queue
Check delay parameters on process module.
Include Process in Statistics Collection &
check Run Report to ensure the Maximum
does not exceed designated limit. (Category
by Replication>Process>Time per
Entity>Total Time per Entity>Xrays)
[Can also create a table showing entity time at
process and ensure that time at any given
point does not exceed designated limit.]
Pass Pass Pass
Patient spends no more than 0.5 hour
in MD Exam on side B Times/Queue
Check delay parameters on process module.
Include Process in Statistics Collection &
check Run Report to ensure the Maximum
does not exceed designated limit. (Category
by Replication>Process>Time per
Entity>Total Time per Entity>MD Exam on
side B)
[Can also create a table showing entity time at
process and ensure that time at any given
point does not exceed designated limit.]
Pass Pass Pass
Patient spends no more than 1 hour
in Physical Exam A Times/Queue
Check delay parameters on process module.
Include Process in Statistics Collection &
check Run Report to ensure the Maximum
does not exceed designated limit. (Category
by Replication>Process>Time per
Entity>Total Time per Entity>Physical
Examination A)
[Can also create a table showing entity time at
process and ensure that time at any given
point does not exceed designated limit.]
Pass Pass Pass

58
Patient spends no more than 1 hour
in Second MD Exam on B side Times/Queue
Check delay parameters on process module.
Include Process in Statistics Collection &
check Run Report to ensure the Maximum
does not exceed designated limit. (Category
by Replication>Process>Time per
Entity>Total Time per Entity>Second MD
Exam on B side)
[Can also create a table showing entity time at
process and ensure that time at any given
point does not exceed designated limit.]
Pass Pass Pass
Patient spends no more than 1 hour
in Second Physician Exam Times/Queue
Check delay parameters on process module.
Include Process in Statistics Collection &
check Run Report to ensure the Maximum
does not exceed designated limit. (Category
by Replication>Process>Time per
Entity>Total Time per Entity>Second
Physician Exam)
[Can also create a table showing entity time at
process and ensure that time at any given
point does not exceed designated limit.]
Pass Pass Pass
Patient spends no more than 1 hour
in 24 Hour Eval by Lipton
Section 12
Times/Queue
Check delay parameters on process module.
Include Process in Statistics Collection &
check Run Report to ensure the Maximum
does not exceed designated limit. (Category
by Replication>Process>Time per
Entity>Total Time per Entity>24 Hour Eval
by Lipton
Section 12)
[Can also create a table showing entity time at
process and ensure that time at any given
point does not exceed designated limit.]
Pass Pass Pass
Patient spends no more than 1 hour
in 24 Hour Eval by MD
Section 12
Times/Queue
Check delay parameters on process module.
Include Process in Statistics Collection &
check Run Report to ensure the Maximum
does not exceed designated limit. (Category
by Replication>Process>Time per
Entity>Total Time per Entity>24 Hour Eval
by MD
Section 12)
[Can also create a table showing entity time at
process and ensure that time at any given
point does not exceed designated limit.]
Pass Pass Pass

59
Patient spends no more than 0.5 hour
in RN tests and Labs A Times/Queue
Check delay parameters on process module.
Include Process in Statistics Collection &
check Run Report to ensure the Maximum
does not exceed designated limit. (Category
by Replication>Process>Time per
Entity>Total Time per Entity>RN tests and
Labs A)
[Can also create a table showing entity time at
process and ensure that time at any given
point does not exceed designated limit.]
Pass Pass Pass
No more than 1 bed per patient Resource
Allocation
Check resouces lists under the process and
seize modules. Pass Pass Pass
No more than 2 nurses per patient Resource
Allocation
Check resouces lists under the process and
seize modules. Pass Pass Pass
No more than 1 doctor (MD) per
patient
Resource
Allocation
Check resouces lists under the process and
seize modules. Pass Pass Pass
No more than 1 MRI tech per patient Resource
Allocation
Check resouces lists under the process and
seize modules. Pass Pass Pass
No more than 1 portable x-ray
machine per patient
Resource
Allocation
Check resouces lists under the process and
seize modules. Pass Pass Pass
No more than 1 x-ray tech per
patient
Resource
Allocation
Check resouces lists under the process and
seize modules. Pass Pass Pass
No more than 1 registration nurse per
patient
Resource
Allocation
Check resouces lists under the process and
seize modules. Pass Pass Pass
No more than 1 CT machine per
patient
Resource
Allocation
Check resouces lists under the process and
seize modules. Pass Pass Pass
No more than 1 CT tech per patient Resource
Allocation
Check resouces lists under the process and
seize modules. Pass Pass Pass
No more than 1 sitter per patient Resource
Allocation
Check resouces lists under the process and
seize modules. Pass Pass Pass
No more than 1 EKG machine per
patient
Resource
Allocation
Check resouces lists under the process and
seize modules. Pass Pass Pass
Sitter with non-mental health patient Resource
Allocation
Check resouces lists under the process and
seize modules. Pass Pass Pass
No more than 10 minutes per patient
in "Call Radiology" queue Queue/Flow
Include Queues in Statistics Collection &
check Run Report to ensure that Maximum
does not exceed designated limit. (Category
by Replication>Queue>Time>Call
Radiology.Queue)
[Can also create a table showing Time in
Queue at module and ensure that time at any
given point does not exceed designated limit.]
Pass Pass Pass
60
No more than 1 hour per patient in
"Second Physician Examination"
queue
Queue/Flow
Include Queues in Statistics Collection &
check Run Report to ensure that Maximum
does not exceed designated limit. (Category
by Replication>Queue>Time>Second
Physician Examination.Queue)
[Can also create a table showing Time in
Queue at module and ensure that time at any
given point does not exceed designated limit.]
Pass Pass Pass
No more than 10 minutes per patient
in "Call for Transport" queue Queue/Flow
Include Queues in Statistics Collection &
check Run Report to ensure that Maximum
does not exceed designated limit. (Category
by Replication>Queue>Time>Call for
Transport.Queue)
[Can also create a table showing Time in
Queue at module and ensure that time at any
given point does not exceed designated limit.]
Pass Pass Pass
No more than 10 minutes per patient
in "Radiologist to come to ED"
queue
Queue/Flow
Include Queues in Statistics Collection &
check Run Report to ensure that Maximum
does not exceed designated limit. (Category
by Replication>Queue>Time>Radiologist to
come to ED.Queue)
[Can also create a table showing Time in
Queue at module and ensure that time at any
given point does not exceed designated limit.]
Pass Pass Pass
No more than 10 minutes per patient
in "Seize Physician A" queue Queue/Flow
Include Queues in Statistics Collection &
check Run Report to ensure that Maximum
does not exceed designated limit. (Category
by Replication>Queue>Time>Seize
Physician A.Queue)
[Can also create a table showing Time in
Queue at module and ensure that time at any
given point does not exceed designated limit.]
Pass Pass Pass
No more than 10 minutes per patient
in "Call Admitting MD" queue Queue/Flow
Include Queues in Statistics Collection &
check Run Report to ensure that Maximum
does not exceed designated limit. (Category
by Replication>Queue>Time>Call Admitting
MD.Queue)
[Can also create a table showing Time in
Queue at module and ensure that time at any
given point does not exceed designated limit.]
Pass Pass Pass

61
No more than 10 minutes per patient
in "Call radiology B side" queue Queue/Flow
Include Queues in Statistics Collection &
check Run Report to ensure that Maximum
does not exceed designated limit. (Category
by Replication>Queue>Time>Call Radiology
B side.Queue)
[Can also create a table showing Time in
Queue at module and ensure that time at any
given point does not exceed designated limit.]
Pass Pass Pass
No more than 20 minutes per patient
in "Bedside Registration side A"
queue
Queue/Flow
Include Queues in Statistics Collection &
check Run Report to ensure that Maximum
does not exceed designated limit. (Category
by Replication>Queue>Time>Bedside
Registration side A.Queue)
[Can also create a table showing Time in
Queue at module and ensure that time at any
given point does not exceed designated limit.]
Pass Pass Pass
No more than 1 hour per patient in
"RN Tests and Labs A" queue Queue/Flow
Include Queues in Statistics Collection &
check Run Report to ensure that Maximum
does not exceed designated limit. (Category
by Replication>Queue>Time>RN Tests and
Labs A.Queue)
[Can also create a table showing Time in
Queue at module and ensure that time at any
given point does not exceed designated limit.]
Pass Pass Pass
No more than 15 minutes per patient
in "24 Hour Eval by MD Section 12"
queue
Queue/Flow
Include Queues in Statistics Collection &
check Run Report to ensure that Maximum
does not exceed designated limit. (Category
by Replication>Queue>Time>24 Hour Eval
by MD Section 12.Queue)
[Can also create a table showing Time in
Queue at module and ensure that time at any
given point does not exceed designated limit.]
Pass Pass Pass
No more than 10 minutes per patient
in "Seize Side B Room & Transport
Nurse" queue
Queue/Flow
Include Queues in Statistics Collection &
check Run Report to ensure that Maximum
does not exceed designated limit. (Category
by Replication>Queue>Time>Seize Side B
Room & Transport Nurse.Queue)
[Can also create a table showing Time in
Queue at module and ensure that time at any
given point does not exceed designated limit.]
Pass Pass Pass
62
No more than 10 minutes per patient
in "Seize MD for side B" queue Queue/Flow
Include Queues in Statistics Collection &
check Run Report to ensure that Maximum
does not exceed designated limit. (Category
by Replication>Queue>Time>Seize MD for
side B.Queue)
[Can also create a table showing Time in
Queue at module and ensure that time at any
given point does not exceed designated limit.]
Pass Pass Pass
No more than 1 hour per patient in
"Second MD Exam on Side B"
queue
Queue/Flow
Include Queues in Statistics Collection &
check Run Report to ensure that Maximum
does not exceed designated limit. (Category
by Replication>Queue>Time>Second MD
Exam on Side B.Queue)
[Can also create a table showing Time in
Queue at module and ensure that time at any
given point does not exceed designated limit.]
Pass Pass Pass
No more than 10 minutes per patient
in "Nurse helps patients leave" queue Queue/Flow
Include Queues in Statistics Collection &
check Run Report to ensure that Maximum
does not exceed designated limit. (Category
by Replication>Queue>Time>Nurse helps
patients leave.Queue)
[Can also create a table showing Time in
Queue at module and ensure that time at any
given point does not exceed designated limit.]
Pass Pass Pass
No more than 10 minutes per patient
in "Strip Side B room" queue Queue/Flow
Include Queues in Statistics Collection &
check Run Report to ensure that Maximum
does not exceed designated limit. (Category
by Replication>Queue>Time>Strip Side B
room.Queue)
[Can also create a table showing Time in
Queue at module and ensure that time at any
given point does not exceed designated limit.]
Pass Pass Pass
No more than 30 minutes per patient
in "Clean Side B room" queue Queue/Flow
Include Queues in Statistics Collection &
check Run Report to ensure that Maximum
does not exceed designated limit. (Category
by Replication>Queue>Time>Clean Side B
room.Queue)
[Can also create a table showing Time in
Queue at module and ensure that time at any
given point does not exceed designated limit.]
Pass Pass Pass
63
No more than 10 minutes per patient
in "Seize Side A Room & Transport
Nurse" queue
Queue/Flow
Include Queues in Statistics Collection &
check Run Report to ensure that Maximum
does not exceed designated limit. (Category
by Replication>Queue>Time>Seize side A
Room.Queue)
[Can also create a table showing Time in
Queue at module and ensure that time at any
given point does not exceed designated limit.]
Pass Pass Pass
No more than 10 minutes per patient
in "Seize MRI Tech & Nurse" queue Queue/Flow
Include Queues in Statistics Collection &
check Run Report to ensure that Maximum
does not exceed designated limit. (Category
by Replication>Queue>Time>Seize MRI
Tech and Nurse.Queue)
[Can also create a table showing Time in
Queue at module and ensure that time at any
given point does not exceed designated limit.]
Pass Pass Pass
No more than 10 minutes per patient
in "Seize CT Tech & Nurse" queue Queue/Flow
Include Queues in Statistics Collection &
check Run Report to ensure that Maximum
does not exceed designated limit. (Category
by Replication>Queue>Time>Seize CT Tech
and Nurse.Queue)
[Can also create a table showing Time in
Queue at module and ensure that time at any
given point does not exceed designated limit.]
Pass Pass Pass
No more than 10 minutes per patient
in "Get Nurse" queue Queue/Flow
Include Queues in Statistics Collection &
check Run Report to ensure that Maximum
does not exceed designated limit. (Category
by Replication>Queue>Time>Get
Nurse.Queue)
[Can also create a table showing Time in
Queue at module and ensure that time at any
given point does not exceed designated limit.]
Pass Pass Pass
No more than 10 minutes per patient
in "Strip Side A room" queue Queue/Flow
Include Queues in Statistics Collection &
check Run Report to ensure that Maximum
does not exceed designated limit. (Category
by Replication>Queue>Time>Strip Side A
room.Queue)
[Can also create a table showing Time in
Queue at module and ensure that time at any
given point does not exceed designated limit.]
Pass Pass Pass

64
No more than 30 minutes per patient
in "Clean Side A room" queue Queue/Flow
Include Queues in Statistics Collection &
check Run Report to ensure that Maximum
does not exceed designated limit. (Category
by Replication>Queue>Time>Clean Side A
room.Queue)
[Can also create a table showing Time in
Queue at module and ensure that time at any
given point does not exceed designated limit.]
Pass Pass Pass

65
Appendix G: Simulation Model Run Reports
We have included the Category Overview and Category by Replications run reports from
the simulation model.

66
12:48:54PM December 14, 2010
Unnamed Project
Time Units: Replications: 3 Hours
Values Across All Replications
Key Performance Indicators
Average System
Number Out 6,096
Model Filename: Page of 1 32 R:\MQP\Model 12-11-10
67
Category Overview
12:48:54PM December 14, 2010
Unnamed Project
Time Units: Replications: 3 Hours
Values Across All Replications
Entity
Time
VA Time Maximum Average
Minimum Average Half Width Average
Minimum Value
Maximum Value
0.1884 Patient Arrival 0.01 0.1847 0.1902 0.00 1.5198
NVA Time Maximum Average
Minimum Average Half Width Average
Minimum Value
Maximum Value
0.03700458 Patient Arrival 0.00 0.03660670 0.03727540 0.00 0.2000
Wait Time Maximum Average
Minimum Average Half Width Average
Minimum Value
Maximum Value
0.01036887 Patient Arrival 0.00 0.01019281 0.01055949 0.00 0.8580
Transfer Time Maximum Average
Minimum Average Half Width Average
Minimum Value
Maximum Value
0.03970172 Patient Arrival 0.00 0.03934987 0.03991275 0.02083333 0.08750000
Other Time Maximum Average
Minimum Average Half Width Average
Minimum Value
Maximum Value
0.01926200 Patient Arrival 0.00 0.01840238 0.01987368 0.00 0.8333
Total Time Maximum Average
Minimum Average Half Width Average
Minimum Value
Maximum Value
0.2985 Patient Arrival 0.01 0.2934 0.3016 0.03333333 3.1671
Other
Number In Maximum Average
Minimum Average Half Width Average
Entity 1 0.00 0.00 0.00 0.00
Patient Arrival 85.06 5465.33 5497.00 5429.00
Patient_Accuity_1 0.00 0.00 0.00 0.00
Model Filename: Page of 2 32 R:\MQP\Model 12-11-10
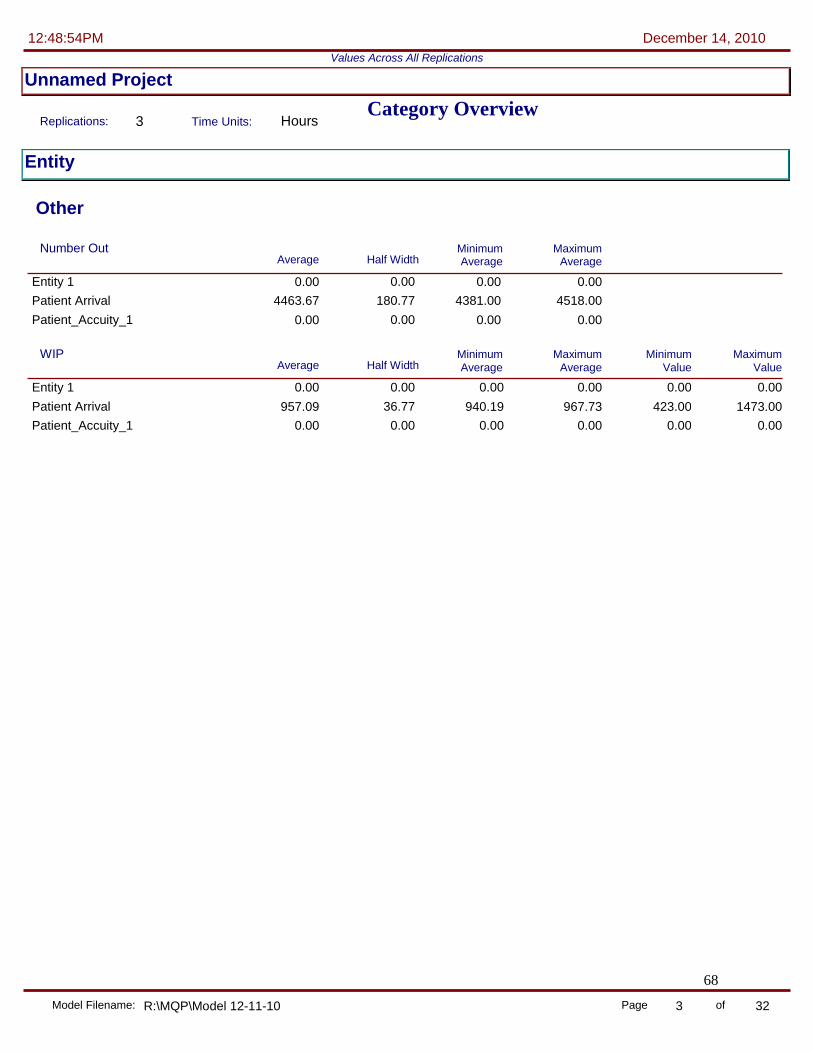
68
Category Overview
12:48:54PM December 14, 2010
Unnamed Project
Time Units: Replications: 3 Hours
Values Across All Replications
Entity
Other
Number Out Maximum Average
Minimum Average Half Width Average
Entity 1 0.00 0.00 0.00 0.00
Patient Arrival 180.77 4463.67 4518.00 4381.00
Patient_Accuity_1 0.00 0.00 0.00 0.00
WIP Maximum Average
Minimum Average Half Width Average
Minimum Value
Maximum Value
0.00 Entity 1 0.00 0.00 0.00 0.00 0.00
957.09 Patient Arrival 36.77 940.19 967.73 423.00 1473.00
0.00 Patient_Accuity_1 0.00 0.00 0.00 0.00 0.00
Model Filename: Page of 3 32 R:\MQP\Model 12-11-10

69
Category Overview
12:48:54PM December 14, 2010
Unnamed Project
Time Units: Replications: 3 Hours
Values Across All Replications
Process
Time per Entity
VA Time Per Entity Maximum Average
Minimum Average Half Width Average
Minimum Value
Maximum Value
0.5077 24 Hour Eval by Lipton Section 12 0.02 0.5002 0.5127 0.2516 0.9721
0.4972 24 Hour Eval by MD Section 12 0.03 0.4897 0.5111 0.2507 0.9791
0.0989 Bedside registration side A 0.01 0.0973 0.1014 0.03770500 0.1630
0.03365310 Call Admitting MD 0.00 0.03338810 0.03382827 0.01680406 0.04948487
0.2482 CT Scan 0.01 0.2445 0.2502 0.1721 0.3283
0.05808526 Discharge Notes B side 0.00 0.05795903 0.05829210 0.03450979 0.08257766
0.03327752 Infrared input by secretary 0.00 0.03247891 0.03394881 0.01681836 0.04900901
0.1914 MD Exam on Side B 0.00 0.1898 0.1931 0.1379 0.2477
0.05819699 MD to MD talk 0.00 0.05702135 0.05940455 0.03501825 0.08232055
0.2493 MRI 0.01 0.2467 0.2511 0.1716 0.3310
0.1667 Nurse Does Discharge 0.00 0.1667 0.1667 0.1667 0.1667
0.05631013 Nurse helps patient leave 0.00 0.05567554 0.05710360 0.03485044 0.08235046
0.1923 Physician Examination A 0.00 0.1913 0.1931 0.1338 0.2489
0.03344819 Pull IV 0.00 0.03311759 0.03388650 0.01764118 0.04954912
0.1003 Registration and Insurance 0.00 0.0993 0.1014 0.03451495 0.1640
0.1221 RN RN discussion 0.01 0.1187 0.1244 0.05191687 0.1970
0.2081 RN tests and Labs A 0.00 0.2075 0.2089 0.1677 0.2481
0.05934286 Second MD Exam on B Side 0.00 0.05891729 0.05996091 0.03667968 0.08144113
0.05807542 Second Physician Examination 0.00 0.05776847 0.05835610 0.03415529 0.08303006
0.2088 Tests and Labs on Side B 0.00 0.2079 0.2098 0.1675 0.2491
0.1245 Triage Area 0.00 0.1242 0.1247 0.08382497 0.1658
0.2073 Xrays 0.00 0.2068 0.2077 0.1677 0.2495
0.2080 Xrays Bedside 0.00 0.2067 0.2092 0.1724 0.2487
NVA Time Per Entity Maximum Average
Minimum Average Half Width Average
Minimum Value
Maximum Value
0.1667 Clean Side A Room 0.00 0.1667 0.1667 0.1667 0.1667
0.1667 Clean Side B Room 0.00 0.1667 0.1667 0.1667 0.1667
0.03333333 Strip Side A Room 0.00 0.03333333 0.03333333 0.03333333 0.03333333
0.03333333 Strip Side B Room 0.00 0.03333333 0.03333333 0.03333333 0.03333333
Model Filename: Page of 4 32 R:\MQP\Model 12-11-10

70
Category Overview
12:48:54PM December 14, 2010
Unnamed Project
Time Units: Replications: 3 Hours
Values Across All Replications
Process
Time per Entity
Wait Time Per Entity Maximum Average
Minimum Average Half Width Average
Minimum Value
Maximum Value
0.01105179 24 Hour Eval by MD Section 12 0.00 0.01023586 0.01163849 0.00 0.1887
0.00 Bedside registration side A 0.00 0.00 0.00 0.00 0.00
0.00 Call Admitting MD 0.00 0.00 0.00 0.00 0.00
0.03606506 Clean Side A Room 0.00 0.03408196 0.03795311 0.00 0.4091
0.03328977 Clean Side B Room 0.01 0.03040358 0.03752955 0.00 0.3658
0.00 Infrared input by secretary 0.00 0.00 0.00 0.00 0.00
0.01517664 MD to MD talk 0.01 0.01079497 0.01974987 0.00 0.5993
0.00 Nurse helps patient leave 0.00 0.00 0.00 0.00 0.00
0.01709976 RN RN discussion 0.02 0.01226148 0.02522080 0.00 0.2625
0.00 RN tests and Labs A 0.00 0.00 0.00 0.00 0.00
0.01692054 Second MD Exam on B Side 0.03 0.00956254 0.03032173 0.00 0.7156
0.01683269 Second Physician Examination 0.00 0.01551085 0.01839217 0.00 0.8374
0.00001057 Strip Side A Room 0.00 0.00 0.00003171 0.00 0.01918685
0.00 Strip Side B Room 0.00 0.00 0.00 0.00 0.00
0.00 Tests and Labs on Side B 0.00 0.00 0.00 0.00 0.00
Model Filename: Page of 5 32 R:\MQP\Model 12-11-10

71
Category Overview
12:48:54PM December 14, 2010
Unnamed Project
Time Units: Replications: 3 Hours
Values Across All Replications
Process
Time per Entity
Total Time Per Entity Maximum Average
Minimum Average Half Width Average
Minimum Value
Maximum Value
0.5077 24 Hour Eval by Lipton Section 12 0.02 0.5002 0.5127 0.2516 0.9721
0.5082 24 Hour Eval by MD Section 12 0.03 0.5010 0.5213 0.2520 0.9791
0.0989 Bedside registration side A 0.01 0.0973 0.1014 0.03770500 0.1630
0.03365310 Call Admitting MD 0.00 0.03338810 0.03382827 0.01680406 0.04948487
0.2027 Clean Side A Room 0.00 0.2007 0.2046 0.1667 0.5758
0.2000 Clean Side B Room 0.01 0.1971 0.2042 0.1667 0.5325
0.2482 CT Scan 0.01 0.2445 0.2502 0.1721 0.3283
0.05808526 Discharge Notes B side 0.00 0.05795903 0.05829210 0.03450979 0.08257766
0.03327752 Infrared input by secretary 0.00 0.03247891 0.03394881 0.01681836 0.04900901
0.1914 MD Exam on Side B 0.00 0.1898 0.1931 0.1379 0.2477
0.07337364 MD to MD talk 0.01 0.06781631 0.07791495 0.03501825 0.6810
0.2493 MRI 0.01 0.2467 0.2511 0.1716 0.3310
0.1667 Nurse Does Discharge 0.00 0.1667 0.1667 0.1667 0.1667
0.05631013 Nurse helps patient leave 0.00 0.05567554 0.05710360 0.03485044 0.08235046
0.1923 Physician Examination A 0.00 0.1913 0.1931 0.1338 0.2489
0.03344819 Pull IV 0.00 0.03311759 0.03388650 0.01764118 0.04954912
0.1003 Registration and Insurance 0.00 0.0993 0.1014 0.03451495 0.1640
0.1392 RN RN discussion 0.01 0.1366 0.1439 0.05191687 0.4083
0.2081 RN tests and Labs A 0.00 0.2075 0.2089 0.1677 0.2481
0.07626340 Second MD Exam on B Side 0.03 0.06847983 0.0903 0.03667968 0.7696
0.07490811 Second Physician Examination 0.00 0.07361254 0.07674827 0.03415529 0.8751
0.03334390 Strip Side A Room 0.00 0.03333333 0.03336505 0.03333333 0.05252019
0.03333333 Strip Side B Room 0.00 0.03333333 0.03333333 0.03333333 0.03333333
0.2088 Tests and Labs on Side B 0.00 0.2079 0.2098 0.1675 0.2491
0.1245 Triage Area 0.00 0.1242 0.1247 0.08382497 0.1658
0.2073 Xrays 0.00 0.2068 0.2077 0.1677 0.2495
0.2080 Xrays Bedside 0.00 0.2067 0.2092 0.1724 0.2487
Accumulated Time
Model Filename: Page of 6 32 R:\MQP\Model 12-11-10

72
Category Overview
12:48:54PM December 14, 2010
Unnamed Project
Time Units: Replications: 3 Hours
Values Across All Replications
Process
Accumulated Time
Accum VA Time Maximum Average
Minimum Average Half Width Average
24 Hour Eval by Lipton Section 12 12.59 53.2582 59.0209 49.4878
24 Hour Eval by MD Section 12 17.32 52.2942 60.3066 47.6056
Bedside registration MH 0.00 0.00 0.00 0.00
Bedside registration side A 5.19 14.1363 15.9548 11.8574
Call Admitting MD 0.54 5.6304 5.7761 5.3787
Clerk calls for Lipton 0.00 0.00 0.00 0.00
CT Scan 18.07 37.8608 43.2142 29.5789
Discharge Notes B side 1.36 26.0219 26.6241 25.5599
ED Infrared input by secretary 0.00 0.00 0.00 0.00
ED MD Admitting MD talk 0.00 0.00 0.00 0.00
EKG for patient 0.00 0.00 0.00 0.00
Hook up to telemetry and blood pressure
0.00 0.00 0.00 0.00
Infrared input by secretary 0.67 5.5798 5.8731 5.3448
MD Exam on Side B 6.47 98.2045 101.09 96.0203
MD to MD talk 1.28 9.7396 10.2770 9.2482
Medical Clearance 0.00 0.00 0.00 0.00
MRI 9.07 39.2397 41.5083 35.0267
Nurse Does Discharge 3.91 74.7222 76.5000 73.5000
Nurse fills out Mental Health papers
0.00 0.00 0.00 0.00
Nurse fills out MH papers 0.00 0.00 0.00 0.00
Nurse helps patient leave 1.90 28.8671 29.6479 28.1161
Nurse Nurse discussion 0.00 0.00 0.00 0.00
Patient put in room and changed into HA attire
0.00 0.00 0.00 0.00
Patient put in room and clothes changed
0.00 0.00 0.00 0.00
Physician Examination A 5.61 118.11 120.31 115.80
Pull IV 1.24 14.9873 15.5539 14.6049
Registration and Insurance 3.47 124.79 126.19 123.40
Remove Clothes and insert catheter
0.00 0.00 0.00 0.00
RN RN discussion 3.13 20.4423 21.1966 18.9867
RN tests and Labs A 6.47 127.89 130.52 125.31
RN tests and Labs Critical 0.00 0.00 0.00 0.00
Second MD Exam on B Side 1.75 7.2009 7.6592 6.3882
Second Physician Examination 2.20 35.7564 36.6041 34.8344
Model Filename: Page of 7 32 R:\MQP\Model 12-11-10

73
Category Overview
12:48:54PM December 14, 2010
Unnamed Project
Time Units: Replications: 3 Hours
Values Across All Replications
Process
Accumulated Time
Accum VA Time Maximum Average
Minimum Average Half Width Average
Sitter and Nurse review paperwork
0.00 0.00 0.00 0.00
Sitter and Nurse review paperwork during registration
0.00 0.00 0.00 0.00
Tests and Labs on Side B 6.92 107.13 110.28 104.97
Triage Area 5.62 204.79 207.41 203.46
Xrays 21.13 49.4595 58.4480 41.5416
Xrays Bedside 2.04 7.5535 8.4767 6.9021
Model Filename: Page of 8 32 R:\MQP\Model 12-11-10

74
Category Overview
12:48:54PM December 14, 2010
Unnamed Project
Time Units: Replications: 3 Hours
Values Across All Replications
Process
Accumulated Time
Accum NVA Time Maximum Average
Minimum Average Half Width Average
Clean MH Room 0.00 0.00 0.00 0.00
Clean Side A Room 5.24 102.56 104.83 100.67
Clean Side B Room 5.50 85.4444 88.0000 84.1667
Clean Trauma Room 0.00 0.00 0.00 0.00
Clerk Call Admitting MD 0.00 0.00 0.00 0.00
Lipton Assessment 0.00 0.00 0.00 0.00
Strip MH Room 0.00 0.00 0.00 0.00
Strip Side A Room 1.01 20.5222 20.9667 20.1667
Strip Side B Room 1.10 17.0889 17.6000 16.8333
Strip Trauma Room 0.00 0.00 0.00 0.00
Trauma Patient gets bed 0.00 0.00 0.00 0.00
Model Filename: Page of 9 32 R:\MQP\Model 12-11-10
75
Category Overview
12:48:54PM December 14, 2010
Unnamed Project
Time Units: Replications: 3 Hours
Values Across All Replications
Process
Accumulated Time
Accum Wait Time Maximum Average
Minimum Average Half Width Average
24 Hour Eval by MD Section 12 0.11 1.1550 1.2078 1.1281
Bedside registration MH 0.00 0.00 0.00 0.00
Bedside registration side A 0.00 0.00 0.00 0.00
Call Admitting MD 0.00 0.00 0.00 0.00
Clean MH Room 0.00 0.00 0.00 0.00
Clean Side A Room 2.79 22.1869 22.9237 20.8922
Clean Side B Room 5.92 17.0991 19.8156 15.3538
Clean Trauma Room 0.00 0.00 0.00 0.00
Clerk Call Admitting MD 0.00 0.00 0.00 0.00
Clerk calls for Lipton 0.00 0.00 0.00 0.00
ED Infrared input by secretary 0.00 0.00 0.00 0.00
ED MD Admitting MD talk 0.00 0.00 0.00 0.00
Infrared input by secretary 0.00 0.00 0.00 0.00
MD to MD talk 1.63 2.5226 3.1402 1.8351
Medical Clearance 0.00 0.00 0.00 0.00
Nurse fills out MH papers 0.00 0.00 0.00 0.00
Nurse helps patient leave 0.00 0.00 0.00 0.00
Nurse Nurse discussion 0.00 0.00 0.00 0.00
RN RN discussion 2.61 2.8321 4.0353 2.0845
RN tests and Labs A 0.00 0.00 0.00 0.00
Second MD Exam on B Side 3.75 2.0795 3.8205 1.1748
Second Physician Examination 2.03 10.3571 11.2928 9.7718
Strip MH Room 0.00 0.00 0.00 0.00
Strip Side A Room 0.03 0.00639562 0.01918685 0.00
Strip Side B Room 0.00 0.00 0.00 0.00
Strip Trauma Room 0.00 0.00 0.00 0.00
Tests and Labs on Side B 0.00 0.00 0.00 0.00
Model Filename: Page of 10 32 R:\MQP\Model 12-11-10

76
Category Overview
12:48:54PM December 14, 2010
Unnamed Project
Time Units: Replications: 3 Hours
Values Across All Replications
Process
Other
Model Filename: Page of 11 32 R:\MQP\Model 12-11-10

77
Category Overview
12:48:54PM December 14, 2010
Unnamed Project
Time Units: Replications: 3 Hours
Values Across All Replications
Process
Other
Number In Maximum Average
Minimum Average Half Width Average
24 Hour Eval by Lipton Section 12 28.22 105.00 118.00 97.0000
24 Hour Eval by MD Section 12 28.22 105.00 118.00 97.0000
Bedside registration MH 0.00 0.00 0.00 0.00
Bedside registration side A 53.46 143.00 164.00 121.00
Call Admitting MD 18.81 167.67 173.00 159.00
Clean MH Room 0.00 0.00 0.00 0.00
Clean Side A Room 30.36 615.67 629.00 605.00
Clean Side B Room 32.99 512.67 528.00 505.00
Clean Trauma Room 0.00 0.00 0.00 0.00
Clerk Call Admitting MD 0.00 0.00 0.00 0.00
Clerk calls for Lipton 0.00 0.00 0.00 0.00
CT Scan 68.55 152.33 173.00 121.00
Discharge Notes B side 23.96 448.00 459.00 441.00
ED Infrared input by secretary 0.00 0.00 0.00 0.00
ED MD Admitting MD talk 0.00 0.00 0.00 0.00
EKG for patient 0.00 0.00 0.00 0.00
Hook up to telemetry and blood pressure
0.00 0.00 0.00 0.00
Infrared input by secretary 16.91 167.67 173.00 160.00
Lipton Assessment 0.00 0.00 0.00 0.00
MD Exam on Side B 32.30 513.00 528.00 505.00
MD to MD talk 18.31 167.33 173.00 159.00
Medical Clearance 0.00 0.00 0.00 0.00
MRI 33.08 157.33 166.00 142.00
Nurse Does Discharge 23.96 448.00 459.00 441.00
Nurse fills out Mental Health papers
0.00 0.00 0.00 0.00
Nurse fills out MH papers 0.00 0.00 0.00 0.00
Nurse helps patient leave 32.99 512.67 528.00 505.00
Nurse Nurse discussion 0.00 0.00 0.00 0.00
Patient put in room and changed into HA attire
0.00 0.00 0.00 0.00
Patient put in room and clothes changed
0.00 0.00 0.00 0.00
Physician Examination A 32.80 614.67 629.00 603.00
Pull IV 23.96 448.00 459.00 441.00
Registration and Insurance 33.73 1244.33 1257.00 1230.00
Model Filename: Page of 12 32 R:\MQP\Model 12-11-10
78
Category Overview
12:48:54PM December 14, 2010
Unnamed Project
Time Units: Replications: 3 Hours
Values Across All Replications
Process
Other
Number In Maximum Average
Minimum Average Half Width Average
Remove Clothes and insert catheter
0.00 0.00 0.00 0.00
RN RN discussion 15.97 167.33 172.00 160.00
RN tests and Labs A 30.36 614.67 628.00 604.00
RN tests and Labs Critical 0.00 0.00 0.00 0.00
Second MD Exam on B Side 29.11 121.33 130.00 108.00
Second Physician Examination 33.91 615.33 630.00 603.00
Sitter and Nurse review paperwork
0.00 0.00 0.00 0.00
Sitter and Nurse review paperwork during registration
0.00 0.00 0.00 0.00
Strip MH Room 0.00 0.00 0.00 0.00
Strip Side A Room 30.36 615.67 629.00 605.00
Strip Side B Room 32.99 512.67 528.00 505.00
Strip Trauma Room 0.00 0.00 0.00 0.00
Tests and Labs on Side B 32.30 513.00 528.00 505.00
Trauma Patient gets bed 0.00 0.00 0.00 0.00
Triage Area 46.01 1645.00 1666.00 1631.00
Xrays 102.35 238.67 282.00 200.00
Xrays Bedside 10.83 36.0000 41.0000 33.0000
Model Filename: Page of 13 32 R:\MQP\Model 12-11-10

79
Category Overview
12:48:54PM December 14, 2010
Unnamed Project
Time Units: Replications: 3 Hours
Values Across All Replications
Process
Other
Number Out Maximum Average
Minimum Average Half Width Average
24 Hour Eval by Lipton Section 12 28.22 105.00 118.00 97.0000
24 Hour Eval by MD Section 12 28.22 105.00 118.00 97.0000
Bedside registration MH 0.00 0.00 0.00 0.00
Bedside registration side A 53.46 143.00 164.00 121.00
Call Admitting MD 18.31 167.33 173.00 159.00
Clean MH Room 0.00 0.00 0.00 0.00
Clean Side A Room 31.46 615.33 629.00 604.00
Clean Side B Room 32.99 512.67 528.00 505.00
Clean Trauma Room 0.00 0.00 0.00 0.00
Clerk Call Admitting MD 0.00 0.00 0.00 0.00
Clerk calls for Lipton 0.00 0.00 0.00 0.00
CT Scan 68.55 152.33 173.00 121.00
Discharge Notes B side 23.96 448.00 459.00 441.00
ED Infrared input by secretary 0.00 0.00 0.00 0.00
ED MD Admitting MD talk 0.00 0.00 0.00 0.00
EKG for patient 0.00 0.00 0.00 0.00
Hook up to telemetry and blood pressure
0.00 0.00 0.00 0.00
Infrared input by secretary 16.91 167.67 173.00 160.00
Lipton Assessment 0.00 0.00 0.00 0.00
MD Exam on Side B 32.30 513.00 528.00 505.00
MD to MD talk 18.31 167.33 173.00 159.00
Medical Clearance 0.00 0.00 0.00 0.00
MRI 33.08 157.33 166.00 142.00
Nurse Does Discharge 23.48 448.33 459.00 441.00
Nurse fills out Mental Health papers
0.00 0.00 0.00 0.00
Nurse fills out MH papers 0.00 0.00 0.00 0.00
Nurse helps patient leave 32.99 512.67 528.00 505.00
Nurse Nurse discussion 0.00 0.00 0.00 0.00
Patient put in room and changed into HA attire
0.00 0.00 0.00 0.00
Patient put in room and clothes changed
0.00 0.00 0.00 0.00
Physician Examination A 33.91 614.33 629.00 602.00
Pull IV 23.96 448.00 459.00 441.00
Registration and Insurance 32.33 1244.33 1257.00 1231.00
Model Filename: Page of 14 32 R:\MQP\Model 12-11-10

80
Category Overview
12:48:54PM December 14, 2010
Unnamed Project
Time Units: Replications: 3 Hours
Values Across All Replications
Process
Other
Number Out Maximum Average
Minimum Average Half Width Average
Remove Clothes and insert catheter
0.00 0.00 0.00 0.00
RN RN discussion 15.97 167.33 172.00 160.00
RN tests and Labs A 32.80 614.67 629.00 603.00
RN tests and Labs Critical 0.00 0.00 0.00 0.00
Second MD Exam on B Side 29.11 121.33 130.00 108.00
Second Physician Examination 33.73 615.67 630.00 603.00
Sitter and Nurse review paperwork
0.00 0.00 0.00 0.00
Sitter and Nurse review paperwork during registration
0.00 0.00 0.00 0.00
Strip MH Room 0.00 0.00 0.00 0.00
Strip Side A Room 30.36 615.67 629.00 605.00
Strip Side B Room 32.99 512.67 528.00 505.00
Strip Trauma Room 0.00 0.00 0.00 0.00
Tests and Labs on Side B 32.30 513.00 528.00 505.00
Trauma Patient gets bed 0.00 0.00 0.00 0.00
Triage Area 46.01 1645.00 1666.00 1631.00
Xrays 102.35 238.67 282.00 200.00
Xrays Bedside 10.34 36.3333 41.0000 33.0000
Model Filename: Page of 15 32 R:\MQP\Model 12-11-10
81
Category Overview
12:48:54PM December 14, 2010
Unnamed Project
Time Units: Replications: 3 Hours
Values Across All Replications
Queue
Time
Model Filename: Page of 16 32 R:\MQP\Model 12-11-10
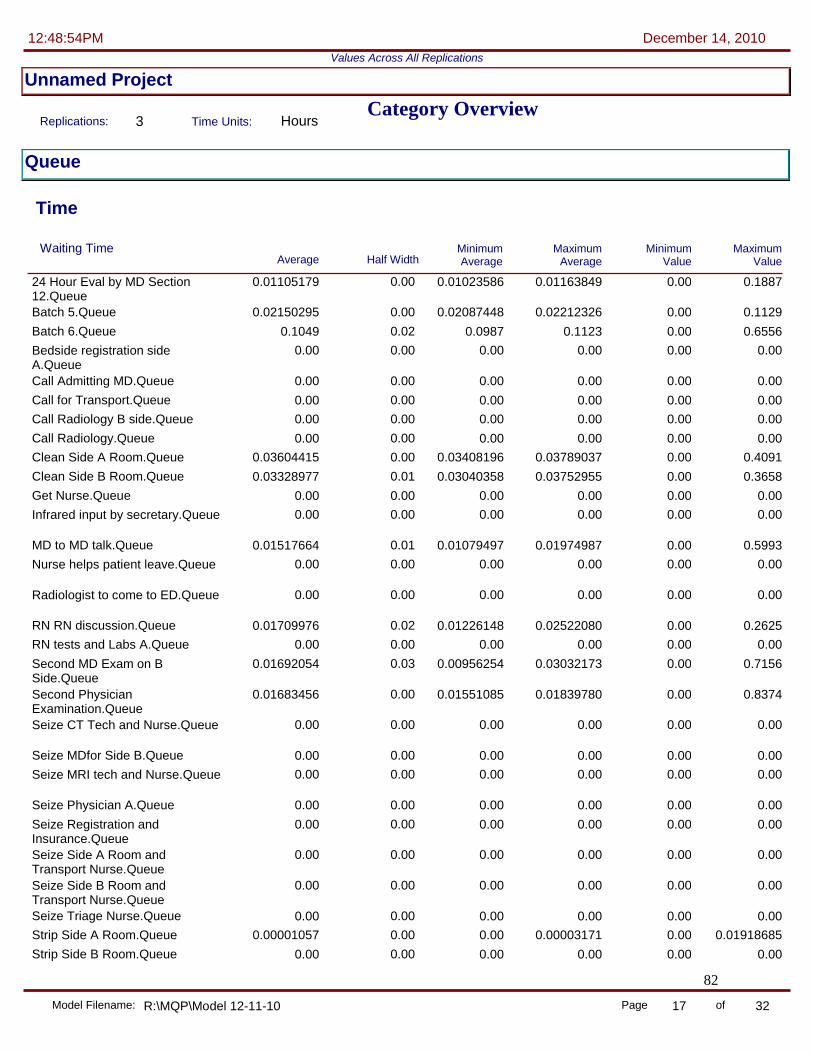
82
Category Overview
12:48:54PM December 14, 2010
Unnamed Project
Time Units: Replications: 3 Hours
Values Across All Replications
Queue
Time
Waiting Time Maximum Average
Minimum Average Half Width Average
Minimum Value
Maximum Value
0.01105179 24 Hour Eval by MD Section 12.Queue
0.00 0.01023586 0.01163849 0.00 0.1887
0.02150295 Batch 5.Queue 0.00 0.02087448 0.02212326 0.00 0.1129
0.1049 Batch 6.Queue 0.02 0.0987 0.1123 0.00 0.6556
0.00 Bedside registration side A.Queue
0.00 0.00 0.00 0.00 0.00
0.00 Call Admitting MD.Queue 0.00 0.00 0.00 0.00 0.00
0.00 Call for Transport.Queue 0.00 0.00 0.00 0.00 0.00
0.00 Call Radiology B side.Queue 0.00 0.00 0.00 0.00 0.00
0.00 Call Radiology.Queue 0.00 0.00 0.00 0.00 0.00
0.03604415 Clean Side A Room.Queue 0.00 0.03408196 0.03789037 0.00 0.4091
0.03328977 Clean Side B Room.Queue 0.01 0.03040358 0.03752955 0.00 0.3658
0.00 Get Nurse.Queue 0.00 0.00 0.00 0.00 0.00
0.00 Infrared input by secretary.Queue 0.00 0.00 0.00 0.00 0.00
0.01517664 MD to MD talk.Queue 0.01 0.01079497 0.01974987 0.00 0.5993
0.00 Nurse helps patient leave.Queue 0.00 0.00 0.00 0.00 0.00
0.00 Radiologist to come to ED.Queue 0.00 0.00 0.00 0.00 0.00
0.01709976 RN RN discussion.Queue 0.02 0.01226148 0.02522080 0.00 0.2625
0.00 RN tests and Labs A.Queue 0.00 0.00 0.00 0.00 0.00
0.01692054 Second MD Exam on B Side.Queue
0.03 0.00956254 0.03032173 0.00 0.7156
0.01683456 Second Physician Examination.Queue
0.00 0.01551085 0.01839780 0.00 0.8374
0.00 Seize CT Tech and Nurse.Queue 0.00 0.00 0.00 0.00 0.00
0.00 Seize MDfor Side B.Queue 0.00 0.00 0.00 0.00 0.00
0.00 Seize MRI tech and Nurse.Queue 0.00 0.00 0.00 0.00 0.00
0.00 Seize Physician A.Queue 0.00 0.00 0.00 0.00 0.00
0.00 Seize Registration and Insurance.Queue
0.00 0.00 0.00 0.00 0.00
0.00 Seize Side A Room and Transport Nurse.Queue
0.00 0.00 0.00 0.00 0.00
0.00 Seize Side B Room and Transport Nurse.Queue
0.00 0.00 0.00 0.00 0.00
0.00 Seize Triage Nurse.Queue 0.00 0.00 0.00 0.00 0.00
0.00001057 Strip Side A Room.Queue 0.00 0.00 0.00003171 0.00 0.01918685
0.00 Strip Side B Room.Queue 0.00 0.00 0.00 0.00 0.00
Model Filename: Page of 17 32 R:\MQP\Model 12-11-10

83
Category Overview
12:48:54PM December 14, 2010
Unnamed Project
Time Units: Replications: 3 Hours
Values Across All Replications
Queue
Time
Waiting Time Maximum Average
Minimum Average Half Width Average
Minimum Value
Maximum Value
0.00 Tests and Labs on Side B.Queue 0.00 0.00 0.00 0.00 0.00
Other
Model Filename: Page of 18 32 R:\MQP\Model 12-11-10

84
Category Overview
12:48:54PM December 14, 2010
Unnamed Project
Time Units: Replications: 3 Hours
Values Across All Replications
Queue
Other
Number Waiting Maximum Average
Minimum Average Half Width Average
Minimum Value
Maximum Value
0.00240616 24 Hour Eval by MD Section 12.Queue
0.00 0.00235021 0.00251632 0.00 1.0000
0.6667 Arrange for Sitter.Queue 1.43 0.00 1.0000 0.00 1.0000
0.00 Batch 11.Queue 0.00 0.00 0.00 0.00 0.00
0.00 Batch 4.Queue 0.00 0.00 0.00 0.00 0.00
0.01279446 Batch 5.Queue 0.00 0.01084519 0.01426423 0.00 2.0000
0.04612295 Batch 6.Queue 0.02 0.03990712 0.05521628 0.00 3.0000
5.3333 Batch 7.Queue 1.43 5.0000 6.0000 5.0000 6.0000
0.00 Bedside registration MH.Queue 0.00 0.00 0.00 0.00 0.00
0.00 Bedside registration side A.Queue
0.00 0.00 0.00 0.00 0.00
0.00 Call Admitting MD.Queue 0.00 0.00 0.00 0.00 0.00
0.00 Call for ED Transport.Queue 0.00 0.00 0.00 0.00 0.00
0.00 Call for Transport.Queue 0.00 0.00 0.00 0.00 0.00
0.00 Call Radiology B side.Queue 0.00 0.00 0.00 0.00 0.00
0.00 Call Radiology.Queue 0.00 0.00 0.00 0.00 0.00
0.00 Call transport for Trauma.Queue 0.00 0.00 0.00 0.00 0.00
0.00 Call transport to Helicopter.Queue 0.00 0.00 0.00 0.00 0.00
0.00 Clean MH Room.Queue 0.00 0.00 0.00 0.00 0.00
0.04622266 Clean Side A Room.Queue 0.01 0.04352550 0.04775766 0.00 3.0000
0.03562304 Clean Side B Room.Queue 0.01 0.03198710 0.04128251 0.00 2.0000
0.00 Clean Trauma Room.Queue 0.00 0.00 0.00 0.00 0.00
0.00 Clerk Call Admitting MD.Queue 0.00 0.00 0.00 0.00 0.00
0.00 Clerk calls for Lipton.Queue 0.00 0.00 0.00 0.00 0.00
0.00 ED Infrared input by secretary.Queue
0.00 0.00 0.00 0.00 0.00
0.00 ED MD Admitting MD talk.Queue 0.00 0.00 0.00 0.00 0.00
0.00 Get Nurse.Queue 0.00 0.00 0.00 0.00 0.00
0.00 Infrared input by secretary.Queue 0.00 0.00 0.00 0.00 0.00
0.00525541 MD to MD talk.Queue 0.00 0.00382322 0.00654214 0.00 1.0000
0.00 Medical Clearance.Queue 0.00 0.00 0.00 0.00 0.00
0.00 Nurse fills out MH papers.Queue 0.00 0.00 0.00 0.00 0.00
0.00 Nurse helps patient leave.Queue 0.00 0.00 0.00 0.00 0.00
0.00 Nurse Nurse discussion.Queue 0.00 0.00 0.00 0.00 0.00
0.00 Radiologist to come to ED.Queue 0.00 0.00 0.00 0.00 0.00
Model Filename: Page of 19 32 R:\MQP\Model 12-11-10

85
Category Overview
12:48:54PM December 14, 2010
Unnamed Project
Time Units: Replications: 3 Hours
Values Across All Replications
Queue
Other
Number Waiting Maximum Average
Minimum Average Half Width Average
Minimum Value
Maximum Value
0.00590021 RN RN discussion.Queue 0.01 0.00434261 0.00840693 0.00 1.0000
0.00 RN tests and Labs A.Queue 0.00 0.00 0.00 0.00 0.00
0.00433224 Second MD Exam on B Side.Queue
0.01 0.00244741 0.00795945 0.00 1.0000
0.02156701 Second Physician Examination.Queue
0.00 0.02035799 0.02349553 0.00 3.0000
0.00 Seize CT Tech and Nurse.Queue 0.00 0.00 0.00 0.00 0.00
389.28 Seize EKG and Tech.Queue 86.39 349.41 413.28 148.00 624.00
0.00 Seize EKG.Queue 0.00 0.00 0.00 0.00 0.00
0.00 Seize MDfor Side B.Queue 0.00 0.00 0.00 0.00 0.00
0.00 Seize Mental Health nurse.Queue 0.00 0.00 0.00 0.00 0.00
102.63 Seize Mental Health Room and Nurse.Queue
27.16 90.3816 111.40 42.0000 172.00
0.00 Seize MRI tech and Nurse.Queue 0.00 0.00 0.00 0.00 0.00
0.00 Seize Physician A.Queue 0.00 0.00 0.00 0.00 0.00
0.00 Seize Registration and Insurance.Queue
0.00 0.00 0.00 0.00 0.00
39.9222 Seize Room for Mental Health.Queue
9.37 37.1092 44.2075 15.0000 64.0000
0.00 Seize Room.Queue 0.00 0.00 0.00 0.00 0.00
0.00 Seize Side A Room and Transport Nurse.Queue
0.00 0.00 0.00 0.00 0.00
0.00 Seize Side B Room and Transport Nurse.Queue
0.00 0.00 0.00 0.00 0.00
209.94 Seize Trauma Bed.Queue 43.48 193.95 228.64 92.0000 349.00
0.00 Seize Triage Nurse.Queue 0.00 0.00 0.00 0.00 0.00
0.00 Strip MH Room.Queue 0.00 0.00 0.00 0.00 0.00
0.00001332 Strip Side A Room.Queue 0.00 0.00 0.00003997 0.00 1.0000
0.00 Strip Side B Room.Queue 0.00 0.00 0.00 0.00 0.00
0.00 Strip Trauma Room.Queue 0.00 0.00 0.00 0.00 0.00
0.00 Tests and Labs on Side B.Queue 0.00 0.00 0.00 0.00 0.00
0.00 Triage.Queue 0.00 0.00 0.00 0.00 0.00
Model Filename: Page of 20 32 R:\MQP\Model 12-11-10

86
Category Overview
12:48:54PM December 14, 2010
Unnamed Project
Time Units: Replications: 3 Hours
Values Across All Replications
Resource
Usage
Model Filename: Page of 21 32 R:\MQP\Model 12-11-10
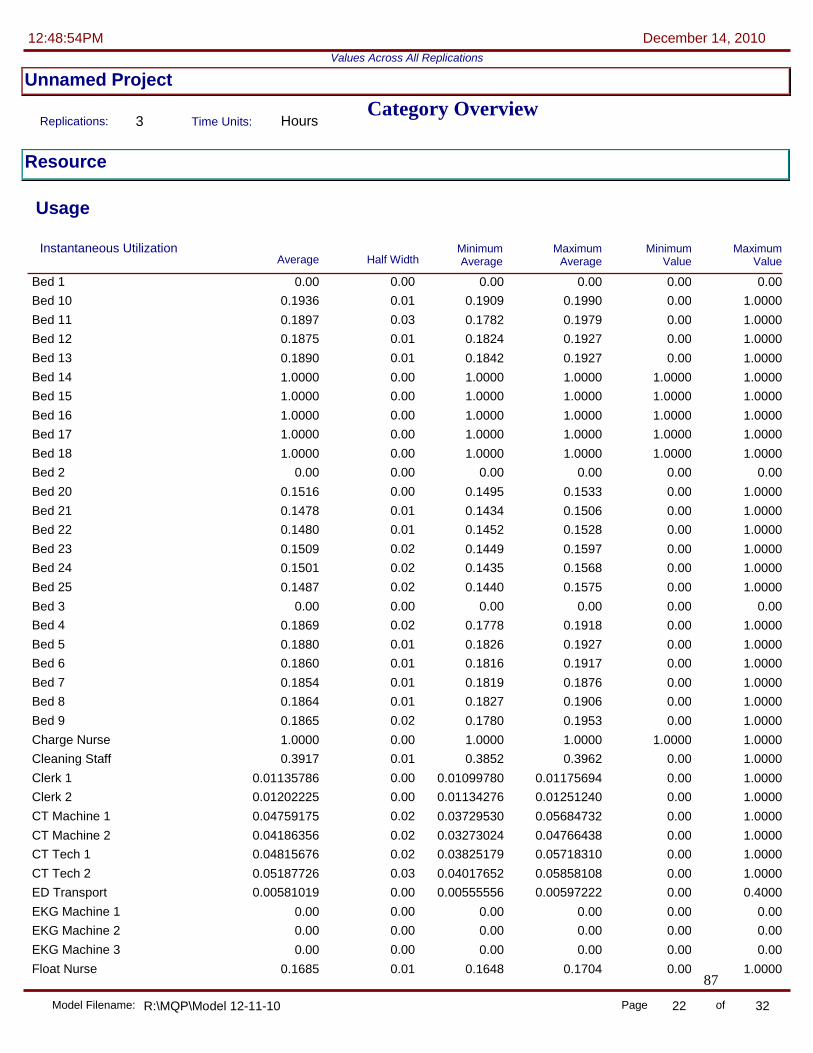
87
Category Overview
12:48:54PM December 14, 2010
Unnamed Project
Time Units: Replications: 3 Hours
Values Across All Replications
Resource
Usage
Instantaneous Utilization Maximum Average
Minimum Average Half Width Average
Minimum Value
Maximum Value
0.00 Bed 1 0.00 0.00 0.00 0.00 0.00
0.1936 Bed 10 0.01 0.1909 0.1990 0.00 1.0000
0.1897 Bed 11 0.03 0.1782 0.1979 0.00 1.0000
0.1875 Bed 12 0.01 0.1824 0.1927 0.00 1.0000
0.1890 Bed 13 0.01 0.1842 0.1927 0.00 1.0000
1.0000 Bed 14 0.00 1.0000 1.0000 1.0000 1.0000
1.0000 Bed 15 0.00 1.0000 1.0000 1.0000 1.0000
1.0000 Bed 16 0.00 1.0000 1.0000 1.0000 1.0000
1.0000 Bed 17 0.00 1.0000 1.0000 1.0000 1.0000
1.0000 Bed 18 0.00 1.0000 1.0000 1.0000 1.0000
0.00 Bed 2 0.00 0.00 0.00 0.00 0.00
0.1516 Bed 20 0.00 0.1495 0.1533 0.00 1.0000
0.1478 Bed 21 0.01 0.1434 0.1506 0.00 1.0000
0.1480 Bed 22 0.01 0.1452 0.1528 0.00 1.0000
0.1509 Bed 23 0.02 0.1449 0.1597 0.00 1.0000
0.1501 Bed 24 0.02 0.1435 0.1568 0.00 1.0000
0.1487 Bed 25 0.02 0.1440 0.1575 0.00 1.0000
0.00 Bed 3 0.00 0.00 0.00 0.00 0.00
0.1869 Bed 4 0.02 0.1778 0.1918 0.00 1.0000
0.1880 Bed 5 0.01 0.1826 0.1927 0.00 1.0000
0.1860 Bed 6 0.01 0.1816 0.1917 0.00 1.0000
0.1854 Bed 7 0.01 0.1819 0.1876 0.00 1.0000
0.1864 Bed 8 0.01 0.1827 0.1906 0.00 1.0000
0.1865 Bed 9 0.02 0.1780 0.1953 0.00 1.0000
1.0000 Charge Nurse 0.00 1.0000 1.0000 1.0000 1.0000
0.3917 Cleaning Staff 0.01 0.3852 0.3962 0.00 1.0000
0.01135786 Clerk 1 0.00 0.01099780 0.01175694 0.00 1.0000
0.01202225 Clerk 2 0.00 0.01134276 0.01251240 0.00 1.0000
0.04759175 CT Machine 1 0.02 0.03729530 0.05684732 0.00 1.0000
0.04186356 CT Machine 2 0.02 0.03273024 0.04766438 0.00 1.0000
0.04815676 CT Tech 1 0.02 0.03825179 0.05718310 0.00 1.0000
0.05187726 CT Tech 2 0.03 0.04017652 0.05858108 0.00 1.0000
0.00581019 ED Transport 0.00 0.00555556 0.00597222 0.00 0.4000
0.00 EKG Machine 1 0.00 0.00 0.00 0.00 0.00
0.00 EKG Machine 2 0.00 0.00 0.00 0.00 0.00
0.00 EKG Machine 3 0.00 0.00 0.00 0.00 0.00
0.1685 Float Nurse 0.01 0.1648 0.1704 0.00 1.0000
Model Filename: Page of 22 32 R:\MQP\Model 12-11-10

88
Category Overview
12:48:54PM December 14, 2010
Unnamed Project
Time Units: Replications: 3 Hours
Values Across All Replications
Resource
Usage
Instantaneous Utilization Maximum Average
Minimum Average Half Width Average
Minimum Value
Maximum Value
0.1491 MD 1 0.02 0.1394 0.1555 0.00 1.0000
0.1504 MD 2 0.04 0.1395 0.1694 0.00 1.0000
0.1398 MD 3 0.02 0.1301 0.1466 0.00 1.0000
0.1519 MD 4 0.01 0.1465 0.1561 0.00 1.0000
0.1325 MD 5 0.01 0.1290 0.1363 0.00 1.0000
1.0000 Mental Health Group Room 0.00 1.0000 1.0000 1.0000 1.0000
0.04583532 MRI Machine 1 0.01 0.04046226 0.04872363 0.00 1.0000
0.04682739 MRI Machine 2 0.01 0.04237106 0.04924208 0.00 1.0000
0.05345544 MRI Tech 1 0.01 0.04998330 0.05660134 0.00 1.0000
0.05013319 MRI Tech 2 0.02 0.04271114 0.05479629 0.00 1.0000
0.4637 Nurse 1 1.15 0.1918 1.0000 0.00 1.0000
0.2064 Nurse 2 0.17 0.1647 0.2859 0.00 1.0000
0.1719 Nurse 3 0.06 0.1534 0.1987 0.00 1.0000
0.1649 Nurse 4 0.03 0.1570 0.1800 0.00 1.0000
0.1556 Nurse 5 0.02 0.1485 0.1603 0.00 1.0000
0.01621234 Portable Xray 1 0.01 0.01345836 0.01792018 0.00 1.0000
0.01197439 Portable Xray 2 0.01 0.00890636 0.01463751 0.00 1.0000
0.00 Radiologist 0.00 0.00 0.00 0.00 0.00
0.1466 Registration 1 0.01 0.1423 0.1494 0.00 1.0000
0.1428 Registration 2 0.01 0.1394 0.1453 0.00 1.0000
1.0000 Sitter 1 0.00 1.0000 1.0000 1.0000 1.0000
1.0000 Sitter 2 0.00 1.0000 1.0000 1.0000 1.0000
1.0000 Tech 1 0.00 1.0000 1.0000 1.0000 1.0000
1.0000 Tech 2 0.00 1.0000 1.0000 1.0000 1.0000
1.0000 Tech 3 0.00 1.0000 1.0000 1.0000 1.0000
0.4409 Triage Nurse 0.01 0.4380 0.4466 0.00 1.0000
0.02941772 Xray Machine 1 0.02 0.02333379 0.03820571 0.00 1.0000
0.03366297 Xray Machine 2 0.01 0.03098019 0.03763439 0.00 1.0000
0.02556608 Xray Machine 3 0.02 0.01860536 0.03245276 0.00 1.0000
0.03110148 Xray Machine 4 0.02 0.02088037 0.03831710 0.00 1.0000
0.02791355 Xray Tech 1 0.02 0.02005758 0.03366081 0.00 1.0000
0.03205102 Xray Tech 2 0.02 0.02352442 0.04210373 0.00 1.0000
0.02662213 Xray Tech 3 0.00 0.02512357 0.02786468 0.00 1.0000
0.02803869 Xray Tech 4 0.01 0.02358798 0.03166788 0.00 1.0000
0.02278005 Xray Tech 5 0.02 0.01433101 0.02967580 0.00 1.0000
0.02710363 Xray Tech 6 0.02 0.01990919 0.03080427 0.00 1.0000
Model Filename: Page of 23 32 R:\MQP\Model 12-11-10

89
Category Overview
12:48:54PM December 14, 2010
Unnamed Project
Time Units: Replications: 3 Hours
Values Across All Replications
Resource
Usage
Number Busy Maximum Average
Minimum Average Half Width Average
Minimum Value
Maximum Value
0.00 Bed 1 0.00 0.00 0.00 0.00 0.00
0.1936 Bed 10 0.01 0.1909 0.1990 0.00 1.0000
0.1897 Bed 11 0.03 0.1782 0.1979 0.00 1.0000
0.1875 Bed 12 0.01 0.1824 0.1927 0.00 1.0000
0.1890 Bed 13 0.01 0.1842 0.1927 0.00 1.0000
1.0000 Bed 14 0.00 1.0000 1.0000 1.0000 1.0000
1.0000 Bed 15 0.00 1.0000 1.0000 1.0000 1.0000
1.0000 Bed 16 0.00 1.0000 1.0000 1.0000 1.0000
1.0000 Bed 17 0.00 1.0000 1.0000 1.0000 1.0000
1.0000 Bed 18 0.00 1.0000 1.0000 1.0000 1.0000
0.00 Bed 2 0.00 0.00 0.00 0.00 0.00
0.1516 Bed 20 0.00 0.1495 0.1533 0.00 1.0000
0.1478 Bed 21 0.01 0.1434 0.1506 0.00 1.0000
0.1480 Bed 22 0.01 0.1452 0.1528 0.00 1.0000
0.1509 Bed 23 0.02 0.1449 0.1597 0.00 1.0000
0.1501 Bed 24 0.02 0.1435 0.1568 0.00 1.0000
0.1487 Bed 25 0.02 0.1440 0.1575 0.00 1.0000
0.00 Bed 3 0.00 0.00 0.00 0.00 0.00
0.1869 Bed 4 0.02 0.1778 0.1918 0.00 1.0000
0.1880 Bed 5 0.01 0.1826 0.1927 0.00 1.0000
0.1860 Bed 6 0.01 0.1816 0.1917 0.00 1.0000
0.1854 Bed 7 0.01 0.1819 0.1876 0.00 1.0000
0.1864 Bed 8 0.01 0.1827 0.1906 0.00 1.0000
0.1865 Bed 9 0.02 0.1780 0.1953 0.00 1.0000
1.0000 Charge Nurse 0.00 1.0000 1.0000 1.0000 1.0000
0.3917 Cleaning Staff 0.01 0.3852 0.3962 0.00 1.0000
0.01135786 Clerk 1 0.00 0.01099780 0.01175694 0.00 1.0000
0.01202225 Clerk 2 0.00 0.01134276 0.01251240 0.00 1.0000
0.04759175 CT Machine 1 0.02 0.03729530 0.05684732 0.00 1.0000
0.04186356 CT Machine 2 0.02 0.03273024 0.04766438 0.00 1.0000
0.04815676 CT Tech 1 0.02 0.03825179 0.05718310 0.00 1.0000
0.05187726 CT Tech 2 0.03 0.04017652 0.05858108 0.00 1.0000
0.02905093 ED Transport 0.00 0.02777778 0.02986111 0.00 2.0000
0.00 EKG Machine 1 0.00 0.00 0.00 0.00 0.00
0.00 EKG Machine 2 0.00 0.00 0.00 0.00 0.00
0.00 EKG Machine 3 0.00 0.00 0.00 0.00 0.00
0.1685 Float Nurse 0.01 0.1648 0.1704 0.00 1.0000
Model Filename: Page of 24 32 R:\MQP\Model 12-11-10
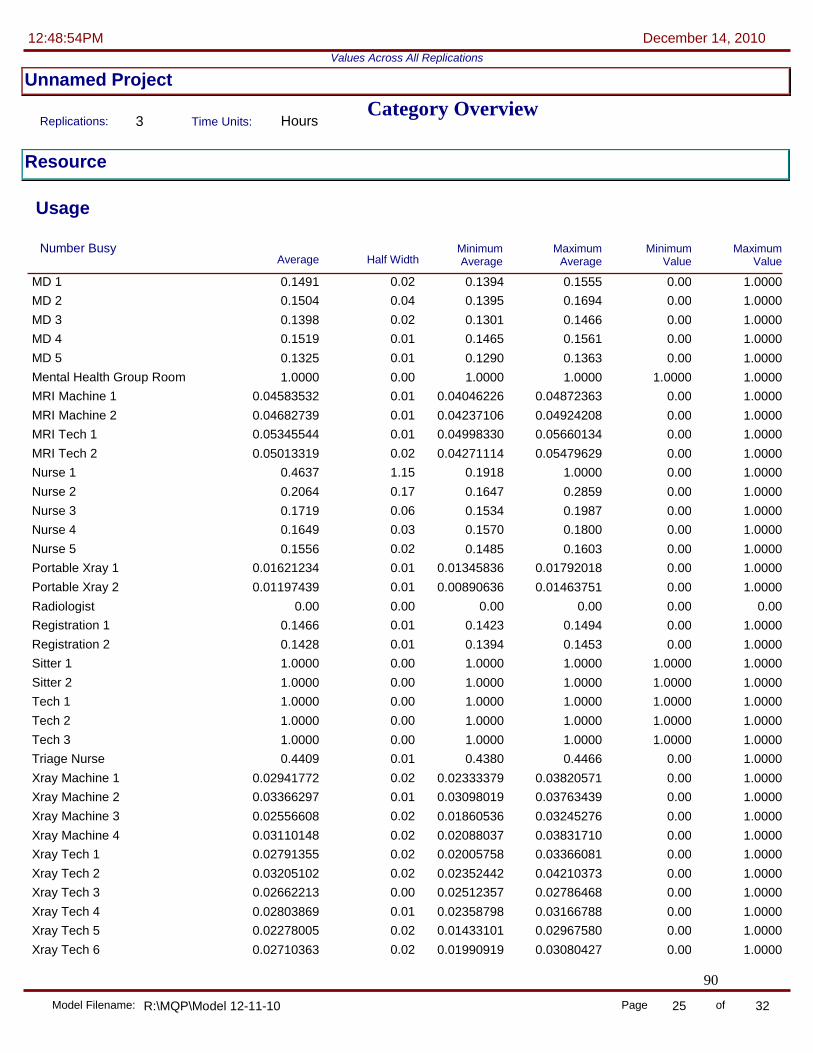
90
Category Overview
12:48:54PM December 14, 2010
Unnamed Project
Time Units: Replications: 3 Hours
Values Across All Replications
Resource
Usage
Number Busy Maximum Average
Minimum Average Half Width Average
Minimum Value
Maximum Value
0.1491 MD 1 0.02 0.1394 0.1555 0.00 1.0000
0.1504 MD 2 0.04 0.1395 0.1694 0.00 1.0000
0.1398 MD 3 0.02 0.1301 0.1466 0.00 1.0000
0.1519 MD 4 0.01 0.1465 0.1561 0.00 1.0000
0.1325 MD 5 0.01 0.1290 0.1363 0.00 1.0000
1.0000 Mental Health Group Room 0.00 1.0000 1.0000 1.0000 1.0000
0.04583532 MRI Machine 1 0.01 0.04046226 0.04872363 0.00 1.0000
0.04682739 MRI Machine 2 0.01 0.04237106 0.04924208 0.00 1.0000
0.05345544 MRI Tech 1 0.01 0.04998330 0.05660134 0.00 1.0000
0.05013319 MRI Tech 2 0.02 0.04271114 0.05479629 0.00 1.0000
0.4637 Nurse 1 1.15 0.1918 1.0000 0.00 1.0000
0.2064 Nurse 2 0.17 0.1647 0.2859 0.00 1.0000
0.1719 Nurse 3 0.06 0.1534 0.1987 0.00 1.0000
0.1649 Nurse 4 0.03 0.1570 0.1800 0.00 1.0000
0.1556 Nurse 5 0.02 0.1485 0.1603 0.00 1.0000
0.01621234 Portable Xray 1 0.01 0.01345836 0.01792018 0.00 1.0000
0.01197439 Portable Xray 2 0.01 0.00890636 0.01463751 0.00 1.0000
0.00 Radiologist 0.00 0.00 0.00 0.00 0.00
0.1466 Registration 1 0.01 0.1423 0.1494 0.00 1.0000
0.1428 Registration 2 0.01 0.1394 0.1453 0.00 1.0000
1.0000 Sitter 1 0.00 1.0000 1.0000 1.0000 1.0000
1.0000 Sitter 2 0.00 1.0000 1.0000 1.0000 1.0000
1.0000 Tech 1 0.00 1.0000 1.0000 1.0000 1.0000
1.0000 Tech 2 0.00 1.0000 1.0000 1.0000 1.0000
1.0000 Tech 3 0.00 1.0000 1.0000 1.0000 1.0000
0.4409 Triage Nurse 0.01 0.4380 0.4466 0.00 1.0000
0.02941772 Xray Machine 1 0.02 0.02333379 0.03820571 0.00 1.0000
0.03366297 Xray Machine 2 0.01 0.03098019 0.03763439 0.00 1.0000
0.02556608 Xray Machine 3 0.02 0.01860536 0.03245276 0.00 1.0000
0.03110148 Xray Machine 4 0.02 0.02088037 0.03831710 0.00 1.0000
0.02791355 Xray Tech 1 0.02 0.02005758 0.03366081 0.00 1.0000
0.03205102 Xray Tech 2 0.02 0.02352442 0.04210373 0.00 1.0000
0.02662213 Xray Tech 3 0.00 0.02512357 0.02786468 0.00 1.0000
0.02803869 Xray Tech 4 0.01 0.02358798 0.03166788 0.00 1.0000
0.02278005 Xray Tech 5 0.02 0.01433101 0.02967580 0.00 1.0000
0.02710363 Xray Tech 6 0.02 0.01990919 0.03080427 0.00 1.0000
Model Filename: Page of 25 32 R:\MQP\Model 12-11-10

91
Category Overview
12:48:54PM December 14, 2010
Unnamed Project
Time Units: Replications: 3 Hours
Values Across All Replications
Resource
Usage
Number Scheduled Maximum Average
Minimum Average Half Width Average
Minimum Value
Maximum Value
1.0000 Bed 1 0.00 1.0000 1.0000 1.0000 1.0000
1.0000 Bed 10 0.00 1.0000 1.0000 1.0000 1.0000
1.0000 Bed 11 0.00 1.0000 1.0000 1.0000 1.0000
1.0000 Bed 12 0.00 1.0000 1.0000 1.0000 1.0000
1.0000 Bed 13 0.00 1.0000 1.0000 1.0000 1.0000
1.0000 Bed 14 0.00 1.0000 1.0000 1.0000 1.0000
1.0000 Bed 15 0.00 1.0000 1.0000 1.0000 1.0000
1.0000 Bed 16 0.00 1.0000 1.0000 1.0000 1.0000
1.0000 Bed 17 0.00 1.0000 1.0000 1.0000 1.0000
1.0000 Bed 18 0.00 1.0000 1.0000 1.0000 1.0000
1.0000 Bed 2 0.00 1.0000 1.0000 1.0000 1.0000
1.0000 Bed 20 0.00 1.0000 1.0000 1.0000 1.0000
1.0000 Bed 21 0.00 1.0000 1.0000 1.0000 1.0000
1.0000 Bed 22 0.00 1.0000 1.0000 1.0000 1.0000
1.0000 Bed 23 0.00 1.0000 1.0000 1.0000 1.0000
1.0000 Bed 24 0.00 1.0000 1.0000 1.0000 1.0000
1.0000 Bed 25 0.00 1.0000 1.0000 1.0000 1.0000
1.0000 Bed 3 0.00 1.0000 1.0000 1.0000 1.0000
1.0000 Bed 4 0.00 1.0000 1.0000 1.0000 1.0000
1.0000 Bed 5 0.00 1.0000 1.0000 1.0000 1.0000
1.0000 Bed 6 0.00 1.0000 1.0000 1.0000 1.0000
1.0000 Bed 7 0.00 1.0000 1.0000 1.0000 1.0000
1.0000 Bed 8 0.00 1.0000 1.0000 1.0000 1.0000
1.0000 Bed 9 0.00 1.0000 1.0000 1.0000 1.0000
1.0000 Charge Nurse 0.00 1.0000 1.0000 1.0000 1.0000
1.0000 Cleaning Staff 0.00 1.0000 1.0000 1.0000 1.0000
1.0000 Clerk 1 0.00 1.0000 1.0000 1.0000 1.0000
1.0000 Clerk 2 0.00 1.0000 1.0000 1.0000 1.0000
1.0000 CT Machine 1 0.00 1.0000 1.0000 1.0000 1.0000
1.0000 CT Machine 2 0.00 1.0000 1.0000 1.0000 1.0000
1.0000 CT Tech 1 0.00 1.0000 1.0000 1.0000 1.0000
1.0000 CT Tech 2 0.00 1.0000 1.0000 1.0000 1.0000
5.0000 ED Transport 0.00 5.0000 5.0000 5.0000 5.0000
1.0000 EKG Machine 1 0.00 1.0000 1.0000 1.0000 1.0000
1.0000 EKG Machine 2 0.00 1.0000 1.0000 1.0000 1.0000
1.0000 EKG Machine 3 0.00 1.0000 1.0000 1.0000 1.0000
1.0000 Float Nurse 0.00 1.0000 1.0000 1.0000 1.0000
Model Filename: Page of 26 32 R:\MQP\Model 12-11-10

92
Category Overview
12:48:54PM December 14, 2010
Unnamed Project
Time Units: Replications: 3 Hours
Values Across All Replications
Resource
Usage
Number Scheduled Maximum Average
Minimum Average Half Width Average
Minimum Value
Maximum Value
1.0000 MD 1 0.00 1.0000 1.0000 1.0000 1.0000
1.0000 MD 2 0.00 1.0000 1.0000 1.0000 1.0000
1.0000 MD 3 0.00 1.0000 1.0000 1.0000 1.0000
1.0000 MD 4 0.00 1.0000 1.0000 1.0000 1.0000
1.0000 MD 5 0.00 1.0000 1.0000 1.0000 1.0000
1.0000 Mental Health Group Room 0.00 1.0000 1.0000 1.0000 1.0000
1.0000 MRI Machine 1 0.00 1.0000 1.0000 1.0000 1.0000
1.0000 MRI Machine 2 0.00 1.0000 1.0000 1.0000 1.0000
1.0000 MRI Tech 1 0.00 1.0000 1.0000 1.0000 1.0000
1.0000 MRI Tech 2 0.00 1.0000 1.0000 1.0000 1.0000
1.0000 Nurse 1 0.00 1.0000 1.0000 1.0000 1.0000
1.0000 Nurse 2 0.00 1.0000 1.0000 1.0000 1.0000
1.0000 Nurse 3 0.00 1.0000 1.0000 1.0000 1.0000
1.0000 Nurse 4 0.00 1.0000 1.0000 1.0000 1.0000
1.0000 Nurse 5 0.00 1.0000 1.0000 1.0000 1.0000
1.0000 Portable Xray 1 0.00 1.0000 1.0000 1.0000 1.0000
1.0000 Portable Xray 2 0.00 1.0000 1.0000 1.0000 1.0000
1.0000 Radiologist 0.00 1.0000 1.0000 1.0000 1.0000
1.0000 Registration 1 0.00 1.0000 1.0000 1.0000 1.0000
1.0000 Registration 2 0.00 1.0000 1.0000 1.0000 1.0000
1.0000 Sitter 1 0.00 1.0000 1.0000 1.0000 1.0000
1.0000 Sitter 2 0.00 1.0000 1.0000 1.0000 1.0000
1.0000 Tech 1 0.00 1.0000 1.0000 1.0000 1.0000
1.0000 Tech 2 0.00 1.0000 1.0000 1.0000 1.0000
1.0000 Tech 3 0.00 1.0000 1.0000 1.0000 1.0000
1.0000 Triage Nurse 0.00 1.0000 1.0000 1.0000 1.0000
1.0000 Xray Machine 1 0.00 1.0000 1.0000 1.0000 1.0000
1.0000 Xray Machine 2 0.00 1.0000 1.0000 1.0000 1.0000
1.0000 Xray Machine 3 0.00 1.0000 1.0000 1.0000 1.0000
1.0000 Xray Machine 4 0.00 1.0000 1.0000 1.0000 1.0000
1.0000 Xray Tech 1 0.00 1.0000 1.0000 1.0000 1.0000
1.0000 Xray Tech 2 0.00 1.0000 1.0000 1.0000 1.0000
1.0000 Xray Tech 3 0.00 1.0000 1.0000 1.0000 1.0000
1.0000 Xray Tech 4 0.00 1.0000 1.0000 1.0000 1.0000
1.0000 Xray Tech 5 0.00 1.0000 1.0000 1.0000 1.0000
1.0000 Xray Tech 6 0.00 1.0000 1.0000 1.0000 1.0000
Model Filename: Page of 27 32 R:\MQP\Model 12-11-10
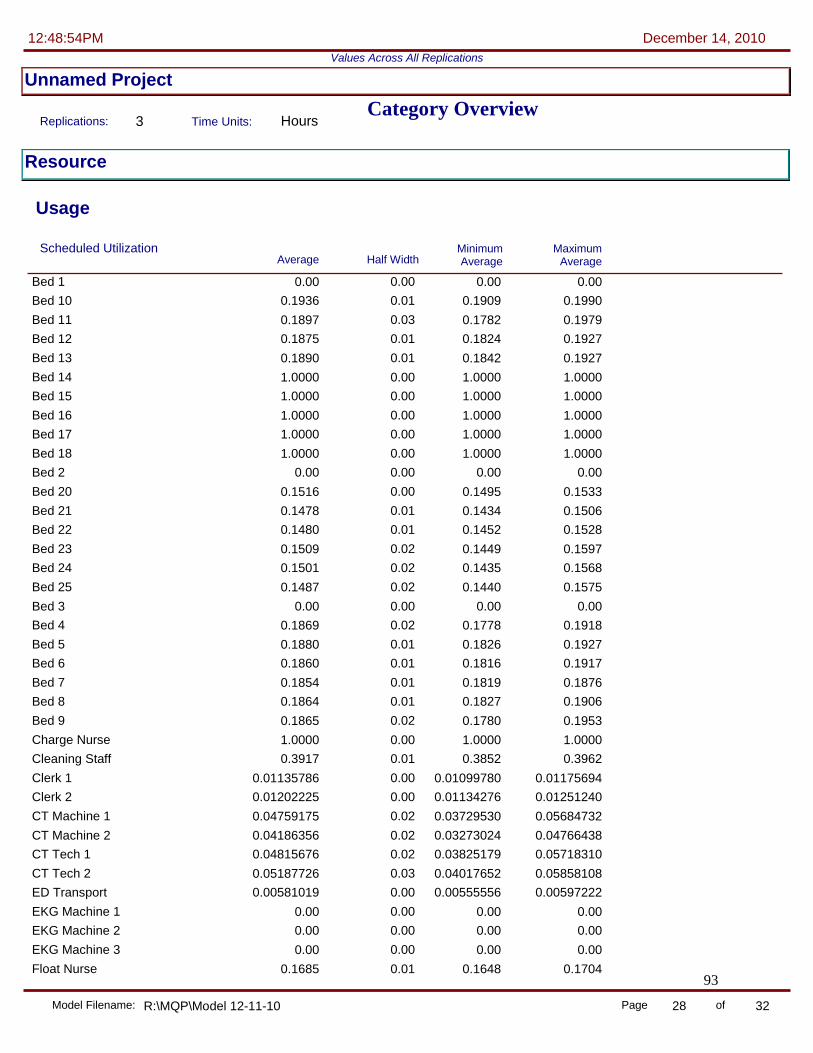
93
Category Overview
12:48:54PM December 14, 2010
Unnamed Project
Time Units: Replications: 3 Hours
Values Across All Replications
Resource
Usage
Scheduled Utilization Maximum Average
Minimum Average Half Width Average
Bed 1 0.00 0.00 0.00 0.00
Bed 10 0.01 0.1936 0.1990 0.1909
Bed 11 0.03 0.1897 0.1979 0.1782
Bed 12 0.01 0.1875 0.1927 0.1824
Bed 13 0.01 0.1890 0.1927 0.1842
Bed 14 0.00 1.0000 1.0000 1.0000
Bed 15 0.00 1.0000 1.0000 1.0000
Bed 16 0.00 1.0000 1.0000 1.0000
Bed 17 0.00 1.0000 1.0000 1.0000
Bed 18 0.00 1.0000 1.0000 1.0000
Bed 2 0.00 0.00 0.00 0.00
Bed 20 0.00 0.1516 0.1533 0.1495
Bed 21 0.01 0.1478 0.1506 0.1434
Bed 22 0.01 0.1480 0.1528 0.1452
Bed 23 0.02 0.1509 0.1597 0.1449
Bed 24 0.02 0.1501 0.1568 0.1435
Bed 25 0.02 0.1487 0.1575 0.1440
Bed 3 0.00 0.00 0.00 0.00
Bed 4 0.02 0.1869 0.1918 0.1778
Bed 5 0.01 0.1880 0.1927 0.1826
Bed 6 0.01 0.1860 0.1917 0.1816
Bed 7 0.01 0.1854 0.1876 0.1819
Bed 8 0.01 0.1864 0.1906 0.1827
Bed 9 0.02 0.1865 0.1953 0.1780
Charge Nurse 0.00 1.0000 1.0000 1.0000
Cleaning Staff 0.01 0.3917 0.3962 0.3852
Clerk 1 0.00 0.01135786 0.01175694 0.01099780
Clerk 2 0.00 0.01202225 0.01251240 0.01134276
CT Machine 1 0.02 0.04759175 0.05684732 0.03729530
CT Machine 2 0.02 0.04186356 0.04766438 0.03273024
CT Tech 1 0.02 0.04815676 0.05718310 0.03825179
CT Tech 2 0.03 0.05187726 0.05858108 0.04017652
ED Transport 0.00 0.00581019 0.00597222 0.00555556
EKG Machine 1 0.00 0.00 0.00 0.00
EKG Machine 2 0.00 0.00 0.00 0.00
EKG Machine 3 0.00 0.00 0.00 0.00
Float Nurse 0.01 0.1685 0.1704 0.1648
Model Filename: Page of 28 32 R:\MQP\Model 12-11-10

94
Category Overview
12:48:54PM December 14, 2010
Unnamed Project
Time Units: Replications: 3 Hours
Values Across All Replications
Resource
Usage
Scheduled Utilization Maximum Average
Minimum Average Half Width Average
MD 1 0.02 0.1491 0.1555 0.1394
MD 2 0.04 0.1504 0.1694 0.1395
MD 3 0.02 0.1398 0.1466 0.1301
MD 4 0.01 0.1519 0.1561 0.1465
MD 5 0.01 0.1325 0.1363 0.1290
Mental Health Group Room 0.00 1.0000 1.0000 1.0000
MRI Machine 1 0.01 0.04583532 0.04872363 0.04046226
MRI Machine 2 0.01 0.04682739 0.04924208 0.04237106
MRI Tech 1 0.01 0.05345544 0.05660134 0.04998330
MRI Tech 2 0.02 0.05013319 0.05479629 0.04271114
Nurse 1 1.15 0.4637 1.0000 0.1918
Nurse 2 0.17 0.2064 0.2859 0.1647
Nurse 3 0.06 0.1719 0.1987 0.1534
Nurse 4 0.03 0.1649 0.1800 0.1570
Nurse 5 0.02 0.1556 0.1603 0.1485
Portable Xray 1 0.01 0.01621234 0.01792018 0.01345836
Portable Xray 2 0.01 0.01197439 0.01463751 0.00890636
Radiologist 0.00 0.00 0.00 0.00
Registration 1 0.01 0.1466 0.1494 0.1423
Registration 2 0.01 0.1428 0.1453 0.1394
Sitter 1 0.00 1.0000 1.0000 1.0000
Sitter 2 0.00 1.0000 1.0000 1.0000
Tech 1 0.00 1.0000 1.0000 1.0000
Tech 2 0.00 1.0000 1.0000 1.0000
Tech 3 0.00 1.0000 1.0000 1.0000
Triage Nurse 0.01 0.4409 0.4466 0.4380
Xray Machine 1 0.02 0.02941772 0.03820571 0.02333379
Xray Machine 2 0.01 0.03366297 0.03763439 0.03098019
Xray Machine 3 0.02 0.02556608 0.03245276 0.01860536
Xray Machine 4 0.02 0.03110148 0.03831710 0.02088037
Xray Tech 1 0.02 0.02791355 0.03366081 0.02005758
Xray Tech 2 0.02 0.03205102 0.04210373 0.02352442
Xray Tech 3 0.00 0.02662213 0.02786468 0.02512357
Xray Tech 4 0.01 0.02803869 0.03166788 0.02358798
Xray Tech 5 0.02 0.02278005 0.02967580 0.01433101
Xray Tech 6 0.02 0.02710363 0.03080427 0.01990919
Model Filename: Page of 29 32 R:\MQP\Model 12-11-10

95
Category Overview
12:48:54PM December 14, 2010
Unnamed Project
Time Units: Replications: 3 Hours
Values Across All Replications
Resource
Usage
Total Number Seized Maximum Average
Minimum Average Half Width Average
Bed 1 0.00 0.00 0.00 0.00
Bed 10 2.87 61.6667 63.0000 61.0000
Bed 11 2.48 62.0000 63.0000 61.0000
Bed 12 2.48 62.0000 63.0000 61.0000
Bed 13 3.79 61.3333 63.0000 60.0000
Bed 14 0.00 0.00 0.00 0.00
Bed 15 0.00 0.00 0.00 0.00
Bed 16 0.00 0.00 0.00 0.00
Bed 17 0.00 0.00 0.00 0.00
Bed 18 0.00 0.00 0.00 0.00
Bed 2 0.00 0.00 0.00 0.00
Bed 20 5.17 85.6667 88.0000 84.0000
Bed 21 5.17 85.6667 88.0000 84.0000
Bed 22 4.30 85.0000 87.0000 84.0000
Bed 23 5.74 85.3333 88.0000 84.0000
Bed 24 5.74 85.3333 88.0000 84.0000
Bed 25 5.17 85.6667 88.0000 84.0000
Bed 3 0.00 0.00 0.00 0.00
Bed 4 3.79 61.3333 63.0000 60.0000
Bed 5 3.79 61.3333 63.0000 60.0000
Bed 6 2.48 61.0000 62.0000 60.0000
Bed 7 2.48 61.0000 62.0000 60.0000
Bed 8 3.79 61.3333 63.0000 60.0000
Bed 9 2.87 61.6667 63.0000 61.0000
Charge Nurse 0.00 0.00 0.00 0.00
Cleaning Staff 40.39 1128.33 1141.00 1110.00
Clerk 1 11.38 164.00 168.00 159.00
Clerk 2 24.51 171.33 178.00 160.00
CT Machine 1 38.67 80.3333 95.0000 64.0000
CT Machine 2 32.49 72.0000 81.0000 57.0000
CT Tech 1 36.09 74.0000 88.0000 59.0000
CT Tech 2 35.34 78.3333 88.0000 62.0000
ED Transport 15.97 167.33 172.00 160.00
EKG Machine 1 0.00 0.00 0.00 0.00
EKG Machine 2 0.00 0.00 0.00 0.00
EKG Machine 3 0.00 0.00 0.00 0.00
Float Nurse 41.60 1508.33 1518.00 1489.00
Model Filename: Page of 30 32 R:\MQP\Model 12-11-10

96
Category Overview
12:48:54PM December 14, 2010
Unnamed Project
Time Units: Replications: 3 Hours
Values Across All Replications
Resource
Usage
Total Number Seized Maximum Average
Minimum Average Half Width Average
MD 1 73.15 434.00 468.00 417.00
MD 2 67.82 431.67 463.00 413.00
MD 3 8.61 427.00 429.00 423.00
MD 4 47.40 437.00 455.00 417.00
MD 5 58.42 407.00 430.00 383.00
Mental Health Group Room 0.00 0.00 0.00 0.00
MRI Machine 1 17.97 78.3333 83.0000 70.0000
MRI Machine 2 14.56 78.6667 83.0000 72.0000
MRI Tech 1 12.50 81.3333 86.0000 76.0000
MRI Tech 2 21.13 75.6667 82.0000 66.0000
Nurse 1 1,862.66 865.67 1309.00 0.00
Nurse 2 1,223.00 991.67 1560.00 698.00
Nurse 3 324.20 695.33 846.00 618.00
Nurse 4 107.58 611.00 661.00 586.00
Nurse 5 2.48 591.00 592.00 590.00
Portable Xray 1 7.99 20.6667 23.0000 17.0000
Portable Xray 2 10.04 15.3333 19.0000 11.0000
Radiologist 0.00 0.00 0.00 0.00
Registration 1 58.49 705.33 728.00 681.00
Registration 2 28.65 682.00 693.00 670.00
Sitter 1 0.00 0.00 0.00 0.00
Sitter 2 0.00 0.00 0.00 0.00
Tech 1 0.00 0.00 0.00 0.00
Tech 2 0.00 0.00 0.00 0.00
Tech 3 0.00 0.00 0.00 0.00
Triage Nurse 46.01 1645.00 1666.00 1631.00
Xray Machine 1 38.03 58.6667 76.0000 47.0000
Xray Machine 2 18.97 66.6667 75.0000 60.0000
Xray Machine 3 34.78 51.0000 65.0000 37.0000
Xray Machine 4 44.60 62.3333 76.0000 42.0000
Xray Tech 1 31.03 46.0000 56.0000 32.0000
Xray Tech 2 40.16 52.6667 70.0000 38.0000
Xray Tech 3 5.17 44.6667 47.0000 43.0000
Xray Tech 4 15.18 46.6667 52.0000 40.0000
Xray Tech 5 32.58 39.0000 51.0000 25.0000
Xray Tech 6 25.13 45.6667 52.0000 34.0000
Model Filename: Page of 31 32 R:\MQP\Model 12-11-10

97
Category Overview
12:48:54PM December 14, 2010
Unnamed Project
Time Units: Replications: 3 Hours
Values Across All Replications
User Specified
Counter
Count Maximum Average
Minimum Average Half Width Average
0.00 Record 24 0.00 0.00 0.00
0.00 Record Errors 0.00 0.00 0.00
0.00 Record Errors6 0.00 0.00 0.00
Model Filename: Page of 32 32 R:\MQP\Model 12-11-10
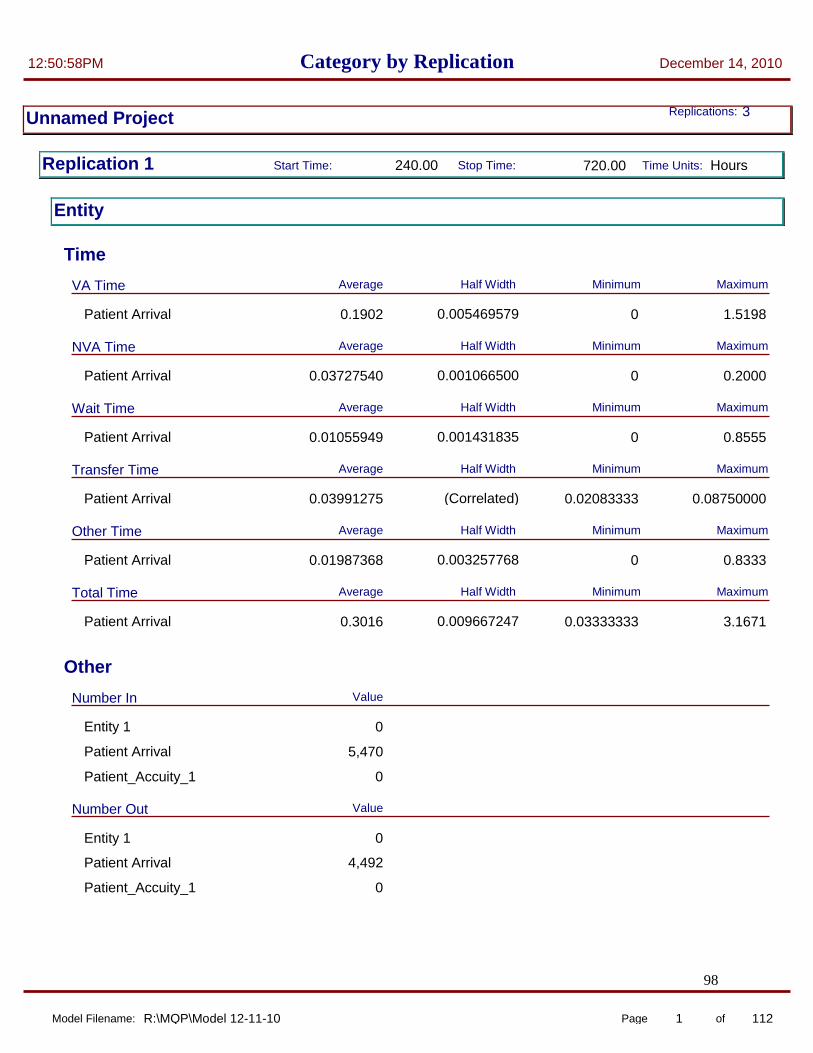
98
Category by Replication 12:50:58PM December 14, 2010
Unnamed Project 3 Replications:
Replication 1 Time Units: Start Time: Stop Time: 240.00 720.00 Hours
Entity
Time
VA Time Maximum Minimum Average Half Width
Patient Arrival 0.005469579 0 1.5198 0.1902
NVA Time Maximum Minimum Average Half Width
Patient Arrival 0.001066500 0 0.2000 0.03727540
Wait Time Maximum Minimum Average Half Width
Patient Arrival 0.001431835 0 0.8555 0.01055949
Transfer Time Maximum Minimum Average Half Width
Patient Arrival (Correlated) 0.02083333 0.08750000 0.03991275
Other Time Maximum Minimum Average Half Width
Patient Arrival 0.003257768 0 0.8333 0.01987368
Total Time Maximum Minimum Average Half Width
Patient Arrival 0.009667247 0.03333333 3.1671 0.3016
Other
Number In Value
Entity 1 0
Patient Arrival 5,470
Patient_Accuity_1 0
Number Out Value
Entity 1 0
Patient Arrival 4,492
Patient_Accuity_1 0
Model Filename: Page of 1 112 R:\MQP\Model 12-11-10
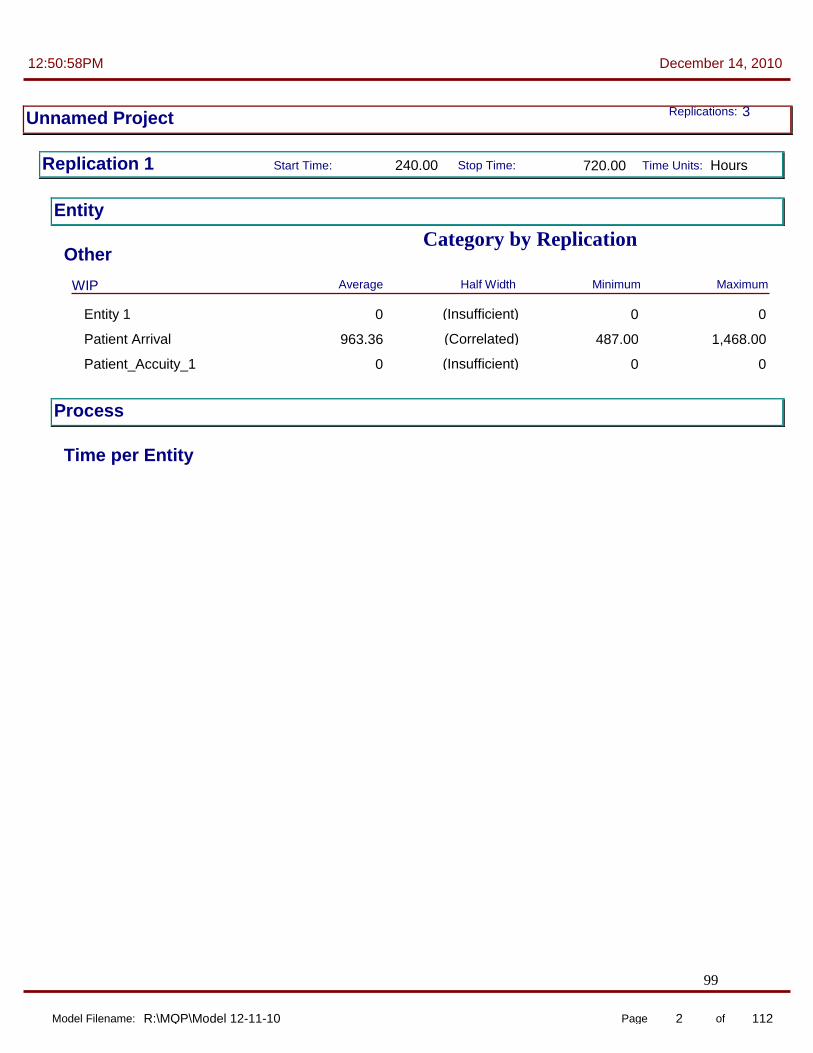
99
Category by Replication
12:50:58PM December 14, 2010
Unnamed Project 3 Replications:
Replication 1 Time Units: Start Time: Stop Time: 240.00 720.00 Hours
Entity
Other
WIP Maximum Minimum Average Half Width
Entity 1 (Insufficient) 0 0 0
Patient Arrival (Correlated) 487.00 1,468.00 963.36
Patient_Accuity_1 (Insufficient) 0 0 0
Process
Time per Entity
Model Filename: Page of 2 112 R:\MQP\Model 12-11-10

100
Category by Replication
12:50:58PM December 14, 2010
Unnamed Project 3 Replications:
Replication 1 Time Units: Start Time: Stop Time: 240.00 720.00 Hours
Process
Time per Entity
VA Time Per Entity Maximum Minimum Average Half Width
24 Hour Eval by Lipton
Section 12 (Insufficient) 0.2517 0.9721 0.5127
24 Hour Eval by MD Section 12
(Insufficient) 0.2604 0.9502 0.4897
Bedside registration side A (Insufficient) 0.04845303 0.1630 0.1014
Call Admitting MD (Insufficient) 0.01898758 0.04948487 0.03338810
CT Scan (Insufficient) 0.1780 0.3176 0.2445
Discharge Notes B side 0.000873475 0.03507364 0.08176577 0.05795903
Infrared input by secretary (Insufficient) 0.01787578 0.04900901 0.03394881
MD Exam on Side B 0.001900379 0.1381 0.2472 0.1915
MD to MD talk (Insufficient) 0.03508045 0.08232055 0.05940455
MRI (Insufficient) 0.1755 0.3310 0.2501
Nurse Does Discharge (Correlated) 0.1667 0.1667 0.1667
Nurse helps patient leave 0.000931033 0.03485044 0.08208889 0.05615126
Physician Examination A 0.002101772 0.1373 0.2462 0.1931
Pull IV 0.000777684 0.01796179 0.04954912 0.03311759
Registration and Insurance 0.001271121 0.03592031 0.1640 0.1014
RN RN discussion (Insufficient) 0.05968313 0.1875 0.1232
RN tests and Labs A 0.001539729 0.1697 0.2480 0.2089
Second MD Exam on B Side (Insufficient) 0.03745308 0.08026245 0.05891729
Second Physician Examination
0.000698941 0.03415529 0.08303006 0.05835610
Tests and Labs on Side B 0.001368035 0.1675 0.2467 0.2089
Triage Area 0.000974243 0.08407051 0.1650 0.1242
Xrays (Insufficient) 0.1699 0.2487 0.2073
Xrays Bedside (Insufficient) 0.1724 0.2487 0.2067
Model Filename: Page of 3 112 R:\MQP\Model 12-11-10

101
Category by Replication
12:50:58PM December 14, 2010
Unnamed Project 3 Replications:
Replication 1 Time Units: Start Time: Stop Time: 240.00 720.00 Hours
Process
Time per Entity
NVA Time Per Entity Maximum Minimum Average Half Width
Clean Side A Room (Correlated) 0.1667 0.1667 0.1667
Clean Side B Room (Correlated) 0.1667 0.1667 0.1667
Strip Side A Room (Correlated) 0.03333333 0.03333333 0.03333333
Strip Side B Room (Correlated) 0.03333333 0.03333333 0.03333333
Wait Time Per Entity Maximum Minimum Average Half Width
24 Hour Eval by MD Section 12
(Insufficient) 0 0.1796 0.01128101
Bedside registration side A (Insufficient) 0 0 0
Call Admitting MD (Insufficient) 0 0 0
Clean Side A Room 0.005678711 0 0.3766 0.03408196
Clean Side B Room 0.006092092 0 0.3276 0.03752955
Infrared input by secretary (Insufficient) 0 0 0
MD to MD talk (Insufficient) 0 0.5428 0.01498509
Nurse helps patient leave 0.000000000 0 0 0
RN RN discussion (Insufficient) 0 0.2296 0.01381700
RN tests and Labs A 0.000000000 0 0 0
Second MD Exam on B Side (Insufficient) 0 0.4085 0.00956254
Second Physician Examination
0.005652218 0 0.8249 0.01839217
Strip Side A Room 0.000000000 0 0 0
Strip Side B Room 0.000000000 0 0 0
Tests and Labs on Side B 0.000000000 0 0 0
Model Filename: Page of 4 112 R:\MQP\Model 12-11-10
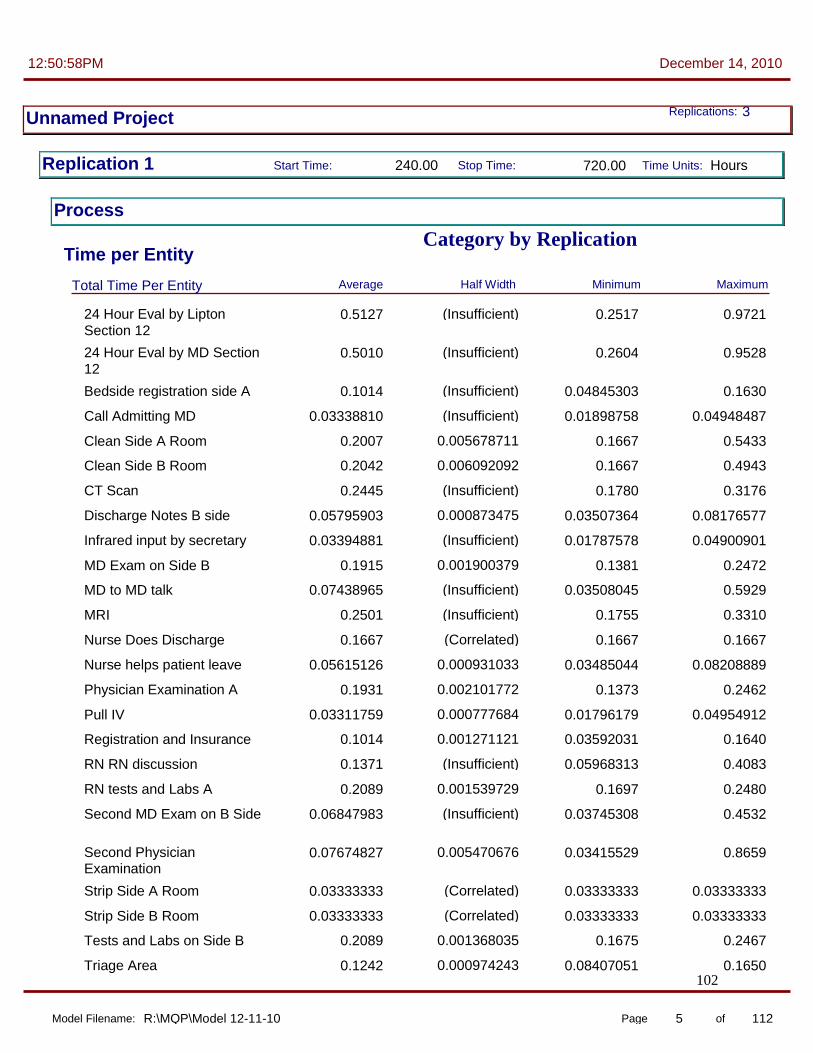
102
Category by Replication
12:50:58PM December 14, 2010
Unnamed Project 3 Replications:
Replication 1 Time Units: Start Time: Stop Time: 240.00 720.00 Hours
Process
Time per Entity
Total Time Per Entity Maximum Minimum Average Half Width
24 Hour Eval by Lipton
Section 12 (Insufficient) 0.2517 0.9721 0.5127
24 Hour Eval by MD Section 12
(Insufficient) 0.2604 0.9528 0.5010
Bedside registration side A (Insufficient) 0.04845303 0.1630 0.1014
Call Admitting MD (Insufficient) 0.01898758 0.04948487 0.03338810
Clean Side A Room 0.005678711 0.1667 0.5433 0.2007
Clean Side B Room 0.006092092 0.1667 0.4943 0.2042
CT Scan (Insufficient) 0.1780 0.3176 0.2445
Discharge Notes B side 0.000873475 0.03507364 0.08176577 0.05795903
Infrared input by secretary (Insufficient) 0.01787578 0.04900901 0.03394881
MD Exam on Side B 0.001900379 0.1381 0.2472 0.1915
MD to MD talk (Insufficient) 0.03508045 0.5929 0.07438965
MRI (Insufficient) 0.1755 0.3310 0.2501
Nurse Does Discharge (Correlated) 0.1667 0.1667 0.1667
Nurse helps patient leave 0.000931033 0.03485044 0.08208889 0.05615126
Physician Examination A 0.002101772 0.1373 0.2462 0.1931
Pull IV 0.000777684 0.01796179 0.04954912 0.03311759
Registration and Insurance 0.001271121 0.03592031 0.1640 0.1014
RN RN discussion (Insufficient) 0.05968313 0.4083 0.1371
RN tests and Labs A 0.001539729 0.1697 0.2480 0.2089
Second MD Exam on B Side (Insufficient) 0.03745308 0.4532 0.06847983
Second Physician Examination
0.005470676 0.03415529 0.8659 0.07674827
Strip Side A Room (Correlated) 0.03333333 0.03333333 0.03333333
Strip Side B Room (Correlated) 0.03333333 0.03333333 0.03333333
Tests and Labs on Side B 0.001368035 0.1675 0.2467 0.2089
Triage Area 0.000974243 0.08407051 0.1650 0.1242
Model Filename: Page of 5 112 R:\MQP\Model 12-11-10

103
Category by Replication
12:50:58PM December 14, 2010
Unnamed Project 3 Replications:
Replication 1 Time Units: Start Time: Stop Time: 240.00 720.00 Hours
Process
Time per Entity
Total Time Per Entity Maximum Minimum Average Half Width
Xrays (Insufficient) 0.1699 0.2487 0.2073
Xrays Bedside (Insufficient) 0.1724 0.2487 0.2067
Accumulated Time
Model Filename: Page of 6 112 R:\MQP\Model 12-11-10
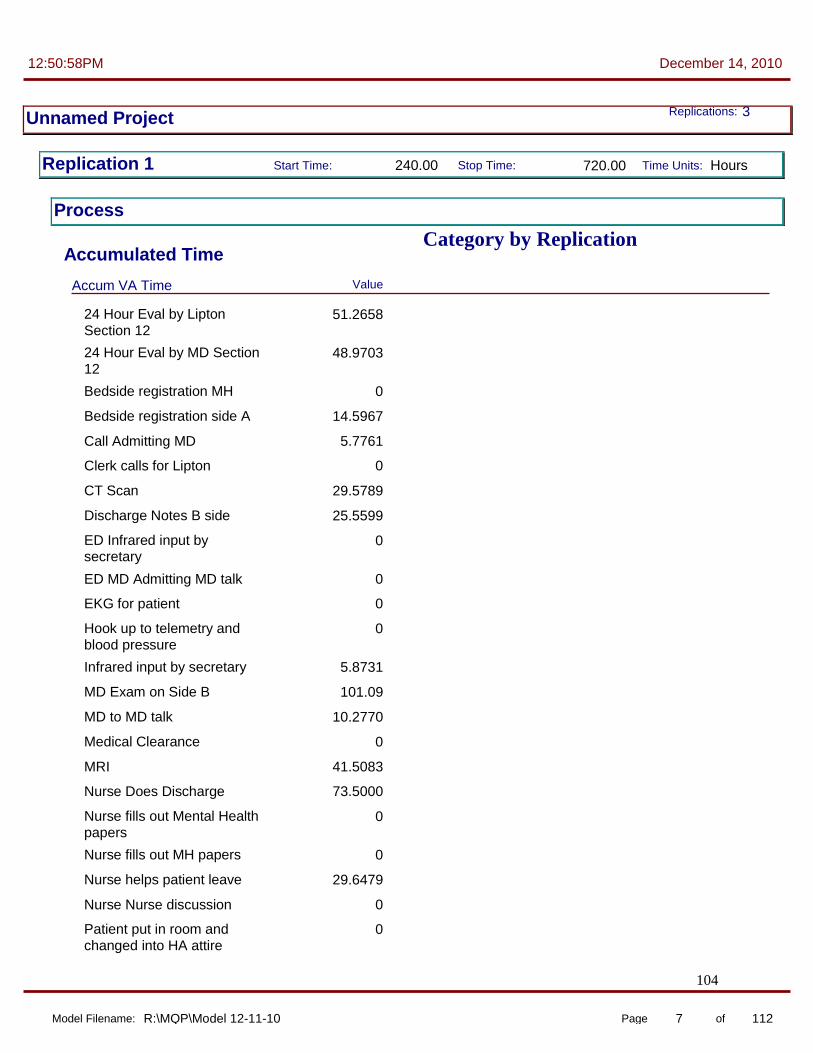
104
Category by Replication
12:50:58PM December 14, 2010
Unnamed Project 3 Replications:
Replication 1 Time Units: Start Time: Stop Time: 240.00 720.00 Hours
Process
Accumulated Time
Accum VA Time Value
24 Hour Eval by Lipton
Section 12 51.2658
24 Hour Eval by MD Section 12
48.9703
Bedside registration MH 0
Bedside registration side A 14.5967
Call Admitting MD 5.7761
Clerk calls for Lipton 0
CT Scan 29.5789
Discharge Notes B side 25.5599
ED Infrared input by secretary
0
ED MD Admitting MD talk 0
EKG for patient 0
Hook up to telemetry and blood pressure
0
Infrared input by secretary 5.8731
MD Exam on Side B 101.09
MD to MD talk 10.2770
Medical Clearance 0
MRI 41.5083
Nurse Does Discharge 73.5000
Nurse fills out Mental Health papers
0
Nurse fills out MH papers 0
Nurse helps patient leave 29.6479
Nurse Nurse discussion 0
Patient put in room and changed into HA attire
0
Model Filename: Page of 7 112 R:\MQP\Model 12-11-10

105
Category by Replication
12:50:58PM December 14, 2010
Unnamed Project 3 Replications:
Replication 1 Time Units: Start Time: Stop Time: 240.00 720.00 Hours
Process
Accumulated Time
Accum VA Time Value
Patient put in room and clothes changed
0
Physician Examination A 118.21
Pull IV 14.6049
Registration and Insurance 126.19
Remove Clothes and insert catheter
0
RN RN discussion 21.1966
RN tests and Labs A 127.84
RN tests and Labs Critical 0
Second MD Exam on B Side 7.6592
Second Physician Examination
35.8306
Sitter and Nurse review paperwork
0
Sitter and Nurse review paperwork during registration
0
Tests and Labs on Side B 110.28
Triage Area 203.51
Xrays 58.4480
Xrays Bedside 8.4767
Model Filename: Page of 8 112 R:\MQP\Model 12-11-10

106
Category by Replication
12:50:58PM December 14, 2010
Unnamed Project 3 Replications:
Replication 1 Time Units: Start Time: Stop Time: 240.00 720.00 Hours
Process
Accumulated Time
Accum NVA Time Value
Clean MH Room 0
Clean Side A Room 102.17
Clean Side B Room 88.0000
Clean Trauma Room 0
Clerk Call Admitting MD 0
Lipton Assessment 0
Strip MH Room 0
Strip Side A Room 20.4333
Strip Side B Room 17.6000
Strip Trauma Room 0
Trauma Patient gets bed 0
Model Filename: Page of 9 112 R:\MQP\Model 12-11-10
107
Category by Replication
12:50:58PM December 14, 2010
Unnamed Project 3 Replications:
Replication 1 Time Units: Start Time: Stop Time: 240.00 720.00 Hours
Process
Accumulated Time
Accum Wait Time Value
24 Hour Eval by MD Section
12 1.1281
Bedside registration MH 0
Bedside registration side A 0
Call Admitting MD 0
Clean MH Room 0
Clean Side A Room 20.8922
Clean Side B Room 19.8156
Clean Trauma Room 0
Clerk Call Admitting MD 0
Clerk calls for Lipton 0
ED Infrared input by secretary
0
ED MD Admitting MD talk 0
Infrared input by secretary 0
MD to MD talk 2.5924
Medical Clearance 0
Nurse fills out MH papers 0
Nurse helps patient leave 0
Nurse Nurse discussion 0
RN RN discussion 2.3765
RN tests and Labs A 0
Second MD Exam on B Side 1.2431
Second Physician Examination
11.2928
Strip MH Room 0
Strip Side A Room 0
Strip Side B Room 0
Model Filename: Page of 10 112 R:\MQP\Model 12-11-10
108
Category by Replication
12:50:58PM December 14, 2010
Unnamed Project 3 Replications:
Replication 1 Time Units: Start Time: Stop Time: 240.00 720.00 Hours
Process
Accumulated Time
Accum Wait Time Value
Strip Trauma Room 0
Tests and Labs on Side B 0
Other
Model Filename: Page of 11 112 R:\MQP\Model 12-11-10

109
Category by Replication
12:50:58PM December 14, 2010
Unnamed Project 3 Replications:
Replication 1 Time Units: Start Time: Stop Time: 240.00 720.00 Hours
Process
Other
Number In Value
24 Hour Eval by Lipton
Section 12 100
24 Hour Eval by MD Section 12
100
Bedside registration MH 0
Bedside registration side A 144
Call Admitting MD 173
Clean MH Room 0
Clean Side A Room 613
Clean Side B Room 528
Clean Trauma Room 0
Clerk Call Admitting MD 0
Clerk calls for Lipton 0
CT Scan 121
Discharge Notes B side 441
ED Infrared input by secretary
0
ED MD Admitting MD talk 0
EKG for patient 0
Hook up to telemetry and blood pressure
0
Infrared input by secretary 173
Lipton Assessment 0
MD Exam on Side B 528
MD to MD talk 173
Medical Clearance 0
MRI 166
Nurse Does Discharge 441
Model Filename: Page of 12 112 R:\MQP\Model 12-11-10

110
Category by Replication
12:50:58PM December 14, 2010
Unnamed Project 3 Replications:
Replication 1 Time Units: Start Time: Stop Time: 240.00 720.00 Hours
Process
Other
Number In Value
Nurse fills out Mental Health papers
0
Nurse fills out MH papers 0
Nurse helps patient leave 528
Nurse Nurse discussion 0
Patient put in room and changed into HA attire
0
Patient put in room and clothes changed
0
Physician Examination A 612
Pull IV 441
Registration and Insurance 1,246
Remove Clothes and insert catheter
0
RN RN discussion 172
RN tests and Labs A 612
RN tests and Labs Critical 0
Second MD Exam on B Side 130
Second Physician Examination
613
Sitter and Nurse review paperwork
0
Sitter and Nurse review paperwork during registration
0
Strip MH Room 0
Strip Side A Room 613
Strip Side B Room 528
Strip Trauma Room 0
Tests and Labs on Side B 528
Model Filename: Page of 13 112 R:\MQP\Model 12-11-10
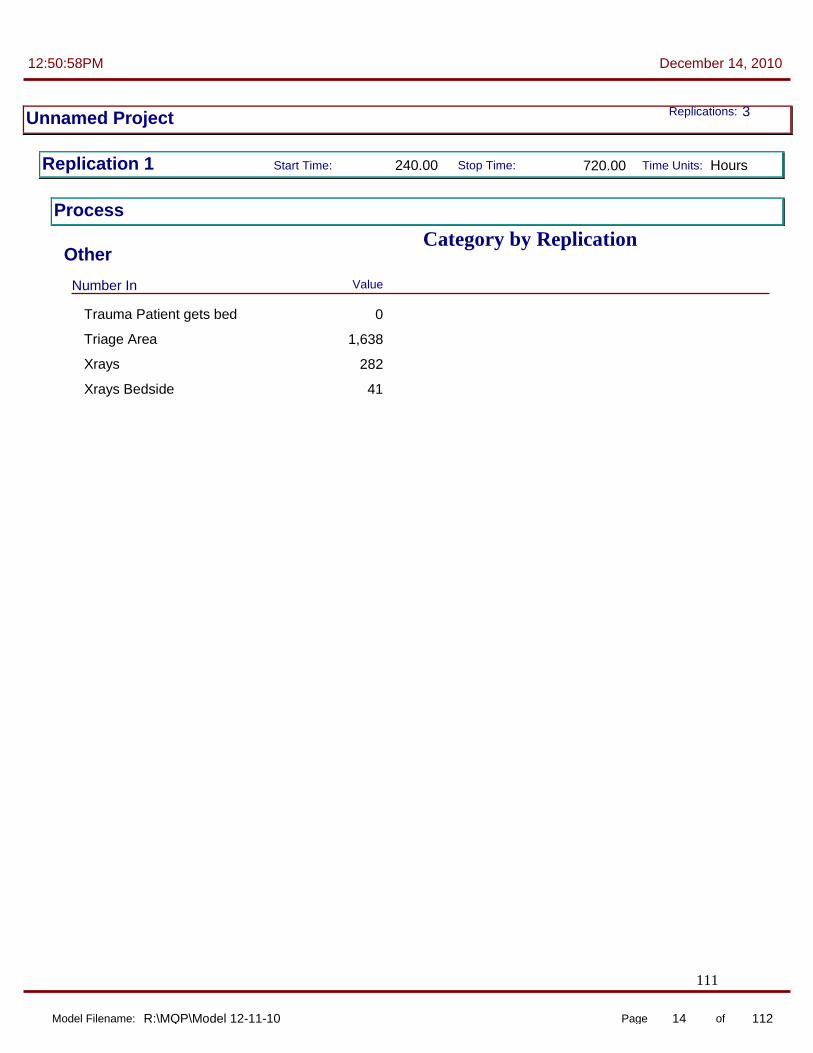
111
Category by Replication
12:50:58PM December 14, 2010
Unnamed Project 3 Replications:
Replication 1 Time Units: Start Time: Stop Time: 240.00 720.00 Hours
Process
Other
Number In Value
Trauma Patient gets bed 0
Triage Area 1,638
Xrays 282
Xrays Bedside 41
Model Filename: Page of 14 112 R:\MQP\Model 12-11-10

112
Category by Replication
12:50:58PM December 14, 2010
Unnamed Project 3 Replications:
Replication 1 Time Units: Start Time: Stop Time: 240.00 720.00 Hours
Process
Other
Number Out Value
24 Hour Eval by Lipton
Section 12 100
24 Hour Eval by MD Section 12
100
Bedside registration MH 0
Bedside registration side A 144
Call Admitting MD 173
Clean MH Room 0
Clean Side A Room 613
Clean Side B Room 528
Clean Trauma Room 0
Clerk Call Admitting MD 0
Clerk calls for Lipton 0
CT Scan 121
Discharge Notes B side 441
ED Infrared input by secretary
0
ED MD Admitting MD talk 0
EKG for patient 0
Hook up to telemetry and blood pressure
0
Infrared input by secretary 173
Lipton Assessment 0
MD Exam on Side B 528
MD to MD talk 173
Medical Clearance 0
MRI 166
Nurse Does Discharge 441
Model Filename: Page of 15 112 R:\MQP\Model 12-11-10

113
Category by Replication
12:50:58PM December 14, 2010
Unnamed Project 3 Replications:
Replication 1 Time Units: Start Time: Stop Time: 240.00 720.00 Hours
Process
Other
Number Out Value
Nurse fills out Mental Health papers
0
Nurse fills out MH papers 0
Nurse helps patient leave 528
Nurse Nurse discussion 0
Patient put in room and changed into HA attire
0
Patient put in room and clothes changed
0
Physician Examination A 612
Pull IV 441
Registration and Insurance 1,245
Remove Clothes and insert catheter
0
RN RN discussion 172
RN tests and Labs A 612
RN tests and Labs Critical 0
Second MD Exam on B Side 130
Second Physician Examination
614
Sitter and Nurse review paperwork
0
Sitter and Nurse review paperwork during registration
0
Strip MH Room 0
Strip Side A Room 613
Strip Side B Room 528
Strip Trauma Room 0
Tests and Labs on Side B 528
Model Filename: Page of 16 112 R:\MQP\Model 12-11-10
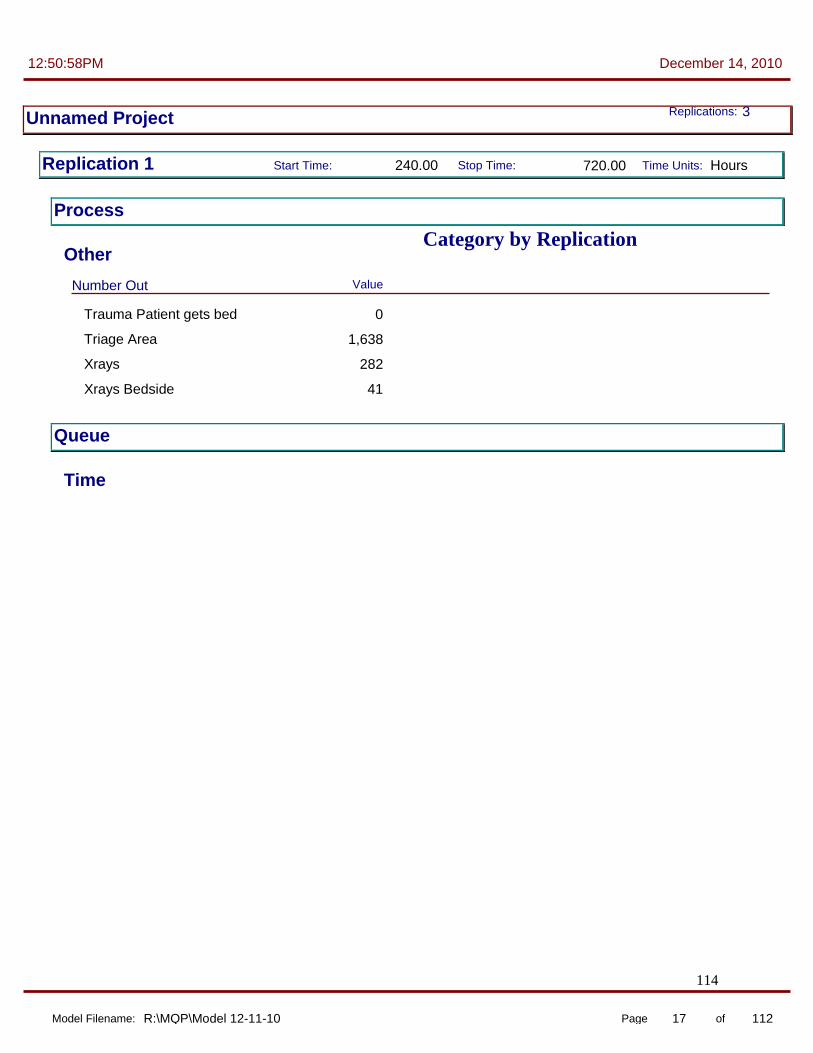
114
Category by Replication
12:50:58PM December 14, 2010
Unnamed Project 3 Replications:
Replication 1 Time Units: Start Time: Stop Time: 240.00 720.00 Hours
Process
Other
Number Out Value
Trauma Patient gets bed 0
Triage Area 1,638
Xrays 282
Xrays Bedside 41
Queue
Time
Model Filename: Page of 17 112 R:\MQP\Model 12-11-10
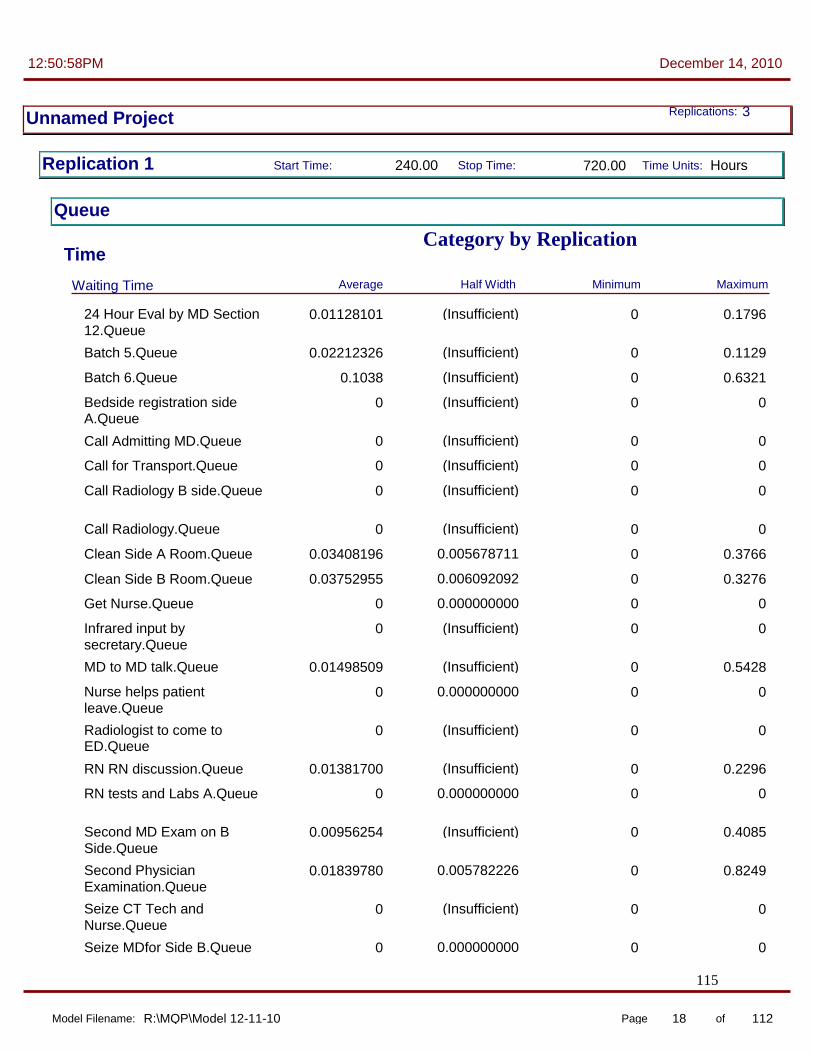
115
Category by Replication
12:50:58PM December 14, 2010
Unnamed Project 3 Replications:
Replication 1 Time Units: Start Time: Stop Time: 240.00 720.00 Hours
Queue
Time
Waiting Time Maximum Minimum Average Half Width
24 Hour Eval by MD Section
12.Queue (Insufficient) 0 0.1796 0.01128101
Batch 5.Queue (Insufficient) 0 0.1129 0.02212326
Batch 6.Queue (Insufficient) 0 0.6321 0.1038
Bedside registration side A.Queue
(Insufficient) 0 0 0
Call Admitting MD.Queue (Insufficient) 0 0 0
Call for Transport.Queue (Insufficient) 0 0 0
Call Radiology B side.Queue (Insufficient) 0 0 0
Call Radiology.Queue (Insufficient) 0 0 0
Clean Side A Room.Queue 0.005678711 0 0.3766 0.03408196
Clean Side B Room.Queue 0.006092092 0 0.3276 0.03752955
Get Nurse.Queue 0.000000000 0 0 0
Infrared input by secretary.Queue
(Insufficient) 0 0 0
MD to MD talk.Queue (Insufficient) 0 0.5428 0.01498509
Nurse helps patient leave.Queue
0.000000000 0 0 0
Radiologist to come to ED.Queue
(Insufficient) 0 0 0
RN RN discussion.Queue (Insufficient) 0 0.2296 0.01381700
RN tests and Labs A.Queue 0.000000000 0 0 0
Second MD Exam on B Side.Queue
(Insufficient) 0 0.4085 0.00956254
Second Physician Examination.Queue
0.005782226 0 0.8249 0.01839780
Seize CT Tech and Nurse.Queue
(Insufficient) 0 0 0
Seize MDfor Side B.Queue 0.000000000 0 0 0
Model Filename: Page of 18 112 R:\MQP\Model 12-11-10

116
Category by Replication
12:50:58PM December 14, 2010
Unnamed Project 3 Replications:
Replication 1 Time Units: Start Time: Stop Time: 240.00 720.00 Hours
Queue
Time
Waiting Time Maximum Minimum Average Half Width
Seize MRI tech and Nurse.Queue
(Insufficient) 0 0 0
Seize Physician A.Queue 0.000000000 0 0 0
Seize Registration and Insurance.Queue
0.000000000 0 0 0
Seize Side A Room and Transport Nurse.Queue
0.000000000 0 0 0
Seize Side B Room and Transport Nurse.Queue
0.000000000 0 0 0
Seize Triage Nurse.Queue 0.000000000 0 0 0
Strip Side A Room.Queue 0.000000000 0 0 0
Strip Side B Room.Queue 0.000000000 0 0 0
Tests and Labs on Side B.Queue
0.000000000 0 0 0
Other
Model Filename: Page of 19 112 R:\MQP\Model 12-11-10
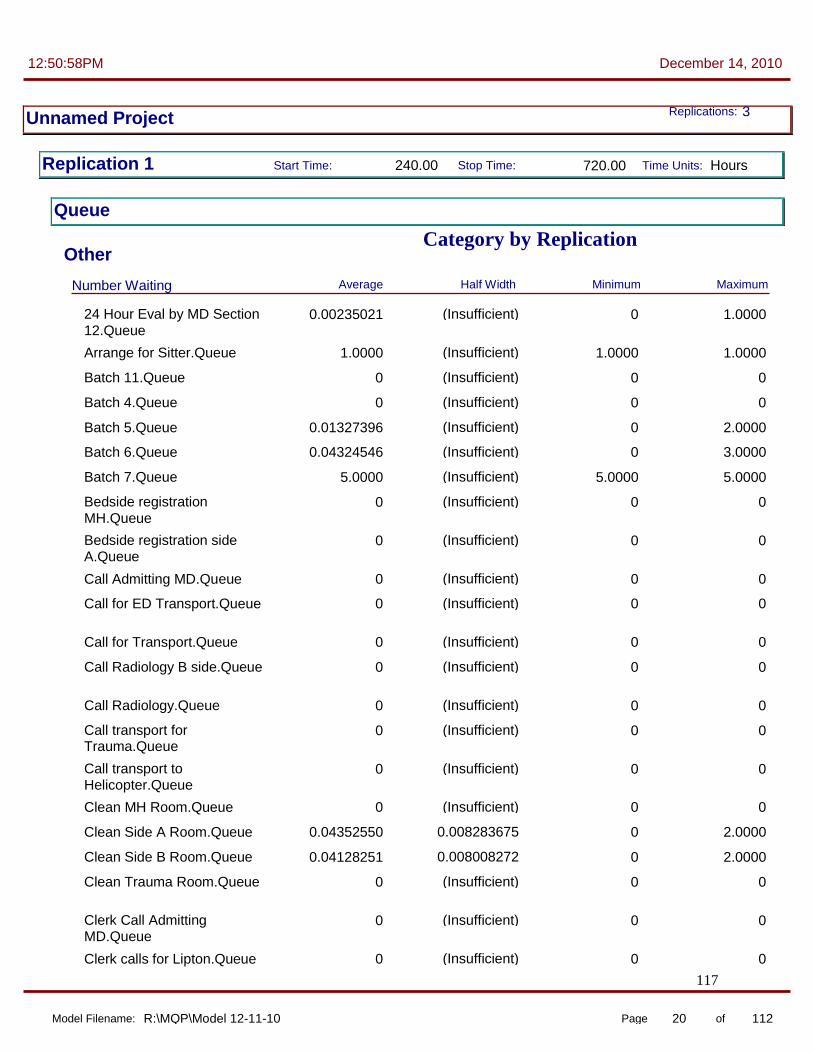
117
Category by Replication
12:50:58PM December 14, 2010
Unnamed Project 3 Replications:
Replication 1 Time Units: Start Time: Stop Time: 240.00 720.00 Hours
Queue
Other
Number Waiting Maximum Minimum Average Half Width
24 Hour Eval by MD Section
12.Queue (Insufficient) 0 1.0000 0.00235021
Arrange for Sitter.Queue (Insufficient) 1.0000 1.0000 1.0000
Batch 11.Queue (Insufficient) 0 0 0
Batch 4.Queue (Insufficient) 0 0 0
Batch 5.Queue (Insufficient) 0 2.0000 0.01327396
Batch 6.Queue (Insufficient) 0 3.0000 0.04324546
Batch 7.Queue (Insufficient) 5.0000 5.0000 5.0000
Bedside registration MH.Queue
(Insufficient) 0 0 0
Bedside registration side A.Queue
(Insufficient) 0 0 0
Call Admitting MD.Queue (Insufficient) 0 0 0
Call for ED Transport.Queue (Insufficient) 0 0 0
Call for Transport.Queue (Insufficient) 0 0 0
Call Radiology B side.Queue (Insufficient) 0 0 0
Call Radiology.Queue (Insufficient) 0 0 0
Call transport for Trauma.Queue
(Insufficient) 0 0 0
Call transport to Helicopter.Queue
(Insufficient) 0 0 0
Clean MH Room.Queue (Insufficient) 0 0 0
Clean Side A Room.Queue 0.008283675 0 2.0000 0.04352550
Clean Side B Room.Queue 0.008008272 0 2.0000 0.04128251
Clean Trauma Room.Queue (Insufficient) 0 0 0
Clerk Call Admitting MD.Queue
(Insufficient) 0 0 0
Clerk calls for Lipton.Queue (Insufficient) 0 0 0
Model Filename: Page of 20 112 R:\MQP\Model 12-11-10

118
Category by Replication
12:50:58PM December 14, 2010
Unnamed Project 3 Replications:
Replication 1 Time Units: Start Time: Stop Time: 240.00 720.00 Hours
Queue
Other
Number Waiting Maximum Minimum Average Half Width
ED Infrared input by
secretary.Queue (Insufficient) 0 0 0
ED MD Admitting MD talk.Queue
(Insufficient) 0 0 0
Get Nurse.Queue (Insufficient) 0 0 0
Infrared input by secretary.Queue
(Insufficient) 0 0 0
MD to MD talk.Queue (Insufficient) 0 1.0000 0.00540088
Medical Clearance.Queue (Insufficient) 0 0 0
Nurse fills out MH papers.Queue
(Insufficient) 0 0 0
Nurse helps patient leave.Queue
(Insufficient) 0 0 0
Nurse Nurse discussion.Queue
(Insufficient) 0 0 0
Radiologist to come to ED.Queue
(Insufficient) 0 0 0
RN RN discussion.Queue (Insufficient) 0 1.0000 0.00495109
RN tests and Labs A.Queue (Insufficient) 0 0 0
Second MD Exam on B Side.Queue
(Insufficient) 0 1.0000 0.00258985
Second Physician Examination.Queue
(Insufficient) 0 3.0000 0.02349553
Seize CT Tech and Nurse.Queue
(Insufficient) 0 0 0
Seize EKG and Tech.Queue (Correlated) 213.00 605.00 405.16
Seize EKG.Queue (Insufficient) 0 0 0
Seize MDfor Side B.Queue (Insufficient) 0 0 0
Seize Mental Health nurse.Queue
(Insufficient) 0 0 0
Seize Mental Health Room and Nurse.Queue
(Insufficient) 42.0000 148.00 90.3816
Model Filename: Page of 21 112 R:\MQP\Model 12-11-10

119
Category by Replication
12:50:58PM December 14, 2010
Unnamed Project 3 Replications:
Replication 1 Time Units: Start Time: Stop Time: 240.00 720.00 Hours
Queue
Other
Number Waiting Maximum Minimum Average Half Width
Seize MRI tech and
Nurse.Queue (Insufficient) 0 0 0
Seize Physician A.Queue (Insufficient) 0 0 0
Seize Registration and Insurance.Queue
(Insufficient) 0 0 0
Seize Room for Mental Health.Queue
(Insufficient) 15.0000 62.0000 37.1092
Seize Room.Queue (Insufficient) 0 0 0
Seize Side A Room and Transport Nurse.Queue
(Insufficient) 0 0 0
Seize Side B Room and Transport Nurse.Queue
(Insufficient) 0 0 0
Seize Trauma Bed.Queue (Insufficient) 114.00 349.00 228.64
Seize Triage Nurse.Queue (Insufficient) 0 0 0
Strip MH Room.Queue (Insufficient) 0 0 0
Strip Side A Room.Queue (Insufficient) 0 0 0
Strip Side B Room.Queue (Insufficient) 0 0 0
Strip Trauma Room.Queue (Insufficient) 0 0 0
Tests and Labs on Side B.Queue
(Insufficient) 0 0 0
Triage.Queue (Insufficient) 0 0 0
Resource
Usage
Model Filename: Page of 22 112 R:\MQP\Model 12-11-10

120
Category by Replication
12:50:58PM December 14, 2010
Unnamed Project 3 Replications:
Replication 1 Time Units: Start Time: Stop Time: 240.00 720.00 Hours
Resource
Usage
Instantaneous Utilization Maximum Minimum Average Half Width
Bed 1 (Insufficient) 0 0 0
Bed 10 (Insufficient) 0 1.0000 0.1990
Bed 11 (Insufficient) 0 1.0000 0.1979
Bed 12 (Insufficient) 0 1.0000 0.1875
Bed 13 (Insufficient) 0 1.0000 0.1902
Bed 14 (Insufficient) 1.0000 1.0000 1.0000
Bed 15 (Insufficient) 1.0000 1.0000 1.0000
Bed 16 (Insufficient) 1.0000 1.0000 1.0000
Bed 17 (Insufficient) 1.0000 1.0000 1.0000
Bed 18 (Insufficient) 1.0000 1.0000 1.0000
Bed 2 (Insufficient) 0 0 0
Bed 20 (Insufficient) 0 1.0000 0.1533
Bed 21 (Insufficient) 0 1.0000 0.1495
Bed 22 (Insufficient) 0 1.0000 0.1528
Bed 23 (Insufficient) 0 1.0000 0.1597
Bed 24 (Insufficient) 0 1.0000 0.1568
Bed 25 (Insufficient) 0 1.0000 0.1575
Bed 3 (Insufficient) 0 0 0
Bed 4 (Insufficient) 0 1.0000 0.1918
Bed 5 (Insufficient) 0 1.0000 0.1927
Bed 6 (Insufficient) 0 1.0000 0.1816
Bed 7 (Insufficient) 0 1.0000 0.1819
Bed 8 (Insufficient) 0 1.0000 0.1827
Bed 9 (Insufficient) 0 1.0000 0.1861
Charge Nurse (Insufficient) 1.0000 1.0000 1.0000
Cleaning Staff 0.016184055 0 1.0000 0.3962
Clerk 1 0.002224736 0 1.0000 0.01175694
Model Filename: Page of 23 112 R:\MQP\Model 12-11-10

121
Category by Replication
12:50:58PM December 14, 2010
Unnamed Project 3 Replications:
Replication 1 Time Units: Start Time: Stop Time: 240.00 720.00 Hours
Resource
Usage
Instantaneous Utilization Maximum Minimum Average Half Width
Clerk 2 0.002543323 0 1.0000 0.01251240
CT Machine 1 (Insufficient) 0 1.0000 0.03729530
CT Machine 2 (Insufficient) 0 1.0000 0.03273024
CT Tech 1 (Insufficient) 0 1.0000 0.03825179
CT Tech 2 (Insufficient) 0 1.0000 0.04017652
ED Transport 0.000928510 0 0.4000 0.00597222
EKG Machine 1 (Insufficient) 0 0 0
EKG Machine 2 (Insufficient) 0 0 0
EKG Machine 3 (Insufficient) 0 0 0
Float Nurse 0.014096754 0 1.0000 0.1704
MD 1 0.013656282 0 1.0000 0.1394
MD 2 0.014595303 0 1.0000 0.1694
MD 3 0.018311211 0 1.0000 0.1301
MD 4 0.021226329 0 1.0000 0.1561
MD 5 0.015961836 0 1.0000 0.1290
Mental Health Group Room (Insufficient) 1.0000 1.0000 1.0000
MRI Machine 1 (Insufficient) 0 1.0000 0.04872363
MRI Machine 2 (Insufficient) 0 1.0000 0.04924208
MRI Tech 1 (Insufficient) 0 1.0000 0.05660134
MRI Tech 2 (Insufficient) 0 1.0000 0.05289215
Nurse 1 0.015621215 0 1.0000 0.1994
Nurse 2 0.015729319 0 1.0000 0.1686
Nurse 3 0.014367137 0 1.0000 0.1534
Nurse 4 (Correlated) 0 1.0000 0.1570
Nurse 5 0.014899643 0 1.0000 0.1603
Portable Xray 1 (Insufficient) 0 1.0000 0.01725849
Portable Xray 2 (Insufficient) 0 1.0000 0.01463751
Model Filename: Page of 24 112 R:\MQP\Model 12-11-10
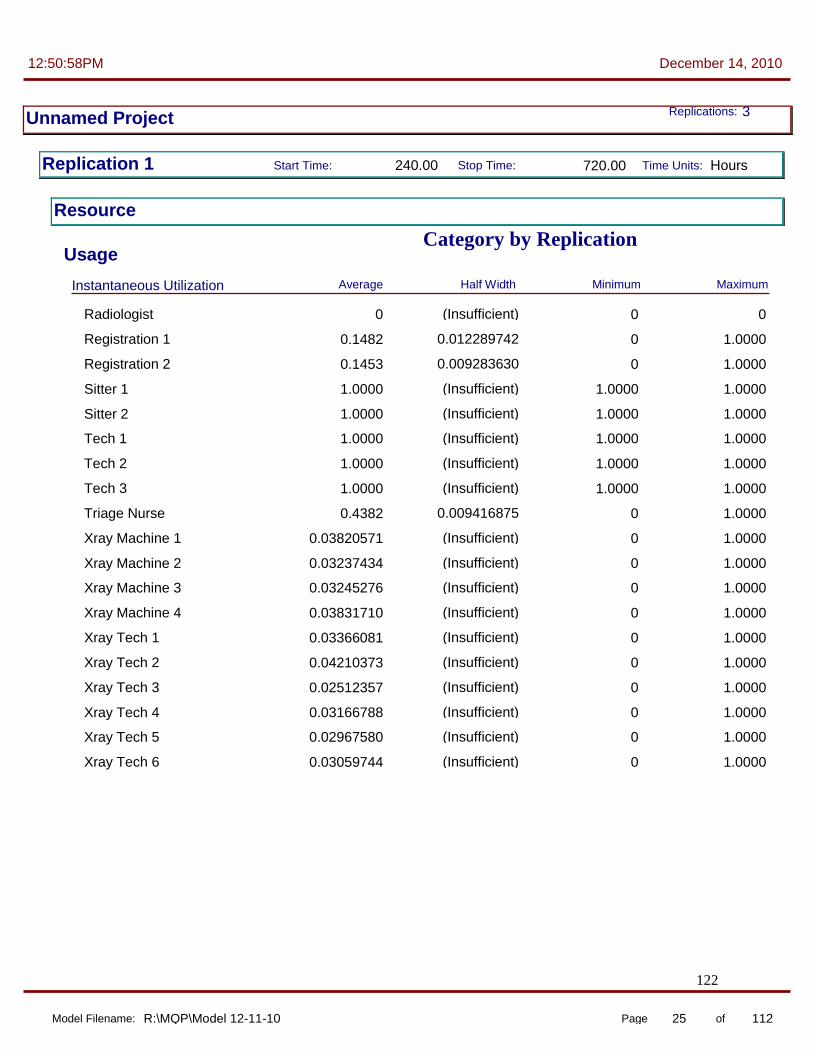
122
Category by Replication
12:50:58PM December 14, 2010
Unnamed Project 3 Replications:
Replication 1 Time Units: Start Time: Stop Time: 240.00 720.00 Hours
Resource
Usage
Instantaneous Utilization Maximum Minimum Average Half Width
Radiologist (Insufficient) 0 0 0
Registration 1 0.012289742 0 1.0000 0.1482
Registration 2 0.009283630 0 1.0000 0.1453
Sitter 1 (Insufficient) 1.0000 1.0000 1.0000
Sitter 2 (Insufficient) 1.0000 1.0000 1.0000
Tech 1 (Insufficient) 1.0000 1.0000 1.0000
Tech 2 (Insufficient) 1.0000 1.0000 1.0000
Tech 3 (Insufficient) 1.0000 1.0000 1.0000
Triage Nurse 0.009416875 0 1.0000 0.4382
Xray Machine 1 (Insufficient) 0 1.0000 0.03820571
Xray Machine 2 (Insufficient) 0 1.0000 0.03237434
Xray Machine 3 (Insufficient) 0 1.0000 0.03245276
Xray Machine 4 (Insufficient) 0 1.0000 0.03831710
Xray Tech 1 (Insufficient) 0 1.0000 0.03366081
Xray Tech 2 (Insufficient) 0 1.0000 0.04210373
Xray Tech 3 (Insufficient) 0 1.0000 0.02512357
Xray Tech 4 (Insufficient) 0 1.0000 0.03166788
Xray Tech 5 (Insufficient) 0 1.0000 0.02967580
Xray Tech 6 (Insufficient) 0 1.0000 0.03059744
Model Filename: Page of 25 112 R:\MQP\Model 12-11-10

123
Category by Replication
12:50:58PM December 14, 2010
Unnamed Project 3 Replications:
Replication 1 Time Units: Start Time: Stop Time: 240.00 720.00 Hours
Resource
Usage
Number Busy Maximum Minimum Average Half Width
Bed 1 (Insufficient) 0 0 0
Bed 10 (Insufficient) 0 1.0000 0.1990
Bed 11 (Insufficient) 0 1.0000 0.1979
Bed 12 (Insufficient) 0 1.0000 0.1875
Bed 13 (Insufficient) 0 1.0000 0.1902
Bed 14 (Insufficient) 1.0000 1.0000 1.0000
Bed 15 (Insufficient) 1.0000 1.0000 1.0000
Bed 16 (Insufficient) 1.0000 1.0000 1.0000
Bed 17 (Insufficient) 1.0000 1.0000 1.0000
Bed 18 (Insufficient) 1.0000 1.0000 1.0000
Bed 2 (Insufficient) 0 0 0
Bed 20 (Insufficient) 0 1.0000 0.1533
Bed 21 (Insufficient) 0 1.0000 0.1495
Bed 22 (Insufficient) 0 1.0000 0.1528
Bed 23 (Insufficient) 0 1.0000 0.1597
Bed 24 (Insufficient) 0 1.0000 0.1568
Bed 25 (Insufficient) 0 1.0000 0.1575
Bed 3 (Insufficient) 0 0 0
Bed 4 (Insufficient) 0 1.0000 0.1918
Bed 5 (Insufficient) 0 1.0000 0.1927
Bed 6 (Insufficient) 0 1.0000 0.1816
Bed 7 (Insufficient) 0 1.0000 0.1819
Bed 8 (Insufficient) 0 1.0000 0.1827
Bed 9 (Insufficient) 0 1.0000 0.1861
Charge Nurse (Insufficient) 1.0000 1.0000 1.0000
Cleaning Staff 0.016184055 0 1.0000 0.3962
Clerk 1 0.002224736 0 1.0000 0.01175694
Model Filename: Page of 26 112 R:\MQP\Model 12-11-10

124
Category by Replication
12:50:58PM December 14, 2010
Unnamed Project 3 Replications:
Replication 1 Time Units: Start Time: Stop Time: 240.00 720.00 Hours
Resource
Usage
Number Busy Maximum Minimum Average Half Width
Clerk 2 0.002543323 0 1.0000 0.01251240
CT Machine 1 (Insufficient) 0 1.0000 0.03729530
CT Machine 2 (Insufficient) 0 1.0000 0.03273024
CT Tech 1 (Insufficient) 0 1.0000 0.03825179
CT Tech 2 (Insufficient) 0 1.0000 0.04017652
ED Transport 0.004642551 0 2.0000 0.02986111
EKG Machine 1 (Insufficient) 0 0 0
EKG Machine 2 (Insufficient) 0 0 0
EKG Machine 3 (Insufficient) 0 0 0
Float Nurse 0.014096754 0 1.0000 0.1704
MD 1 0.013656282 0 1.0000 0.1394
MD 2 0.014595303 0 1.0000 0.1694
MD 3 0.018311211 0 1.0000 0.1301
MD 4 0.021226329 0 1.0000 0.1561
MD 5 0.015961836 0 1.0000 0.1290
Mental Health Group Room (Insufficient) 1.0000 1.0000 1.0000
MRI Machine 1 (Insufficient) 0 1.0000 0.04872363
MRI Machine 2 (Insufficient) 0 1.0000 0.04924208
MRI Tech 1 (Insufficient) 0 1.0000 0.05660134
MRI Tech 2 (Insufficient) 0 1.0000 0.05289215
Nurse 1 0.015621215 0 1.0000 0.1994
Nurse 2 0.015729319 0 1.0000 0.1686
Nurse 3 0.014367137 0 1.0000 0.1534
Nurse 4 (Correlated) 0 1.0000 0.1570
Nurse 5 0.014899643 0 1.0000 0.1603
Portable Xray 1 (Insufficient) 0 1.0000 0.01725849
Portable Xray 2 (Insufficient) 0 1.0000 0.01463751
Model Filename: Page of 27 112 R:\MQP\Model 12-11-10

125
Category by Replication
12:50:58PM December 14, 2010
Unnamed Project 3 Replications:
Replication 1 Time Units: Start Time: Stop Time: 240.00 720.00 Hours
Resource
Usage
Number Busy Maximum Minimum Average Half Width
Radiologist (Insufficient) 0 0 0
Registration 1 0.012289742 0 1.0000 0.1482
Registration 2 0.009283630 0 1.0000 0.1453
Sitter 1 (Insufficient) 1.0000 1.0000 1.0000
Sitter 2 (Insufficient) 1.0000 1.0000 1.0000
Tech 1 (Insufficient) 1.0000 1.0000 1.0000
Tech 2 (Insufficient) 1.0000 1.0000 1.0000
Tech 3 (Insufficient) 1.0000 1.0000 1.0000
Triage Nurse 0.009416875 0 1.0000 0.4382
Xray Machine 1 (Insufficient) 0 1.0000 0.03820571
Xray Machine 2 (Insufficient) 0 1.0000 0.03237434
Xray Machine 3 (Insufficient) 0 1.0000 0.03245276
Xray Machine 4 (Insufficient) 0 1.0000 0.03831710
Xray Tech 1 (Insufficient) 0 1.0000 0.03366081
Xray Tech 2 (Insufficient) 0 1.0000 0.04210373
Xray Tech 3 (Insufficient) 0 1.0000 0.02512357
Xray Tech 4 (Insufficient) 0 1.0000 0.03166788
Xray Tech 5 (Insufficient) 0 1.0000 0.02967580
Xray Tech 6 (Insufficient) 0 1.0000 0.03059744
Model Filename: Page of 28 112 R:\MQP\Model 12-11-10

126
Category by Replication
12:50:58PM December 14, 2010
Unnamed Project 3 Replications:
Replication 1 Time Units: Start Time: Stop Time: 240.00 720.00 Hours
Resource
Usage
Number Scheduled Maximum Minimum Average Half Width
Bed 1 (Insufficient) 1.0000 1.0000 1.0000
Bed 10 (Insufficient) 1.0000 1.0000 1.0000
Bed 11 (Insufficient) 1.0000 1.0000 1.0000
Bed 12 (Insufficient) 1.0000 1.0000 1.0000
Bed 13 (Insufficient) 1.0000 1.0000 1.0000
Bed 14 (Insufficient) 1.0000 1.0000 1.0000
Bed 15 (Insufficient) 1.0000 1.0000 1.0000
Bed 16 (Insufficient) 1.0000 1.0000 1.0000
Bed 17 (Insufficient) 1.0000 1.0000 1.0000
Bed 18 (Insufficient) 1.0000 1.0000 1.0000
Bed 2 (Insufficient) 1.0000 1.0000 1.0000
Bed 20 (Insufficient) 1.0000 1.0000 1.0000
Bed 21 (Insufficient) 1.0000 1.0000 1.0000
Bed 22 (Insufficient) 1.0000 1.0000 1.0000
Bed 23 (Insufficient) 1.0000 1.0000 1.0000
Bed 24 (Insufficient) 1.0000 1.0000 1.0000
Bed 25 (Insufficient) 1.0000 1.0000 1.0000
Bed 3 (Insufficient) 1.0000 1.0000 1.0000
Bed 4 (Insufficient) 1.0000 1.0000 1.0000
Bed 5 (Insufficient) 1.0000 1.0000 1.0000
Bed 6 (Insufficient) 1.0000 1.0000 1.0000
Bed 7 (Insufficient) 1.0000 1.0000 1.0000
Bed 8 (Insufficient) 1.0000 1.0000 1.0000
Bed 9 (Insufficient) 1.0000 1.0000 1.0000
Charge Nurse (Insufficient) 1.0000 1.0000 1.0000
Cleaning Staff (Insufficient) 1.0000 1.0000 1.0000
Clerk 1 (Insufficient) 1.0000 1.0000 1.0000
Model Filename: Page of 29 112 R:\MQP\Model 12-11-10

127
Category by Replication
12:50:58PM December 14, 2010
Unnamed Project 3 Replications:
Replication 1 Time Units: Start Time: Stop Time: 240.00 720.00 Hours
Resource
Usage
Number Scheduled Maximum Minimum Average Half Width
Clerk 2 (Insufficient) 1.0000 1.0000 1.0000
CT Machine 1 (Insufficient) 1.0000 1.0000 1.0000
CT Machine 2 (Insufficient) 1.0000 1.0000 1.0000
CT Tech 1 (Insufficient) 1.0000 1.0000 1.0000
CT Tech 2 (Insufficient) 1.0000 1.0000 1.0000
ED Transport (Insufficient) 5.0000 5.0000 5.0000
EKG Machine 1 (Insufficient) 1.0000 1.0000 1.0000
EKG Machine 2 (Insufficient) 1.0000 1.0000 1.0000
EKG Machine 3 (Insufficient) 1.0000 1.0000 1.0000
Float Nurse (Insufficient) 1.0000 1.0000 1.0000
MD 1 (Insufficient) 1.0000 1.0000 1.0000
MD 2 (Insufficient) 1.0000 1.0000 1.0000
MD 3 (Insufficient) 1.0000 1.0000 1.0000
MD 4 (Insufficient) 1.0000 1.0000 1.0000
MD 5 (Insufficient) 1.0000 1.0000 1.0000
Mental Health Group Room (Insufficient) 1.0000 1.0000 1.0000
MRI Machine 1 (Insufficient) 1.0000 1.0000 1.0000
MRI Machine 2 (Insufficient) 1.0000 1.0000 1.0000
MRI Tech 1 (Insufficient) 1.0000 1.0000 1.0000
MRI Tech 2 (Insufficient) 1.0000 1.0000 1.0000
Nurse 1 (Insufficient) 1.0000 1.0000 1.0000
Nurse 2 (Insufficient) 1.0000 1.0000 1.0000
Nurse 3 (Insufficient) 1.0000 1.0000 1.0000
Nurse 4 (Insufficient) 1.0000 1.0000 1.0000
Nurse 5 (Insufficient) 1.0000 1.0000 1.0000
Portable Xray 1 (Insufficient) 1.0000 1.0000 1.0000
Portable Xray 2 (Insufficient) 1.0000 1.0000 1.0000
Model Filename: Page of 30 112 R:\MQP\Model 12-11-10

128
Category by Replication
12:50:58PM December 14, 2010
Unnamed Project 3 Replications:
Replication 1 Time Units: Start Time: Stop Time: 240.00 720.00 Hours
Resource
Usage
Number Scheduled Maximum Minimum Average Half Width
Radiologist (Insufficient) 1.0000 1.0000 1.0000
Registration 1 (Insufficient) 1.0000 1.0000 1.0000
Registration 2 (Insufficient) 1.0000 1.0000 1.0000
Sitter 1 (Insufficient) 1.0000 1.0000 1.0000
Sitter 2 (Insufficient) 1.0000 1.0000 1.0000
Tech 1 (Insufficient) 1.0000 1.0000 1.0000
Tech 2 (Insufficient) 1.0000 1.0000 1.0000
Tech 3 (Insufficient) 1.0000 1.0000 1.0000
Triage Nurse (Insufficient) 1.0000 1.0000 1.0000
Xray Machine 1 (Insufficient) 1.0000 1.0000 1.0000
Xray Machine 2 (Insufficient) 1.0000 1.0000 1.0000
Xray Machine 3 (Insufficient) 1.0000 1.0000 1.0000
Xray Machine 4 (Insufficient) 1.0000 1.0000 1.0000
Xray Tech 1 (Insufficient) 1.0000 1.0000 1.0000
Xray Tech 2 (Insufficient) 1.0000 1.0000 1.0000
Xray Tech 3 (Insufficient) 1.0000 1.0000 1.0000
Xray Tech 4 (Insufficient) 1.0000 1.0000 1.0000
Xray Tech 5 (Insufficient) 1.0000 1.0000 1.0000
Xray Tech 6 (Insufficient) 1.0000 1.0000 1.0000
Model Filename: Page of 31 112 R:\MQP\Model 12-11-10

129
Category by Replication
12:50:58PM December 14, 2010
Unnamed Project 3 Replications:
Replication 1 Time Units: Start Time: Stop Time: 240.00 720.00 Hours
Resource
Usage
Scheduled Utilization Value
Bed 1 0
Bed 10 0.1990
Bed 11 0.1979
Bed 12 0.1875
Bed 13 0.1902
Bed 14 1.0000
Bed 15 1.0000
Bed 16 1.0000
Bed 17 1.0000
Bed 18 1.0000
Bed 2 0
Bed 20 0.1533
Bed 21 0.1495
Bed 22 0.1528
Bed 23 0.1597
Bed 24 0.1568
Bed 25 0.1575
Bed 3 0
Bed 4 0.1918
Bed 5 0.1927
Bed 6 0.1816
Bed 7 0.1819
Bed 8 0.1827
Bed 9 0.1861
Charge Nurse 1.0000
Cleaning Staff 0.3962
Clerk 1 0.01175694
Model Filename: Page of 32 112 R:\MQP\Model 12-11-10
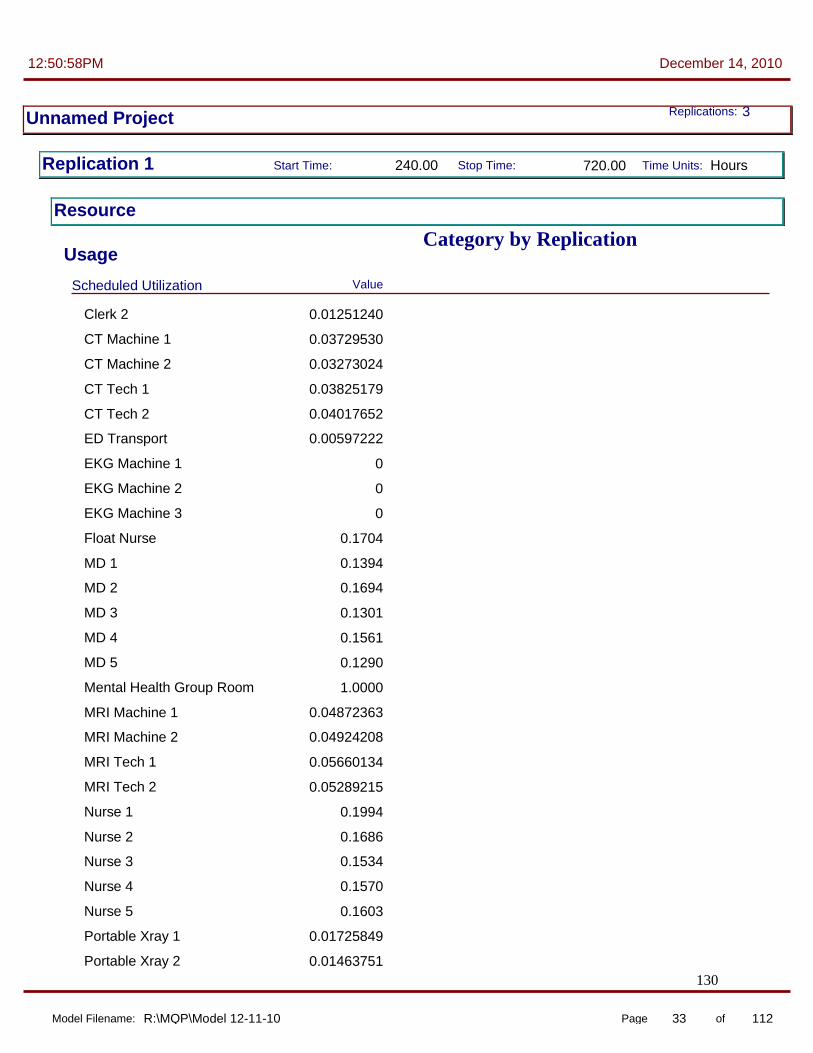
130
Category by Replication
12:50:58PM December 14, 2010
Unnamed Project 3 Replications:
Replication 1 Time Units: Start Time: Stop Time: 240.00 720.00 Hours
Resource
Usage
Scheduled Utilization Value
Clerk 2 0.01251240
CT Machine 1 0.03729530
CT Machine 2 0.03273024
CT Tech 1 0.03825179
CT Tech 2 0.04017652
ED Transport 0.00597222
EKG Machine 1 0
EKG Machine 2 0
EKG Machine 3 0
Float Nurse 0.1704
MD 1 0.1394
MD 2 0.1694
MD 3 0.1301
MD 4 0.1561
MD 5 0.1290
Mental Health Group Room 1.0000
MRI Machine 1 0.04872363
MRI Machine 2 0.04924208
MRI Tech 1 0.05660134
MRI Tech 2 0.05289215
Nurse 1 0.1994
Nurse 2 0.1686
Nurse 3 0.1534
Nurse 4 0.1570
Nurse 5 0.1603
Portable Xray 1 0.01725849
Portable Xray 2 0.01463751
Model Filename: Page of 33 112 R:\MQP\Model 12-11-10

131
Category by Replication
12:50:58PM December 14, 2010
Unnamed Project 3 Replications:
Replication 1 Time Units: Start Time: Stop Time: 240.00 720.00 Hours
Resource
Usage
Scheduled Utilization Value
Radiologist 0
Registration 1 0.1482
Registration 2 0.1453
Sitter 1 1.0000
Sitter 2 1.0000
Tech 1 1.0000
Tech 2 1.0000
Tech 3 1.0000
Triage Nurse 0.4382
Xray Machine 1 0.03820571
Xray Machine 2 0.03237434
Xray Machine 3 0.03245276
Xray Machine 4 0.03831710
Xray Tech 1 0.03366081
Xray Tech 2 0.04210373
Xray Tech 3 0.02512357
Xray Tech 4 0.03166788
Xray Tech 5 0.02967580
Xray Tech 6 0.03059744
Model Filename: Page of 34 112 R:\MQP\Model 12-11-10

132
Category by Replication
12:50:58PM December 14, 2010
Unnamed Project 3 Replications:
Replication 1 Time Units: Start Time: Stop Time: 240.00 720.00 Hours
Resource
Usage
Total Number Seized Value
Bed 1 0
Bed 10 61.0000
Bed 11 62.0000
Bed 12 62.0000
Bed 13 61.0000
Bed 14 0
Bed 15 0
Bed 16 0
Bed 17 0
Bed 18 0
Bed 2 0
Bed 20 88.0000
Bed 21 88.0000
Bed 22 87.0000
Bed 23 88.0000
Bed 24 88.0000
Bed 25 88.0000
Bed 3 0
Bed 4 61.0000
Bed 5 61.0000
Bed 6 61.0000
Bed 7 61.0000
Bed 8 61.0000
Bed 9 61.0000
Charge Nurse 0
Cleaning Staff 1,141.00
Clerk 1 168.00
Model Filename: Page of 35 112 R:\MQP\Model 12-11-10

133
Category by Replication
12:50:58PM December 14, 2010
Unnamed Project 3 Replications:
Replication 1 Time Units: Start Time: Stop Time: 240.00 720.00 Hours
Resource
Usage
Total Number Seized Value
Clerk 2 178.00
CT Machine 1 64.0000
CT Machine 2 57.0000
CT Tech 1 59.0000
CT Tech 2 62.0000
ED Transport 172.00
EKG Machine 1 0
EKG Machine 2 0
EKG Machine 3 0
Float Nurse 1,518.00
MD 1 417.00
MD 2 463.00
MD 3 429.00
MD 4 417.00
MD 5 430.00
Mental Health Group Room 0
MRI Machine 1 82.0000
MRI Machine 2 83.0000
MRI Tech 1 86.0000
MRI Tech 2 79.0000
Nurse 1 1,309.00
Nurse 2 717.00
Nurse 3 622.00
Nurse 4 586.00
Nurse 5 591.00
Portable Xray 1 22.0000
Portable Xray 2 19.0000
Model Filename: Page of 36 112 R:\MQP\Model 12-11-10

134
Category by Replication
12:50:58PM December 14, 2010
Unnamed Project 3 Replications:
Replication 1 Time Units: Start Time: Stop Time: 240.00 720.00 Hours
Resource
Usage
Total Number Seized Value
Radiologist 0
Registration 1 707.00
Registration 2 683.00
Sitter 1 0
Sitter 2 0
Tech 1 0
Tech 2 0
Tech 3 0
Triage Nurse 1,638.00
Xray Machine 1 76.0000
Xray Machine 2 65.0000
Xray Machine 3 65.0000
Xray Machine 4 76.0000
Xray Tech 1 56.0000
Xray Tech 2 70.0000
Xray Tech 3 43.0000
Xray Tech 4 52.0000
Xray Tech 5 51.0000
Xray Tech 6 51.0000
System
Other
Number Out Value
System 6,122
User Specified
Model Filename: Page of 37 112 R:\MQP\Model 12-11-10

135
Category by Replication
12:50:58PM December 14, 2010
Unnamed Project 3 Replications:
Replication 1 Time Units: Start Time: Stop Time: 240.00 720.00 Hours
User Specified
Counter
Count Value
Record 24 0
Record Errors 0
Record Errors6 0
Replication 2 Time Units: Start Time: Stop Time: 240.00 720.00 Hours
Entity
Time
VA Time Maximum Minimum Average Half Width
Patient Arrival 0.004776503 0 1.4772 0.1847
NVA Time Maximum Minimum Average Half Width
Patient Arrival 0.000913856 0 0.2000 0.03660670
Wait Time Maximum Minimum Average Half Width
Patient Arrival 0.001299383 0 0.8580 0.01019281
Transfer Time Maximum Minimum Average Half Width
Patient Arrival 0.000495981 0.02083333 0.08750000 0.03934987
Other Time Maximum Minimum Average Half Width
Patient Arrival 0.002657777 0 0.8333 0.01840238
Total Time Maximum Minimum Average Half Width
Patient Arrival 0.008739686 0.03333333 3.0377 0.2934
Other
Model Filename: Page of 38 112 R:\MQP\Model 12-11-10
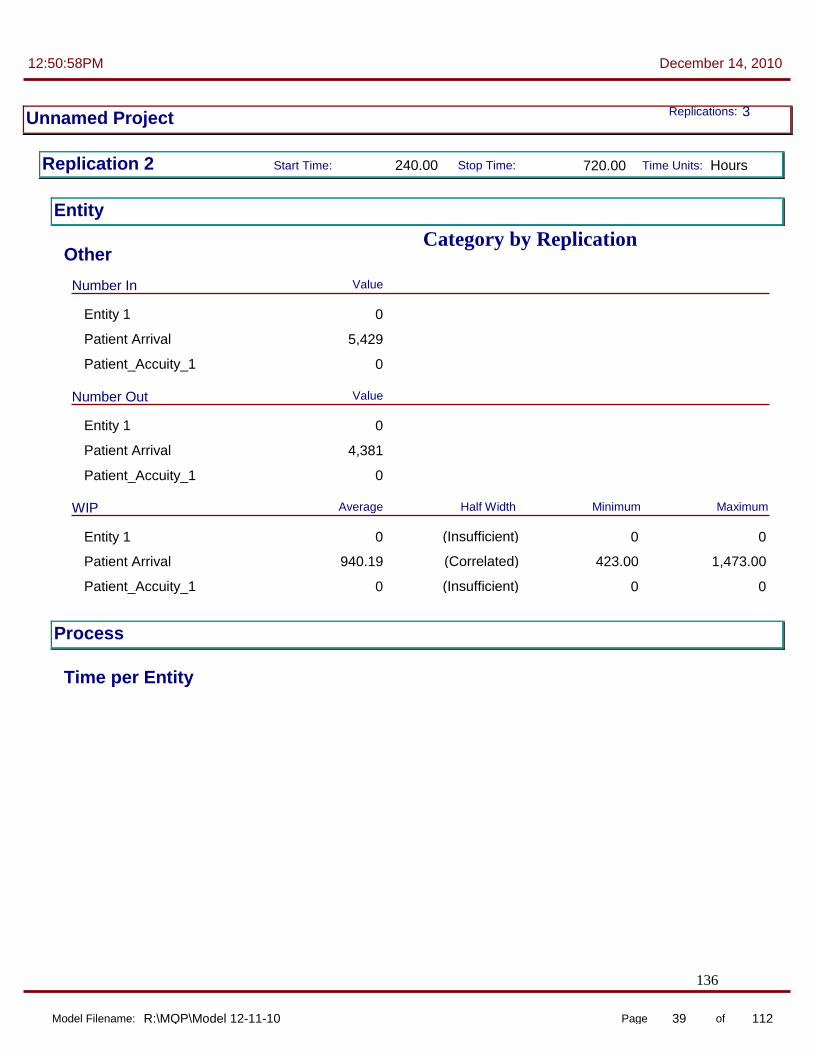
136
Category by Replication
12:50:58PM December 14, 2010
Unnamed Project 3 Replications:
Replication 2 Time Units: Start Time: Stop Time: 240.00 720.00 Hours
Entity
Other
Number In Value
Entity 1 0
Patient Arrival 5,429
Patient_Accuity_1 0
Number Out Value
Entity 1 0
Patient Arrival 4,381
Patient_Accuity_1 0
WIP Maximum Minimum Average Half Width
Entity 1 (Insufficient) 0 0 0
Patient Arrival (Correlated) 423.00 1,473.00 940.19
Patient_Accuity_1 (Insufficient) 0 0 0
Process
Time per Entity
Model Filename: Page of 39 112 R:\MQP\Model 12-11-10

137
Category by Replication
12:50:58PM December 14, 2010
Unnamed Project 3 Replications:
Replication 2 Time Units: Start Time: Stop Time: 240.00 720.00 Hours
Process
Time per Entity
VA Time Per Entity Maximum Minimum Average Half Width
24 Hour Eval by Lipton
Section 12 (Insufficient) 0.2516 0.9444 0.5002
24 Hour Eval by MD Section 12
(Insufficient) 0.2520 0.9791 0.5111
Bedside registration side A (Insufficient) 0.04214520 0.1506 0.0980
Call Admitting MD (Insufficient) 0.01835304 0.04834093 0.03382827
CT Scan (Insufficient) 0.1721 0.3201 0.2498
Discharge Notes B side 0.000940929 0.03450979 0.08257766 0.05829210
Infrared input by secretary (Insufficient) 0.01681836 0.04766540 0.03340486
MD Exam on Side B 0.002450824 0.1379 0.2446 0.1898
MD to MD talk (Insufficient) 0.03501825 0.08194282 0.05816508
MRI (Insufficient) 0.1717 0.3206 0.2467
Nurse Does Discharge (Correlated) 0.1667 0.1667 0.1667
Nurse helps patient leave 0.001105534 0.03519600 0.08235046 0.05567554
Physician Examination A 0.001810825 0.1338 0.2487 0.1924
Pull IV 0.000659111 0.01764118 0.04941625 0.03334048
Registration and Insurance 0.001745669 0.03524996 0.1632 0.1002
RN RN discussion (Insufficient) 0.05572266 0.1970 0.1187
RN tests and Labs A 0.001087524 0.1677 0.2481 0.2078
Second MD Exam on B Side (Insufficient) 0.03667968 0.08144113 0.05915038
Second Physician Examination
0.000861987 0.03514187 0.08266386 0.05776847
Tests and Labs on Side B (Correlated) 0.1712 0.2491 0.2098
Triage Area 0.000802990 0.08382497 0.1653 0.1247
Xrays (Insufficient) 0.1714 0.2495 0.2077
Xrays Bedside (Insufficient) 0.1732 0.2376 0.2092
Model Filename: Page of 40 112 R:\MQP\Model 12-11-10

138
Category by Replication
12:50:58PM December 14, 2010
Unnamed Project 3 Replications:
Replication 2 Time Units: Start Time: Stop Time: 240.00 720.00 Hours
Process
Time per Entity
NVA Time Per Entity Maximum Minimum Average Half Width
Clean Side A Room (Correlated) 0.1667 0.1667 0.1667
Clean Side B Room (Correlated) 0.1667 0.1667 0.1667
Strip Side A Room (Correlated) 0.03333333 0.03333333 0.03333333
Strip Side B Room (Correlated) 0.03333333 0.03333333 0.03333333
Wait Time Per Entity Maximum Minimum Average Half Width
24 Hour Eval by MD Section 12
(Insufficient) 0 0.1815 0.01023586
Bedside registration side A (Insufficient) 0 0 0
Call Admitting MD (Insufficient) 0 0 0
Clean Side A Room 0.007034592 0 0.4091 0.03795311
Clean Side B Room (Correlated) 0 0.3658 0.03040358
Infrared input by secretary (Insufficient) 0 0 0
MD to MD talk (Insufficient) 0 0.5993 0.01974987
Nurse helps patient leave 0.000000000 0 0 0
RN RN discussion (Insufficient) 0 0.2579 0.02522080
RN tests and Labs A 0.000000000 0 0 0
Second MD Exam on B Side (Insufficient) 0 0.1722 0.01087736
Second Physician Examination
0.005479448 0 0.7554 0.01659503
Strip Side A Room 0.000066117 0 0.01918685 0.00003171
Strip Side B Room 0.000000000 0 0 0
Tests and Labs on Side B 0.000000000 0 0 0
Model Filename: Page of 41 112 R:\MQP\Model 12-11-10

139
Category by Replication
12:50:58PM December 14, 2010
Unnamed Project 3 Replications:
Replication 2 Time Units: Start Time: Stop Time: 240.00 720.00 Hours
Process
Time per Entity
Total Time Per Entity Maximum Minimum Average Half Width
24 Hour Eval by Lipton
Section 12 (Insufficient) 0.2516 0.9444 0.5002
24 Hour Eval by MD Section 12
(Insufficient) 0.2520 0.9791 0.5213
Bedside registration side A (Insufficient) 0.04214520 0.1506 0.0980
Call Admitting MD (Insufficient) 0.01835304 0.04834093 0.03382827
Clean Side A Room 0.007034592 0.1667 0.5758 0.2046
Clean Side B Room (Correlated) 0.1667 0.5325 0.1971
CT Scan (Insufficient) 0.1721 0.3201 0.2498
Discharge Notes B side 0.000940929 0.03450979 0.08257766 0.05829210
Infrared input by secretary (Insufficient) 0.01681836 0.04766540 0.03340486
MD Exam on Side B 0.002450824 0.1379 0.2446 0.1898
MD to MD talk (Insufficient) 0.03501825 0.6810 0.07791495
MRI (Insufficient) 0.1717 0.3206 0.2467
Nurse Does Discharge (Correlated) 0.1667 0.1667 0.1667
Nurse helps patient leave 0.001105534 0.03519600 0.08235046 0.05567554
Physician Examination A 0.001810825 0.1338 0.2487 0.1924
Pull IV 0.000659111 0.01764118 0.04941625 0.03334048
Registration and Insurance 0.001745669 0.03524996 0.1632 0.1002
RN RN discussion (Insufficient) 0.06228584 0.3727 0.1439
RN tests and Labs A 0.001087524 0.1677 0.2481 0.2078
Second MD Exam on B Side (Insufficient) 0.03667968 0.2445 0.07002774
Second Physician Examination
0.005586693 0.03514187 0.8216 0.07436350
Strip Side A Room 0.000066117 0.03333333 0.05252019 0.03336505
Strip Side B Room (Correlated) 0.03333333 0.03333333 0.03333333
Tests and Labs on Side B (Correlated) 0.1712 0.2491 0.2098
Triage Area 0.000802990 0.08382497 0.1653 0.1247
Model Filename: Page of 42 112 R:\MQP\Model 12-11-10

140
Category by Replication
12:50:58PM December 14, 2010
Unnamed Project 3 Replications:
Replication 2 Time Units: Start Time: Stop Time: 240.00 720.00 Hours
Process
Time per Entity
Total Time Per Entity Maximum Minimum Average Half Width
Xrays (Insufficient) 0.1714 0.2495 0.2077
Xrays Bedside (Insufficient) 0.1732 0.2376 0.2092
Accumulated Time
Model Filename: Page of 43 112 R:\MQP\Model 12-11-10

141
Category by Replication
12:50:58PM December 14, 2010
Unnamed Project 3 Replications:
Replication 2 Time Units: Start Time: Stop Time: 240.00 720.00 Hours
Process
Accumulated Time
Accum VA Time Value
24 Hour Eval by Lipton
Section 12 59.0209
24 Hour Eval by MD Section 12
60.3066
Bedside registration MH 0
Bedside registration side A 11.8574
Call Admitting MD 5.3787
Clerk calls for Lipton 0
CT Scan 43.2142
Discharge Notes B side 25.8817
ED Infrared input by secretary
0
ED MD Admitting MD talk 0
EKG for patient 0
Hook up to telemetry and blood pressure
0
Infrared input by secretary 5.3448
MD Exam on Side B 96.0203
MD to MD talk 9.2482
Medical Clearance 0
MRI 35.0267
Nurse Does Discharge 74.1667
Nurse fills out Mental Health papers
0
Nurse fills out MH papers 0
Nurse helps patient leave 28.1161
Nurse Nurse discussion 0
Patient put in room and changed into HA attire
0
Model Filename: Page of 44 112 R:\MQP\Model 12-11-10

142
Category by Replication
12:50:58PM December 14, 2010
Unnamed Project 3 Replications:
Replication 2 Time Units: Start Time: Stop Time: 240.00 720.00 Hours
Process
Accumulated Time
Accum VA Time Value
Patient put in room and clothes changed
0
Physician Examination A 115.80
Pull IV 14.8032
Registration and Insurance 123.40
Remove Clothes and insert catheter
0
RN RN discussion 18.9867
RN tests and Labs A 125.31
RN tests and Labs Critical 0
Second MD Exam on B Side 6.3882
Second Physician Examination
34.8344
Sitter and Nurse review paperwork
0
Sitter and Nurse review paperwork during registration
0
Tests and Labs on Side B 106.15
Triage Area 203.46
Xrays 41.5416
Xrays Bedside 6.9021
Model Filename: Page of 45 112 R:\MQP\Model 12-11-10

143
Category by Replication
12:50:58PM December 14, 2010
Unnamed Project 3 Replications:
Replication 2 Time Units: Start Time: Stop Time: 240.00 720.00 Hours
Process
Accumulated Time
Accum NVA Time Value
Clean MH Room 0
Clean Side A Room 100.67
Clean Side B Room 84.1667
Clean Trauma Room 0
Clerk Call Admitting MD 0
Lipton Assessment 0
Strip MH Room 0
Strip Side A Room 20.1667
Strip Side B Room 16.8333
Strip Trauma Room 0
Trauma Patient gets bed 0
Model Filename: Page of 46 112 R:\MQP\Model 12-11-10
144
Category by Replication
12:50:58PM December 14, 2010
Unnamed Project 3 Replications:
Replication 2 Time Units: Start Time: Stop Time: 240.00 720.00 Hours
Process
Accumulated Time
Accum Wait Time Value
24 Hour Eval by MD Section
12 1.2078
Bedside registration MH 0
Bedside registration side A 0
Call Admitting MD 0
Clean MH Room 0
Clean Side A Room 22.9237
Clean Side B Room 15.3538
Clean Trauma Room 0
Clerk Call Admitting MD 0
Clerk calls for Lipton 0
ED Infrared input by secretary
0
ED MD Admitting MD talk 0
Infrared input by secretary 0
MD to MD talk 3.1402
Medical Clearance 0
Nurse fills out MH papers 0
Nurse helps patient leave 0
Nurse Nurse discussion 0
RN RN discussion 4.0353
RN tests and Labs A 0
Second MD Exam on B Side 1.1748
Second Physician Examination
10.0068
Strip MH Room 0
Strip Side A Room 0.01918685
Strip Side B Room 0
Model Filename: Page of 47 112 R:\MQP\Model 12-11-10

145
Category by Replication
12:50:58PM December 14, 2010
Unnamed Project 3 Replications:
Replication 2 Time Units: Start Time: Stop Time: 240.00 720.00 Hours
Process
Accumulated Time
Accum Wait Time Value
Strip Trauma Room 0
Tests and Labs on Side B 0
Other
Model Filename: Page of 48 112 R:\MQP\Model 12-11-10

146
Category by Replication
12:50:58PM December 14, 2010
Unnamed Project 3 Replications:
Replication 2 Time Units: Start Time: Stop Time: 240.00 720.00 Hours
Process
Other
Number In Value
24 Hour Eval by Lipton
Section 12 118
24 Hour Eval by MD Section 12
118
Bedside registration MH 0
Bedside registration side A 121
Call Admitting MD 159
Clean MH Room 0
Clean Side A Room 605
Clean Side B Room 505
Clean Trauma Room 0
Clerk Call Admitting MD 0
Clerk calls for Lipton 0
CT Scan 173
Discharge Notes B side 444
ED Infrared input by secretary
0
ED MD Admitting MD talk 0
EKG for patient 0
Hook up to telemetry and blood pressure
0
Infrared input by secretary 160
Lipton Assessment 0
MD Exam on Side B 506
MD to MD talk 159
Medical Clearance 0
MRI 142
Nurse Does Discharge 444
Model Filename: Page of 49 112 R:\MQP\Model 12-11-10

147
Category by Replication
12:50:58PM December 14, 2010
Unnamed Project 3 Replications:
Replication 2 Time Units: Start Time: Stop Time: 240.00 720.00 Hours
Process
Other
Number In Value
Nurse fills out Mental Health papers
0
Nurse fills out MH papers 0
Nurse helps patient leave 505
Nurse Nurse discussion 0
Patient put in room and changed into HA attire
0
Patient put in room and clothes changed
0
Physician Examination A 603
Pull IV 444
Registration and Insurance 1,230
Remove Clothes and insert catheter
0
RN RN discussion 160
RN tests and Labs A 604
RN tests and Labs Critical 0
Second MD Exam on B Side 108
Second Physician Examination
603
Sitter and Nurse review paperwork
0
Sitter and Nurse review paperwork during registration
0
Strip MH Room 0
Strip Side A Room 605
Strip Side B Room 505
Strip Trauma Room 0
Tests and Labs on Side B 506
Model Filename: Page of 50 112 R:\MQP\Model 12-11-10

148
Category by Replication
12:50:58PM December 14, 2010
Unnamed Project 3 Replications:
Replication 2 Time Units: Start Time: Stop Time: 240.00 720.00 Hours
Process
Other
Number In Value
Trauma Patient gets bed 0
Triage Area 1,631
Xrays 200
Xrays Bedside 33
Model Filename: Page of 51 112 R:\MQP\Model 12-11-10

149
Category by Replication
12:50:58PM December 14, 2010
Unnamed Project 3 Replications:
Replication 2 Time Units: Start Time: Stop Time: 240.00 720.00 Hours
Process
Other
Number Out Value
24 Hour Eval by Lipton
Section 12 118
24 Hour Eval by MD Section 12
118
Bedside registration MH 0
Bedside registration side A 121
Call Admitting MD 159
Clean MH Room 0
Clean Side A Room 604
Clean Side B Room 505
Clean Trauma Room 0
Clerk Call Admitting MD 0
Clerk calls for Lipton 0
CT Scan 173
Discharge Notes B side 444
ED Infrared input by secretary
0
ED MD Admitting MD talk 0
EKG for patient 0
Hook up to telemetry and blood pressure
0
Infrared input by secretary 160
Lipton Assessment 0
MD Exam on Side B 506
MD to MD talk 159
Medical Clearance 0
MRI 142
Nurse Does Discharge 445
Model Filename: Page of 52 112 R:\MQP\Model 12-11-10

150
Category by Replication
12:50:58PM December 14, 2010
Unnamed Project 3 Replications:
Replication 2 Time Units: Start Time: Stop Time: 240.00 720.00 Hours
Process
Other
Number Out Value
Nurse fills out Mental Health papers
0
Nurse fills out MH papers 0
Nurse helps patient leave 505
Nurse Nurse discussion 0
Patient put in room and changed into HA attire
0
Patient put in room and clothes changed
0
Physician Examination A 602
Pull IV 444
Registration and Insurance 1,231
Remove Clothes and insert catheter
0
RN RN discussion 160
RN tests and Labs A 603
RN tests and Labs Critical 0
Second MD Exam on B Side 108
Second Physician Examination
603
Sitter and Nurse review paperwork
0
Sitter and Nurse review paperwork during registration
0
Strip MH Room 0
Strip Side A Room 605
Strip Side B Room 505
Strip Trauma Room 0
Tests and Labs on Side B 506
Model Filename: Page of 53 112 R:\MQP\Model 12-11-10

151
Category by Replication
12:50:58PM December 14, 2010
Unnamed Project 3 Replications:
Replication 2 Time Units: Start Time: Stop Time: 240.00 720.00 Hours
Process
Other
Number Out Value
Trauma Patient gets bed 0
Triage Area 1,631
Xrays 200
Xrays Bedside 33
Queue
Time
Model Filename: Page of 54 112 R:\MQP\Model 12-11-10
152
Category by Replication
12:50:58PM December 14, 2010
Unnamed Project 3 Replications:
Replication 2 Time Units: Start Time: Stop Time: 240.00 720.00 Hours
Queue
Time
Waiting Time Maximum Minimum Average Half Width
24 Hour Eval by MD Section
12.Queue (Insufficient) 0 0.1815 0.01023586
Batch 5.Queue (Insufficient) 0 0.1083 0.02151111
Batch 6.Queue (Insufficient) 0 0.6556 0.1123
Bedside registration side A.Queue
(Insufficient) 0 0 0
Call Admitting MD.Queue (Insufficient) 0 0 0
Call for Transport.Queue (Insufficient) 0 0 0
Call Radiology B side.Queue (Insufficient) 0 0 0
Call Radiology.Queue (Insufficient) 0 0 0
Clean Side A Room.Queue 0.007034592 0 0.4091 0.03789037
Clean Side B Room.Queue (Correlated) 0 0.3658 0.03040358
Get Nurse.Queue 0.000000000 0 0 0
Infrared input by secretary.Queue
(Insufficient) 0 0 0
MD to MD talk.Queue (Insufficient) 0 0.5993 0.01974987
Nurse helps patient leave.Queue
0.000000000 0 0 0
Radiologist to come to ED.Queue
(Insufficient) 0 0 0
RN RN discussion.Queue (Insufficient) 0 0.2579 0.02522080
RN tests and Labs A.Queue 0.000000000 0 0 0
Second MD Exam on B Side.Queue
(Insufficient) 0 0.1722 0.01087736
Second Physician Examination.Queue
0.005479448 0 0.7554 0.01659503
Seize CT Tech and Nurse.Queue
(Insufficient) 0 0 0
Seize MDfor Side B.Queue 0.000000000 0 0 0
Model Filename: Page of 55 112 R:\MQP\Model 12-11-10

153
Category by Replication
12:50:58PM December 14, 2010
Unnamed Project 3 Replications:
Replication 2 Time Units: Start Time: Stop Time: 240.00 720.00 Hours
Queue
Time
Waiting Time Maximum Minimum Average Half Width
Seize MRI tech and Nurse.Queue
(Insufficient) 0 0 0
Seize Physician A.Queue 0.000000000 0 0 0
Seize Registration and Insurance.Queue
0.000000000 0 0 0
Seize Side A Room and Transport Nurse.Queue
0.000000000 0 0 0
Seize Side B Room and Transport Nurse.Queue
0.000000000 0 0 0
Seize Triage Nurse.Queue 0.000000000 0 0 0
Strip Side A Room.Queue 0.000066117 0 0.01918685 0.00003171
Strip Side B Room.Queue 0.000000000 0 0 0
Tests and Labs on Side B.Queue
0.000000000 0 0 0
Other
Model Filename: Page of 56 112 R:\MQP\Model 12-11-10

154
Category by Replication
12:50:58PM December 14, 2010
Unnamed Project 3 Replications:
Replication 2 Time Units: Start Time: Stop Time: 240.00 720.00 Hours
Queue
Other
Number Waiting Maximum Minimum Average Half Width
24 Hour Eval by MD Section
12.Queue (Insufficient) 0 1.0000 0.00251632
Arrange for Sitter.Queue (Insufficient) 0 0 0
Batch 11.Queue (Insufficient) 0 0 0
Batch 4.Queue (Insufficient) 0 0 0
Batch 5.Queue (Insufficient) 0 2.0000 0.01084519
Batch 6.Queue (Insufficient) 0 3.0000 0.05521628
Batch 7.Queue (Insufficient) 6.0000 6.0000 6.0000
Bedside registration MH.Queue
(Insufficient) 0 0 0
Bedside registration side A.Queue
(Insufficient) 0 0 0
Call Admitting MD.Queue (Insufficient) 0 0 0
Call for ED Transport.Queue (Insufficient) 0 0 0
Call for Transport.Queue (Insufficient) 0 0 0
Call Radiology B side.Queue (Insufficient) 0 0 0
Call Radiology.Queue (Insufficient) 0 0 0
Call transport for Trauma.Queue
(Insufficient) 0 0 0
Call transport to Helicopter.Queue
(Insufficient) 0 0 0
Clean MH Room.Queue (Insufficient) 0 0 0
Clean Side A Room.Queue 0.009753180 0 3.0000 0.04775766
Clean Side B Room.Queue (Insufficient) 0 2.0000 0.03198710
Clean Trauma Room.Queue (Insufficient) 0 0 0
Clerk Call Admitting MD.Queue
(Insufficient) 0 0 0
Clerk calls for Lipton.Queue (Insufficient) 0 0 0
Model Filename: Page of 57 112 R:\MQP\Model 12-11-10

155
Category by Replication
12:50:58PM December 14, 2010
Unnamed Project 3 Replications:
Replication 2 Time Units: Start Time: Stop Time: 240.00 720.00 Hours
Queue
Other
Number Waiting Maximum Minimum Average Half Width
ED Infrared input by
secretary.Queue (Insufficient) 0 0 0
ED MD Admitting MD talk.Queue
(Insufficient) 0 0 0
Get Nurse.Queue (Insufficient) 0 0 0
Infrared input by secretary.Queue
(Insufficient) 0 0 0
MD to MD talk.Queue (Insufficient) 0 1.0000 0.00654214
Medical Clearance.Queue (Insufficient) 0 0 0
Nurse fills out MH papers.Queue
(Insufficient) 0 0 0
Nurse helps patient leave.Queue
(Insufficient) 0 0 0
Nurse Nurse discussion.Queue
(Insufficient) 0 0 0
Radiologist to come to ED.Queue
(Insufficient) 0 0 0
RN RN discussion.Queue (Insufficient) 0 1.0000 0.00840693
RN tests and Labs A.Queue (Insufficient) 0 0 0
Second MD Exam on B Side.Queue
(Insufficient) 0 1.0000 0.00244741
Second Physician Examination.Queue
(Insufficient) 0 1.0000 0.02084751
Seize CT Tech and Nurse.Queue
(Insufficient) 0 0 0
Seize EKG and Tech.Queue (Correlated) 148.00 549.00 349.41
Seize EKG.Queue (Insufficient) 0 0 0
Seize MDfor Side B.Queue (Insufficient) 0 0 0
Seize Mental Health nurse.Queue
(Insufficient) 0 0 0
Seize Mental Health Room and Nurse.Queue
(Insufficient) 48.0000 169.00 106.11
Model Filename: Page of 58 112 R:\MQP\Model 12-11-10
156
Category by Replication
12:50:58PM December 14, 2010
Unnamed Project 3 Replications:
Replication 2 Time Units: Start Time: Stop Time: 240.00 720.00 Hours
Queue
Other
Number Waiting Maximum Minimum Average Half Width
Seize MRI tech and
Nurse.Queue (Insufficient) 0 0 0
Seize Physician A.Queue (Insufficient) 0 0 0
Seize Registration and Insurance.Queue
(Insufficient) 0 0 0
Seize Room for Mental Health.Queue
(Insufficient) 15.0000 64.0000 38.4497
Seize Room.Queue (Insufficient) 0 0 0
Seize Side A Room and Transport Nurse.Queue
(Insufficient) 0 0 0
Seize Side B Room and Transport Nurse.Queue
(Insufficient) 0 0 0
Seize Trauma Bed.Queue (Insufficient) 92.0000 332.00 207.24
Seize Triage Nurse.Queue (Insufficient) 0 0 0
Strip MH Room.Queue (Insufficient) 0 0 0
Strip Side A Room.Queue (Insufficient) 0 1.0000 0.00003997
Strip Side B Room.Queue (Insufficient) 0 0 0
Strip Trauma Room.Queue (Insufficient) 0 0 0
Tests and Labs on Side B.Queue
(Insufficient) 0 0 0
Triage.Queue (Insufficient) 0 0 0
Resource
Usage
Model Filename: Page of 59 112 R:\MQP\Model 12-11-10

157
Category by Replication
12:50:58PM December 14, 2010
Unnamed Project 3 Replications:
Replication 2 Time Units: Start Time: Stop Time: 240.00 720.00 Hours
Resource
Usage
Instantaneous Utilization Maximum Minimum Average Half Width
Bed 1 (Insufficient) 0 0 0
Bed 10 (Insufficient) 0 1.0000 0.1910
Bed 11 (Insufficient) 0 1.0000 0.1782
Bed 12 (Insufficient) 0 1.0000 0.1824
Bed 13 (Insufficient) 0 1.0000 0.1842
Bed 14 (Insufficient) 1.0000 1.0000 1.0000
Bed 15 (Insufficient) 1.0000 1.0000 1.0000
Bed 16 (Insufficient) 1.0000 1.0000 1.0000
Bed 17 (Insufficient) 1.0000 1.0000 1.0000
Bed 18 (Insufficient) 1.0000 1.0000 1.0000
Bed 2 (Insufficient) 0 0 0
Bed 20 (Insufficient) 0 1.0000 0.1495
Bed 21 (Insufficient) 0 1.0000 0.1434
Bed 22 (Insufficient) 0 1.0000 0.1452
Bed 23 (Insufficient) 0 1.0000 0.1449
Bed 24 (Insufficient) 0 1.0000 0.1435
Bed 25 (Insufficient) 0 1.0000 0.1440
Bed 3 (Insufficient) 0 0 0
Bed 4 (Insufficient) 0 1.0000 0.1778
Bed 5 (Insufficient) 0 1.0000 0.1826
Bed 6 (Insufficient) 0 1.0000 0.1848
Bed 7 (Insufficient) 0 1.0000 0.1866
Bed 8 (Insufficient) 0 1.0000 0.1861
Bed 9 (Insufficient) 0 1.0000 0.1780
Charge Nurse (Insufficient) 1.0000 1.0000 1.0000
Cleaning Staff 0.014551618 0 1.0000 0.3852
Clerk 1 (Insufficient) 0 1.0000 0.01099780
Model Filename: Page of 60 112 R:\MQP\Model 12-11-10
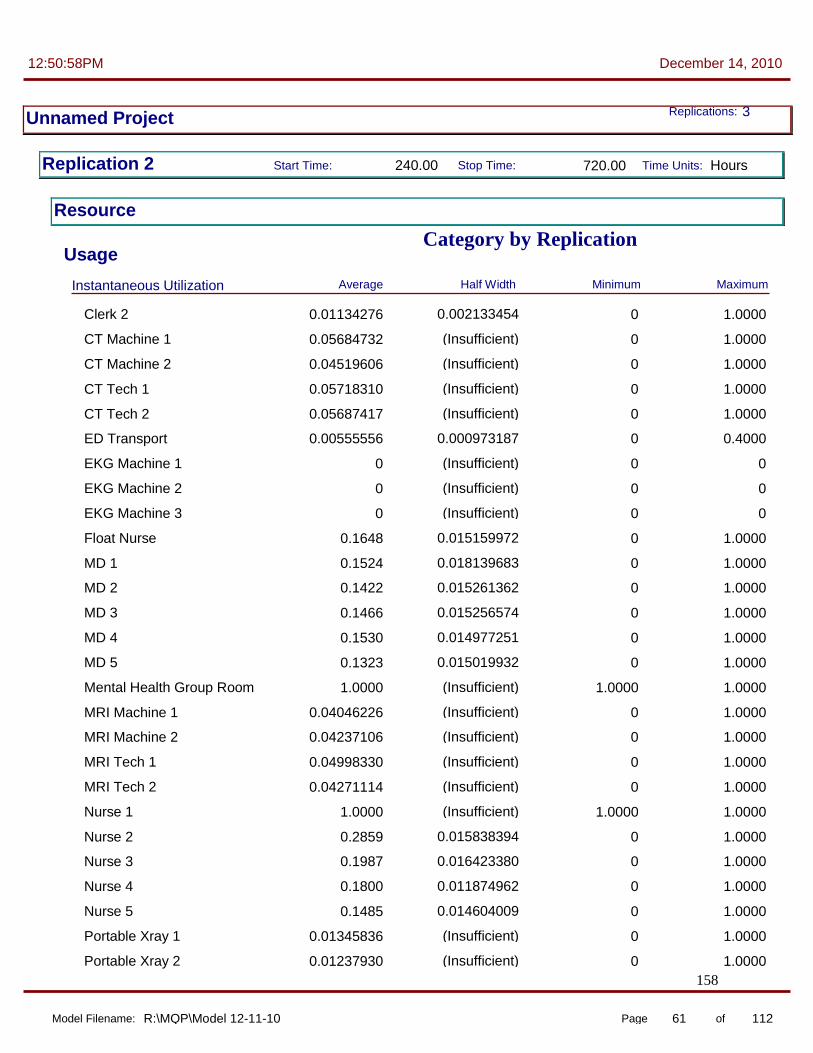
158
Category by Replication
12:50:58PM December 14, 2010
Unnamed Project 3 Replications:
Replication 2 Time Units: Start Time: Stop Time: 240.00 720.00 Hours
Resource
Usage
Instantaneous Utilization Maximum Minimum Average Half Width
Clerk 2 0.002133454 0 1.0000 0.01134276
CT Machine 1 (Insufficient) 0 1.0000 0.05684732
CT Machine 2 (Insufficient) 0 1.0000 0.04519606
CT Tech 1 (Insufficient) 0 1.0000 0.05718310
CT Tech 2 (Insufficient) 0 1.0000 0.05687417
ED Transport 0.000973187 0 0.4000 0.00555556
EKG Machine 1 (Insufficient) 0 0 0
EKG Machine 2 (Insufficient) 0 0 0
EKG Machine 3 (Insufficient) 0 0 0
Float Nurse 0.015159972 0 1.0000 0.1648
MD 1 0.018139683 0 1.0000 0.1524
MD 2 0.015261362 0 1.0000 0.1422
MD 3 0.015256574 0 1.0000 0.1466
MD 4 0.014977251 0 1.0000 0.1530
MD 5 0.015019932 0 1.0000 0.1323
Mental Health Group Room (Insufficient) 1.0000 1.0000 1.0000
MRI Machine 1 (Insufficient) 0 1.0000 0.04046226
MRI Machine 2 (Insufficient) 0 1.0000 0.04237106
MRI Tech 1 (Insufficient) 0 1.0000 0.04998330
MRI Tech 2 (Insufficient) 0 1.0000 0.04271114
Nurse 1 (Insufficient) 1.0000 1.0000 1.0000
Nurse 2 0.015838394 0 1.0000 0.2859
Nurse 3 0.016423380 0 1.0000 0.1987
Nurse 4 0.011874962 0 1.0000 0.1800
Nurse 5 0.014604009 0 1.0000 0.1485
Portable Xray 1 (Insufficient) 0 1.0000 0.01345836
Portable Xray 2 (Insufficient) 0 1.0000 0.01237930
Model Filename: Page of 61 112 R:\MQP\Model 12-11-10

159
Category by Replication
12:50:58PM December 14, 2010
Unnamed Project 3 Replications:
Replication 2 Time Units: Start Time: Stop Time: 240.00 720.00 Hours
Resource
Usage
Instantaneous Utilization Maximum Minimum Average Half Width
Radiologist (Insufficient) 0 0 0
Registration 1 0.007568156 0 1.0000 0.1423
Registration 2 0.011877811 0 1.0000 0.1394
Sitter 1 (Insufficient) 1.0000 1.0000 1.0000
Sitter 2 (Insufficient) 1.0000 1.0000 1.0000
Tech 1 (Insufficient) 1.0000 1.0000 1.0000
Tech 2 (Insufficient) 1.0000 1.0000 1.0000
Tech 3 (Insufficient) 1.0000 1.0000 1.0000
Triage Nurse 0.010038983 0 1.0000 0.4380
Xray Machine 1 (Insufficient) 0 1.0000 0.02333379
Xray Machine 2 (Insufficient) 0 1.0000 0.03098019
Xray Machine 3 (Insufficient) 0 1.0000 0.02564011
Xray Machine 4 (Insufficient) 0 1.0000 0.02088037
Xray Tech 1 (Insufficient) 0 1.0000 0.02005758
Xray Tech 2 (Insufficient) 0 1.0000 0.03052489
Xray Tech 3 (Insufficient) 0 1.0000 0.02687815
Xray Tech 4 (Insufficient) 0 1.0000 0.02886020
Xray Tech 5 (Insufficient) 0 1.0000 0.01433101
Xray Tech 6 (Insufficient) 0 1.0000 0.01990919
Model Filename: Page of 62 112 R:\MQP\Model 12-11-10

160
Category by Replication
12:50:58PM December 14, 2010
Unnamed Project 3 Replications:
Replication 2 Time Units: Start Time: Stop Time: 240.00 720.00 Hours
Resource
Usage
Number Busy Maximum Minimum Average Half Width
Bed 1 (Insufficient) 0 0 0
Bed 10 (Insufficient) 0 1.0000 0.1910
Bed 11 (Insufficient) 0 1.0000 0.1782
Bed 12 (Insufficient) 0 1.0000 0.1824
Bed 13 (Insufficient) 0 1.0000 0.1842
Bed 14 (Insufficient) 1.0000 1.0000 1.0000
Bed 15 (Insufficient) 1.0000 1.0000 1.0000
Bed 16 (Insufficient) 1.0000 1.0000 1.0000
Bed 17 (Insufficient) 1.0000 1.0000 1.0000
Bed 18 (Insufficient) 1.0000 1.0000 1.0000
Bed 2 (Insufficient) 0 0 0
Bed 20 (Insufficient) 0 1.0000 0.1495
Bed 21 (Insufficient) 0 1.0000 0.1434
Bed 22 (Insufficient) 0 1.0000 0.1452
Bed 23 (Insufficient) 0 1.0000 0.1449
Bed 24 (Insufficient) 0 1.0000 0.1435
Bed 25 (Insufficient) 0 1.0000 0.1440
Bed 3 (Insufficient) 0 0 0
Bed 4 (Insufficient) 0 1.0000 0.1778
Bed 5 (Insufficient) 0 1.0000 0.1826
Bed 6 (Insufficient) 0 1.0000 0.1848
Bed 7 (Insufficient) 0 1.0000 0.1866
Bed 8 (Insufficient) 0 1.0000 0.1861
Bed 9 (Insufficient) 0 1.0000 0.1780
Charge Nurse (Insufficient) 1.0000 1.0000 1.0000
Cleaning Staff 0.014551618 0 1.0000 0.3852
Clerk 1 (Insufficient) 0 1.0000 0.01099780
Model Filename: Page of 63 112 R:\MQP\Model 12-11-10

161
Category by Replication
12:50:58PM December 14, 2010
Unnamed Project 3 Replications:
Replication 2 Time Units: Start Time: Stop Time: 240.00 720.00 Hours
Resource
Usage
Number Busy Maximum Minimum Average Half Width
Clerk 2 0.002133454 0 1.0000 0.01134276
CT Machine 1 (Insufficient) 0 1.0000 0.05684732
CT Machine 2 (Insufficient) 0 1.0000 0.04519606
CT Tech 1 (Insufficient) 0 1.0000 0.05718310
CT Tech 2 (Insufficient) 0 1.0000 0.05687417
ED Transport 0.004865934 0 2.0000 0.02777778
EKG Machine 1 (Insufficient) 0 0 0
EKG Machine 2 (Insufficient) 0 0 0
EKG Machine 3 (Insufficient) 0 0 0
Float Nurse 0.015159972 0 1.0000 0.1648
MD 1 0.018139683 0 1.0000 0.1524
MD 2 0.015261362 0 1.0000 0.1422
MD 3 0.015256574 0 1.0000 0.1466
MD 4 0.014977251 0 1.0000 0.1530
MD 5 0.015019932 0 1.0000 0.1323
Mental Health Group Room (Insufficient) 1.0000 1.0000 1.0000
MRI Machine 1 (Insufficient) 0 1.0000 0.04046226
MRI Machine 2 (Insufficient) 0 1.0000 0.04237106
MRI Tech 1 (Insufficient) 0 1.0000 0.04998330
MRI Tech 2 (Insufficient) 0 1.0000 0.04271114
Nurse 1 (Insufficient) 1.0000 1.0000 1.0000
Nurse 2 0.015838394 0 1.0000 0.2859
Nurse 3 0.016423380 0 1.0000 0.1987
Nurse 4 0.011874962 0 1.0000 0.1800
Nurse 5 0.014604009 0 1.0000 0.1485
Portable Xray 1 (Insufficient) 0 1.0000 0.01345836
Portable Xray 2 (Insufficient) 0 1.0000 0.01237930
Model Filename: Page of 64 112 R:\MQP\Model 12-11-10

162
Category by Replication
12:50:58PM December 14, 2010
Unnamed Project 3 Replications:
Replication 2 Time Units: Start Time: Stop Time: 240.00 720.00 Hours
Resource
Usage
Number Busy Maximum Minimum Average Half Width
Radiologist (Insufficient) 0 0 0
Registration 1 0.007568156 0 1.0000 0.1423
Registration 2 0.011877811 0 1.0000 0.1394
Sitter 1 (Insufficient) 1.0000 1.0000 1.0000
Sitter 2 (Insufficient) 1.0000 1.0000 1.0000
Tech 1 (Insufficient) 1.0000 1.0000 1.0000
Tech 2 (Insufficient) 1.0000 1.0000 1.0000
Tech 3 (Insufficient) 1.0000 1.0000 1.0000
Triage Nurse 0.010038983 0 1.0000 0.4380
Xray Machine 1 (Insufficient) 0 1.0000 0.02333379
Xray Machine 2 (Insufficient) 0 1.0000 0.03098019
Xray Machine 3 (Insufficient) 0 1.0000 0.02564011
Xray Machine 4 (Insufficient) 0 1.0000 0.02088037
Xray Tech 1 (Insufficient) 0 1.0000 0.02005758
Xray Tech 2 (Insufficient) 0 1.0000 0.03052489
Xray Tech 3 (Insufficient) 0 1.0000 0.02687815
Xray Tech 4 (Insufficient) 0 1.0000 0.02886020
Xray Tech 5 (Insufficient) 0 1.0000 0.01433101
Xray Tech 6 (Insufficient) 0 1.0000 0.01990919
Model Filename: Page of 65 112 R:\MQP\Model 12-11-10

163
Category by Replication
12:50:58PM December 14, 2010
Unnamed Project 3 Replications:
Replication 2 Time Units: Start Time: Stop Time: 240.00 720.00 Hours
Resource
Usage
Number Scheduled Maximum Minimum Average Half Width
Bed 1 (Insufficient) 1.0000 1.0000 1.0000
Bed 10 (Insufficient) 1.0000 1.0000 1.0000
Bed 11 (Insufficient) 1.0000 1.0000 1.0000
Bed 12 (Insufficient) 1.0000 1.0000 1.0000
Bed 13 (Insufficient) 1.0000 1.0000 1.0000
Bed 14 (Insufficient) 1.0000 1.0000 1.0000
Bed 15 (Insufficient) 1.0000 1.0000 1.0000
Bed 16 (Insufficient) 1.0000 1.0000 1.0000
Bed 17 (Insufficient) 1.0000 1.0000 1.0000
Bed 18 (Insufficient) 1.0000 1.0000 1.0000
Bed 2 (Insufficient) 1.0000 1.0000 1.0000
Bed 20 (Insufficient) 1.0000 1.0000 1.0000
Bed 21 (Insufficient) 1.0000 1.0000 1.0000
Bed 22 (Insufficient) 1.0000 1.0000 1.0000
Bed 23 (Insufficient) 1.0000 1.0000 1.0000
Bed 24 (Insufficient) 1.0000 1.0000 1.0000
Bed 25 (Insufficient) 1.0000 1.0000 1.0000
Bed 3 (Insufficient) 1.0000 1.0000 1.0000
Bed 4 (Insufficient) 1.0000 1.0000 1.0000
Bed 5 (Insufficient) 1.0000 1.0000 1.0000
Bed 6 (Insufficient) 1.0000 1.0000 1.0000
Bed 7 (Insufficient) 1.0000 1.0000 1.0000
Bed 8 (Insufficient) 1.0000 1.0000 1.0000
Bed 9 (Insufficient) 1.0000 1.0000 1.0000
Charge Nurse (Insufficient) 1.0000 1.0000 1.0000
Cleaning Staff (Insufficient) 1.0000 1.0000 1.0000
Clerk 1 (Insufficient) 1.0000 1.0000 1.0000
Model Filename: Page of 66 112 R:\MQP\Model 12-11-10
164
Category by Replication
12:50:58PM December 14, 2010
Unnamed Project 3 Replications:
Replication 2 Time Units: Start Time: Stop Time: 240.00 720.00 Hours
Resource
Usage
Number Scheduled Maximum Minimum Average Half Width
Clerk 2 (Insufficient) 1.0000 1.0000 1.0000
CT Machine 1 (Insufficient) 1.0000 1.0000 1.0000
CT Machine 2 (Insufficient) 1.0000 1.0000 1.0000
CT Tech 1 (Insufficient) 1.0000 1.0000 1.0000
CT Tech 2 (Insufficient) 1.0000 1.0000 1.0000
ED Transport (Insufficient) 5.0000 5.0000 5.0000
EKG Machine 1 (Insufficient) 1.0000 1.0000 1.0000
EKG Machine 2 (Insufficient) 1.0000 1.0000 1.0000
EKG Machine 3 (Insufficient) 1.0000 1.0000 1.0000
Float Nurse (Insufficient) 1.0000 1.0000 1.0000
MD 1 (Insufficient) 1.0000 1.0000 1.0000
MD 2 (Insufficient) 1.0000 1.0000 1.0000
MD 3 (Insufficient) 1.0000 1.0000 1.0000
MD 4 (Insufficient) 1.0000 1.0000 1.0000
MD 5 (Insufficient) 1.0000 1.0000 1.0000
Mental Health Group Room (Insufficient) 1.0000 1.0000 1.0000
MRI Machine 1 (Insufficient) 1.0000 1.0000 1.0000
MRI Machine 2 (Insufficient) 1.0000 1.0000 1.0000
MRI Tech 1 (Insufficient) 1.0000 1.0000 1.0000
MRI Tech 2 (Insufficient) 1.0000 1.0000 1.0000
Nurse 1 (Insufficient) 1.0000 1.0000 1.0000
Nurse 2 (Insufficient) 1.0000 1.0000 1.0000
Nurse 3 (Insufficient) 1.0000 1.0000 1.0000
Nurse 4 (Insufficient) 1.0000 1.0000 1.0000
Nurse 5 (Insufficient) 1.0000 1.0000 1.0000
Portable Xray 1 (Insufficient) 1.0000 1.0000 1.0000
Portable Xray 2 (Insufficient) 1.0000 1.0000 1.0000
Model Filename: Page of 67 112 R:\MQP\Model 12-11-10

165
Category by Replication
12:50:58PM December 14, 2010
Unnamed Project 3 Replications:
Replication 2 Time Units: Start Time: Stop Time: 240.00 720.00 Hours
Resource
Usage
Number Scheduled Maximum Minimum Average Half Width
Radiologist (Insufficient) 1.0000 1.0000 1.0000
Registration 1 (Insufficient) 1.0000 1.0000 1.0000
Registration 2 (Insufficient) 1.0000 1.0000 1.0000
Sitter 1 (Insufficient) 1.0000 1.0000 1.0000
Sitter 2 (Insufficient) 1.0000 1.0000 1.0000
Tech 1 (Insufficient) 1.0000 1.0000 1.0000
Tech 2 (Insufficient) 1.0000 1.0000 1.0000
Tech 3 (Insufficient) 1.0000 1.0000 1.0000
Triage Nurse (Insufficient) 1.0000 1.0000 1.0000
Xray Machine 1 (Insufficient) 1.0000 1.0000 1.0000
Xray Machine 2 (Insufficient) 1.0000 1.0000 1.0000
Xray Machine 3 (Insufficient) 1.0000 1.0000 1.0000
Xray Machine 4 (Insufficient) 1.0000 1.0000 1.0000
Xray Tech 1 (Insufficient) 1.0000 1.0000 1.0000
Xray Tech 2 (Insufficient) 1.0000 1.0000 1.0000
Xray Tech 3 (Insufficient) 1.0000 1.0000 1.0000
Xray Tech 4 (Insufficient) 1.0000 1.0000 1.0000
Xray Tech 5 (Insufficient) 1.0000 1.0000 1.0000
Xray Tech 6 (Insufficient) 1.0000 1.0000 1.0000
Model Filename: Page of 68 112 R:\MQP\Model 12-11-10

166
Category by Replication
12:50:58PM December 14, 2010
Unnamed Project 3 Replications:
Replication 2 Time Units: Start Time: Stop Time: 240.00 720.00 Hours
Resource
Usage
Scheduled Utilization Value
Bed 1 0
Bed 10 0.1910
Bed 11 0.1782
Bed 12 0.1824
Bed 13 0.1842
Bed 14 1.0000
Bed 15 1.0000
Bed 16 1.0000
Bed 17 1.0000
Bed 18 1.0000
Bed 2 0
Bed 20 0.1495
Bed 21 0.1434
Bed 22 0.1452
Bed 23 0.1449
Bed 24 0.1435
Bed 25 0.1440
Bed 3 0
Bed 4 0.1778
Bed 5 0.1826
Bed 6 0.1848
Bed 7 0.1866
Bed 8 0.1861
Bed 9 0.1780
Charge Nurse 1.0000
Cleaning Staff 0.3852
Clerk 1 0.01099780
Model Filename: Page of 69 112 R:\MQP\Model 12-11-10

167
Category by Replication
12:50:58PM December 14, 2010
Unnamed Project 3 Replications:
Replication 2 Time Units: Start Time: Stop Time: 240.00 720.00 Hours
Resource
Usage
Scheduled Utilization Value
Clerk 2 0.01134276
CT Machine 1 0.05684732
CT Machine 2 0.04519606
CT Tech 1 0.05718310
CT Tech 2 0.05687417
ED Transport 0.00555556
EKG Machine 1 0
EKG Machine 2 0
EKG Machine 3 0
Float Nurse 0.1648
MD 1 0.1524
MD 2 0.1422
MD 3 0.1466
MD 4 0.1530
MD 5 0.1323
Mental Health Group Room 1.0000
MRI Machine 1 0.04046226
MRI Machine 2 0.04237106
MRI Tech 1 0.04998330
MRI Tech 2 0.04271114
Nurse 1 1.0000
Nurse 2 0.2859
Nurse 3 0.1987
Nurse 4 0.1800
Nurse 5 0.1485
Portable Xray 1 0.01345836
Portable Xray 2 0.01237930
Model Filename: Page of 70 112 R:\MQP\Model 12-11-10
168
Category by Replication
12:50:58PM December 14, 2010
Unnamed Project 3 Replications:
Replication 2 Time Units: Start Time: Stop Time: 240.00 720.00 Hours
Resource
Usage
Scheduled Utilization Value
Radiologist 0
Registration 1 0.1423
Registration 2 0.1394
Sitter 1 1.0000
Sitter 2 1.0000
Tech 1 1.0000
Tech 2 1.0000
Tech 3 1.0000
Triage Nurse 0.4380
Xray Machine 1 0.02333379
Xray Machine 2 0.03098019
Xray Machine 3 0.02564011
Xray Machine 4 0.02088037
Xray Tech 1 0.02005758
Xray Tech 2 0.03052489
Xray Tech 3 0.02687815
Xray Tech 4 0.02886020
Xray Tech 5 0.01433101
Xray Tech 6 0.01990919
Model Filename: Page of 71 112 R:\MQP\Model 12-11-10
169
Category by Replication
12:50:58PM December 14, 2010
Unnamed Project 3 Replications:
Replication 2 Time Units: Start Time: Stop Time: 240.00 720.00 Hours
Resource
Usage
Total Number Seized Value
Bed 1 0
Bed 10 61.0000
Bed 11 61.0000
Bed 12 61.0000
Bed 13 60.0000
Bed 14 0
Bed 15 0
Bed 16 0
Bed 17 0
Bed 18 0
Bed 2 0
Bed 20 85.0000
Bed 21 84.0000
Bed 22 84.0000
Bed 23 84.0000
Bed 24 84.0000
Bed 25 85.0000
Bed 3 0
Bed 4 60.0000
Bed 5 60.0000
Bed 6 60.0000
Bed 7 60.0000
Bed 8 60.0000
Bed 9 61.0000
Charge Nurse 0
Cleaning Staff 1,110.00
Clerk 1 159.00
Model Filename: Page of 72 112 R:\MQP\Model 12-11-10

170
Category by Replication
12:50:58PM December 14, 2010
Unnamed Project 3 Replications:
Replication 2 Time Units: Start Time: Stop Time: 240.00 720.00 Hours
Resource
Usage
Total Number Seized Value
Clerk 2 160.00
CT Machine 1 95.0000
CT Machine 2 78.0000
CT Tech 1 88.0000
CT Tech 2 85.0000
ED Transport 160.00
EKG Machine 1 0
EKG Machine 2 0
EKG Machine 3 0
Float Nurse 1,489.00
MD 1 417.00
MD 2 419.00
MD 3 423.00
MD 4 455.00
MD 5 383.00
Mental Health Group Room 0
MRI Machine 1 70.0000
MRI Machine 2 72.0000
MRI Tech 1 76.0000
MRI Tech 2 66.0000
Nurse 1 0
Nurse 2 1,560.00
Nurse 3 846.00
Nurse 4 661.00
Nurse 5 590.00
Portable Xray 1 17.0000
Portable Xray 2 16.0000
Model Filename: Page of 73 112 R:\MQP\Model 12-11-10

171
Category by Replication
12:50:58PM December 14, 2010
Unnamed Project 3 Replications:
Replication 2 Time Units: Start Time: Stop Time: 240.00 720.00 Hours
Resource
Usage
Total Number Seized Value
Radiologist 0
Registration 1 681.00
Registration 2 670.00
Sitter 1 0
Sitter 2 0
Tech 1 0
Tech 2 0
Tech 3 0
Triage Nurse 1,631.00
Xray Machine 1 47.0000
Xray Machine 2 60.0000
Xray Machine 3 51.0000
Xray Machine 4 42.0000
Xray Tech 1 32.0000
Xray Tech 2 50.0000
Xray Tech 3 44.0000
Xray Tech 4 48.0000
Xray Tech 5 25.0000
Xray Tech 6 34.0000
System
Other
Number Out Value
System 6,059
User Specified
Model Filename: Page of 74 112 R:\MQP\Model 12-11-10
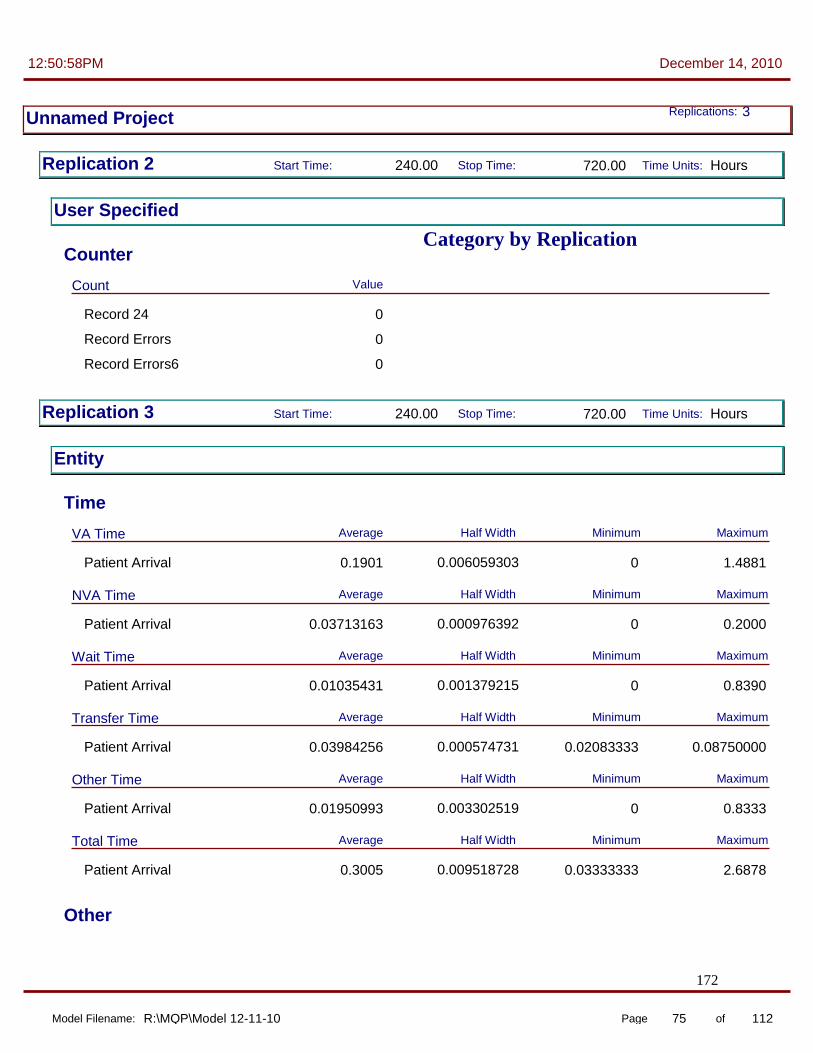
172
Category by Replication
12:50:58PM December 14, 2010
Unnamed Project 3 Replications:
Replication 2 Time Units: Start Time: Stop Time: 240.00 720.00 Hours
User Specified
Counter
Count Value
Record 24 0
Record Errors 0
Record Errors6 0
Replication 3 Time Units: Start Time: Stop Time: 240.00 720.00 Hours
Entity
Time
VA Time Maximum Minimum Average Half Width
Patient Arrival 0.006059303 0 1.4881 0.1901
NVA Time Maximum Minimum Average Half Width
Patient Arrival 0.000976392 0 0.2000 0.03713163
Wait Time Maximum Minimum Average Half Width
Patient Arrival 0.001379215 0 0.8390 0.01035431
Transfer Time Maximum Minimum Average Half Width
Patient Arrival 0.000574731 0.02083333 0.08750000 0.03984256
Other Time Maximum Minimum Average Half Width
Patient Arrival 0.003302519 0 0.8333 0.01950993
Total Time Maximum Minimum Average Half Width
Patient Arrival 0.009518728 0.03333333 2.6878 0.3005
Other
Model Filename: Page of 75 112 R:\MQP\Model 12-11-10

173
Category by Replication
12:50:58PM December 14, 2010
Unnamed Project 3 Replications:
Replication 3 Time Units: Start Time: Stop Time: 240.00 720.00 Hours
Entity
Other
Number In Value
Entity 1 0
Patient Arrival 5,497
Patient_Accuity_1 0
Number Out Value
Entity 1 0
Patient Arrival 4,518
Patient_Accuity_1 0
WIP Maximum Minimum Average Half Width
Entity 1 (Insufficient) 0 0 0
Patient Arrival (Correlated) 481.00 1,460.00 967.73
Patient_Accuity_1 (Insufficient) 0 0 0
Process
Time per Entity
Model Filename: Page of 76 112 R:\MQP\Model 12-11-10
174
Category by Replication
12:50:58PM December 14, 2010
Unnamed Project 3 Replications:
Replication 3 Time Units: Start Time: Stop Time: 240.00 720.00 Hours
Process
Time per Entity
VA Time Per Entity Maximum Minimum Average Half Width
24 Hour Eval by Lipton
Section 12 (Insufficient) 0.2576 0.9075 0.5102
24 Hour Eval by MD Section 12
(Insufficient) 0.2507 0.8950 0.4908
Bedside registration side A (Insufficient) 0.03770500 0.1625 0.0973
Call Admitting MD (Insufficient) 0.01680406 0.04888772 0.03374293
CT Scan (Insufficient) 0.1743 0.3283 0.2502
Discharge Notes B side 0.000927198 0.03498983 0.08252605 0.05800466
Infrared input by secretary (Insufficient) 0.01825692 0.04823786 0.03247891
MD Exam on Side B 0.002248343 0.1399 0.2477 0.1931
MD to MD talk (Insufficient) 0.03528432 0.07975888 0.05702135
MRI (Insufficient) 0.1716 0.3279 0.2511
Nurse Does Discharge (Correlated) 0.1667 0.1667 0.1667
Nurse helps patient leave 0.000785672 0.03555698 0.08207101 0.05710360
Physician Examination A 0.002210602 0.1352 0.2489 0.1913
Pull IV 0.000615257 0.01806756 0.04906817 0.03388650
Registration and Insurance 0.001704307 0.03451495 0.1631 0.0993
RN RN discussion (Insufficient) 0.05191687 0.1887 0.1244
RN tests and Labs A 0.001506399 0.1688 0.2475 0.2075
Second MD Exam on B Side (Insufficient) 0.03710070 0.08065546 0.05996091
Second Physician Examination
0.000849078 0.03461429 0.08257404 0.05810169
Tests and Labs on Side B 0.001579762 0.1696 0.2478 0.2079
Triage Area 0.000759539 0.08469343 0.1658 0.1245
Xrays (Insufficient) 0.1677 0.2442 0.2068
Xrays Bedside (Insufficient) 0.1789 0.2422 0.2080
Model Filename: Page of 77 112 R:\MQP\Model 12-11-10

175
Category by Replication
12:50:58PM December 14, 2010
Unnamed Project 3 Replications:
Replication 3 Time Units: Start Time: Stop Time: 240.00 720.00 Hours
Process
Time per Entity
NVA Time Per Entity Maximum Minimum Average Half Width
Clean Side A Room (Correlated) 0.1667 0.1667 0.1667
Clean Side B Room (Correlated) 0.1667 0.1667 0.1667
Strip Side A Room (Correlated) 0.03333333 0.03333333 0.03333333
Strip Side B Room (Correlated) 0.03333333 0.03333333 0.03333333
Wait Time Per Entity Maximum Minimum Average Half Width
24 Hour Eval by MD Section 12
(Insufficient) 0 0.1887 0.01163849
Bedside registration side A (Insufficient) 0 0 0
Call Admitting MD (Insufficient) 0 0 0
Clean Side A Room 0.005871489 0 0.4007 0.03616012
Clean Side B Room 0.008040035 0 0.3429 0.03193618
Infrared input by secretary (Insufficient) 0 0 0
MD to MD talk (Insufficient) 0 0.1674 0.01079497
Nurse helps patient leave 0.000000000 0 0 0
RN RN discussion (Insufficient) 0 0.2625 0.01226148
RN tests and Labs A 0.000000000 0 0 0
Second MD Exam on B Side (Insufficient) 0 0.7156 0.03032173
Second Physician Examination
0.005681969 0 0.8374 0.01551085
Strip Side A Room 0.000000000 0 0 0
Strip Side B Room 0.000000000 0 0 0
Tests and Labs on Side B 0.000000000 0 0 0
Model Filename: Page of 78 112 R:\MQP\Model 12-11-10

176
Category by Replication
12:50:58PM December 14, 2010
Unnamed Project 3 Replications:
Replication 3 Time Units: Start Time: Stop Time: 240.00 720.00 Hours
Process
Time per Entity
Total Time Per Entity Maximum Minimum Average Half Width
24 Hour Eval by Lipton
Section 12 (Insufficient) 0.2576 0.9075 0.5102
24 Hour Eval by MD Section 12
(Insufficient) 0.2593 0.8950 0.5024
Bedside registration side A (Insufficient) 0.03770500 0.1625 0.0973
Call Admitting MD (Insufficient) 0.01680406 0.04888772 0.03374293
Clean Side A Room 0.005871489 0.1667 0.5673 0.2028
Clean Side B Room 0.008040035 0.1667 0.5096 0.1986
CT Scan (Insufficient) 0.1743 0.3283 0.2502
Discharge Notes B side 0.000927198 0.03498983 0.08252605 0.05800466
Infrared input by secretary (Insufficient) 0.01825692 0.04823786 0.03247891
MD Exam on Side B 0.002248343 0.1399 0.2477 0.1931
MD to MD talk (Insufficient) 0.03528432 0.2226 0.06781631
MRI (Insufficient) 0.1716 0.3279 0.2511
Nurse Does Discharge (Correlated) 0.1667 0.1667 0.1667
Nurse helps patient leave 0.000785672 0.03555698 0.08207101 0.05710360
Physician Examination A 0.002210602 0.1352 0.2489 0.1913
Pull IV 0.000615257 0.01806756 0.04906817 0.03388650
Registration and Insurance 0.001704307 0.03451495 0.1631 0.0993
RN RN discussion (Insufficient) 0.05191687 0.3552 0.1366
RN tests and Labs A 0.001506399 0.1688 0.2475 0.2075
Second MD Exam on B Side (Insufficient) 0.03710070 0.7696 0.0903
Second Physician Examination
0.005655141 0.03461429 0.8751 0.07361254
Strip Side A Room (Correlated) 0.03333333 0.03333333 0.03333333
Strip Side B Room (Correlated) 0.03333333 0.03333333 0.03333333
Tests and Labs on Side B 0.001579762 0.1696 0.2478 0.2079
Triage Area 0.000759539 0.08469343 0.1658 0.1245
Model Filename: Page of 79 112 R:\MQP\Model 12-11-10
177
Category by Replication
12:50:58PM December 14, 2010
Unnamed Project 3 Replications:
Replication 3 Time Units: Start Time: Stop Time: 240.00 720.00 Hours
Process
Time per Entity
Total Time Per Entity Maximum Minimum Average Half Width
Xrays (Insufficient) 0.1677 0.2442 0.2068
Xrays Bedside (Insufficient) 0.1789 0.2422 0.2080
Accumulated Time
Model Filename: Page of 80 112 R:\MQP\Model 12-11-10

178
Category by Replication
12:50:58PM December 14, 2010
Unnamed Project 3 Replications:
Replication 3 Time Units: Start Time: Stop Time: 240.00 720.00 Hours
Process
Accumulated Time
Accum VA Time Value
24 Hour Eval by Lipton
Section 12 49.4878
24 Hour Eval by MD Section 12
47.6056
Bedside registration MH 0
Bedside registration side A 15.9548
Call Admitting MD 5.7363
Clerk calls for Lipton 0
CT Scan 40.7892
Discharge Notes B side 26.6241
ED Infrared input by secretary
0
ED MD Admitting MD talk 0
EKG for patient 0
Hook up to telemetry and blood pressure
0
Infrared input by secretary 5.5214
MD Exam on Side B 97.5058
MD to MD talk 9.6936
Medical Clearance 0
MRI 41.1841
Nurse Does Discharge 76.5000
Nurse fills out Mental Health papers
0
Nurse fills out MH papers 0
Nurse helps patient leave 28.8373
Nurse Nurse discussion 0
Patient put in room and changed into HA attire
0
Model Filename: Page of 81 112 R:\MQP\Model 12-11-10

179
Category by Replication
12:50:58PM December 14, 2010
Unnamed Project 3 Replications:
Replication 3 Time Units: Start Time: Stop Time: 240.00 720.00 Hours
Process
Accumulated Time
Accum VA Time Value
Patient put in room and clothes changed
0
Physician Examination A 120.31
Pull IV 15.5539
Registration and Insurance 124.78
Remove Clothes and insert catheter
0
RN RN discussion 21.1437
RN tests and Labs A 130.52
RN tests and Labs Critical 0
Second MD Exam on B Side 7.5551
Second Physician Examination
36.6041
Sitter and Nurse review paperwork
0
Sitter and Nurse review paperwork during registration
0
Tests and Labs on Side B 104.97
Triage Area 207.41
Xrays 48.3890
Xrays Bedside 7.2817
Model Filename: Page of 82 112 R:\MQP\Model 12-11-10

180
Category by Replication
12:50:58PM December 14, 2010
Unnamed Project 3 Replications:
Replication 3 Time Units: Start Time: Stop Time: 240.00 720.00 Hours
Process
Accumulated Time
Accum NVA Time Value
Clean MH Room 0
Clean Side A Room 104.83
Clean Side B Room 84.1667
Clean Trauma Room 0
Clerk Call Admitting MD 0
Lipton Assessment 0
Strip MH Room 0
Strip Side A Room 20.9667
Strip Side B Room 16.8333
Strip Trauma Room 0
Trauma Patient gets bed 0
Model Filename: Page of 83 112 R:\MQP\Model 12-11-10

181
Category by Replication
12:50:58PM December 14, 2010
Unnamed Project 3 Replications:
Replication 3 Time Units: Start Time: Stop Time: 240.00 720.00 Hours
Process
Accumulated Time
Accum Wait Time Value
24 Hour Eval by MD Section
12 1.1289
Bedside registration MH 0
Bedside registration side A 0
Call Admitting MD 0
Clean MH Room 0
Clean Side A Room 22.7447
Clean Side B Room 16.1278
Clean Trauma Room 0
Clerk Call Admitting MD 0
Clerk calls for Lipton 0
ED Infrared input by secretary
0
ED MD Admitting MD talk 0
Infrared input by secretary 0
MD to MD talk 1.8351
Medical Clearance 0
Nurse fills out MH papers 0
Nurse helps patient leave 0
Nurse Nurse discussion 0
RN RN discussion 2.0845
RN tests and Labs A 0
Second MD Exam on B Side 3.8205
Second Physician Examination
9.7718
Strip MH Room 0
Strip Side A Room 0
Strip Side B Room 0
Model Filename: Page of 84 112 R:\MQP\Model 12-11-10

182
Category by Replication
12:50:58PM December 14, 2010
Unnamed Project 3 Replications:
Replication 3 Time Units: Start Time: Stop Time: 240.00 720.00 Hours
Process
Accumulated Time
Accum Wait Time Value
Strip Trauma Room 0
Tests and Labs on Side B 0
Other
Model Filename: Page of 85 112 R:\MQP\Model 12-11-10
183
Category by Replication
12:50:58PM December 14, 2010
Unnamed Project 3 Replications:
Replication 3 Time Units: Start Time: Stop Time: 240.00 720.00 Hours
Process
Other
Number In Value
24 Hour Eval by Lipton
Section 12 97
24 Hour Eval by MD Section 12
97
Bedside registration MH 0
Bedside registration side A 164
Call Admitting MD 171
Clean MH Room 0
Clean Side A Room 629
Clean Side B Room 505
Clean Trauma Room 0
Clerk Call Admitting MD 0
Clerk calls for Lipton 0
CT Scan 163
Discharge Notes B side 459
ED Infrared input by secretary
0
ED MD Admitting MD talk 0
EKG for patient 0
Hook up to telemetry and blood pressure
0
Infrared input by secretary 170
Lipton Assessment 0
MD Exam on Side B 505
MD to MD talk 170
Medical Clearance 0
MRI 164
Nurse Does Discharge 459
Model Filename: Page of 86 112 R:\MQP\Model 12-11-10

184
Category by Replication
12:50:58PM December 14, 2010
Unnamed Project 3 Replications:
Replication 3 Time Units: Start Time: Stop Time: 240.00 720.00 Hours
Process
Other
Number In Value
Nurse fills out Mental Health papers
0
Nurse fills out MH papers 0
Nurse helps patient leave 505
Nurse Nurse discussion 0
Patient put in room and changed into HA attire
0
Patient put in room and clothes changed
0
Physician Examination A 629
Pull IV 459
Registration and Insurance 1,257
Remove Clothes and insert catheter
0
RN RN discussion 170
RN tests and Labs A 628
RN tests and Labs Critical 0
Second MD Exam on B Side 126
Second Physician Examination
630
Sitter and Nurse review paperwork
0
Sitter and Nurse review paperwork during registration
0
Strip MH Room 0
Strip Side A Room 629
Strip Side B Room 505
Strip Trauma Room 0
Tests and Labs on Side B 505
Model Filename: Page of 87 112 R:\MQP\Model 12-11-10
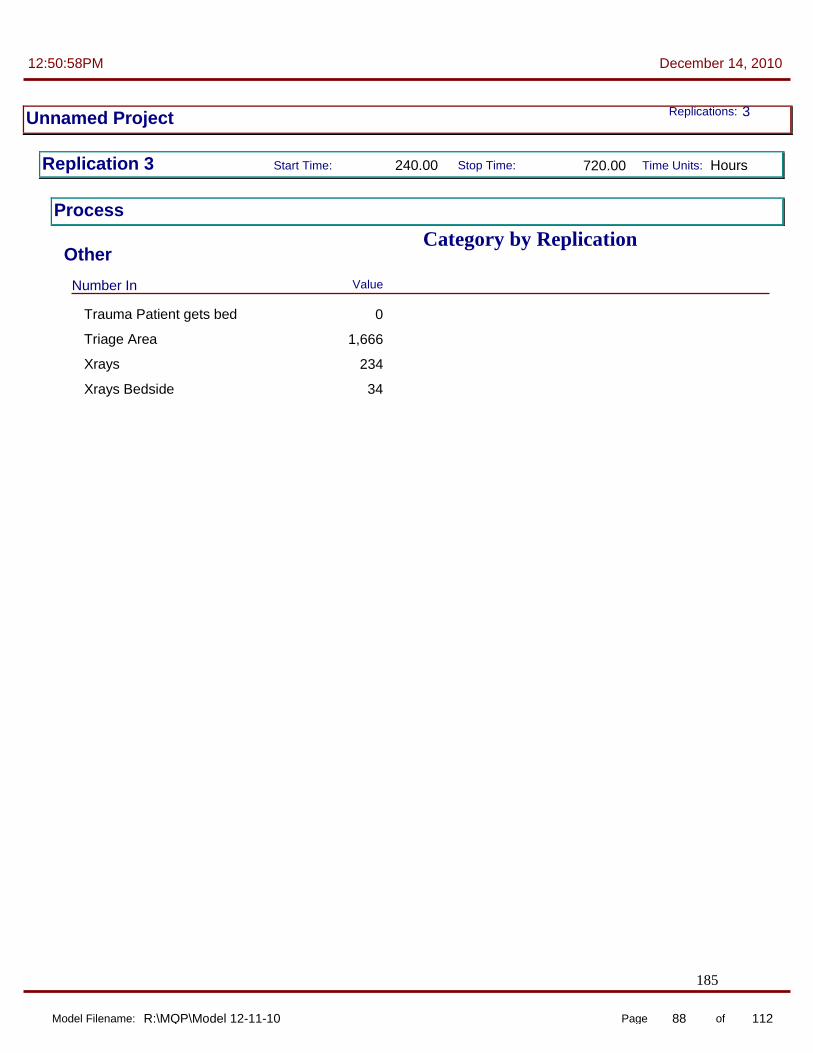
185
Category by Replication
12:50:58PM December 14, 2010
Unnamed Project 3 Replications:
Replication 3 Time Units: Start Time: Stop Time: 240.00 720.00 Hours
Process
Other
Number In Value
Trauma Patient gets bed 0
Triage Area 1,666
Xrays 234
Xrays Bedside 34
Model Filename: Page of 88 112 R:\MQP\Model 12-11-10

186
Category by Replication
12:50:58PM December 14, 2010
Unnamed Project 3 Replications:
Replication 3 Time Units: Start Time: Stop Time: 240.00 720.00 Hours
Process
Other
Number Out Value
24 Hour Eval by Lipton
Section 12 97
24 Hour Eval by MD Section 12
97
Bedside registration MH 0
Bedside registration side A 164
Call Admitting MD 170
Clean MH Room 0
Clean Side A Room 629
Clean Side B Room 505
Clean Trauma Room 0
Clerk Call Admitting MD 0
Clerk calls for Lipton 0
CT Scan 163
Discharge Notes B side 459
ED Infrared input by secretary
0
ED MD Admitting MD talk 0
EKG for patient 0
Hook up to telemetry and blood pressure
0
Infrared input by secretary 170
Lipton Assessment 0
MD Exam on Side B 505
MD to MD talk 170
Medical Clearance 0
MRI 164
Nurse Does Discharge 459
Model Filename: Page of 89 112 R:\MQP\Model 12-11-10

187
Category by Replication
12:50:58PM December 14, 2010
Unnamed Project 3 Replications:
Replication 3 Time Units: Start Time: Stop Time: 240.00 720.00 Hours
Process
Other
Number Out Value
Nurse fills out Mental Health papers
0
Nurse fills out MH papers 0
Nurse helps patient leave 505
Nurse Nurse discussion 0
Patient put in room and changed into HA attire
0
Patient put in room and clothes changed
0
Physician Examination A 629
Pull IV 459
Registration and Insurance 1,257
Remove Clothes and insert catheter
0
RN RN discussion 170
RN tests and Labs A 629
RN tests and Labs Critical 0
Second MD Exam on B Side 126
Second Physician Examination
630
Sitter and Nurse review paperwork
0
Sitter and Nurse review paperwork during registration
0
Strip MH Room 0
Strip Side A Room 629
Strip Side B Room 505
Strip Trauma Room 0
Tests and Labs on Side B 505
Model Filename: Page of 90 112 R:\MQP\Model 12-11-10

188
Category by Replication
12:50:58PM December 14, 2010
Unnamed Project 3 Replications:
Replication 3 Time Units: Start Time: Stop Time: 240.00 720.00 Hours
Process
Other
Number Out Value
Trauma Patient gets bed 0
Triage Area 1,666
Xrays 234
Xrays Bedside 35
Queue
Time
Model Filename: Page of 91 112 R:\MQP\Model 12-11-10

189
Category by Replication
12:50:58PM December 14, 2010
Unnamed Project 3 Replications:
Replication 3 Time Units: Start Time: Stop Time: 240.00 720.00 Hours
Queue
Time
Waiting Time Maximum Minimum Average Half Width
24 Hour Eval by MD Section
12.Queue (Insufficient) 0 0.1887 0.01163849
Batch 5.Queue 0.002135457 0 0.1057 0.02087448
Batch 6.Queue (Insufficient) 0 0.4806 0.0987
Bedside registration side A.Queue
(Insufficient) 0 0 0
Call Admitting MD.Queue (Insufficient) 0 0 0
Call for Transport.Queue (Insufficient) 0 0 0
Call Radiology B side.Queue (Insufficient) 0 0 0
Call Radiology.Queue (Insufficient) 0 0 0
Clean Side A Room.Queue 0.005871489 0 0.4007 0.03616012
Clean Side B Room.Queue 0.008040035 0 0.3429 0.03193618
Get Nurse.Queue 0.000000000 0 0 0
Infrared input by secretary.Queue
(Insufficient) 0 0 0
MD to MD talk.Queue (Insufficient) 0 0.1674 0.01079497
Nurse helps patient leave.Queue
0.000000000 0 0 0
Radiologist to come to ED.Queue
(Insufficient) 0 0 0
RN RN discussion.Queue (Insufficient) 0 0.2625 0.01226148
RN tests and Labs A.Queue 0.000000000 0 0 0
Second MD Exam on B Side.Queue
(Insufficient) 0 0.7156 0.03032173
Second Physician Examination.Queue
0.005681969 0 0.8374 0.01551085
Seize CT Tech and Nurse.Queue
(Insufficient) 0 0 0
Seize MDfor Side B.Queue 0.000000000 0 0 0
Model Filename: Page of 92 112 R:\MQP\Model 12-11-10

190
Category by Replication
12:50:58PM December 14, 2010
Unnamed Project 3 Replications:
Replication 3 Time Units: Start Time: Stop Time: 240.00 720.00 Hours
Queue
Time
Waiting Time Maximum Minimum Average Half Width
Seize MRI tech and Nurse.Queue
(Insufficient) 0 0 0
Seize Physician A.Queue 0.000000000 0 0 0
Seize Registration and Insurance.Queue
0.000000000 0 0 0
Seize Side A Room and Transport Nurse.Queue
0.000000000 0 0 0
Seize Side B Room and Transport Nurse.Queue
0.000000000 0 0 0
Seize Triage Nurse.Queue 0.000000000 0 0 0
Strip Side A Room.Queue 0.000000000 0 0 0
Strip Side B Room.Queue 0.000000000 0 0 0
Tests and Labs on Side B.Queue
0.000000000 0 0 0
Other
Model Filename: Page of 93 112 R:\MQP\Model 12-11-10

191
Category by Replication
12:50:58PM December 14, 2010
Unnamed Project 3 Replications:
Replication 3 Time Units: Start Time: Stop Time: 240.00 720.00 Hours
Queue
Other
Number Waiting Maximum Minimum Average Half Width
24 Hour Eval by MD Section
12.Queue (Insufficient) 0 1.0000 0.00235194
Arrange for Sitter.Queue (Insufficient) 1.0000 1.0000 1.0000
Batch 11.Queue (Insufficient) 0 0 0
Batch 4.Queue (Insufficient) 0 0 0
Batch 5.Queue 0.002226516 0 2.0000 0.01426423
Batch 6.Queue (Insufficient) 0 3.0000 0.03990712
Batch 7.Queue (Insufficient) 5.0000 5.0000 5.0000
Bedside registration MH.Queue
(Insufficient) 0 0 0
Bedside registration side A.Queue
(Insufficient) 0 0 0
Call Admitting MD.Queue (Insufficient) 0 0 0
Call for ED Transport.Queue (Insufficient) 0 0 0
Call for Transport.Queue (Insufficient) 0 0 0
Call Radiology B side.Queue (Insufficient) 0 0 0
Call Radiology.Queue (Insufficient) 0 0 0
Call transport for Trauma.Queue
(Insufficient) 0 0 0
Call transport to Helicopter.Queue
(Insufficient) 0 0 0
Clean MH Room.Queue (Insufficient) 0 0 0
Clean Side A Room.Queue 0.007907548 0 2.0000 0.04738482
Clean Side B Room.Queue (Insufficient) 0 2.0000 0.03359952
Clean Trauma Room.Queue (Insufficient) 0 0 0
Clerk Call Admitting MD.Queue
(Insufficient) 0 0 0
Clerk calls for Lipton.Queue (Insufficient) 0 0 0
Model Filename: Page of 94 112 R:\MQP\Model 12-11-10

192
Category by Replication
12:50:58PM December 14, 2010
Unnamed Project 3 Replications:
Replication 3 Time Units: Start Time: Stop Time: 240.00 720.00 Hours
Queue
Other
Number Waiting Maximum Minimum Average Half Width
ED Infrared input by
secretary.Queue (Insufficient) 0 0 0
ED MD Admitting MD talk.Queue
(Insufficient) 0 0 0
Get Nurse.Queue (Insufficient) 0 0 0
Infrared input by secretary.Queue
(Insufficient) 0 0 0
MD to MD talk.Queue (Insufficient) 0 1.0000 0.00382322
Medical Clearance.Queue (Insufficient) 0 0 0
Nurse fills out MH papers.Queue
(Insufficient) 0 0 0
Nurse helps patient leave.Queue
(Insufficient) 0 0 0
Nurse Nurse discussion.Queue
(Insufficient) 0 0 0
Radiologist to come to ED.Queue
(Insufficient) 0 0 0
RN RN discussion.Queue (Insufficient) 0 1.0000 0.00434261
RN tests and Labs A.Queue (Insufficient) 0 0 0
Second MD Exam on B Side.Queue
(Insufficient) 0 1.0000 0.00795945
Second Physician Examination.Queue
(Insufficient) 0 2.0000 0.02035799
Seize CT Tech and Nurse.Queue
(Insufficient) 0 0 0
Seize EKG and Tech.Queue (Correlated) 215.00 624.00 413.28
Seize EKG.Queue (Insufficient) 0 0 0
Seize MDfor Side B.Queue (Insufficient) 0 0 0
Seize Mental Health nurse.Queue
(Insufficient) 0 0 0
Seize Mental Health Room and Nurse.Queue
(Insufficient) 48.0000 172.00 111.40
Model Filename: Page of 95 112 R:\MQP\Model 12-11-10
193
Category by Replication
12:50:58PM December 14, 2010
Unnamed Project 3 Replications:
Replication 3 Time Units: Start Time: Stop Time: 240.00 720.00 Hours
Queue
Other
Number Waiting Maximum Minimum Average Half Width
Seize MRI tech and
Nurse.Queue (Insufficient) 0 0 0
Seize Physician A.Queue (Insufficient) 0 0 0
Seize Registration and Insurance.Queue
(Insufficient) 0 0 0
Seize Room for Mental Health.Queue
(Insufficient) 15.0000 64.0000 44.2075
Seize Room.Queue (Insufficient) 0 0 0
Seize Side A Room and Transport Nurse.Queue
(Insufficient) 0 0 0
Seize Side B Room and Transport Nurse.Queue
(Insufficient) 0 0 0
Seize Trauma Bed.Queue (Insufficient) 96.0000 301.00 193.95
Seize Triage Nurse.Queue (Insufficient) 0 0 0
Strip MH Room.Queue (Insufficient) 0 0 0
Strip Side A Room.Queue (Insufficient) 0 0 0
Strip Side B Room.Queue (Insufficient) 0 0 0
Strip Trauma Room.Queue (Insufficient) 0 0 0
Tests and Labs on Side B.Queue
(Insufficient) 0 0 0
Triage.Queue (Insufficient) 0 0 0
Resource
Usage
Model Filename: Page of 96 112 R:\MQP\Model 12-11-10

194
Category by Replication
12:50:58PM December 14, 2010
Unnamed Project 3 Replications:
Replication 3 Time Units: Start Time: Stop Time: 240.00 720.00 Hours
Resource
Usage
Instantaneous Utilization Maximum Minimum Average Half Width
Bed 1 (Insufficient) 0 0 0
Bed 10 (Insufficient) 0 1.0000 0.1909
Bed 11 (Insufficient) 0 1.0000 0.1930
Bed 12 (Insufficient) 0 1.0000 0.1927
Bed 13 (Insufficient) 0 1.0000 0.1927
Bed 14 (Insufficient) 1.0000 1.0000 1.0000
Bed 15 (Insufficient) 1.0000 1.0000 1.0000
Bed 16 (Insufficient) 1.0000 1.0000 1.0000
Bed 17 (Insufficient) 1.0000 1.0000 1.0000
Bed 18 (Insufficient) 1.0000 1.0000 1.0000
Bed 2 (Insufficient) 0 0 0
Bed 20 (Insufficient) 0 1.0000 0.1521
Bed 21 (Insufficient) 0 1.0000 0.1506
Bed 22 (Insufficient) 0 1.0000 0.1461
Bed 23 (Insufficient) 0 1.0000 0.1480
Bed 24 (Insufficient) 0 1.0000 0.1498
Bed 25 (Insufficient) 0 1.0000 0.1444
Bed 3 (Insufficient) 0 0 0
Bed 4 (Insufficient) 0 1.0000 0.1910
Bed 5 (Insufficient) 0 1.0000 0.1886
Bed 6 (Insufficient) 0 1.0000 0.1917
Bed 7 (Insufficient) 0 1.0000 0.1876
Bed 8 (Insufficient) 0 1.0000 0.1906
Bed 9 (Insufficient) 0 1.0000 0.1953
Charge Nurse (Insufficient) 1.0000 1.0000 1.0000
Cleaning Staff 0.012785933 0 1.0000 0.3937
Clerk 1 0.002290405 0 1.0000 0.01131884
Model Filename: Page of 97 112 R:\MQP\Model 12-11-10

195
Category by Replication
12:50:58PM December 14, 2010
Unnamed Project 3 Replications:
Replication 3 Time Units: Start Time: Stop Time: 240.00 720.00 Hours
Resource
Usage
Instantaneous Utilization Maximum Minimum Average Half Width
Clerk 2 0.002367157 0 1.0000 0.01221157
CT Machine 1 (Insufficient) 0 1.0000 0.04863264
CT Machine 2 (Insufficient) 0 1.0000 0.04766438
CT Tech 1 (Insufficient) 0 1.0000 0.04903538
CT Tech 2 (Insufficient) 0 1.0000 0.05858108
ED Transport 0.000867864 0 0.4000 0.00590278
EKG Machine 1 (Insufficient) 0 0 0
EKG Machine 2 (Insufficient) 0 0 0
EKG Machine 3 (Insufficient) 0 0 0
Float Nurse 0.014914561 0 1.0000 0.1703
MD 1 0.016282461 0 1.0000 0.1555
MD 2 0.011666432 0 1.0000 0.1395
MD 3 0.012788229 0 1.0000 0.1427
MD 4 0.016501856 0 1.0000 0.1465
MD 5 0.012939220 0 1.0000 0.1363
Mental Health Group Room (Insufficient) 1.0000 1.0000 1.0000
MRI Machine 1 (Insufficient) 0 1.0000 0.04832006
MRI Machine 2 (Insufficient) 0 1.0000 0.04886903
MRI Tech 1 (Insufficient) 0 1.0000 0.05378168
MRI Tech 2 (Insufficient) 0 1.0000 0.05479629
Nurse 1 0.015147530 0 1.0000 0.1918
Nurse 2 0.015027221 0 1.0000 0.1647
Nurse 3 0.013721067 0 1.0000 0.1636
Nurse 4 0.012646518 0 1.0000 0.1577
Nurse 5 0.011161885 0 1.0000 0.1580
Portable Xray 1 (Insufficient) 0 1.0000 0.01792018
Portable Xray 2 (Insufficient) 0 1.0000 0.00890636
Model Filename: Page of 98 112 R:\MQP\Model 12-11-10

196
Category by Replication
12:50:58PM December 14, 2010
Unnamed Project 3 Replications:
Replication 3 Time Units: Start Time: Stop Time: 240.00 720.00 Hours
Resource
Usage
Instantaneous Utilization Maximum Minimum Average Half Width
Radiologist (Insufficient) 0 0 0
Registration 1 0.009937253 0 1.0000 0.1494
Registration 2 0.007435914 0 1.0000 0.1438
Sitter 1 (Insufficient) 1.0000 1.0000 1.0000
Sitter 2 (Insufficient) 1.0000 1.0000 1.0000
Tech 1 (Insufficient) 1.0000 1.0000 1.0000
Tech 2 (Insufficient) 1.0000 1.0000 1.0000
Tech 3 (Insufficient) 1.0000 1.0000 1.0000
Triage Nurse 0.007467467 0 1.0000 0.4466
Xray Machine 1 (Insufficient) 0 1.0000 0.02671366
Xray Machine 2 (Insufficient) 0 1.0000 0.03763439
Xray Machine 3 (Insufficient) 0 1.0000 0.01860536
Xray Machine 4 (Insufficient) 0 1.0000 0.03410698
Xray Tech 1 (Insufficient) 0 1.0000 0.03002225
Xray Tech 2 (Insufficient) 0 1.0000 0.02352442
Xray Tech 3 (Insufficient) 0 1.0000 0.02786468
Xray Tech 4 (Insufficient) 0 1.0000 0.02358798
Xray Tech 5 (Insufficient) 0 1.0000 0.02433333
Xray Tech 6 (Insufficient) 0 1.0000 0.03080427
Model Filename: Page of 99 112 R:\MQP\Model 12-11-10

197
Category by Replication
12:50:58PM December 14, 2010
Unnamed Project 3 Replications:
Replication 3 Time Units: Start Time: Stop Time: 240.00 720.00 Hours
Resource
Usage
Number Busy Maximum Minimum Average Half Width
Bed 1 (Insufficient) 0 0 0
Bed 10 (Insufficient) 0 1.0000 0.1909
Bed 11 (Insufficient) 0 1.0000 0.1930
Bed 12 (Insufficient) 0 1.0000 0.1927
Bed 13 (Insufficient) 0 1.0000 0.1927
Bed 14 (Insufficient) 1.0000 1.0000 1.0000
Bed 15 (Insufficient) 1.0000 1.0000 1.0000
Bed 16 (Insufficient) 1.0000 1.0000 1.0000
Bed 17 (Insufficient) 1.0000 1.0000 1.0000
Bed 18 (Insufficient) 1.0000 1.0000 1.0000
Bed 2 (Insufficient) 0 0 0
Bed 20 (Insufficient) 0 1.0000 0.1521
Bed 21 (Insufficient) 0 1.0000 0.1506
Bed 22 (Insufficient) 0 1.0000 0.1461
Bed 23 (Insufficient) 0 1.0000 0.1480
Bed 24 (Insufficient) 0 1.0000 0.1498
Bed 25 (Insufficient) 0 1.0000 0.1444
Bed 3 (Insufficient) 0 0 0
Bed 4 (Insufficient) 0 1.0000 0.1910
Bed 5 (Insufficient) 0 1.0000 0.1886
Bed 6 (Insufficient) 0 1.0000 0.1917
Bed 7 (Insufficient) 0 1.0000 0.1876
Bed 8 (Insufficient) 0 1.0000 0.1906
Bed 9 (Insufficient) 0 1.0000 0.1953
Charge Nurse (Insufficient) 1.0000 1.0000 1.0000
Cleaning Staff 0.012785933 0 1.0000 0.3937
Clerk 1 0.002290405 0 1.0000 0.01131884
Model Filename: Page of 100 112 R:\MQP\Model 12-11-10

198
Category by Replication
12:50:58PM December 14, 2010
Unnamed Project 3 Replications:
Replication 3 Time Units: Start Time: Stop Time: 240.00 720.00 Hours
Resource
Usage
Number Busy Maximum Minimum Average Half Width
Clerk 2 0.002367157 0 1.0000 0.01221157
CT Machine 1 (Insufficient) 0 1.0000 0.04863264
CT Machine 2 (Insufficient) 0 1.0000 0.04766438
CT Tech 1 (Insufficient) 0 1.0000 0.04903538
CT Tech 2 (Insufficient) 0 1.0000 0.05858108
ED Transport 0.004339318 0 2.0000 0.02951389
EKG Machine 1 (Insufficient) 0 0 0
EKG Machine 2 (Insufficient) 0 0 0
EKG Machine 3 (Insufficient) 0 0 0
Float Nurse 0.014914561 0 1.0000 0.1703
MD 1 0.016282461 0 1.0000 0.1555
MD 2 0.011666432 0 1.0000 0.1395
MD 3 0.012788229 0 1.0000 0.1427
MD 4 0.016501856 0 1.0000 0.1465
MD 5 0.012939220 0 1.0000 0.1363
Mental Health Group Room (Insufficient) 1.0000 1.0000 1.0000
MRI Machine 1 (Insufficient) 0 1.0000 0.04832006
MRI Machine 2 (Insufficient) 0 1.0000 0.04886903
MRI Tech 1 (Insufficient) 0 1.0000 0.05378168
MRI Tech 2 (Insufficient) 0 1.0000 0.05479629
Nurse 1 0.015147530 0 1.0000 0.1918
Nurse 2 0.015027221 0 1.0000 0.1647
Nurse 3 0.013721067 0 1.0000 0.1636
Nurse 4 0.012646518 0 1.0000 0.1577
Nurse 5 0.011161885 0 1.0000 0.1580
Portable Xray 1 (Insufficient) 0 1.0000 0.01792018
Portable Xray 2 (Insufficient) 0 1.0000 0.00890636
Model Filename: Page of 101 112 R:\MQP\Model 12-11-10
199
Category by Replication
12:50:58PM December 14, 2010
Unnamed Project 3 Replications:
Replication 3 Time Units: Start Time: Stop Time: 240.00 720.00 Hours
Resource
Usage
Number Busy Maximum Minimum Average Half Width
Radiologist (Insufficient) 0 0 0
Registration 1 0.009937253 0 1.0000 0.1494
Registration 2 0.007435914 0 1.0000 0.1438
Sitter 1 (Insufficient) 1.0000 1.0000 1.0000
Sitter 2 (Insufficient) 1.0000 1.0000 1.0000
Tech 1 (Insufficient) 1.0000 1.0000 1.0000
Tech 2 (Insufficient) 1.0000 1.0000 1.0000
Tech 3 (Insufficient) 1.0000 1.0000 1.0000
Triage Nurse 0.007467467 0 1.0000 0.4466
Xray Machine 1 (Insufficient) 0 1.0000 0.02671366
Xray Machine 2 (Insufficient) 0 1.0000 0.03763439
Xray Machine 3 (Insufficient) 0 1.0000 0.01860536
Xray Machine 4 (Insufficient) 0 1.0000 0.03410698
Xray Tech 1 (Insufficient) 0 1.0000 0.03002225
Xray Tech 2 (Insufficient) 0 1.0000 0.02352442
Xray Tech 3 (Insufficient) 0 1.0000 0.02786468
Xray Tech 4 (Insufficient) 0 1.0000 0.02358798
Xray Tech 5 (Insufficient) 0 1.0000 0.02433333
Xray Tech 6 (Insufficient) 0 1.0000 0.03080427
Model Filename: Page of 102 112 R:\MQP\Model 12-11-10

200
Category by Replication
12:50:58PM December 14, 2010
Unnamed Project 3 Replications:
Replication 3 Time Units: Start Time: Stop Time: 240.00 720.00 Hours
Resource
Usage
Number Scheduled Maximum Minimum Average Half Width
Bed 1 (Insufficient) 1.0000 1.0000 1.0000
Bed 10 (Insufficient) 1.0000 1.0000 1.0000
Bed 11 (Insufficient) 1.0000 1.0000 1.0000
Bed 12 (Insufficient) 1.0000 1.0000 1.0000
Bed 13 (Insufficient) 1.0000 1.0000 1.0000
Bed 14 (Insufficient) 1.0000 1.0000 1.0000
Bed 15 (Insufficient) 1.0000 1.0000 1.0000
Bed 16 (Insufficient) 1.0000 1.0000 1.0000
Bed 17 (Insufficient) 1.0000 1.0000 1.0000
Bed 18 (Insufficient) 1.0000 1.0000 1.0000
Bed 2 (Insufficient) 1.0000 1.0000 1.0000
Bed 20 (Insufficient) 1.0000 1.0000 1.0000
Bed 21 (Insufficient) 1.0000 1.0000 1.0000
Bed 22 (Insufficient) 1.0000 1.0000 1.0000
Bed 23 (Insufficient) 1.0000 1.0000 1.0000
Bed 24 (Insufficient) 1.0000 1.0000 1.0000
Bed 25 (Insufficient) 1.0000 1.0000 1.0000
Bed 3 (Insufficient) 1.0000 1.0000 1.0000
Bed 4 (Insufficient) 1.0000 1.0000 1.0000
Bed 5 (Insufficient) 1.0000 1.0000 1.0000
Bed 6 (Insufficient) 1.0000 1.0000 1.0000
Bed 7 (Insufficient) 1.0000 1.0000 1.0000
Bed 8 (Insufficient) 1.0000 1.0000 1.0000
Bed 9 (Insufficient) 1.0000 1.0000 1.0000
Charge Nurse (Insufficient) 1.0000 1.0000 1.0000
Cleaning Staff (Insufficient) 1.0000 1.0000 1.0000
Clerk 1 (Insufficient) 1.0000 1.0000 1.0000
Model Filename: Page of 103 112 R:\MQP\Model 12-11-10

201
Category by Replication
12:50:58PM December 14, 2010
Unnamed Project 3 Replications:
Replication 3 Time Units: Start Time: Stop Time: 240.00 720.00 Hours
Resource
Usage
Number Scheduled Maximum Minimum Average Half Width
Clerk 2 (Insufficient) 1.0000 1.0000 1.0000
CT Machine 1 (Insufficient) 1.0000 1.0000 1.0000
CT Machine 2 (Insufficient) 1.0000 1.0000 1.0000
CT Tech 1 (Insufficient) 1.0000 1.0000 1.0000
CT Tech 2 (Insufficient) 1.0000 1.0000 1.0000
ED Transport (Insufficient) 5.0000 5.0000 5.0000
EKG Machine 1 (Insufficient) 1.0000 1.0000 1.0000
EKG Machine 2 (Insufficient) 1.0000 1.0000 1.0000
EKG Machine 3 (Insufficient) 1.0000 1.0000 1.0000
Float Nurse (Insufficient) 1.0000 1.0000 1.0000
MD 1 (Insufficient) 1.0000 1.0000 1.0000
MD 2 (Insufficient) 1.0000 1.0000 1.0000
MD 3 (Insufficient) 1.0000 1.0000 1.0000
MD 4 (Insufficient) 1.0000 1.0000 1.0000
MD 5 (Insufficient) 1.0000 1.0000 1.0000
Mental Health Group Room (Insufficient) 1.0000 1.0000 1.0000
MRI Machine 1 (Insufficient) 1.0000 1.0000 1.0000
MRI Machine 2 (Insufficient) 1.0000 1.0000 1.0000
MRI Tech 1 (Insufficient) 1.0000 1.0000 1.0000
MRI Tech 2 (Insufficient) 1.0000 1.0000 1.0000
Nurse 1 (Insufficient) 1.0000 1.0000 1.0000
Nurse 2 (Insufficient) 1.0000 1.0000 1.0000
Nurse 3 (Insufficient) 1.0000 1.0000 1.0000
Nurse 4 (Insufficient) 1.0000 1.0000 1.0000
Nurse 5 (Insufficient) 1.0000 1.0000 1.0000
Portable Xray 1 (Insufficient) 1.0000 1.0000 1.0000
Portable Xray 2 (Insufficient) 1.0000 1.0000 1.0000
Model Filename: Page of 104 112 R:\MQP\Model 12-11-10

202
Category by Replication
12:50:58PM December 14, 2010
Unnamed Project 3 Replications:
Replication 3 Time Units: Start Time: Stop Time: 240.00 720.00 Hours
Resource
Usage
Number Scheduled Maximum Minimum Average Half Width
Radiologist (Insufficient) 1.0000 1.0000 1.0000
Registration 1 (Insufficient) 1.0000 1.0000 1.0000
Registration 2 (Insufficient) 1.0000 1.0000 1.0000
Sitter 1 (Insufficient) 1.0000 1.0000 1.0000
Sitter 2 (Insufficient) 1.0000 1.0000 1.0000
Tech 1 (Insufficient) 1.0000 1.0000 1.0000
Tech 2 (Insufficient) 1.0000 1.0000 1.0000
Tech 3 (Insufficient) 1.0000 1.0000 1.0000
Triage Nurse (Insufficient) 1.0000 1.0000 1.0000
Xray Machine 1 (Insufficient) 1.0000 1.0000 1.0000
Xray Machine 2 (Insufficient) 1.0000 1.0000 1.0000
Xray Machine 3 (Insufficient) 1.0000 1.0000 1.0000
Xray Machine 4 (Insufficient) 1.0000 1.0000 1.0000
Xray Tech 1 (Insufficient) 1.0000 1.0000 1.0000
Xray Tech 2 (Insufficient) 1.0000 1.0000 1.0000
Xray Tech 3 (Insufficient) 1.0000 1.0000 1.0000
Xray Tech 4 (Insufficient) 1.0000 1.0000 1.0000
Xray Tech 5 (Insufficient) 1.0000 1.0000 1.0000
Xray Tech 6 (Insufficient) 1.0000 1.0000 1.0000
Model Filename: Page of 105 112 R:\MQP\Model 12-11-10
203
Category by Replication
12:50:58PM December 14, 2010
Unnamed Project 3 Replications:
Replication 3 Time Units: Start Time: Stop Time: 240.00 720.00 Hours
Resource
Usage
Scheduled Utilization Value
Bed 1 0
Bed 10 0.1909
Bed 11 0.1930
Bed 12 0.1927
Bed 13 0.1927
Bed 14 1.0000
Bed 15 1.0000
Bed 16 1.0000
Bed 17 1.0000
Bed 18 1.0000
Bed 2 0
Bed 20 0.1521
Bed 21 0.1506
Bed 22 0.1461
Bed 23 0.1480
Bed 24 0.1498
Bed 25 0.1444
Bed 3 0
Bed 4 0.1910
Bed 5 0.1886
Bed 6 0.1917
Bed 7 0.1876
Bed 8 0.1906
Bed 9 0.1953
Charge Nurse 1.0000
Cleaning Staff 0.3937
Clerk 1 0.01131884
Model Filename: Page of 106 112 R:\MQP\Model 12-11-10

204
Category by Replication
12:50:58PM December 14, 2010
Unnamed Project 3 Replications:
Replication 3 Time Units: Start Time: Stop Time: 240.00 720.00 Hours
Resource
Usage
Scheduled Utilization Value
Clerk 2 0.01221157
CT Machine 1 0.04863264
CT Machine 2 0.04766438
CT Tech 1 0.04903538
CT Tech 2 0.05858108
ED Transport 0.00590278
EKG Machine 1 0
EKG Machine 2 0
EKG Machine 3 0
Float Nurse 0.1703
MD 1 0.1555
MD 2 0.1395
MD 3 0.1427
MD 4 0.1465
MD 5 0.1363
Mental Health Group Room 1.0000
MRI Machine 1 0.04832006
MRI Machine 2 0.04886903
MRI Tech 1 0.05378168
MRI Tech 2 0.05479629
Nurse 1 0.1918
Nurse 2 0.1647
Nurse 3 0.1636
Nurse 4 0.1577
Nurse 5 0.1580
Portable Xray 1 0.01792018
Portable Xray 2 0.00890636
Model Filename: Page of 107 112 R:\MQP\Model 12-11-10

205
Category by Replication
12:50:58PM December 14, 2010
Unnamed Project 3 Replications:
Replication 3 Time Units: Start Time: Stop Time: 240.00 720.00 Hours
Resource
Usage
Scheduled Utilization Value
Radiologist 0
Registration 1 0.1494
Registration 2 0.1438
Sitter 1 1.0000
Sitter 2 1.0000
Tech 1 1.0000
Tech 2 1.0000
Tech 3 1.0000
Triage Nurse 0.4466
Xray Machine 1 0.02671366
Xray Machine 2 0.03763439
Xray Machine 3 0.01860536
Xray Machine 4 0.03410698
Xray Tech 1 0.03002225
Xray Tech 2 0.02352442
Xray Tech 3 0.02786468
Xray Tech 4 0.02358798
Xray Tech 5 0.02433333
Xray Tech 6 0.03080427
Model Filename: Page of 108 112 R:\MQP\Model 12-11-10

206
Category by Replication
12:50:58PM December 14, 2010
Unnamed Project 3 Replications:
Replication 3 Time Units: Start Time: Stop Time: 240.00 720.00 Hours
Resource
Usage
Total Number Seized Value
Bed 1 0
Bed 10 63.0000
Bed 11 63.0000
Bed 12 63.0000
Bed 13 63.0000
Bed 14 0
Bed 15 0
Bed 16 0
Bed 17 0
Bed 18 0
Bed 2 0
Bed 20 84.0000
Bed 21 85.0000
Bed 22 84.0000
Bed 23 84.0000
Bed 24 84.0000
Bed 25 84.0000
Bed 3 0
Bed 4 63.0000
Bed 5 63.0000
Bed 6 62.0000
Bed 7 62.0000
Bed 8 63.0000
Bed 9 63.0000
Charge Nurse 0
Cleaning Staff 1,134.00
Clerk 1 165.00
Model Filename: Page of 109 112 R:\MQP\Model 12-11-10
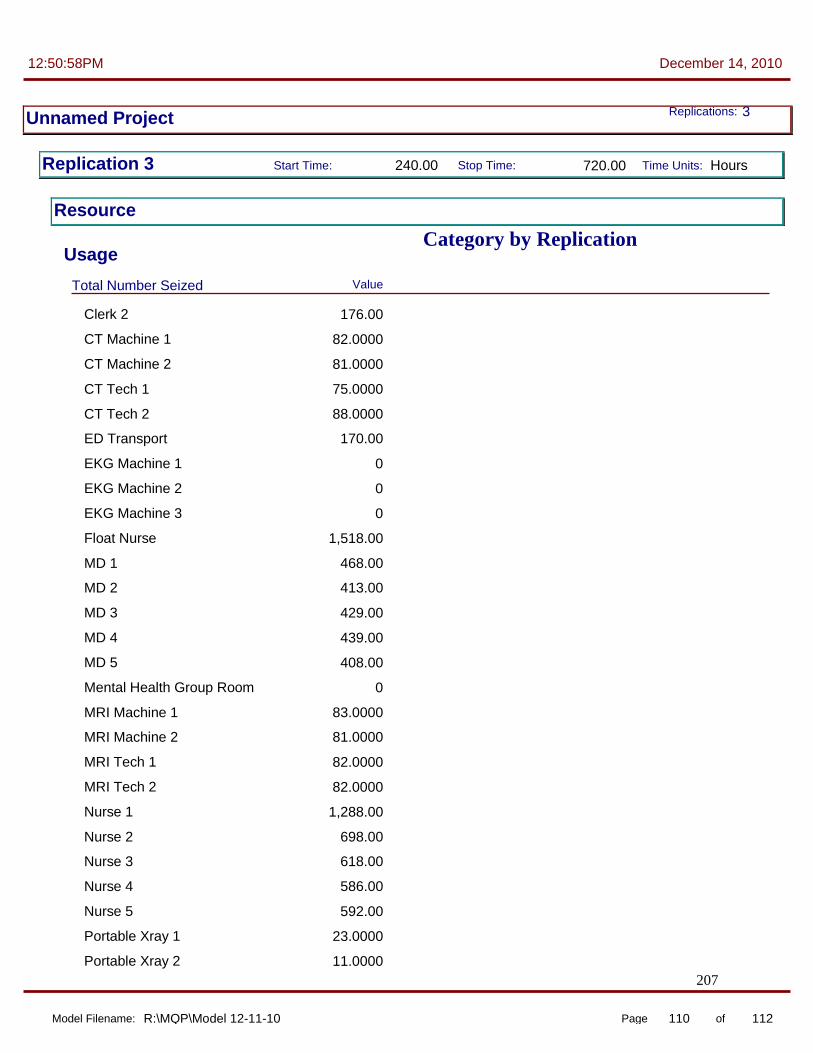
207
Category by Replication
12:50:58PM December 14, 2010
Unnamed Project 3 Replications:
Replication 3 Time Units: Start Time: Stop Time: 240.00 720.00 Hours
Resource
Usage
Total Number Seized Value
Clerk 2 176.00
CT Machine 1 82.0000
CT Machine 2 81.0000
CT Tech 1 75.0000
CT Tech 2 88.0000
ED Transport 170.00
EKG Machine 1 0
EKG Machine 2 0
EKG Machine 3 0
Float Nurse 1,518.00
MD 1 468.00
MD 2 413.00
MD 3 429.00
MD 4 439.00
MD 5 408.00
Mental Health Group Room 0
MRI Machine 1 83.0000
MRI Machine 2 81.0000
MRI Tech 1 82.0000
MRI Tech 2 82.0000
Nurse 1 1,288.00
Nurse 2 698.00
Nurse 3 618.00
Nurse 4 586.00
Nurse 5 592.00
Portable Xray 1 23.0000
Portable Xray 2 11.0000
Model Filename: Page of 110 112 R:\MQP\Model 12-11-10

208
Category by Replication
12:50:58PM December 14, 2010
Unnamed Project 3 Replications:
Replication 3 Time Units: Start Time: Stop Time: 240.00 720.00 Hours
Resource
Usage
Total Number Seized Value
Radiologist 0
Registration 1 728.00
Registration 2 693.00
Sitter 1 0
Sitter 2 0
Tech 1 0
Tech 2 0
Tech 3 0
Triage Nurse 1,666.00
Xray Machine 1 53.0000
Xray Machine 2 75.0000
Xray Machine 3 37.0000
Xray Machine 4 69.0000
Xray Tech 1 50.0000
Xray Tech 2 38.0000
Xray Tech 3 47.0000
Xray Tech 4 40.0000
Xray Tech 5 41.0000
Xray Tech 6 52.0000
System
Other
Number Out Value
System 6,108
User Specified
Model Filename: Page of 111 112 R:\MQP\Model 12-11-10
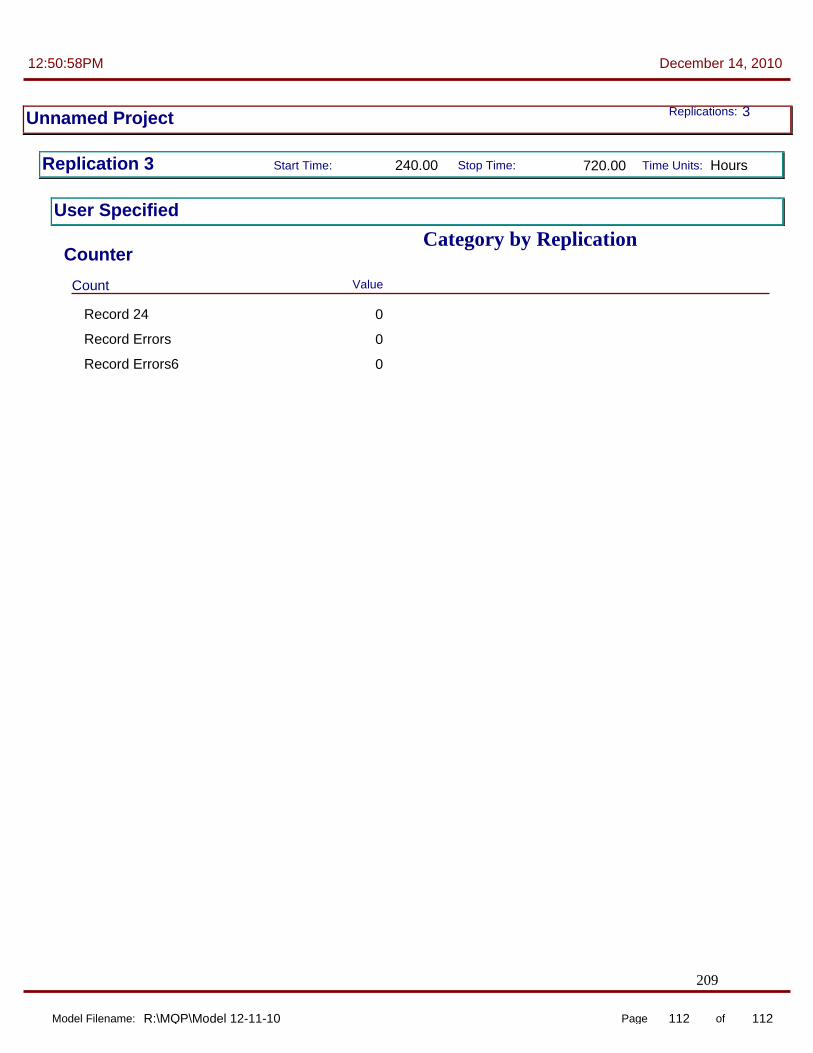
209
Category by Replication
12:50:58PM December 14, 2010
Unnamed Project 3 Replications:
Replication 3 Time Units: Start Time: Stop Time: 240.00 720.00 Hours
User Specified
Counter
Count Value
Record 24 0
Record Errors 0
Record Errors6 0
Model Filename: Page of 112 112 R:\MQP\Model 12-11-10
210
Appendix H: Experimentation Plan
Experimentation Phase 1 (Original Model v. Plus One Nurse)
We began the first phase of experimentation by opening the simulation model given to us
by the UMass Process Improvement Team. Before we actually ran the model we needed to
establish how many times we would run the model and how long each run would last. To do
this, we clicked Run > Setup located at the top of the Arena program. For ―Number of
Replications‖ we entered 25. This number was established so that we as users would get a feel
for the variation of results. The next item in the Run > Setup dialog box we needed to determine
was ―Replication Length.‖ We decided to use a length of seven days. This was determined to
develop an understanding of patient flow for a one-week period. Following ―Replication
Length,‖ we established a ―Warm-up Period‖ of two days. This allowed for analysis to take
place over a time period not affected by the initial-and-idle defaults of an Arena model. In other
words, it allowed for the model to ―warm up‖ until it appeared that the effects of the artificial
initial conditions (e.g. zero patients within the emergency department) had worn off. Lastly, the
final parameter we needed to establish in Run > Setup was the base time units. We chose
―Minutes‖ as it appeared to be the most practical in viewing the results of different processes.
At this point we were able to move onto the comparison of the original simulation model
and its patient throughput versus the patient throughput of the model that included an additional
nurse. To begin we ran the simulation model and saved the results as a ―.dat‖ file. This type of
final is binary and can be read by the Output Analyzer. Next we added an additional nurse to the
model by changing the ―Resource‖ data module to include one more. We ran the model for this
scenario and saved the results as a ―.dat‖ file.
We then began work with the Output Analyzer to compare the effects the control change
had on patient throughput. We started by clicking File > New to open a new data group. We
selected the two saved ‖dat.‖ files for the original model run and the additional nurse model run
by clicking the ―Add‖ button. By choosing Analyze > Compare Means we were able to view a
comparison table of our user-specified response output – patient throughput.

211
Experimentation Phase 2 (Four Scenarios)
We began the second phase of experimentation opening the simulation model given to us
by the UMass Process Improvement Team. At this point we checked to see if all of the run
parameters (e.g. run length, number of replications, etc.) matched what we had used in the first
phase of experimentation. Once we confirmed that they did we moved onto the next step in our
four scenario experimentation.
At this point, we were able to begin work in the Process Analyzer. To open the program
we went to Tools > Process Analyzer. Once it was running, we clicked File > New. A
―Scenario Properties‖ Window opened and we double clicked within it to add new scenarios. A
dialog box opened that required a ―Program File.‖ We browsed until we found the file we had
been using for our simulation. By clicking on the ―Scenario Properties‖ window three more
times we had four base scenarios to use within the Process Analyzer.
After the four bases were established we could now define each scenario. We did so by
going to Insert > Control and clicking on the ―Resources‖ we would be adjusting for each
scenario. For this project, we chose ―Nurse 1‖, ―Nurse 2‖, ―Bed 1‖, ―Bed 2‖, and ―Triage
Nurse.‖ In order to see the effects of these scenarios on patient throughput we clicked on Insert
> Response > User Specified > Patient Throughput. We actually defined this as an output before
opening the Process Analyzer by clicking Advanced Process > Statistic. In this tab, an
expression was needed. We right-clicked the expression tab to ―Build an Expression.‖ We
chose Entity > Number Out in the new window. Then we added together the three entries within
the model so that the expression looked like this:
EntitiesOut(Entity 1) + EntitiesOut(Patient Arrival) + EntitiesOut(Patient_Accuity_1)
After our ―Controls‖ and ―Responses‖ were established we entered the number of reps
for each scenario. We chose to stay with ―25‖ as that was what we used when testing the
original simulation model. Our next step in this process was to run the simulation for each
scenario. To do so we clicked the ―Play Button‖ at the top of the Process Analyzer application.

212
Once the simulation was done we were left with a table featuring each scenario and their
respective patient throughput (as an average of the 25 replications). From here we could view
this information in different formats by clicking Insert > Chart.
Experimentation Phase 3 (combinations Based on Four Input Variables)
The third phase of our experimentation required the use of OptQuest, an application
within Arena that seeks a combination of defined variables for maximizing or minimizing an
objective. To begin we clicked, Tools > OptQuest for Arena within our simulation model. A
window for OptQuest opened and we clicked ―New Optimization‖ on the bottom right-hand
corner. We were then prompted with a ―Controls‖ list for which we chose every Bed, Lab
Technician, Nurse, and Doctor within our simulation model. Because we wanted to see the
effects of these control combinations on patient throughput, we clicked Response > User
Specified > Output > Select All.
We also wanted to include some constraints on some of our controls so that the
combinations would not become too realistic. We chose our limit for staffing at 26 and our limit
for beds at 40. Also each one of our control variables had a limit of two – which meant there
couldn’t be a combination of more than 26 lab technicians, nurses, or doctors because there were
only 13 of these staff members to begin with. The number of beds constrained to 40 because
after talking with some nurses at Health Alliance, we were told the expected amount of beds a
nurse could take care of at a given time was four. At most we would have 10 Nurses in these
scenarios so a maximum of forty beds seemed reasonable.
After defining our controls, responses, and constraints we chose the number of
replications to take place. Within the ―Options‖ window, we set the ―Replications for
Simulation‖ to three to allow for some variation in results for each combination of controls. For
―Number of Simulations‖ we chose a maximum 400 simulations. In addition, we accepted the
―Automatic Stop‖ option, which meant that OptQuest would stop looking when it had not seen
significant improvement for 100 different scenarios in a row.
We then defined our objective in the ―Objectives‖ window to maximize the patient
throughput equation for our model:

213
EntitiesOut(Entity 1) + EntitiesOut(Patient Arrival) + EntitiesOut(Patient_Accuity_1)
Once everything was defined we clicked the green ―Optimize‖ button at the top of the
application and watched the results. When the 400 simulations finished, we were able to view a
graph of each simulation and its respective patient throughput response. In addition, the control
combination of the best simulation in terms of maximum patient throughput was also visible in
the form of a table. Lastly, we were able to see the best 25 control combinations for patient
throughput.

214
Appendix I: Experimentation Results
Experimentation Phase 1 (Original Model v. Plus One Nurse)
This table compares the patient throughput of the original simulation model and the same model
with one more nurse added to the ED staff.
Table 14: Two Scenario Comparison
Scenario Properties Control Response
Name Reps Nurse 1 Patient
Throughput
Original Model 25 1 1256
One Additional Nurse 25 2 1280
Patient Throughput ComparisonFigure 6 shows the responses of the original model compared to the
same model with an additional nurse. The patient throughput outputs represent the means of each
scenario over the course of 25 runs.
Figure 6: Patient Throughput Comparison
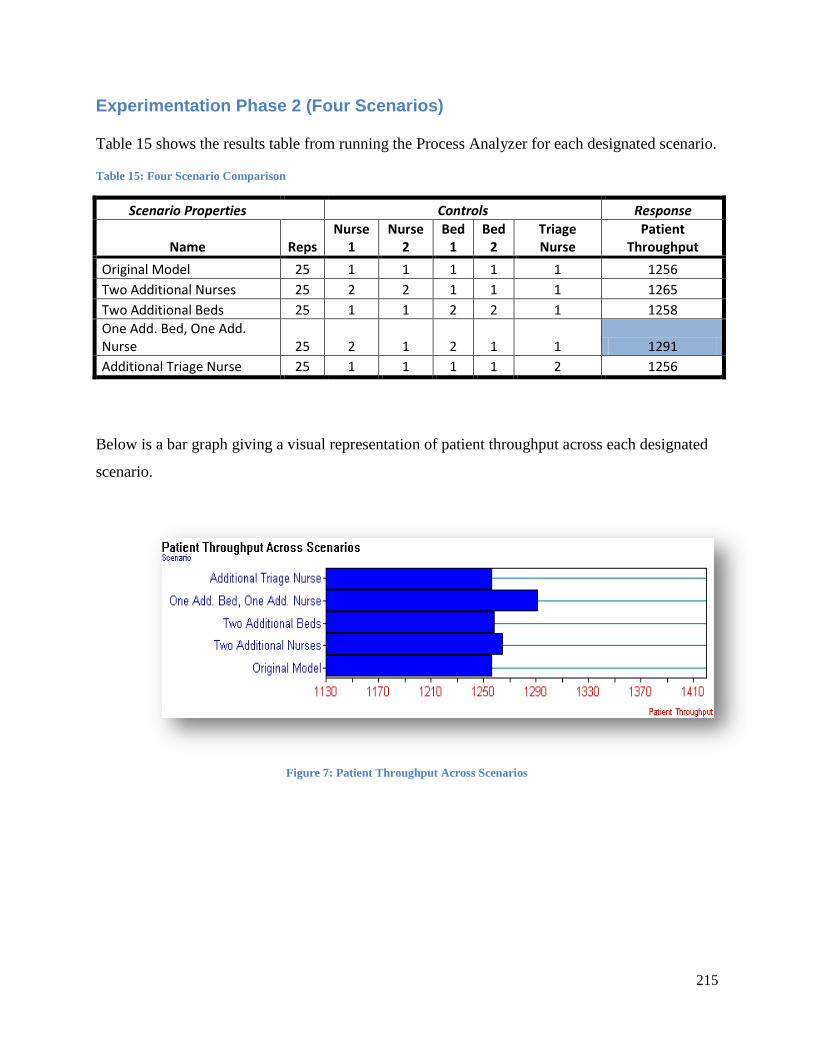
215
Experimentation Phase 2 (Four Scenarios)
Table 15 shows the results table from running the Process Analyzer for each designated scenario.
Table 15: Four Scenario Comparison
Scenario Properties Controls Response
Name Reps Nurse
1 Nurse
2 Bed
1 Bed
2 Triage Nurse
Patient Throughput
Original Model 25 1 1 1 1 1 1256
Two Additional Nurses 25 2 2 1 1 1 1265
Two Additional Beds 25 1 1 2 2 1 1258
One Add. Bed, One Add. Nurse 25 2 1 2 1 1 1291
Additional Triage Nurse 25 1 1 1 1 2 1256
Below is a bar graph giving a visual representation of patient throughput across each designated
scenario.
Figure 7: Patient Throughput Across Scenarios

216
Experimentation Phase 3 (Combinations Based on Four Input Variables)
After 400 different combinations of bed, nurse, physician, and lab technician inputs were
produced by OptQuest, combination number 172 yielded the highest patient throughput. Below
is the control list for run 172.
Table 16: Optimal Control Combinations
Controls
Control Name Best Value Control Name Best Value
Bed 1 1 Bed 5 2
Bed 10 1 Bed 6 1
Bed 11 2 Bed 7 2
Bed 12 1 Bed 8 2
Bed 13 1 Bed 9 1
Bed 14 1 MD 1 2
Bed 15 1 MD 2 1
Bed 16 2 MD 3 2
Bed 17 1 MD 4 1
Bed 18 1 MD 5 2
Bed 2 2 Nurse 1 2
Bed 20 1 Nurse 2 1
Bed 21 1 Nurse 3 1
Bed 22 1 Nurse 4 1
Bed 23 1 Nurse 5 2
Bed 24 2 Tech 1 2
Bed 25 2 Tech 2 1
Bed 3 2 Tech 3 2
Bed 4 2
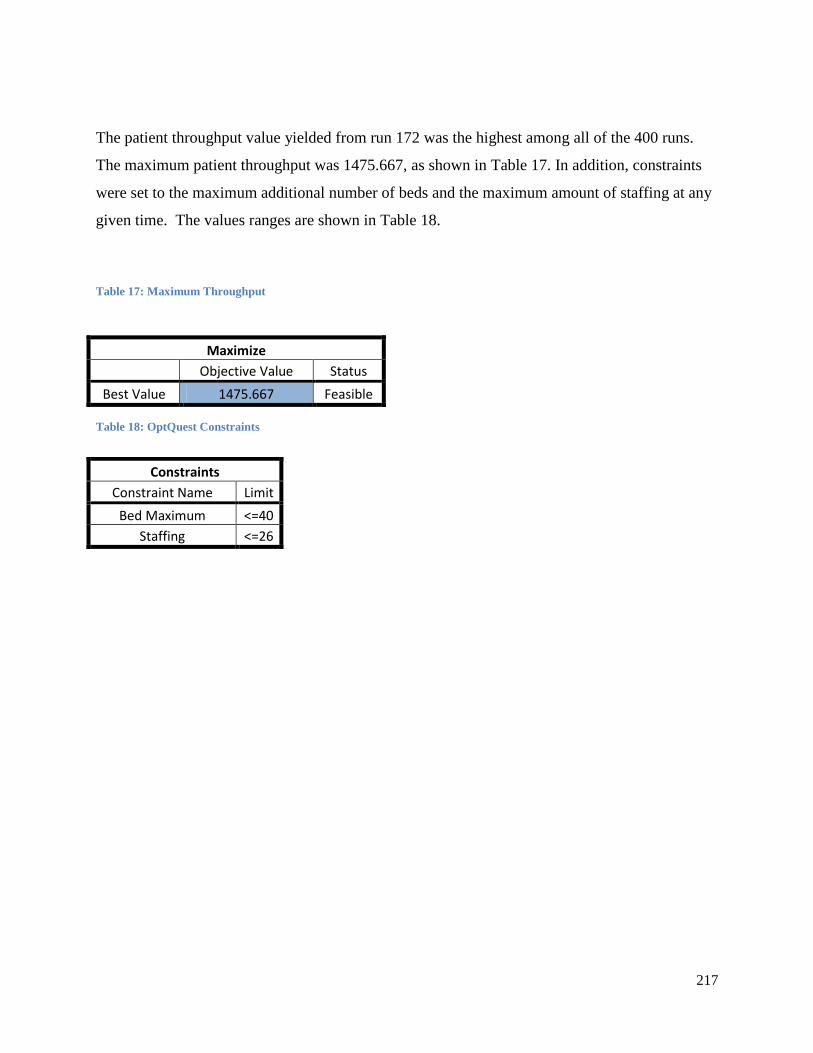
217
The patient throughput value yielded from run 172 was the highest among all of the 400 runs.
The maximum patient throughput was 1475.667, as shown in Table 17. In addition, constraints
were set to the maximum additional number of beds and the maximum amount of staffing at any
given time. The values ranges are shown in Table 18.
Table 17: Maximum Throughput
Table 18: OptQuest Constraints
Maximize
Objective Value Status
Best Value 1475.667 Feasible
Constraints
Constraint Name Limit
Bed Maximum <=40
Staffing <=26

218
Appendix J: Relationship Chart
Table 19: A Side Relationship Chart
Ambulance Entrance
Trauma Room
Treatment Rooms 3-
8
Treatment Rooms 9-
12
Treatment Rooms 14-16
Psych Rooms 17-19
A Side Nurses Station
Family Waiting Room
Clean Supply
Soiled Workroom
Ambulance
A I U U X O U U U
Entrance Trauma
U U U X A U U U Room
Treatment
U U X A O U U
Rooms 3-8 Treatment
U X E O U U
Rooms 9-12
Treatment
X I O U U
Rooms 14-16
Psych
O X U U
Rooms 17-19
A Side Nurses
U I I
Station Family
U U
Waiting Room
Clean
O Supply
Soiled
Workroom

219
Table 20: B Side Relationship Chart
Treatment Waiting Triage Registration
B Side Nurses
Housekeeping
Nurse Manager Break Clean Walk In
Rooms 20-25 Room Station Office Room Supply Entrance
Treatment
U U U A O U I U U
Rooms 20-25 Waiting
A A E U U U U A
Room
Triage
A O U U U U U
Registration
E U U U U U
B Side Nurses
U O U I X
Station
Housekeeping
U U I U
Nurse Manager
U U X
Office Break
U U
Room Clean
U
Supply Walk In
Entrance

220
Appendix K: Parsed Data
Patient Patterns Over Time
Figure 8: Monthly Patient Patterns
Figure 9: Daily Patient Patterns
3400.00
3500.00
3600.00
3700.00
3800.00
3900.00
4000.00
4100.00
Month
Monthly Patient Patterns
600062006400660068007000720074007600
Weekday
Daily Patient Patterns
Patients Per
Month
January 3929.00
February 3669.00
March 3974.67
April 3821.67
May 4011.67
June 3914.33
July 4002.33
August 3865.67
September 3840.33
October 4024.33
November 3784.67
December 3825.67
Patients By Day
Monday 7341
Tuesday 7020.5
Wednesday 6731.5
Thursday 6471.5
Friday 6532
Saturday 6615
Sunday 6767

221
Figure 10: Monthly Mental Health Patient Patterns
0.00
50.00
100.00
150.00
200.00
250.00
300.00
Month
Monthly Mental Health
Patient Patterns
Mental Health
Patients Per
Month
January 234.67
February 199.33
March 234.67
April 240.00
May 242.67
June 221.67
July 227.67
August 223.00
September 237.67
October 242.67
November 204.67
December 194.00
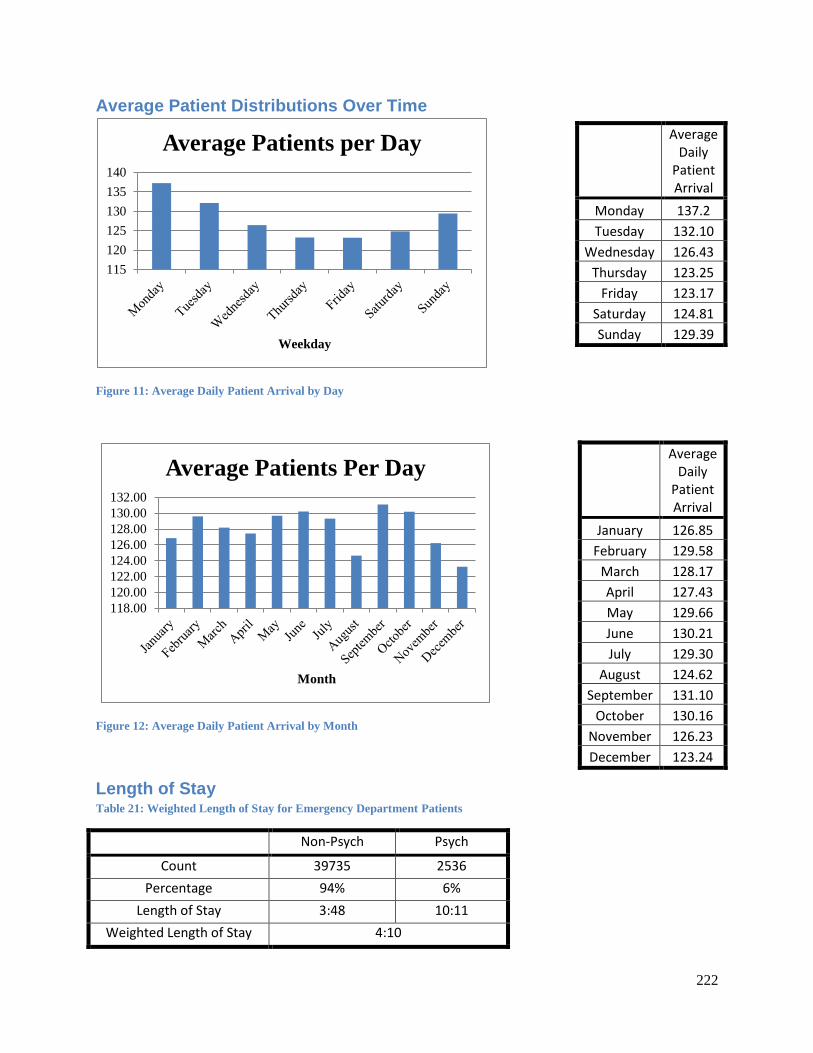
222
Average Patient Distributions Over Time
Figure 11: Average Daily Patient Arrival by Day
Figure 12: Average Daily Patient Arrival by Month
Length of Stay Table 21: Weighted Length of Stay for Emergency Department Patients
Non-Psych Psych
Count 39735 2536
Percentage 94% 6%
Length of Stay 3:48 10:11
Weighted Length of Stay 4:10
115
120
125
130
135
140
Weekday
Average Patients per Day
118.00
120.00
122.00
124.00
126.00
128.00
130.00
132.00
Month
Average Patients Per Day
Average Daily
Patient Arrival
Monday 137.2
Tuesday 132.10
Wednesday 126.43
Thursday 123.25
Friday 123.17
Saturday 124.81
Sunday 129.39
Average Daily
Patient Arrival
January 126.85
February 129.58
March 128.17
April 127.43
May 129.66
June 130.21
July 129.30
August 124.62
September 131.10
October 130.16
November 126.23
December 123.24
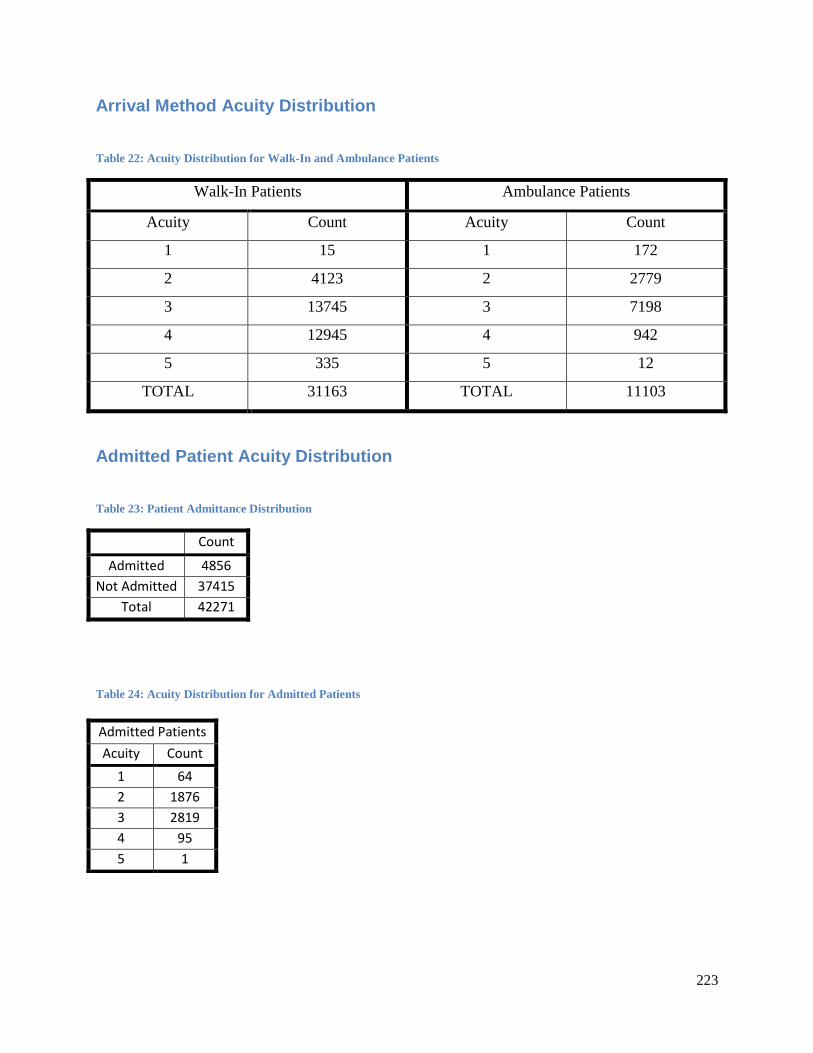
223
Arrival Method Acuity Distribution
Table 22: Acuity Distribution for Walk-In and Ambulance Patients
Walk-In Patients Ambulance Patients
Acuity Count Acuity Count
1 15 1 172
2 4123 2 2779
3 13745 3 7198
4 12945 4 942
5 335 5 12
TOTAL 31163 TOTAL 11103
Admitted Patient Acuity Distribution
Table 23: Patient Admittance Distribution
Count
Admitted 4856
Not Admitted 37415
Total 42271
Table 24: Acuity Distribution for Admitted Patients
Admitted Patients
Acuity Count
1 64
2 1876
3 2819
4 95
5 1

224
Treatment Distribution
Table 25: Acuity Distribution for Treatments
Table 26: Total Treatments Performed
Count
CT Scan 6665
Diagnostic lmaging 16138
EKG 11795
MRI 476
None 19883
Treatment Combinations
Table 27: Treatment Combinations
If CT If Diagnostic lmaging
If EKG If MRI
Diagnostic lmaging
3292 CT 3292 CT 3516 CT 340
EKG 3516 EKG 7923 Diagnostic lmaging
7923 Diagnostic lmaging
333
MRI 340 MRI 333 MRI 401 EKG 401
Acuity CT Scan Diagnostic Imaging EKG MRI
1 48 109 109 3
2 1872 3639 4153 197
3 4303 7387 7275 263
4 439 4995 255 13
5 3 6 1 0
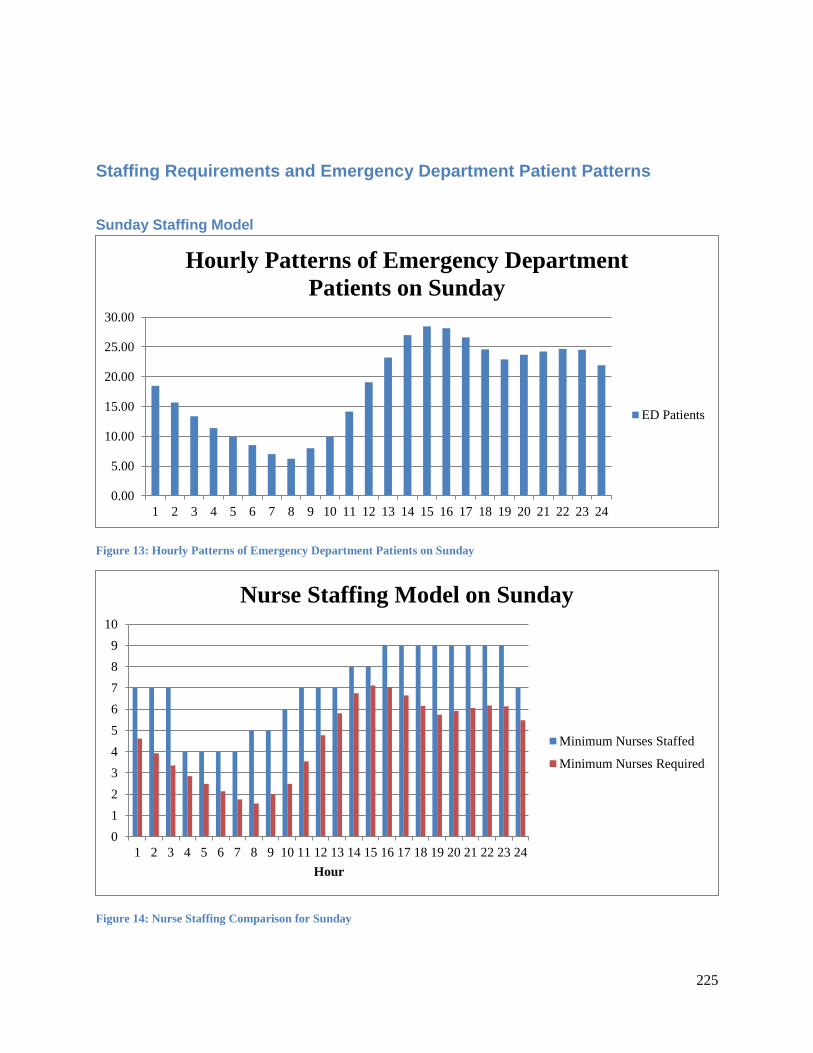
225
Staffing Requirements and Emergency Department Patient Patterns
Sunday Staffing Model
Figure 13: Hourly Patterns of Emergency Department Patients on Sunday
Figure 14: Nurse Staffing Comparison for Sunday
0.00
5.00
10.00
15.00
20.00
25.00
30.00
1 2 3 4 5 6 7 8 9 10 11 12 13 14 15 16 17 18 19 20 21 22 23 24
Hourly Patterns of Emergency Department
Patients on Sunday
ED Patients
0
1
2
3
4
5
6
7
8
9
10
1 2 3 4 5 6 7 8 9 10 11 12 13 14 15 16 17 18 19 20 21 22 23 24
Hour
Nurse Staffing Model on Sunday
Minimum Nurses Staffed
Minimum Nurses Required

226
Monday Staffing Model
Figure 15: Hourly Patterns of Emergency Department Patients on Mondays
Figure 16: Nurse Staffing Comparison for Monday
0.00
5.00
10.00
15.00
20.00
25.00
30.00
1 2 3 4 5 6 7 8 9 10 11 12 13 14 15 16 17 18 19 20 21 22 23 24
Hour
Hourly Patterns of Emergency Department
Patients on Mondays
ED Patients
0
1
2
3
4
5
6
7
8
9
10
1 2 3 4 5 6 7 8 9 10 11 12 13 14 15 16 17 18 19 20 21 22 23 24
Hour
Nurse Staffing Model on Monday
Minimum Nurses Staffed
Minimum Nurses Required

227
Tuesday Staffing Model
Figure 17: Hourly Patterns of Emergency Department Patients on Tuesdays
Figure 18: Nurse Staffing Comparison for Tuesday
0.00
5.00
10.00
15.00
20.00
25.00
30.00
1 2 3 4 5 6 7 8 9 10 11 12 13 14 15 16 17 18 19 20 21 22 23 24
Hour
Hourly Patterns of Emergency Department
Patients on Tuesdays
ED Patients
0
1
2
3
4
5
6
7
8
9
10
1 2 3 4 5 6 7 8 9 10 11 12 13 14 15 16 17 18 19 20 21 22 23 24
Hour
Nurse Staffing Model on Tuesday
Minimum Nurses Staffed
Minimum Nurses Required

228
Wednesday Staffing Model
Figure 19: Hourly Patterns on Emergency Department Patients on Wednesdays
Figure 20: Nurse Staffing Comparison for Wednesday
0.00
5.00
10.00
15.00
20.00
25.00
30.00
1 2 3 4 5 6 7 8 9 10 11 12 13 14 15 16 17 18 19 20 21 22 23 24
Hour
Hourly Patterns of Emergency Department
Patients on Wednesdays
ED Patients
0
1
2
3
4
5
6
7
8
9
10
1 2 3 4 5 6 7 8 9 10 11 12 13 14 15 16 17 18 19 20 21 22 23 24
Hour
Nurse Staffing Model on Wednesday
Minimum Nurses Staffed
Minimum Nurses Required

229
Thursday Staffing Model
Figure 21: Hourly Patterns of Emergency Department Patients on Thursdays
Figure 22: Nurse Staffing Comparison for Thursday
0.00
5.00
10.00
15.00
20.00
25.00
30.00
1 2 3 4 5 6 7 8 9 10 11 12 13 14 15 16 17 18 19 20 21 22 23 24
Hour
Hourly Patterns of Emergency Department
Patients on Thursdays
ED Patients
0
1
2
3
4
5
6
7
8
9
10
1 2 3 4 5 6 7 8 9 10 11 12 13 14 15 16 17 18 19 20 21 22 23 24
Hour
Nurse Staffing Model on Thursday
Minimum Nurses Staffed
Minimum Nurses Required
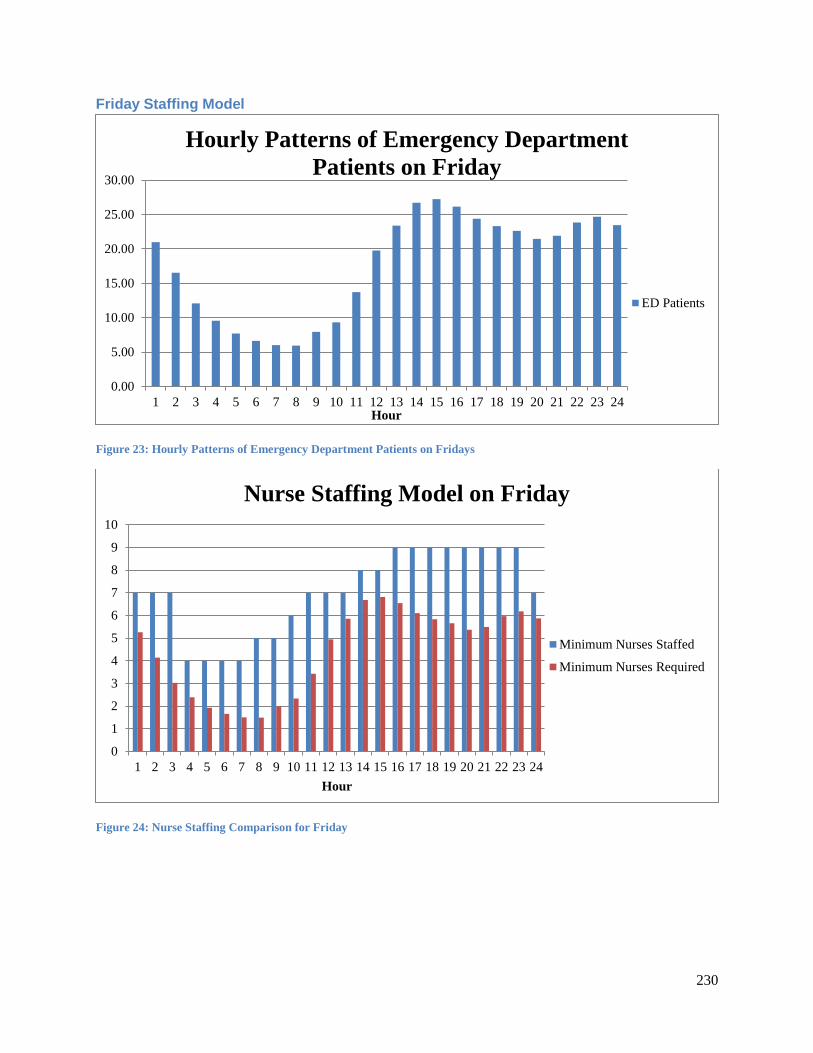
230
Friday Staffing Model
Figure 23: Hourly Patterns of Emergency Department Patients on Fridays
Figure 24: Nurse Staffing Comparison for Friday
0.00
5.00
10.00
15.00
20.00
25.00
30.00
1 2 3 4 5 6 7 8 9 10 11 12 13 14 15 16 17 18 19 20 21 22 23 24Hour
Hourly Patterns of Emergency Department
Patients on Friday
ED Patients
0
1
2
3
4
5
6
7
8
9
10
1 2 3 4 5 6 7 8 9 10 11 12 13 14 15 16 17 18 19 20 21 22 23 24
Hour
Nurse Staffing Model on Friday
Minimum Nurses Staffed
Minimum Nurses Required
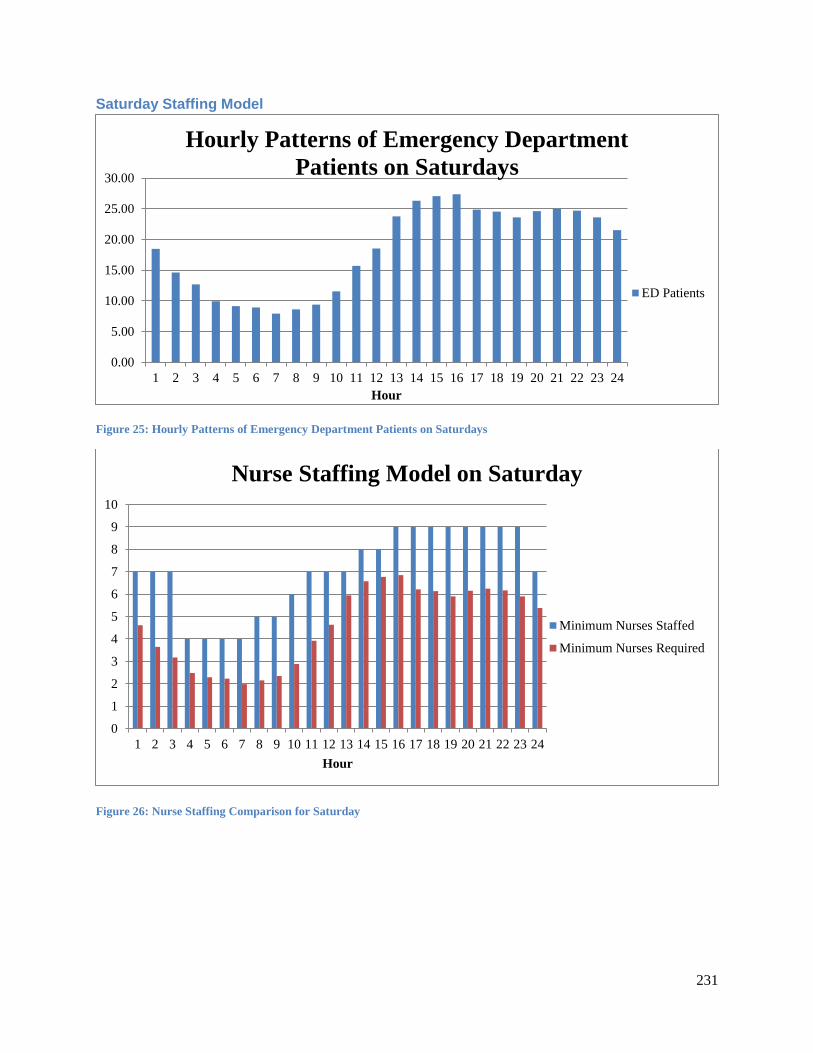
231
Saturday Staffing Model
Figure 25: Hourly Patterns of Emergency Department Patients on Saturdays
Figure 26: Nurse Staffing Comparison for Saturday
0.00
5.00
10.00
15.00
20.00
25.00
30.00
1 2 3 4 5 6 7 8 9 10 11 12 13 14 15 16 17 18 19 20 21 22 23 24
Hour
Hourly Patterns of Emergency Department
Patients on Saturdays
ED Patients
0
1
2
3
4
5
6
7
8
9
10
1 2 3 4 5 6 7 8 9 10 11 12 13 14 15 16 17 18 19 20 21 22 23 24
Hour
Nurse Staffing Model on Saturday
Minimum Nurses Staffed
Minimum Nurses Required