Technical Supplement: Emergency Department Patient Survey ...
31
Technical Supplement: Emergency Department Patient Survey, 2014 -15 February 2016 Revision History Version Issue Date Author Comments 1.0 March 2016 Jason Boyd Second EDPS technical supplement released – updated for the 2014-15 survey year
Transcript of Technical Supplement: Emergency Department Patient Survey ...
Technical Supplement: Emergency Department Patient Survey, 2014-15
February 2016
Revision History
Version Issue Date Author Comments
1.0 March 2016 Jason Boyd Second EDPS technical supplement released – updated for the 2014-15 survey year

For Official Use Only
Bureau of Health Information | Technical supplement: Emergency Department Patient Survey 2014-15 i
Contents
The NSW Patient Survey Program ..................................................................................................................... 1
The Emergency Department Patient Survey ...................................................................................................... 2
Organisational roles in producing survey samples ............................................................................................. 3
Inclusion criteria .................................................................................................................................................. 4
Phase 1 screening ......................................................................................................................................... 4
Phase 2 screening ......................................................................................................................................... 5
Drawing of the sample ................................................................................................................................... 5
Data Management .............................................................................................................................................. 8
Data Analysis ...................................................................................................................................................... 9
Completeness of survey questionnaires ........................................................................................................ 9
Calculation of response rate .......................................................................................................................... 9
Weighting of data ........................................................................................................................................... 9
Demographic characteristics of respondents to EDPS .................................................................................. 9
Reporting .......................................................................................................................................................... 15
Confidentiality ............................................................................................................................................... 17
Statistical Analysis ....................................................................................................................................... 17
Calculation of percentages .......................................................................................................................... 19
Appendix 1 ........................................................................................................................................................ 20
Facilities included in the EDPS sampling frame .......................................................................................... 20
Appendix 2 ........................................................................................................................................................ 22
Missing and ‘Don’t know’ responses ............................................................................................................ 22
Appendix 3 ........................................................................................................................................................ 26
Derived measures ........................................................................................................................................ 26
Suggested Citation: Technical Supplement: Emergency Department Patient Survey, 2014-15. Bureau of
Health Information. Sydney (NSW); 2016.
Date of publication: March 2016
Please note that there is the potential for minor revisions of information in this report. Please check the online version at www.bhi.nsw.gov.au for any amendments.

Bureau of Health Information | Technical supplement: Emergency Department Patient Survey 2014-15 1
The NSW Patient Survey Program The NSW Patient Survey Program began surveying patients in NSW public facilities from 2007. From 2007
to mid-2012, the program was co-ordinated by the NSW Ministry of Health using questionnaires obtained
under license from NRC Picker. Ipsos Social Research Institute Ltd (Ipsos) was contracted to manage the
logistics of the survey program. Responsibility for the Patient Survey Program was transferred from the
Ministry of Health to the Bureau of Health Information (BHI) in July 2012, with Ipsos continuing as the
contracted partner to manage the logistics.
The aim of the program is to measure and report on patients’ experiences of care in public health facilities in
New South Wales (NSW), on behalf of the NSW Ministry of Health and the local health districts (LHDs). The
results are used as a source of performance measurement for individual hospitals, LHDs and NSW as a
whole.
This document outlines the sampling methodology, data management and analysis of the 2014-15
Emergency Department Patient Survey (EDPS).
For more information on how to interpret results and statistical analysis of differences between hospitals,
LHDs or NSW, please refer to the “Guide to Interpreting Differences” at
www.bhi.nsw.gov.au/nsw_patient_survey_program.

Bureau of Health Information | Technical supplement: Emergency Department Patient Survey 2014-15 2
The Emergency Department Patient Survey In 2013, the EDPS was the second survey to be sent to patients as part of the revised NSW Patient Survey
Program, after the Adult Admitted Patient Survey. In 2014, the EDPS was conducted for the second time,
covering the period of April 2014 to March 2015.
Significant changes were made to the questionnaire content between the 2013-14 and 2014-15
questionnaire versions. These changes were made to improve navigation through the questionnaire and in
response to the latest stakeholder needs. These changes were informed by an analysis of 2013/14 results,
specifically item non-response to survey questions, percentage of invalid responses to questions, floor and
ceiling effects (based on the mean, standard deviation and skewness of results), and correlation to other
questions in the questionnaire.
Changes were also made to the sampling for the survey due to lower response rates seen for younger
patients in the EDPS. In order to ensure that sufficient numbers of younger patients were responding to allow
reporting, the proportion of younger patients sampled in the survey was increased. It was expected that,
while this would have a negative impact on unadjusted response rates, it would improve the overall
representativeness of respondents to the survey.

Bureau of Health Information | Technical supplement: Emergency Department Patient Survey 2014-15 3
Organisational roles in producing survey samples The survey program assures patients that their responses will be confidential and that staff at hospitals will
not be able to determine who gave which response. BHI does this through a number of mechanisms,
including:
Data suppression (results for fewer than 30 responses are suppressed)
Reporting aggregated results
De-identification of patient comments
Segregation of roles when constructing the survey samples (see below).
The sampling method for the NSW Patient Survey Program requires collaboration between staff at BHI,
Ipsos SRI and the Ministry of Health’s Health Systems Performance Information and Reporting Branch
(HSPIRB) (see Figure 1). This survey used data obtained from the Health Information Exchange (HIE).
BHI has access to confidentialised unit record data from selected tables of the HIE database. Use of an
encrypted patient number allows deduplication at the patient level within a hospital. For the EDPS, sampling
frames are defined separately for each month, with the date of emergency department (ED) attendance is
used to define eligible records. Sample sizes for each included hospital are calculated in advance, as
defined later in this report.
Figure 1: Organisational responsibilities in sampling and survey processing, Emergency Department Patient Survey, 2014-15
BHI
• Determine inclusion and exclusion rules in association with stakeholders
• Develop sampling strategy including strata and included facilities based on requests from stakeholders and availability of data in the database available for sampling (HIE in the case of admitted patient surveys)
• Calculate target sample sizes by strata within facilities and provide to HSIPRB
• Extract monthly data from HIE, create interim sampling frame following phase 1 screening and send via secure file transfer to HSIPRB
HSIPRB
• Add names and addresses to interim sampling frame
• Undergo phase 2 cleaning and exclusions
• Generate samples based on sampling targets provided by BHI
• Provide mailing list via secure file transfer to Ipsos
Ipsos
• Administer the survey fieldwork, collate results, clean results
• Provide datafile of results to BHI for analysis, via secure file transfer, once all name and address information is removed

Bureau of Health Information | Technical supplement: Emergency Department Patient Survey 2014-15 4
Inclusion criteria
Phase 1 screening
Emergency department patient data pass through two phases of cleaning. The first phase of screening is
applied by BHI. Many of these criteria are developed in conjunction with advice of stakeholders.
Inclusions
Patients who visited an emergency department in a NSW public hospital with a peer group
classification of A1, A2, A3, B, C1 or C2.
Exclusions
Patients who were dead on arrival or died in ED (mode of separation of 8 and 3 respectively) were
excluded from the sample.
A series of further exclusion criteria were applied to take into account a range of factors including: the
potentially high vulnerability of particular patient groups and/or patients with particularly sensitive reasons for
admission; certain patients’ ability to answer questions about their experiences; and the relevance of the
survey questions to particular patient groups.
The effectiveness of this screening is reduced for the EDPS compared to the Adult Admitted Patient Survey
(AAPS) due to the variables in the dataset. For example, the ED dataset does not contain robust diagnosis
(ICD-10-AM) information that allows these exclusions. Because of this, further screening to exclude sensitive
groups can only be done for patients subsequently admitted to hospital. In addition, ED patients
subsequently admitted to hospital (mode of separation of 1,10,11,12 or 13) with the following procedures or
diagnoses that were recorded for their inpatient stay were omitted:
admitted for a termination of pregnancy procedure [35643-03];
treated for maltreatment syndromes [T74] in any diagnosis field, including neglect or abandonment,
physical abuse, sexual abuse, psychological abuse, other maltreatment syndromes and
maltreatment syndrome, unspecified;
treated for contraceptive management [Z30] in any diagnosis field, including general counselling and
advice on contraception, surveillance of contraceptive drugs, surveillance of contraceptive device,
other contraceptive management and contraceptive management, unspecified;
patients with a diagnosis of stillborn baby [Z37] in any diagnosis field (including single stillbirth, twins,
one liveborn and one stillborn, twins, both stillborn and other multiple births, some liveborn) were
excluded.
In addition, where ED patients were admitted to hospital, they were excluded if in the subsequent
admission they had a mode of separation of death.
From October 2014, the following additional exclusions were applied:
Intentional self-harm: ICD10 code between X60 and X84
Sequelae of intentional self-harm: ICD10 code = Y87.0
Unspecified event, undetermined intent: ICD10 code commences with Y34
Suicidal ideation: ICD10 code = R45.81
Family history of other mental and behavioural disorders: ICD10 code commences with Z81.8

Bureau of Health Information | Technical supplement: Emergency Department Patient Survey 2014-15 5
Personal history of self-harm: ICD10 code commences with Z91.5.
Where patients had multiple visits within the sampling month, their most recent hospital visit was kept. The
questionnaire asks patients to respond to the survey based on their most recent ED visit in a particular
month.
Phase 2 screening
BHI provides the interim sampling frame to HSIPRB, who add patient name and address information. Data
then undergo a second phase of screening. This involves exclusions for administrative/logistical reasons, or
where death had been recorded after discharge for the stay used for sample selection but before the final
sampling frame is prepared.
Exclusions
Invalid address (including those with addresses listed as hotels, motels, nursing homes, Community
Services, Mathew Talbot hostel, 100 William Street, army quarters, jails, unknown, NFA)
Invalid name (including twin, baby of, etc.)
Invalid date of birth
On the ‘do not contact’ list
Sampled in the previous six months for any BHI patient survey currently underway
Had a death recorded according to the NSW Birth Deaths and Marriages Registry and/or Agency
Performance and Data Collection, prior to the sample being provided to Ipsos.
The data following these exclusions are defined by BHI as the final sampling frame.
Drawing of the sample
Survey design
A stratified sample design was applied, with each facility defined as a stratum. Within each facility, patients
are further stratified by the following variables:
Age – aged 0-17, 18-49 or 50 years and over, based on the age variable.
Although sampling is undertaken monthly, sample size calculations are based on whether reporting is on a
quarterly or annual basis. All facilities in C1 or C2 peer groups were sampled for annual reporting, whereas
facilities in the remaining peer groups were sampled for quarterly reporting. For the purposes of sampling,
the population of Sydney and Sydney Eye Hospitals were combined. In addition:
all patients at the two children’s hospitals were included in the ’under 18’ stratum for sampling
purposes
children under 18 years admitted to A3 (Ungrouped Acute - tertiary referral) facilities were included
in the ‘18 to 49’ age stratum because of very small numbers in the under 18 age group for these
three hospitals.
Patients were selected within strata using simple random sampling without replacement. Sample sizes were
defined at the facility level (or by patient type as described within the next section), with proportional
sampling of strata within facilities/patient types.

Bureau of Health Information | Technical supplement: Emergency Department Patient Survey 2014-15 6
The monthly targets by strata for the 2014-15 sampling period were based on the emergency department
patient data from 2013 (after Phase 1 of the screening process).
The required sample size for each facility (i) within reporting stratum (j) was estimated using Equation 1.
Equation 1
( )
Where:
sij = estimated sample size for facility i and stratum j
2 = tabulated value of chi-squared with one degree of freedom at 5% level of significance (3.841)
Nij = population in the reporting stratum j of facility i, estimated using data from the 2013 calendar
year with phase 1 exclusion criteria applied, aggregated to correspond with the reporting period (i.e.
by quarter or full year)
P = expected proportion giving the most positive response to the question on satisfaction with overall
care (0.8), based on previous levels of response to patient surveys
d = degree of accuracy of the 95% confidence interval expressed as a proportion (±0.07).
The sample size calculation aimed for a confidence interval around an expected proportion of 0.8 of ±0.07 at
the reporting strata level within each facility. Sample sizes were then allocated proportionately across strata
internal to these reporting strata.
Finally, cell sample sizes are increased to account for fewer than 100% of patients responding to the survey.
This was done by dividing the expected sample size by the expected response rate. Response rates for
each stratum was estimated based on response rates observed in the 2013-14 survey (Table 1):
Table 1: Response rates used when calculating the targets for mailing, AAPS 2014
Stratum Quarterly reporting (A and B peer groups)
Annual reporting (C peer groups)
0-17 years 25% 25%
18-49 years 25% 20%
50+ years 55% 50%
In addition, monthly mailing targets were changed from variable (depending on expected monthly patient
numbers) to fixed monthly numbers (based on annual sample sizes divided by 12 months). A minimum
monthly target of four patients was applied to all strata (e.g. if calculations require one, two or three patients
in any stratum, this will be increased to four patients).
The adjusted sample sizes file was provided to HSIPRB as the targets for the 2014-15 survey. For each
month of sampling, HSPIRB randomly selected patients within each stratum, according to mailing targets
provided by BHI.
Notes:

Bureau of Health Information | Technical supplement: Emergency Department Patient Survey 2014-15 7
The sample size calculation based on Equation 1 (page 7) assumes simple random sampling,
whereas a stratified survey design was used. This, and differences in the response rate between
strata, may result in some estimates having wider confidence intervals than expected, even when
the prevalence is 80%.
For the purposes of sampling and reporting, the population of Sydney and Sydney Eye Hospitals
were combined as one facility.

Bureau of Health Information | Technical supplement: Emergency Department Patient Survey 2014-15 8
Data Management Data collection
Upon completion of a survey questionnaire, the respondent returns or submits the completed survey
(depending on whether they completed the paper-based questionnaire or the online questionnaire) to Ipsos.
If a paper form is returned, Ipsos then scans in the answers electronically and manually enters free text
fields.
Once all of the data is collated into a single dataset, all names and addresses are removed from the dataset.
Also, all text entry fields are checked for potential identifiers (names of patients, names of doctors, telephone
numbers, etc.) and any that are found are replaced with “XXXX”.
Following this, each record is checked for any errors in completion and reasonable adjustments (known as
‘cleaning’) are made to the dataset, for example, removing responses where the patient has not correctly
followed questionnaire instructions or providing multiple answers to a single response question.
At the end of this process, Ipsos uses a secure NSW Ministry of Health system to transfer the data from their
servers to BHI’s secure servers, all of which are password protected with limited staff access.
At no stage do BHI, who analyse the data, have access to the names and contact details of the respondents.
This ensures respondent answers remain confidential and identifying data can never be publicly released.
Bureau of Health Information | Technical supplement: Emergency Department Patient Survey 2014-15 9
Data Analysis
Completeness of survey questionnaires
In EDPS 2014-15, the completeness of responses was very high, with 99% of respondents answering more
than 77 questions and 95% answering more than 79 questions, out of the 93 questions in the questionnaire.
Fifteen respondents answered none of the questions, with the exception of the two free-text questions at the
end of the questionnaire – these respondents were excluded from further analysis.
Calculation of weighted response rate
The response rate is the proportion of people sampled in the survey that actually completed and returned
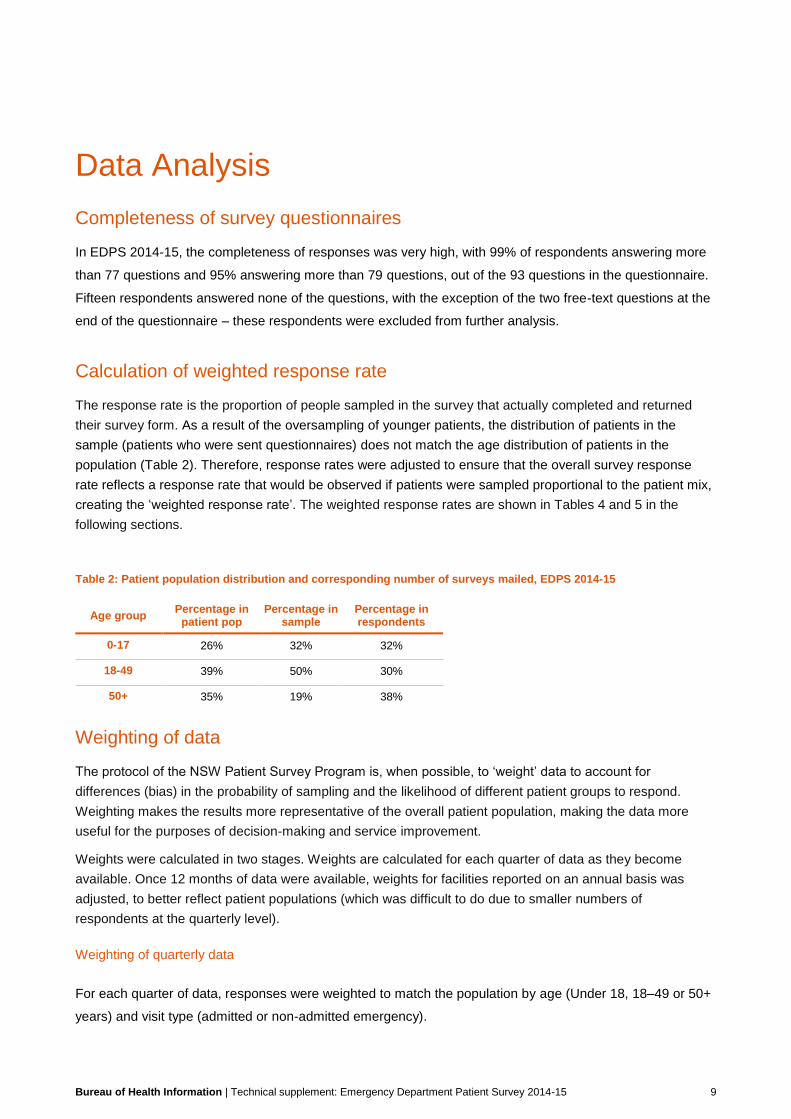
their survey form. As a result of the oversampling of younger patients, the distribution of patients in the
sample (patients who were sent questionnaires) does not match the age distribution of patients in the
population (Table 2). Therefore, response rates were adjusted to ensure that the overall survey response
rate reflects a response rate that would be observed if patients were sampled proportional to the patient mix,
creating the ‘weighted response rate’. The weighted response rates are shown in Tables 4 and 5 in the
following sections.
Table 2: Patient population distribution and corresponding number of surveys mailed, EDPS 2014-15
Age group Percentage in
patient pop Percentage in
sample Percentage in respondents
0-17 26% 32% 32%
18-49 39% 50% 30%
50+ 35% 19% 38%
Weighting of data
The protocol of the NSW Patient Survey Program is, when possible, to ‘weight’ data to account for
differences (bias) in the probability of sampling and the likelihood of different patient groups to respond.
Weighting makes the results more representative of the overall patient population, making the data more
useful for the purposes of decision-making and service improvement.
Weights were calculated in two stages. Weights are calculated for each quarter of data as they become
available. Once 12 months of data were available, weights for facilities reported on an annual basis was
adjusted, to better reflect patient populations (which was difficult to do due to smaller numbers of
respondents at the quarterly level).
Weighting of quarterly data
For each quarter of data, responses were weighted to match the population by age (Under 18, 18–49 or 50+
years) and visit type (admitted or non-admitted emergency).

Bureau of Health Information | Technical supplement: Emergency Department Patient Survey 2014-15 10
Data were weighted at facility level for hospitals that were sampled for quarterly reporting (peer group
hospitals A1, A2, A3 and B) and at LHD level for hospitals that were sampled for annual reporting (peer
group hospitals C1 and C2). Methods for weighting are described in the following pages.
Calculating quarterly response weights
Interim quarterly response weights were calculated as:
(1)
where:
denotes the population (i.e. total number of patients eligible for the survey) of the ith facility in the jth age
group. Eligible patient numbers were based on the number of patients following the second phase of
screening undertaken by the Ministry of Health.
denotes the sample size (i.e. number of respondents) of the ith facility in the jth age group.
If the stratum cell size within a facility was five or fewer, then cells within that facility were aggregated for
weighting purposes by grouping across age group.
The interim quarterly weights were then passed through the GREGWT macro, a survey-specific SAS
program developed by the ABS to assist with weighting of complex survey data1. It uses iterative proportional
fitting to ensure that the weights at the margins agreed with the population totals even though it is often
impossible for the weights to equal the population at the individual cell level. The marginal totals specified
were:
Benchmark 1: Facility (with annually-reported facilities within the same LHD combined)
Benchmark 2: Peer group
Benchmark 3: Peer group (with C1 and C2 facilities combined) x age (with some strata combined –
see below)
Benchmark 4: Peer group (with C1 and C2 facilities combined) x visit type
1 Bell, P. (2000) Weighting and Standard Error Estimation for ABS Household Surveys, Australian Bureau of
Statistics Methodology Advisory Committee Paper. Canberra.

Bureau of Health Information | Technical supplement: Emergency Department Patient Survey 2014-15 11
For Benchmark 3, age strata were combined for cells where there were very few respondents. These cells
were combined, within each facility, as follows:
Across all age groups for all admitted patients
Across all age groups in C facilities in FWLHD (Quarter 2 only)
Across Under 18 and 18-49 age groups in C facilities in FWLHD in (Quarters 3 and 1 only)
Across Under 18 and 18-49 age groups in C facilities in WSLHD in (Quarter 3 only)
A lower bound of one was specified in the macro. Each quarter of data was weighted separately using this
process. Interim quarterly weights were used as initial response weights. Weights generated using the
GREGWT macro were trimmed to 400 to avoid extreme weights. The trimming of quarterly response weights
applied to 118 respondents (0.6% of all respondents).
Once four quarters of data were available, these were aggregated and the weights for facilities sampled on
the basis of annual reporting were adjusted to allow reporting at the facility level. The GREGWT macro was
used, in two stages, to ensure agreement of weights with populations at the margins.
Firstly, interim annual weights were calculated for the facilities sampled on the basis of annual reporting, by
using the GREGWT macro with the following benchmarks.
Benchmark 1: Facility x age stratum
Benchmark 2: Quarter x LHD
Benchmark 3: Quarter x age stratum
Benchmark 4: Quarter x peer group
A lower bound of one was specified in the macro. The interim quarterly weights were used as initial response
weights.
In the second stage, annual response weights were adjusted to account for disproportionate sampling of
admitted emergency patients (which occurred, inadvertently, during sampling) using the GREGWT macro.
For the final annual weights, the margins were specified as follows:
Benchmark 1: Quarter x facility (with annually-reported facilities within the same LHD combined)
Benchmark 2: Peer group
Benchmark 3: LHD
Benchmark 4: Facility
Benchmark 5: Age stratum
Benchmark 6: Visit type
Benchmark 7: Peer group x age stratum
Benchmark 8: Peer group x visit type
Benchmark 9: LHD x age stratum
Benchmark 10: LHD x visit type
Benchmark 11: Facility x age stratum
Benchmark 12: Facility x visit type (with annually-reported facilities combined)

Bureau of Health Information | Technical supplement: Emergency Department Patient Survey 2014-15 12
A lower bound of one was specified in the macro. Interim annual weights generated in the first stage were
used as initial response weights. Weights generated using the GREGWT macro were trimmed to 400 to
avoid extreme weights. The trimming of annual response weights applied to 122 respondents (0.7% of all
respondents).
Analysis of weights
As part of the weighting process, an investigation of the weights is undertaken for each quarter separately to
ensure that undue weight is not applied to individual responses. The two most important factors considered
are the ratio of the maximum to median weight, particularly at the facility level, and the design effect.
The design effect (DEFF) was calculated for each LHD and overall, for each quarter and for the four quarters
combined. The DEFF, estimated as (1+coefficient of variance (weights)2), compares the variance of
estimates obtained from the stratified sample used with the variance expected for a simple random sample.
Sample sizes, weighted response rates and DEFFs based on the 12 months of data are shown in Table 3
(by LHD and NSW) and Table 4 (by facility).
Table 3: Sample size, response rates and design effects (DEFF) by LHD and overall, EDPS 2014-15
LHD Surveys Mailed Survey
Responses Weighted
Response Rate DEFF
Central Coast 3131 755 30% 1.4
Far West 444 75 24% 1.3
Hunter New England 12605 2632 26% 1.5
Illawarra Shoalhaven 4488 1103 30% 1.5
Mid North Coast 4343 1027 29% 1.6
Murrumbidgee 3412 710 25% 1.5
Nepean Blue Mountains 2976 657 27% 1.3
Northern NSW 5301 1211 29% 1.4
Northern Sydney 6809 1927 33% 1.7
South Eastern Sydney 6294 1513 28% 1.4
South Western Sydney 7375 1442 23% 1.3
Southern NSW 2677 640 29% 1.3
St Vincent's Health Network 1640 309 25% 1.3
Sydney 4734 1134 28% 1.6
Sydney Children's Health Network 3943 1068 27% 1.3
Western NSW 5449 1104 25% 1.5
Western Sydney 5279 994 22% 1.5
NSW 80900 18301 27% 1.5
At the LHD level, the DEFFs range from just over 1.3 to 1.7. This suggests that the sample variance of
estimates for some LHDs will be 1.7 times the sample variance that would have been obtained if simple
random sampling had been done across the LHD. The LHDs with the largest DEFFs are those that have the
greatest range in patient volumes across the facilities within the LHD. The standard errors at the LHD level
are fairly small because of the sample sizes at the LHD level. Therefore the increase in standard errors
caused by the survey design (and leading to a larger DEFF at LHD level) is more than offset by the fact that
Bureau of Health Information | Technical supplement: Emergency Department Patient Survey 2014-15 13
each facility that is sampled has sufficient sample size to allow facility level reporting. In addition, the
estimates at the LHD level have appropriate apportionment of respondents between large and small
facilities. It was therefore decided not to censor larger weights further than what had already occurred by
setting a global maximum weight of 400.
Table 4: Sample size, response rates and design effects (DEFF) by facility, EDPS 2014-15
Facility name Original Peer Group
Surveys Mailed
Survey Responses
Weighted Response Rate
DEFF
Facilities reported quarterly
Bankstown / Lidcombe Hospital A1 1566 292 23% 1.5
Concord Hospital A1 1469 400 32% 1.2
Gosford Hospital A1 1564 404 32% 1.5
John Hunter Hospital A1 1613 392 30% 1.4
Liverpool Hospital A1 1604 317 22% 1.2
Nepean Hospital A1 1625 346 25% 1.3
Prince of Wales Hospital A1 1590 322 25% 1.4
Royal North Shore Hospital A1 1605 468 33% 1.4
Royal Prince Alfred Hospital A1 1626 378 28% 1.5
St George Hospital A1 1566 403 28% 1.3
St Vincent's Hospital, Darlinghurst A1 1640 309 25% 1.3
Westmead Hospital A1 1565 325 25% 1.2
Wollongong Hospital A1 1568 375 29% 1.4
Sydney Children's Hospital A2 1963 574 29% 1.2
The Children's Hospital at Westmead A2 1980 494 25% 1.2
Calvary Mater Newcastle A3 1533 328 27% 1.8
Sydney/Sydney Eye Hospital A3 1583 346 27% 1.2
Auburn Hospital B 1653 271 18% 1.3
Blacktown Hospital B 1581 321 25% 1.5
Campbelltown Hospital B 1639 294 22% 1.3
Canterbury Hospital B 1639 356 24% 1.4
Coffs Harbour Base Hospital B 1567 348 28% 1.5
Dubbo Base Hospital B 1587 311 24% 1.3
Fairfield Hospital B 1619 311 21% 1.3
Hornsby and Ku-Ring-Gai Hospital B 1592 510 36% 1.5
Lismore Base Hospital B 1539 352 28% 1.2
Maitland Hospital B 1663 328 25% 1.3
Manly District Hospital B 1581 381 28% 1.4
Manning Base Hospital B 1484 394 33% 1.3
Mona Vale and District Hospital B 1576 432 32% 1.4
Orange Health Service B 1604 362 28% 1.2
Port Macquarie Base Hospital B 1482 369 31% 1.5
Shoalhaven and District Memorial Hospital B 1542 372 30% 1.3
Sutherland Hospital B 1555 442 34% 1.4
Tamworth Base Hospital B 1617 301 23% 1.2
The Tweed Hospital B 1548 363 28% 1.5
Wagga Wagga Base Hospital B 1605 330 25% 1.4
Wyong Hospital B 1567 351 29% 1.4
Bureau of Health Information | Technical supplement: Emergency Department Patient Survey 2014-15 14
Table 4: Sample size, response rates and design effects (DEFF) by facility, EDPS 2014-15 (cont.)
Facility name Original
Peer Group Surveys Mailed
Survey Responses
Weighted Response Rate
DEFF
Facilities reported annually
Armidale and New England Hospital C1 467 87 24% 1.4
Bathurst Base Hospital C1 478 87 23% 1.1
Bega District Hospital C1 431 118 34% 1.3
Belmont Hospital C1 441 121 35% 1.1
Bowral and District Hospital C1 443 127 36% 1.2
Broken Hill Base Hospital C1 444 75 24% 1.3
Goulburn Base Hospital C1 441 95 26% 1.2
Grafton Base Hospital C1 454 98 28% 1.1
Griffith Base Hospital C1 467 82 22% 1.2
Hawkesbury District Health Service C1 465 114 32% 1.1
Mount Druitt Hospital C1 480 77 18% 1.1
Murwillumbah District Hospital C1 456 96 26% 1.1
Ryde Hospital C1 455 136 35% 1.4
Shellharbour Hospital C1 456 109 29% 1.1
Ballina District Hospital C2 430 105 31% 1.1
Bateman's Bay District Hospital C2 442 111 33% 1.1
Bellinger River District Hospital C2 419 108 32% 1.2
Blue Mountains District Anzac Memorial Hospital C2 443 109 31% 1.1
Bulli District Hospital C2 491 136 33% 1.1
Camden Hospital C2 504 101 24% 1.1
Casino and District Memorial Hospital C2 455 84 24% 1.2
Cessnock District Hospital C2 479 76 20% 1.1
Cooma Health Service C2 441 108 30% 1.1
Cowra District Hospital C2 416 81 26% 1.2
Deniliquin Health Service C2 443 106 29% 1.2
Forbes District Hospital C2 456 88 23% 1.2
Gunnedah District Hospital C2 456 97 26% 1.3
Inverell District Hospital C2 467 90 25% 1.2
Kempsey Hospital C2 456 92 25% 1.2
Kurri Kurri District Hospital C2 479 85 22% 1.1
Lithgow Health Service C2 443 88 26% 1.1
Macksville District Hospital C2 419 110 33% 1.2
Maclean District Hospital C2 419 113 36% 1.1
Milton and Ulladulla Hospital C2 431 111 32% 1.1
Moree District Hospital C2 468 67 17% 1.4
Moruya District Hospital C2 430 114 32% 1.1
Mudgee District Hospital C2 452 85 23% 1.2
Muswellbrook District Hospital C2 479 81 21% 1.6
Narrabri District Hospital C2 456 94 26% 1.3
Parkes District Hospital C2 456 90 26% 1.2
Queanbeyan Health Service C2 492 94 22% 1.2
Singleton District Hospital C2 503 91 22% 1.2
Tumut Health Service C2 441 102 29% 1.3
Young Health Service C2 456 90 26% 1.2

Bureau of Health Information | Technical supplement: Emergency Department Patient Survey 2014-15 15
Demographic characteristics of respondents to EDPS 2014-15
The likelihood of a patient to respond to the survey depends, at least in part, to the socio-demographic
identity of the patient. For example, older patients are more likely to respond to the survey as are female
patients. Furthermore, patient demographics can affect how patients respond to survey questions and the
effect of differing response rates can lead to results that are not representative of the hospital’s patient
population. To correct for this effect, the survey program ‘weights’ patient responses so that the results more
closely reflect the views of patients at the hospital, LHD or for NSW. The process of weighting is described in
the section titled ‘Weighting for data’.
Table 5 presents the demographic composition of patients by LHD, age group, visit type, peer group,
Aboriginal status and gender, at each stage of the survey. Of the four columns with data:
1) Percentage in initial sampling frame: the percentage of patients in each category in the dataset of
eligible patients, following Phase 1 screening
2) Percentage in sample mailed: the percentage of patients in each category provided by the NSW
Ministry of Health to Ipsos for mailing, following Phase 2 screening
3) Percentage of respondents (unweighted): the raw/unadjusted percentage of respondents
4) Percentage of respondents (weighted): the weighted percentage of respondents in the final data
contributing to reported results.
Bureau of Health Information | Technical supplement: Emergency Department Patient Survey 2014-15 16
Table 5: Demographic characteristics of patients and EDPS respondents, 2014-15
Demographic variable
Sub-group Percentage in patient
population
% in MoH* eligible
population
Percentage of respondents (Unweighted)
Percentage of respondents (Weighted)
LHD
CCLHD 5.0 5.2 4.1 5.2
FWLHD 0.7 0.7 0.4 0.7
HNELHD 14.1 13.7 14.4 13.7
ISLHD 5.9 6.0 6.0 6.0
MLHD 3.0 3.0 3.9 3.0
MNCLHD 4.3 4.2 5.6 4.2
NBMLHD 4.9 5.0 3.6 4.9
NNSWLHD 6.4 6.2 6.6 6.2
NSLHD 8.6 8.9 10.5 8.9
SCHN 4.0 4.1 5.8 4.2
SESLHD 8.8 9.0 8.3 9.1
SLHD 6.4 6.2 6.2 6.2
SNSWLHD 3.2 3.3 3.5 3.3
SWSLHD 10.9 11.1 7.9 11.1
SVHN 2.0 1.8 1.7 1.8
WNSWLHD 4.8 4.6 6.0 4.6
WSLHD 7.2 7.1 5.4 7.0
Age group
Under 18 26.1 26.5 31.9 26.6
18-49 38.1 38.7 30.3 38.5
50+ 35.9 34.9 37.9 34.9
Visit type Admitted Emergency 28.2 24.9 10.0 24.3
Non-admitted Emergency 71.8 75.1 90.0 75.7
Peer group
A1 34.5 35.1 25.9 35.1
A2 4.0 4.1 5.8 4.2
A3 2.9 2.7 3.7 2.7
B 33.4 33.3 41.0 33.5
C1 12.2 12.3 7.8 12.0
C2 13.1 12.4 15.9 12.5
Aboriginal or Torres Strait Islander
No 94.0 N/A# 94.9 94.8
Yes 5.0 N/A# 2.6 2.6
Unrecorded 1.0 N/A# 2.6 2.6
Gender
Male 51.0 N/A# 48.2 47.3
Female 49.0 N/A# 51.8 52.7
Unrecorded 0.0 N/A# 0 0
*MoH = NSW Ministry of Health #Sample summaries provided by MoH are summarised only by strata variables. As gender and Aboriginal status were not strata variables, this information was not available at this point in the process.

Bureau of Health Information | Technical supplement: Emergency Department Patient Survey 2014-15 17
Reporting
Confidentiality
BHI does not receive any confidential patient information. The process of mailing of surveys and collation of
responses are carried out by Ipsos Social Research Institute (Ipsos) on behalf of BHI. All personal identifiers,
such as name, address etc., are removed from the data before it is provided to BHI.
Only aggregated data are published – unit record data are never published in BHI reports. To further ensure
that respondents are not identifiable, BHI only publishes results that include a minimum of 30 respondents.
Statistical Analysis
Data were analysed for entire period from April 2014 to March 2015, as well as by quarter. Analyses were
undertaken in SAS V9.4 using the SURVEYFREQ procedure. Strata statement variables included: facility,
age and visit type.
Results were weighted for all questions except for questions related to socio-demographic characteristics
and self-reported health.
For analysis of results at the quarterly level:
Strata statement variables included: facility (with annually-reported facilities combined within LHD), LHD
and age strata
Results were weighted using weights calculated for the analysis of quarterly data
Results were generated at the NSW level, and by LHD, peer group and facility (facility-level results only
reported for facilities sampled on the basis of quarterly reporting).
Where questions were comparable between years, quarterly results from the 2014-15 survey were
appended to quarterly 2013-14 results. For these quarterly results, only performance-type questions are
reported in Healthcare Observer (www.bhi.nsw.gov.au/healthcare_observer).
In Snapshot: Emergency Department Patient Report, 2014-15, statistically significant trends in the most
positive category of the questions were identified using simple linear regression. A model was fitted across
the eight quarters of results, weighted by the inverse of the width of the confidence interval for each point
estimate. Statistically significant trends (where the p-value of the regression coefficient was less than 0.05)
were only reported for questions where an LHD had a least 6 quarters of results and a coefficient of
determination (R2) of at least 0.6.
For analysis of results at the annual level:
Strata statement variables included: facility and age strata
Results were weighted using weights calculated for the analysis of annual data
Results were generated for each question in the survey

Bureau of Health Information | Technical supplement: Emergency Department Patient Survey 2014-15 18
Results were generated at the:
– NSW level, and by LHD, peer group and facility
– NSW level, and by LHD, peer group and facility by triage category (Triage Categories 2,3 and Triage
Categories 4,5)
– NSW level, and by LHD, peer group and facility, by demographic characteristics outlined in Table 6
– NSW level by triage category, by demographic characteristics outlined in Table 6.
Table 6: Demographic characteristics of EDPS respondents for reporting, 2014-15
Characteristic Comment
Age group 0-17, 18-49, 50+ based on self-reported year of birth. Where question on year of birth was missing or invalid, administrative data were used
Gender Male, Female. Where response were missing or invalid, administrative data were used
Education
Main language spoken at home Dichotomised to English, Language other than English
Rurality of hospital (NSW only) Based on Remoteness category of postcode of location of facility
Long-standing health conditions Dichotomised to long-standing health condition is reported and none reported for the demographic breakdown
Aboriginal status Self-reported, dichotomised into Aboriginal or non-Aboriginal. Missing values were excluded rather than imputed from administrative source
Self-reported health status The SF-1. Excellent, Very good, Good, Fair, Poor
Quintile of socio-economic disadvantage Refer to the Data Dictionary: Quintile of socio-economic disadvantage
Rurality of patient residence Based on Remoteness category of postcode of patient residence
Country of birth Australian born vs other, derived from administrative data
Unless otherwise specified, missing responses and those who responded ‘Don’t know/can’t remember’ to
questions were excluded from analysis. Typically, performance-style questions exclude missing values and
‘Don’t know/can’t remember’-type responses. The exception is for ‘Don’t know/can’t remember’ responses
for questions that ask about a third party (e.g. if family had enough opportunity to talk to doctor) or that are
over 10%. Meanwhile, questions that are not related to hospital performance include results for people who
responded ‘Don’t know/can’t remember’ and those who should have answered the question but did not.
Results are presented only where the result was based on at least 30 respondents. For a detailed
breakdown of the amount of missing or ‘Don’t know’ responses by question, refer to Appendix 2.
Confidence intervals can be displayed in Healthcare Observer only for quarterly results. The BHI document,
“Guide to Interpreting Differences” provides information in understanding comparison of results
(http://www.bhi.nsw.gov.au/nsw_patient_survey_program). However, some differences in results between
facilities may be due to differences in the demographic profile of patients attending those facilities. BHI is
currently developing methods to standardise survey results in order to account for differences in patient mix
and to optimise direct comparisons.

Bureau of Health Information | Technical supplement: Emergency Department Patient Survey 2014-15 19
Calculation of percentages
The result (percentage) for each response option in the questionnaire is determined using the following
method:
Numerator
The (weighted) number of survey respondents who selected a specific response option to a certain question, minus exclusions.
Denominator
The (weighted) number of survey respondents who selected any of the response options to a certain question, minus exclusions.
Calculation
= numerator/denominator X100
The results are weighted for most questions. They are not weighted for questions relating to demographics
or self-reported health status.
In some cases, the results from several responses are combined to form a ‘derived measure’, as indicated in
the reporting. For information about how these measures are developed, please see Appendix 3.

Bureau of Health Information | Technical supplement: Emergency Department Patient Survey 2014-15 20
Appendix 1
Facilities included in the EDPS sampling frame
Appendix Table 1: Eligible patients, sampled patients and proportion sampled by facility, EDPS 2014-15
Facility name Peer
Group Total eligible
patients Total
sampled Proportion sampled
Bankstown / Lidcombe Hospital A1 37459 1566 4.2
Concord Hospital A1 27338 1469 5.4
Gosford Hospital A1 46315 1564 3.4
John Hunter Hospital A1 56451 1613 2.9
Liverpool Hospital A1 59622 1604 2.7
Nepean Hospital A1 49162 1625 3.3
Prince of Wales Hospital A1 38772 1590 4.1
Royal North Shore Hospital A1 59565 1605 2.7
Royal Prince Alfred Hospital A1 50488 1626 3.2
St George Hospital A1 54494 1566 2.9
St Vincent's Hospital, Darlinghurst A1 31227 1640 5.3
Westmead Hospital A1 52020 1565 3.0
Wollongong Hospital A1 44380 1568 3.5
Sydney Children's Hospital A2 28869 1963 6.8
The Children's Hospital at Westmead A2 42424 1980 4.7
Calvary Mater Newcastle A3 22810 1533 6.7
Sydney/Sydney Eye Hospital A3 23933 1583 6.6
Auburn Hospital B 18103 1653 9.1
Blacktown Hospital B 28753 1581 5.5
Campbelltown Hospital B 46769 1639 3.5
Canterbury Hospital B 29434 1639 5.6
Coffs Harbour Base Hospital B 26353 1567 5.9
Dubbo Base Hospital B 19884 1587 8.0
Fairfield Hospital B 26092 1619 6.2
Hornsby and Ku-Ring-Gai Hospital B 28669 1592 5.6
Lismore Base Hospital B 21225 1539 7.3
Maitland Hospital B 32618 1663 5.1
Manly District Hospital B 18710 1581 8.5
Manning Base Hospital B 18744 1484 7.9
Mona Vale and District Hospital B 25631 1576 6.1
Orange Health Service B 19851 1604 8.1
Port Macquarie Base Hospital B 21147 1482 7.0
Shoalhaven and District Memorial Hospital B 24960 1542 6.2
Sutherland Hospital B 38566 1555 4.0
Tamworth Base Hospital B 28407 1617 5.7
The Tweed Hospital B 33337 1548 4.6
Wagga Wagga Base Hospital B 25346 1605 6.3
Wyong Hospital B 43440 1567 3.6
Armidale and New England Hospital C1 10850 467 4.3
Bathurst Base Hospital C1 17277 478 2.8
Bega District Hospital C1 8615 431 5.0
Belmont Hospital C1 18227 441 2.4
Bowral and District Hospital C1 13139 443 3.4

Bureau of Health Information | Technical supplement: Emergency Department Patient Survey 2014-15 21
Broken Hill Base Hospital C1 12473 444 3.6
Goulburn Base Hospital C1 11290 441 3.9
Grafton Base Hospital C1 15189 454 3.0
Griffith Base Hospital C1 12436 467 3.8
Hawkesbury District Health Service C1 17159 465 2.7
Mount Druitt Hospital C1 24149 480 2.0
Murwillumbah District Hospital C1 10344 456 4.4
Ryde Hospital C1 20773 455 2.2
Shellharbour Hospital C1 20072 456 2.3
Ballina District Hospital C2 10929 430 3.9
Bateman's Bay District Hospital C2 9173 442 4.8
Bellinger River District Hospital C2 3039 419 13.8
Blue Mountains District Anzac Memorial Hospital C2 11310 443 3.9
Bulli District Hospital C2 3661 491 13.4
Camden Hospital C2 9531 504 5.3
Casino and District Memorial Hospital C2 8465 455 5.4
Cessnock District Hospital C2 11235 479 4.3
Cooma Health Service C2 6682 441 6.6
Cowra District Hospital C2 4177 416 10.0
Deniliquin Health Service C2 5115 443 8.7
Forbes District Hospital C2 4751 456 9.6
Gunnedah District Hospital C2 5272 456 8.6
Inverell District Hospital C2 6496 467 7.2
Kempsey Hospital C2 13759 456 3.3
Kurri Kurri District Hospital C2 3935 479 12.2
Lithgow Health Service C2 7964 443 5.6
Macksville District Hospital C2 7565 419 5.5
Maclean District Hospital C2 7352 419 5.7
Milton and Ulladulla Hospital C2 9813 431 4.4
Moree District Hospital C2 4911 468 9.5
Moruya District Hospital C2 7310 430 5.9
Mudgee District Hospital C2 8047 452 5.6
Muswellbrook District Hospital C2 5389 479 8.9
Narrabri District Hospital C2 3624 456 12.6
Parkes District Hospital C2 5440 456 8.4
Queanbeyan Health Service C2 13329 492 3.7
Singleton District Hospital C2 8107 503 6.2
Tumut Health Service C2 2771 441 15.9
Young Health Service C2 6015 456 7.6
Bureau of Health Information | Technical supplement: Emergency Department Patient Survey 2014-15 22
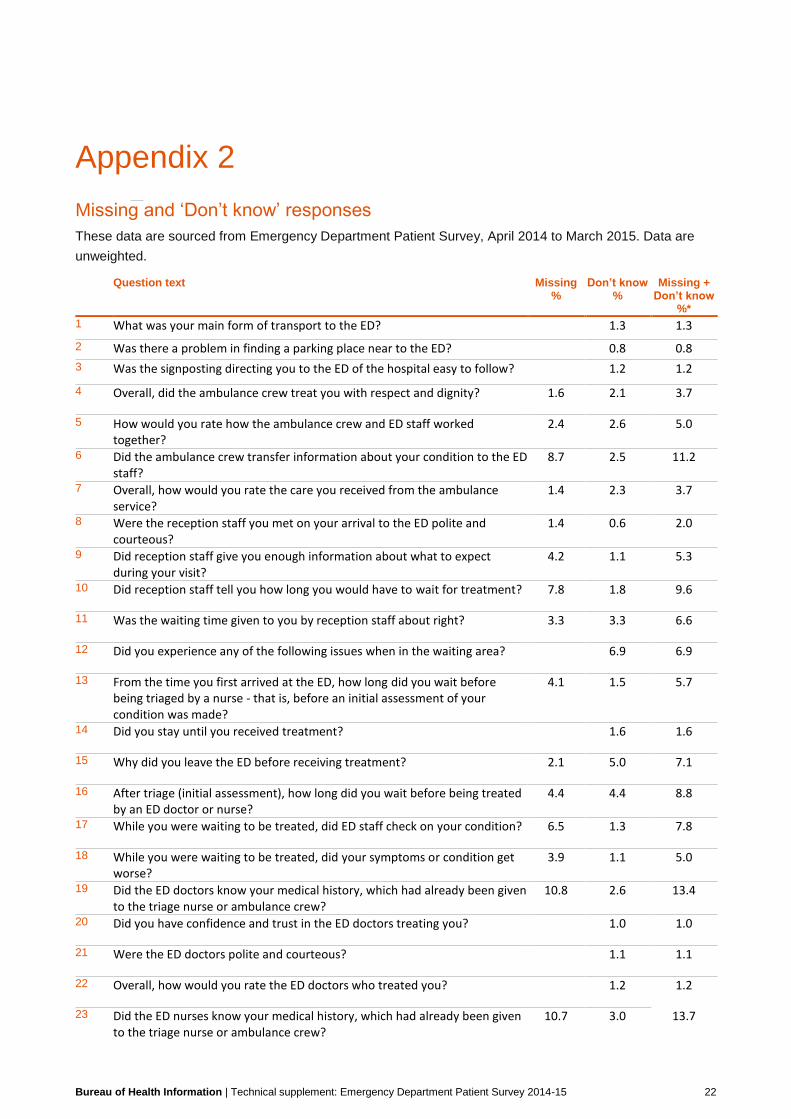
Appendix 2
Missing and ‘Don’t know’ responses
These data are sourced from Emergency Department Patient Survey, April 2014 to March 2015. Data are
unweighted.
Question text Missing %
Don’t know %
Missing + Don’t know
%*
1 What was your main form of transport to the ED? 1.3 1.3
2 Was there a problem in finding a parking place near to the ED? 0.8 0.8
3 Was the signposting directing you to the ED of the hospital easy to follow? 1.2 1.2
4 Overall, did the ambulance crew treat you with respect and dignity? 1.6 2.1 3.7
5 How would you rate how the ambulance crew and ED staff worked together?
2.4 2.6 5.0
6 Did the ambulance crew transfer information about your condition to the ED staff?
8.7 2.5 11.2
7 Overall, how would you rate the care you received from the ambulance service?
1.4 2.3 3.7
8 Were the reception staff you met on your arrival to the ED polite and courteous?
1.4 0.6 2.0
9 Did reception staff give you enough information about what to expect during your visit?
4.2 1.1 5.3
10 Did reception staff tell you how long you would have to wait for treatment? 7.8 1.8 9.6
11 Was the waiting time given to you by reception staff about right? 3.3 3.3 6.6
12 Did you experience any of the following issues when in the waiting area? 6.9 6.9
13 From the time you first arrived at the ED, how long did you wait before being triaged by a nurse - that is, before an initial assessment of your condition was made?
4.1 1.5 5.7
14 Did you stay until you received treatment? 1.6 1.6
15 Why did you leave the ED before receiving treatment? 2.1 5.0 7.1
16 After triage (initial assessment), how long did you wait before being treated by an ED doctor or nurse?
4.4 4.4 8.8
17 While you were waiting to be treated, did ED staff check on your condition? 6.5 1.3 7.8
18 While you were waiting to be treated, did your symptoms or condition get worse?
3.9 1.1 5.0
19 Did the ED doctors know your medical history, which had already been given to the triage nurse or ambulance crew?
10.8 2.6 13.4
20 Did you have confidence and trust in the ED doctors treating you? 1.0 1.0
21 Were the ED doctors polite and courteous? 1.1 1.1
22 Overall, how would you rate the ED doctors who treated you? 1.2 1.2
23 Did the ED nurses know your medical history, which had already been given to the triage nurse or ambulance crew?
10.7 3.0 13.7

Bureau of Health Information | Technical supplement: Emergency Department Patient Survey 2014-15 23
24 Did you have confidence and trust in the ED nurses treating you? 0.5 0.5
25 Were the ED nurses polite and courteous? 0.7 0.7
26 Overall, how would you rate the ED nurses who treated you? 0.5 0.5
27 Did the ED health professionals introduce themselves to you? 2.3 2.3
28 Did the ED health professionals explain things in a way you could understand?
2.3 2.3
29 During your visit to the ED, how much information about your condition or treatment was given to you?
2.5 2.5
30 Were you involved, as much as you wanted to be, in decisions about your care and treatment?
2.7 2.7
31 If your family members or someone else close to you wanted to talk to the ED staff, did they get the opportunity to do so?
3.4 2.8 6.2
32 How much information about your condition or treatment was given to your family, carer or someone else close to you?
4.6 3.2 7.7
33 Were you able to get assistance or advice from an ED health professional when you needed it?
3.0 3.0
34 What was this assistance or advice required for? 7.4 7.4
35 How would you rate how the ED health professionals worked together? 3.0 3.0
36 Did you ever receive contradictory information about your condition or treatment from ED health professionals?
3.8 3.8
37 Were the ED health professionals kind and caring towards you? 2.9 2.9
38 Did you feel you were treated with respect and dignity while you were in the ED?
2.8 2.8
39 Were you given enough privacy during your visit to the ED? 3.0 3.0
40 Were your cultural or religious beliefs respected by the ED staff? 3.8 3.8
41 Did you have worries or fears about your condition or treatment while in the ED?
2.8 2.8
42 Did an ED health professional discuss your worries or fears with you? 3.2 3.2
43 Were you ever in pain while in the ED? 3.3 3.3
44 Do you think the ED health professionals did everything they could to help manage your pain?
2.6 2.6
45 Did you see ED health professionals wash their hands, or use hand gel to clean their hands, before touching you?
21.3 2.7 24.0
46 How clean were the waiting and treatment areas in the ED? 2.7 2.7
47 How safe did you feel during your visit to the ED? 2.5 2.5
48 Were there things for your child to do (such as books, games and toys)? 5.5 11.0 16.5
49 Was the area in which your child was treated suitable for someone of their age group?
10.4 10.4
50 Did the ED staff provide care and understanding appropriate to the needs of your child?
10.5 10.5
51 During your visit to the ED, did you have any tests, X-rays or scans? 2.9 5.2 8.1
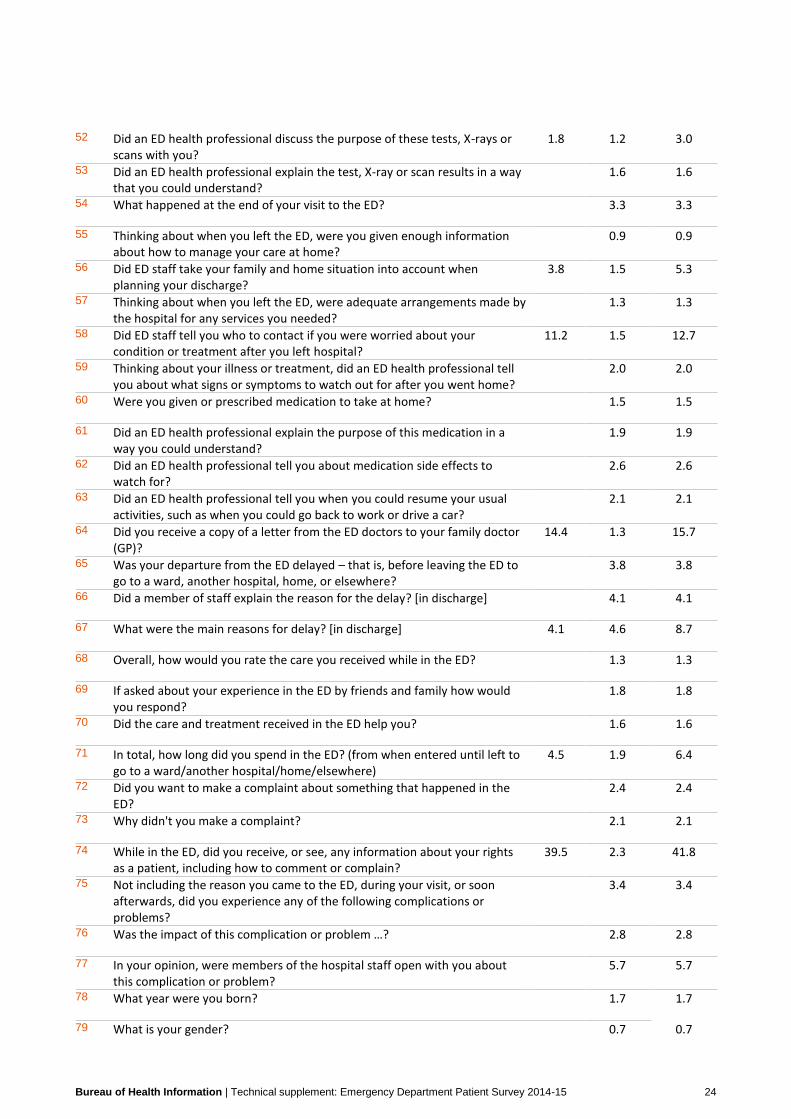
Bureau of Health Information | Technical supplement: Emergency Department Patient Survey 2014-15 24
52 Did an ED health professional discuss the purpose of these tests, X-rays or scans with you?
1.8 1.2 3.0
53 Did an ED health professional explain the test, X-ray or scan results in a way that you could understand?
1.6 1.6
54 What happened at the end of your visit to the ED? 3.3 3.3
55 Thinking about when you left the ED, were you given enough information about how to manage your care at home?
0.9 0.9
56 Did ED staff take your family and home situation into account when planning your discharge?
3.8 1.5 5.3
57 Thinking about when you left the ED, were adequate arrangements made by the hospital for any services you needed?
1.3 1.3
58 Did ED staff tell you who to contact if you were worried about your condition or treatment after you left hospital?
11.2 1.5 12.7
59 Thinking about your illness or treatment, did an ED health professional tell you about what signs or symptoms to watch out for after you went home?
2.0 2.0
60 Were you given or prescribed medication to take at home? 1.5 1.5
61 Did an ED health professional explain the purpose of this medication in a way you could understand?
1.9 1.9
62 Did an ED health professional tell you about medication side effects to watch for?
2.6 2.6
63 Did an ED health professional tell you when you could resume your usual activities, such as when you could go back to work or drive a car?
2.1 2.1
64 Did you receive a copy of a letter from the ED doctors to your family doctor (GP)?
14.4 1.3 15.7
65 Was your departure from the ED delayed – that is, before leaving the ED to go to a ward, another hospital, home, or elsewhere?
3.8 3.8
66 Did a member of staff explain the reason for the delay? [in discharge] 4.1 4.1
67 What were the main reasons for delay? [in discharge] 4.1 4.6 8.7
68 Overall, how would you rate the care you received while in the ED? 1.3 1.3
69 If asked about your experience in the ED by friends and family how would you respond?
1.8 1.8
70 Did the care and treatment received in the ED help you? 1.6 1.6
71 In total, how long did you spend in the ED? (from when entered until left to go to a ward/another hospital/home/elsewhere)
4.5 1.9 6.4
72 Did you want to make a complaint about something that happened in the ED?
2.4 2.4
73 Why didn't you make a complaint? 2.1 2.1
74 While in the ED, did you receive, or see, any information about your rights as a patient, including how to comment or complain?
39.5 2.3 41.8
75 Not including the reason you came to the ED, during your visit, or soon afterwards, did you experience any of the following complications or problems?
3.4 3.4
76 Was the impact of this complication or problem …? 2.8 2.8
77 In your opinion, were members of the hospital staff open with you about this complication or problem?
5.7 5.7
78 What year were you born? 1.7 1.7
79 What is your gender? 0.7 0.7

Bureau of Health Information | Technical supplement: Emergency Department Patient Survey 2014-15 25
80 Highest level of education completed 10.4 10.4
81 Which, if any, of the following long-standing conditions do you have (including age related conditions)?
2.8 2.8
82 In general, how would you rate your health? 1.5 1.5
83 Language mainly spoken at home 1.9 1.9
84 Was an interpreter provided when you needed one in the ED? 0.8 0.8
85 Aboriginal and/or Torres Strait Islander 2.6 2.6
86 What were your reasons for going to the ED? 1.8 1.8
87 Was your visit to the ED for a condition that, at the time, you thought could have been treated by a General Practitioner (GP)?
2.2 2.2
88 In the month before visiting the ED, did you …? 8.3 2.4 10.7
89 Before your visit to the ED, had you previously been to an ED about the same condition or something related to it?
2.1 2.1
90 Who completed this questionnaire? 1.4 1.4
91 Do you give permission for the Bureau of Health Information to link your answers from this survey to health records related to you (the patient)?
4.9 4.9
* Percentages for this column may not equal the sum of the “Missing %” and “Don’t know %” columns
because they were calculated using unrounded figures.
# For respondents who did not answer these questions, information about age and gender were substituted
with age and sex fields from administrative data (from the Health Information Exchange).

Bureau of Health Information | Technical supplement: Emergency Department Patient Survey 2014-15 26
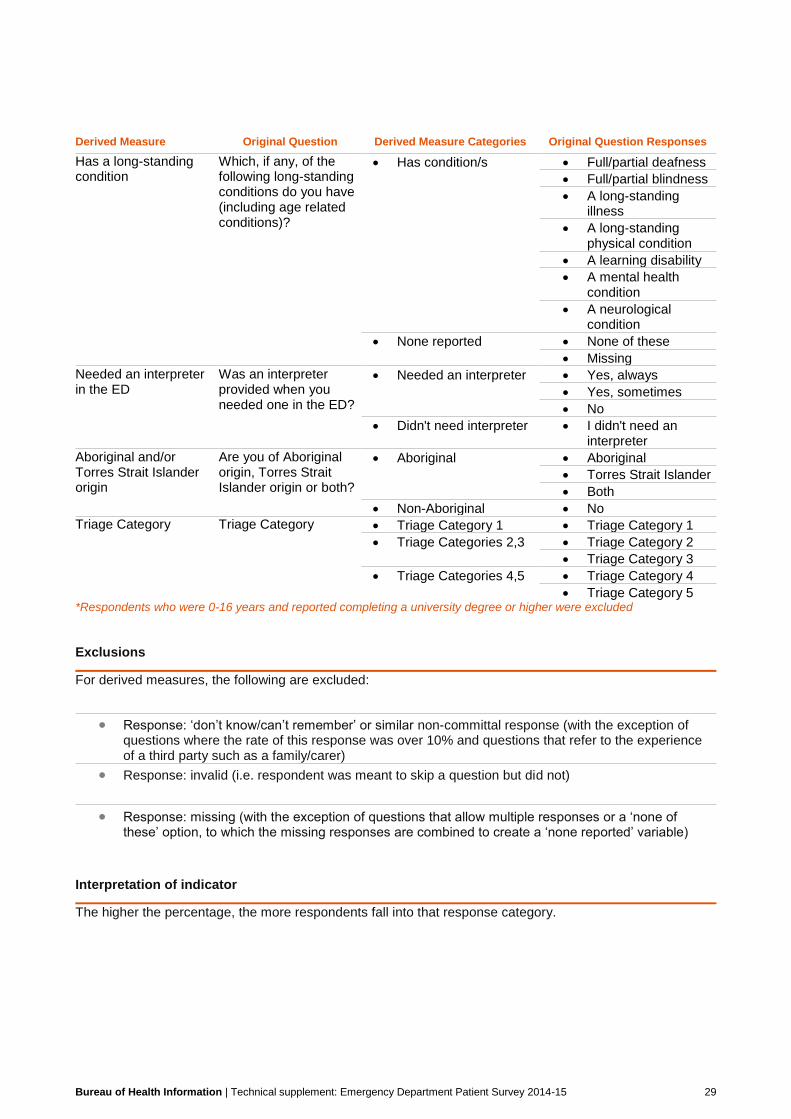
Appendix 3
Derived measures
Definition
Derived measures are those for which results are calculated indirectly from respondents’ answers to a survey
question. These tend to be from questions that contain a ‘not applicable’ type response option and are used to
gather information about the array of patients’ needs.
Derived measures involve the grouping together of more than one response option to a question. The derived
measure 'Quintile of Disadvantage' is an exception to this rule (for more information on this, please see the
appropriate Data Dictionary for this measure - http://www.bhi.nsw.gov.au/nsw_patient_survey_program).
Statistical methods
Results are expressed as the percentage of respondents who chose a specific response option or options for
a question. The reported percentage is calculated as the numerator divided by the denominator (defined
earlier in this technical supplement).
Results are weighted as described in this report.
Inclusions
The following questions and responses were used in the construction of the derived measures:
Derived Measure Original Question Derived Measure Categories Original Question Responses
Arrived by ambulance What was your main form of transport to the ED?
Arrived by ambulance Ambulance
Arrived other way Private motor vehicle
Public transport
Other
Needed parking near the ED
Was there a problem in finding a parking place near to the ED?
Didn't need parking Didn't need parking
Needed parking Yes, a big problem
Yes, a small problem
No problem

Bureau of Health Information | Technical supplement: Emergency Department Patient Survey 2014-15 27
Derived Measure Original Question Derived Measure Categories Original Question Responses
Spent time in the waiting area
Did you experience any of the following issues when in the waiting area?
Spent time in waiting area
Couldn't find seat
Seats uncomfortable
Too noisy
Too hot
Too cold
Bad/unpleasant smells
None of these
Wasn't in waiting area Wasn't in waiting area
Saw a triage nurse From the time you first arrived at the ED, how long did you wait before being triaged by a nurse?
Saw a triage nurse Triaged immediately
1-15 minutes
16-30 minutes
31-59 minutes
1 hr to under 2 hrs
2 hrs or more
Didn't see a triage nurse
Didn't see a triage nurse
Received treatment from a doctor
Did the ED doctors know your medical history, which had already been given to the triage nurse or ambulance crew?
Saw a doctor Yes, definitely
Yes, to some extent
No
Didn't see a doctor Wasn't treated by a doctor
Received treatment from a nurse
Did the ED nurses know your medical history, which had already been given to the triage nurse or ambulance crew?
Saw a nurse Yes, definitely
Yes, to some extent
No
Didn't see a nurse Wasn't treated by a nurse
Needed information about condition or received treatment
During your visit to the ED, how much information about your condition or treatment was given to you?
Needed information Not enough
Right amount
Too much
Didn't need information Not applicable
Wanted to be involved in decisions about care and treatment
Were you involved, as much as you wanted to be, in decisions about your care and treatment?
Wanted involvement Yes, definitely
Yes, to some extent
No
Didn't want involvement Not well enough to be involved
No need to be involved
Had family/someone close who wanted to talk to staff
If your family members or someone else close to you wanted to talk to the ED staff, did they get the opportunity to do so?
Wanted to talk to staff Yes, definitely
Yes, to some extent
No, they did not
Not applicable Not applicable
Had family/someone close who wanted information about condition or treatment
How much information about your condition or treatment was given to your family, carer or someone else close to you?
Wanted information Not enough
Right amount
Too much
Not applicable It was not necessary

Bureau of Health Information | Technical supplement: Emergency Department Patient Survey 2014-15 28
Derived Measure Original Question Derived Measure Categories Original Question Responses
Had religious or cultural beliefs to consider
Were your cultural or religious beliefs respected by the ED staff?
Had beliefs to consider Yes, always
Yes, sometimes
No
Had beliefs to consider Beliefs not an issue
Child needed things to do (such as books, games and toys)?
Were there things for your child to do (such as books, games and toys)?
Child needed things to do
Yes, there was a lot
Yes, but not enough
Yes, but not for age group
No
Not applicable Not applicable
Received results of test, X-ray or scan results while in ED
Did an ED health professional explain the test, X-ray or scan results in a way that you could understand?
Received results in ED Yes, completely
Yes, to some extent
No
Didn't receive results Not told results in ED
Needed information on how to manage care at home
Thinking about when you left the ED, were you given enough information about how to manage your care at home?
Needed information Yes, completely
Yes, to some extent
No
Didn't need information Didn't need information
Needed family and home situation taken into account when planning discharge
Did ED staff take your family and home situation into account when planning your discharge?
Had situation to consider
Yes, completely
Yes, to some extent
No
Not necessary It was not necessary
Needed arrangements made by the hospital for services needed after discharge
Thinking about when you left the ED, were adequate arrangements made by the hospital for any services you needed?
Needed services Yes, completely
Yes, to some extent
No
Didn't need services Didn't need services
Wanted to make a complaint about something that happened in ED
Did you want to make a complaint about something that happened in the ED?
Wanted to complain Yes, and I did complain
Yes, but I did not complain
Didn't want to complain No
Not including the reason came to ED, [insert complication or problem] during visit or soon afterwards
Not including the reason you came to the ED, during your visit, or soon afterwards, did you experience any of the following complications or problems?
Experienced an infection
Experienced uncontrolled bleeding
Experienced a negative reaction to medication
Experienced complications as a result of tests or procedures
Experienced a blood clot
Experienced a fall
Experienced other complication or problem
Highest level of education*
What is the highest level of education you have completed?
Less than Year 12 Still at school
Less than Year 12 or equivalent
Completed Year 12 or equivalent
Completed Year 12 or equivalent
Trade/tech. cert./diploma
Trade/tech. cert./diploma
University degree University degree
Post grad./higher degree
Post grad./higher degree
Bureau of Health Information | Technical supplement: Emergency Department Patient Survey 2014-15 29
Derived Measure Original Question Derived Measure Categories Original Question Responses
Has a long-standing condition
Which, if any, of the following long-standing conditions do you have (including age related conditions)?
Has condition/s Full/partial deafness
Full/partial blindness
A long-standing illness
A long-standing physical condition
A learning disability
A mental health condition
A neurological condition
None reported None of these
Missing
Needed an interpreter in the ED
Was an interpreter provided when you needed one in the ED?
Needed an interpreter Yes, always
Yes, sometimes
No
Didn't need interpreter I didn't need an interpreter
Aboriginal and/or Torres Strait Islander origin
Are you of Aboriginal origin, Torres Strait Islander origin or both?
Aboriginal Aboriginal
Torres Strait Islander
Both
Non-Aboriginal No
Triage Category Triage Category Triage Category 1 Triage Category 1
Triage Categories 2,3 Triage Category 2
Triage Category 3
Triage Categories 4,5 Triage Category 4
Triage Category 5 *Respondents who were 0-16 years and reported completing a university degree or higher were excluded Exclusions
For derived measures, the following are excluded:
Response: ‘don’t know/can’t remember’ or similar non-committal response (with the exception of questions where the rate of this response was over 10% and questions that refer to the experience of a third party such as a family/carer)
Response: invalid (i.e. respondent was meant to skip a question but did not)
Response: missing (with the exception of questions that allow multiple responses or a ‘none of these’ option, to which the missing responses are combined to create a ‘none reported’ variable)
Interpretation of indicator
The higher the percentage, the more respondents fall into that response category.