Emerald City 8B - collegeparkmd.gov · Emerald City WHO ARE WE? Emerald City’s denizens live in...
4
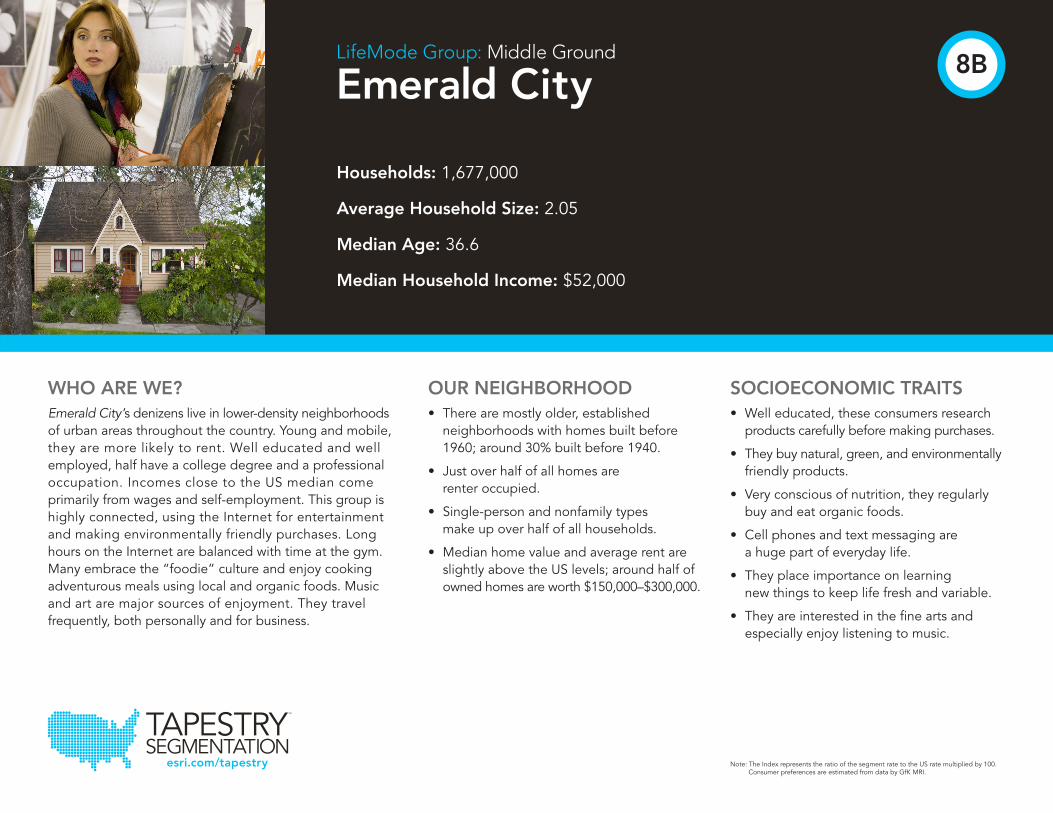
TAPESTRY SEGMENTATION TM esri.com/tapestry Households: 1,677,000 Average Household Size: 2.05 Median Age: 36.6 Median Household Income: $52,000 LifeMode Group: Middle Ground Emerald City WHO ARE WE? Emerald City ’s denizens live in lower-density neighborhoods of urban areas throughout the country. Young and mobile, they are more likely to rent. Well educated and well employed, half have a college degree and a professional occupation. Incomes close to the US median come primarily from wages and self-employment. This group is highly connected, using the Internet for entertainment and making environmentally friendly purchases. Long hours on the Internet are balanced with time at the gym. Many embrace the “foodie” culture and enjoy cooking adventurous meals using local and organic foods. Music and art are major sources of enjoyment. They travel frequently, both personally and for business. OUR NEIGHBORHOOD • There are mostly older, established neighborhoods with homes built before 1960; around 30% built before 1940. • Just over half of all homes are renter occupied. • Single-person and nonfamily types make up over half of all households. • Median home value and average rent are slightly above the US levels; around half of owned homes are worth $150,000–$300,000. SOCIOECONOMIC TRAITS • Well educated, these consumers research products carefully before making purchases. • They buy natural, green, and environmentally friendly products. • Very conscious of nutrition, they regularly buy and eat organic foods. • Cell phones and text messaging are a huge part of everyday life. • They place importance on learning new things to keep life fresh and variable. • They are interested in the fine arts and especially enjoy listening to music. Note: The Index represents the ratio of the segment rate to the US rate multiplied by 100. Consumer preferences are estimated from data by GfK MRI. 8B
-
Upload
phungnguyet -
Category
Documents
-
view
216 -
download
0
Transcript of Emerald City 8B - collegeparkmd.gov · Emerald City WHO ARE WE? Emerald City’s denizens live in...
TAPESTRYSEGMENTATION
TM
esri.com/tapestry
Households: 1,677,000
Average Household Size: 2.05
Median Age: 36.6
Median Household Income: $52,000
LifeMode Group: Middle Ground
Emerald City
WHO ARE WE?Emerald City ’s denizens live in lower-density neighborhoods of urban areas throughout the country. Young and mobile, they are more likely to rent. Well educated and wellemployed, half have a college degree and a professional occupation. Incomes close to the US median come primarily from wages and self-employment. This group is highly connected, using the Internet for entertainment and making environmentally friendly purchases. Long hours on the Internet are balanced with time at the gym. Many embrace the “foodie” culture and enjoy cooking adventurous meals using local and organic foods. Music and art are major sources of enjoyment. They travelfrequently, both personally and for business.
OUR NEIGHBORHOOD• There are mostly older, established neighborhoods with homes built before 1960; around 30% built before 1940.
• Just over half of all homes are renter occupied.
• Single-person and nonfamily types make up over half of all households.
• Median home value and average rent are slightly above the US levels; around half of owned homes are worth $150,000–$300,000.
SOCIOECONOMIC TRAITS• Well educated, these consumers research products carefully before making purchases.
• They buy natural, green, and environmentally friendly products.
• Very conscious of nutrition, they regularly buy and eat organic foods.
• Cell phones and text messaging are a huge part of everyday life.
• They place importance on learning new things to keep life fresh and variable.
• They are interested in the fi ne arts and especially enjoy listening to music.
Note: The Index represents the ratio of the segment rate to the US rate multiplied by 100. Consumer preferences are estimated from data by GfK MRI.
8B

Male Female8% 4% 0 4% 8%
85+80–8475–7970–7465–6960–6455–5950–5445–4940–4435–3930–3425–2920–2415–1910–14
5–9< 5
* Hispanic can be of any race. US Average
79.3%
8.9%
3.2%
3.3%
10.5%
0.8%
4.4%
80%60%40%20%0
White
Black
AmericanIndian
Asian andPac. Island
Other
Multiple
Hispanic*
0
$60k $90k$30k $120k+
Median Household Income
$52,000
US Median $51,000
0
0
$300k$100k $200k $400k+
Median Net Worth
$37,000
US Median $71,000
$70,000
$50,000
$30,000
$10,000
0 300,000
Med
ian
Ear
ning
s
Workers (Age 16+)100,000 200,000
Sales and Related
Education, Training,and Library
Office andAdministrative Support
ManagementHealth Care Practitioners
and Technical
3500 50 100 150 200 250 300
Housing
Food
Apparel & Services
Transportation
Health Care
Entertainment &Recreation
Education
Pensions &Social Security
Other
99
68
98
92
100
105
99
95
101
TAPESTRYSEGMENTATION
TM
esri.com/tapestry
LifeMode Group: Middle Ground
Emerald City
INCOME AND NET WORTHNet worth measures total household assets (homes, vehicles, investments, etc.) less any debts, secured (e.g., mortgages)or unsecured (credit cards). Household income andnet worth are estimated by Esri.
AGE BY SEX (Esri data)
Median Age: 36.6 US: 37.6| Indicates US
RACE AND ETHNICITY (Esri data)
The Diversity Index summarizes racial and ethnic diversity. The index shows the likelihood that two persons, chosen at random from the same area, belong to different race or ethnic groups. The index ranges from 0 (no diversity) to 100 (complete diversity).
Diversity Index: 48.1 US: 62.1
8B
OCCUPATION BY EARNINGSThe fi ve occupations with the highest number of workers in the market are displayedby median earnings. Data from the Census Bureau’s American Community Survey.
AVERAGE HOUSEHOLD BUDGET INDEXThe index compares the average amount spent in this market’s household budgets for housing, food, apparel, etc., to the average amount spent by all US households. An indexof 100 is average. An index of 120 shows that average spending by consumers in this marketis 20 percent above the national average. Consumer expenditures are estimated by Esri.

Population900,000 11,000,000
3,513,000
Population Growth (Annual %)-0.5% 3.0%
0.4%
Population Density (Persons per sq. mile)0 25,000
1000
378
0Wealth Index
80 350
0Socioeconomic Status Index
120 350
0Housing Affordability Index
131 350
Own49.6%
Rent50.4%
HomeOwnership
US Percentage:63.6% Own36.4% Rent
TAPESTRYSEGMENTATION
TM
esri.com/tapestry
MARKET PROFILE (Consumer preferences are estimated from data by GfK MRI)
• Liberal segment that contributes to NPR and PBS.
• Shop at Trader Joe’s and Whole Foods.
• Budget time—utilize home cleaning services so there’s time for yoga.
• Use the web for professional networking, blogging, and online dating.
• Read magazines and books on a tablet, sometimes while exercising at home.
• Go to art galleries and make art at home.
ESRI INDEXESEsri developed three indexes to display average household wealth, socioeconomic status,and housing affordability for the market relative to US standards.
POPULATION CHARACTERISTICSTotal population, average annual population change since Census 2010, and average density (population per square mile) are displayed for the market relative to the sizeand change among all Tapestry markets. Data estimated by Esri.
LifeMode Group: Middle Ground
Emerald City8B
HOUSINGMedian home value is displayed for markets that are primarilyowner occupied; average rent is shown for renter-occupied markets. Tenure and home value are estimated by Esri. Housing type and average rent are from the Census Bureau’s American Community Survey.
Typical Housing:Single Family;Multiunits
Average Rent:$1,030US Average: $990

High
Low
TAPESTRYSEGMENTATION
TM
esri.com/tapestry
Copyright © 2014 Esri. All rights reserved. Esri, the Esri globe logo, Tapestry, @esri.com, and esri.com are trademarks, service marks, or registered marks of Esri in the United States, the European Community, or certain other jurisdictions. Other companies and products or services mentioned herein may be trademarks, service marks, or registered marks of their respective mark owners.
G62222ESRI2C7/14dl
For more information1-800-447-9778
SEGMENT DENSITYThis map illustrates the density anddistribution of the Emerald CityTapestry Segment by households.
LifeMode Group: Middle Ground
Emerald City8B