Antioxidative Property and Molecular Mechanisms Underlying ...
Elucidating the Neural Mechanisms Underlying the Contingent Attention Cueing Paradigm
by Ashley Candice Livingstone B.A., Simon Fraser University, 2013
Thesis Submitted in Partial Fulfillment of the
Requirements for the Degree of
Master of Arts
in the
Department of Psychology
Faculty of Arts and Social Sciences
Ashley Candice Livingstone 2016 SIMON FRASER UNIVERSITY
Spring 2016

ii
Approval
Name: Ashley Candice Livingstone Degree: Master of Arts Title: Elucidating the Neural Mechanisms Underlying
the Contingent Attention Cueing Paradigm Examining Committee: Chair: Dr. Thomas Spalek
Associate Professor
Dr. John McDonald Senior Supervisor Professor
Dr. Richard Wright Supervisor Associate Professor
Dr. Bradley Wyble External Examiner Assistant Professor Department of Psychology Pennsylvania State University
Date Defended/Approved:
March 3, 2016

iii
Ethics Statement
iv
Abstract
Researchers have studied contingent attentional capture for over two decades, and have
characterized the behavioural effects; but a complete understanding of the neural
mechanisms involved has yet to be developed. This thesis investigated the neural
underpinnings of the cue-validity effect in the contingent capture paradigm. Recent
research purported to show that observers inadvertently attend to irrelevant cue items that
possess a task relevant feature (indexed by the ERP component, the N2pc), and then
suppress the location of that cue item in order to respond to the target (indicated by the
ERP component the PD, believed to index suppression). Experiment 1 determined whether
the attended cue was in actuality suppressed; whereas, Experiment 2 determined how
selection of the cue item affects higher stages of visual processing. Results showed that
reaction time costs were due to extraneously cued nontarget information entering working
memory, thus delaying target processing on invalid trials.
Keywords: Contingent Attention Capture; Event-Related Potentials (ERPs); N2pc; Contralateral Positivity; SPCN; Attentional Competition

v
Dedication
I would like to dedicate my thesis to my little man: 2-Bite Brownie Livingstone-Christie.
Whenever I needed a good cuddle, you were there.
I love you little guy!!

vi
Acknowledgements
First and foremost, I would like to thank my supervisor, Dr. John McDonald. Thank you for
accepting me into your lab, your guidance, ideas and discussions that made this such a
rewarding project. Also, thank you for continually pushing me to be a better writer.
Sometimes the amount of red was distressing, but the finished product was always worth
the effort.
To my academic family: (in alphabetical order) Alannah, Andrea, Bert, Christian, Elisabeth,
Evan, Greg, James, JG, Hailey, Killian, Little Greg, Mateusz, Patrick, and Sarah. Thank
you for being there for me, generally allowing me to talk with or at you about my project,
letting me share my excitement, or being there to pick me up when I got discouraged. The
amount of support your have all given me throughout my entire academic career has been
astonishing. This degree is not just my own, as each of you have had a substantial part in
it. Without all of you, this process would not have been nearly as enjoyable. You all mean
the world to me. Thank you.
To the RA’s: Alannah, Amanda, Meagan, Daniel, Sam, and Ellen. Thank you for your help
collecting all the data for the seemingly endless string of experiments I could think up. I
would still be collecting data without you.
To Mom and Jim: you are the best cheerleaders I could ever ask for. Words will never do
justice how appreciative I am of you. I love you, and thank you for putting up with me.
vii
Table of Contents
Approval ................................................................................................................ iiEthics Statement ................................................................................................... iiiAbstract ................................................................................................................ ivDedication ............................................................................................................. vAcknowledgements .............................................................................................. viTable of Contents ................................................................................................. viiList of Figures ...................................................................................................... viiiList of Tables ......................................................................................................... xList of Acronyms .................................................................................................... x
Chapter 1. Introduction ................................................................................... 1
Chapter 2. Experiment 1 .................................................................................. 62.1. Methods ........................................................................................................ 6
2.1.1. Ethics ............................................................................................... 62.1.2. Participants ...................................................................................... 62.1.3. Stimuli and procedure ..................................................................... 62.1.4. Apparatus ........................................................................................ 82.1.5. Electrophysiological recording ......................................................... 82.1.6. Data analysis ................................................................................... 8
2.2. Results ........................................................................................................ 102.2.1. Behavioural ................................................................................... 102.2.2. Electrophysiology .......................................................................... 10
2.3. Experiment 1 Discussion ............................................................................ 14
Chapter 3. Experiment 2 ................................................................................ 163.1. Methods ...................................................................................................... 17
3.1.1. Participants .................................................................................... 173.1.2. Apparatus ...................................................................................... 173.1.3. Stimuli and Procedure ................................................................... 173.1.4. Electrophysiological Recording and Analysis ................................ 18
3.2. Results ........................................................................................................ 183.2.1. Behaviour ...................................................................................... 183.2.2. Electrophysiology .......................................................................... 19
3.3. Experiment 2 Discussion ............................................................................ 24
Chapter 4. General Discussion ..................................................................... 25
References ...................................................................................................... 29
viii
List of Figures
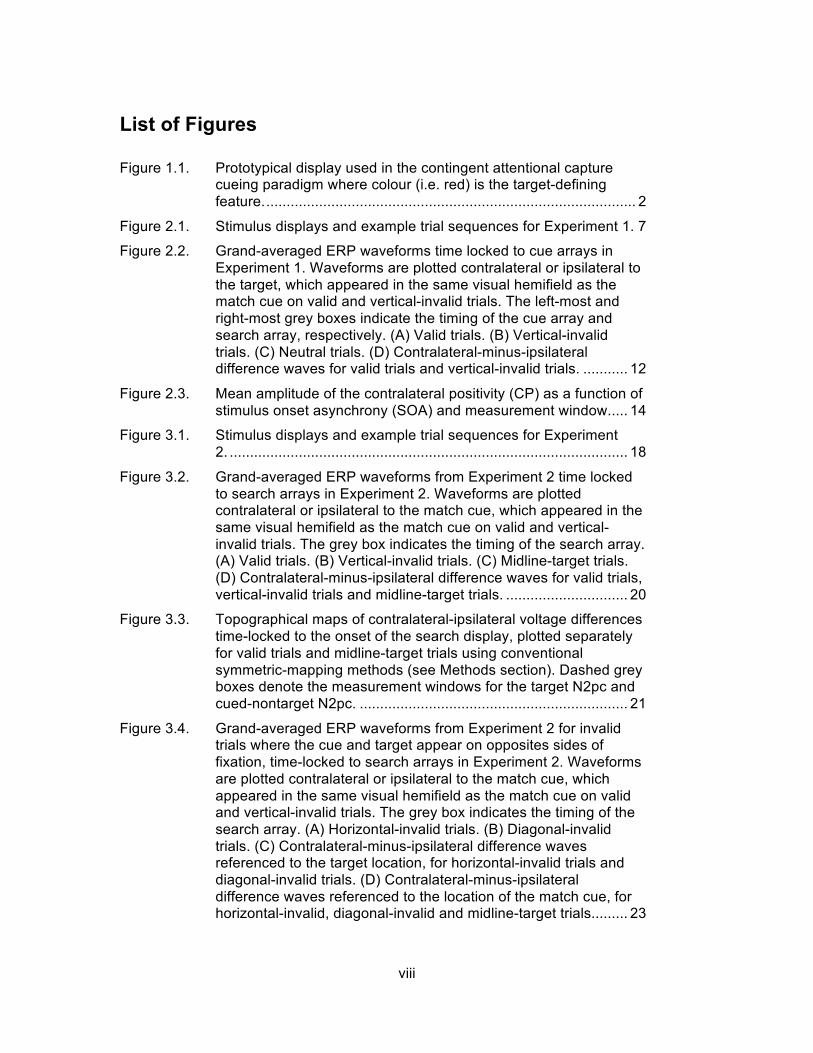
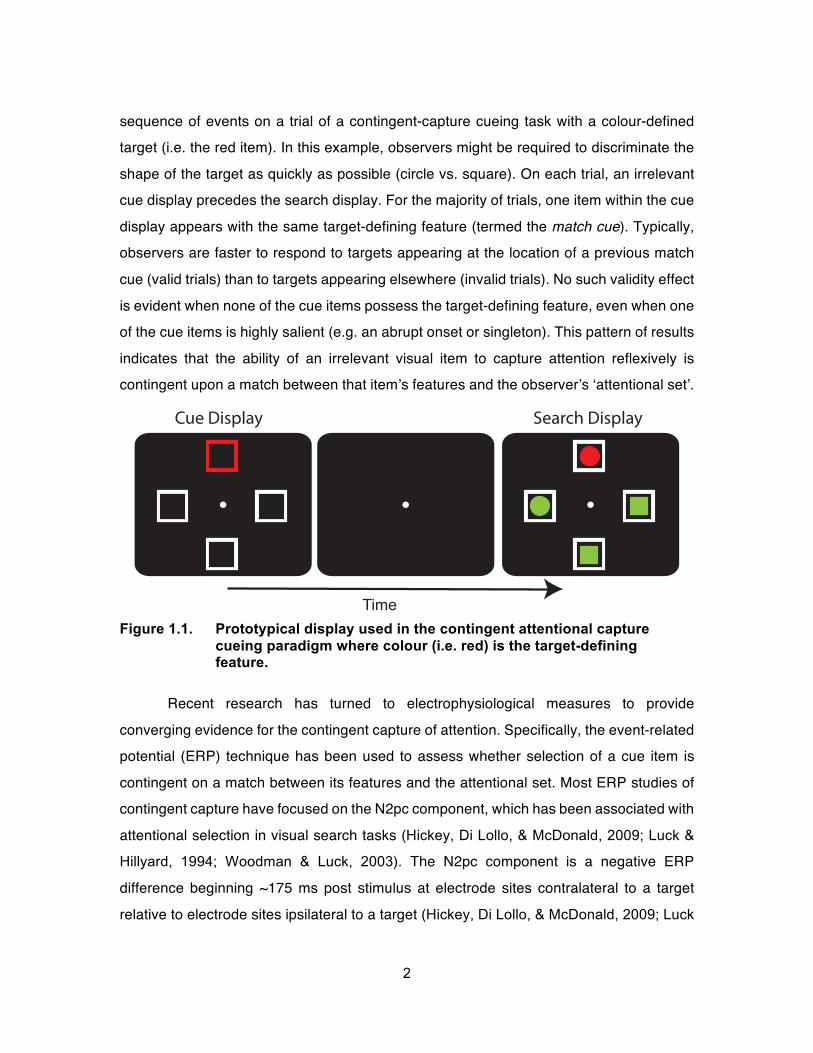
Figure 1.1. Prototypical display used in the contingent attentional capture cueing paradigm where colour (i.e. red) is the target-defining feature. ........................................................................................... 2
Figure 2.1. Stimulus displays and example trial sequences for Experiment 1. 7Figure 2.2. Grand-averaged ERP waveforms time locked to cue arrays in
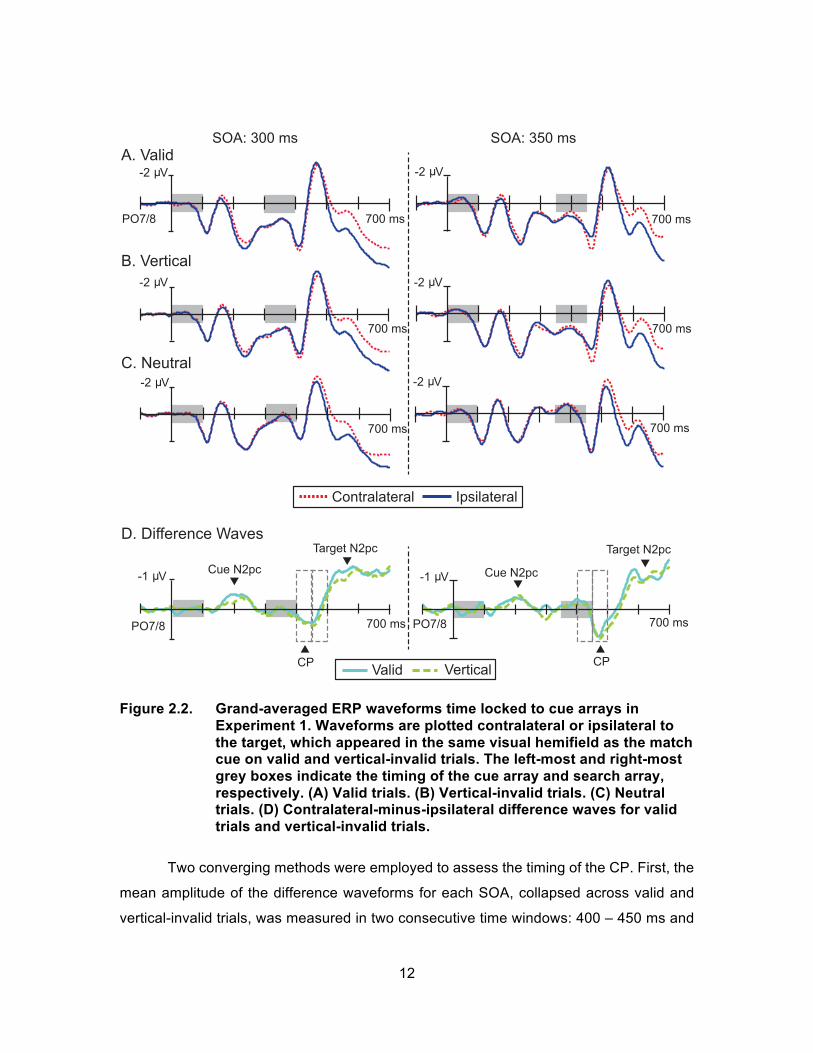
Experiment 1. Waveforms are plotted contralateral or ipsilateral to the target, which appeared in the same visual hemifield as the match cue on valid and vertical-invalid trials. The left-most and right-most grey boxes indicate the timing of the cue array and search array, respectively. (A) Valid trials. (B) Vertical-invalid trials. (C) Neutral trials. (D) Contralateral-minus-ipsilateral difference waves for valid trials and vertical-invalid trials. ........... 12
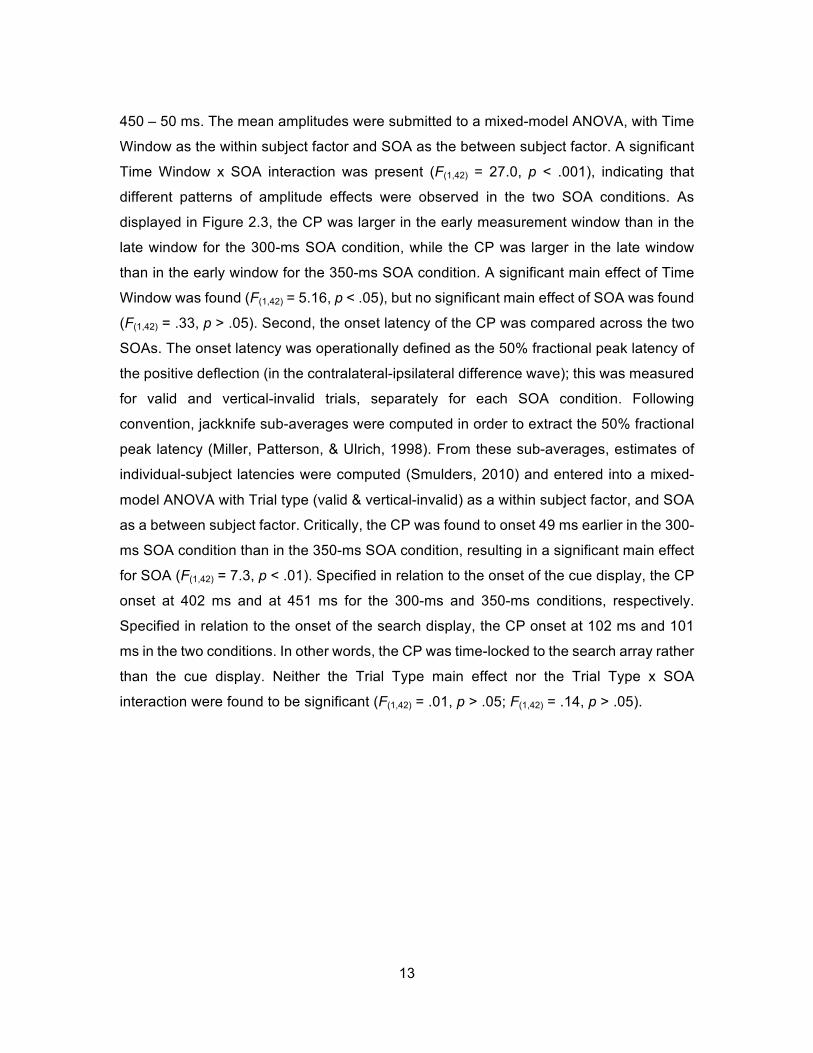
Figure 2.3. Mean amplitude of the contralateral positivity (CP) as a function of stimulus onset asynchrony (SOA) and measurement window. .... 14
Figure 3.1. Stimulus displays and example trial sequences for Experiment 2. .................................................................................................. 18
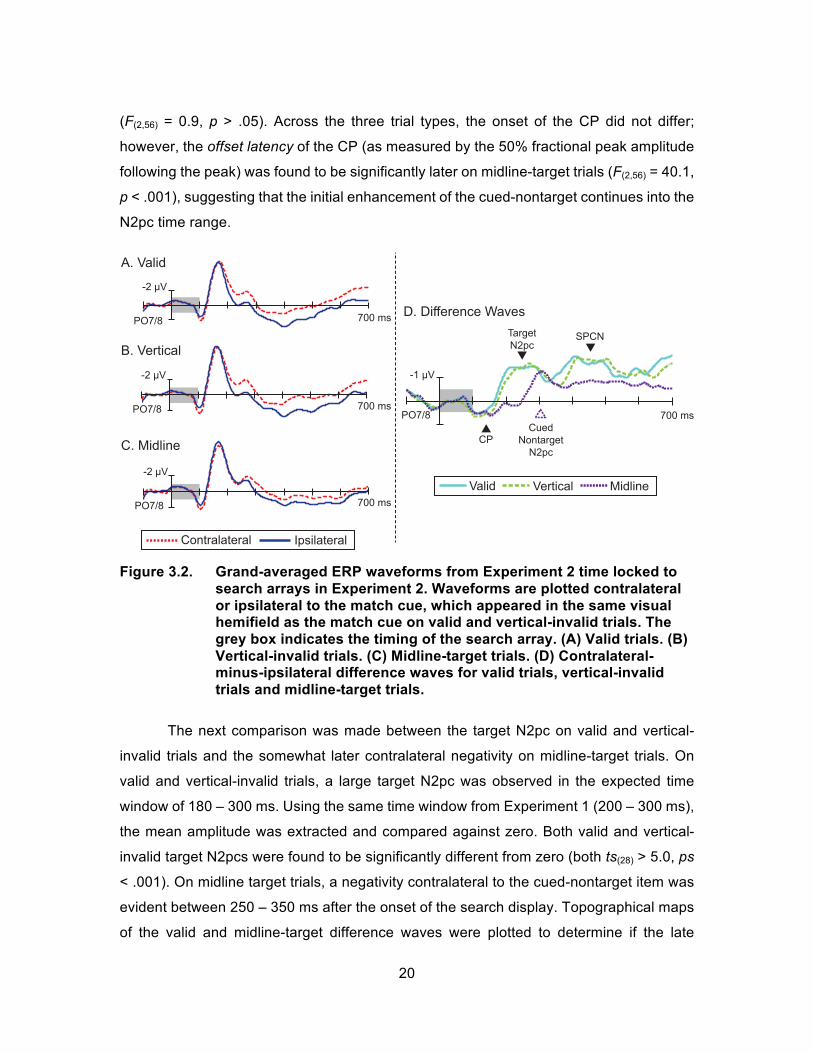
Figure 3.2. Grand-averaged ERP waveforms from Experiment 2 time locked to search arrays in Experiment 2. Waveforms are plotted contralateral or ipsilateral to the match cue, which appeared in the same visual hemifield as the match cue on valid and vertical-invalid trials. The grey box indicates the timing of the search array. (A) Valid trials. (B) Vertical-invalid trials. (C) Midline-target trials. (D) Contralateral-minus-ipsilateral difference waves for valid trials, vertical-invalid trials and midline-target trials. .............................. 20
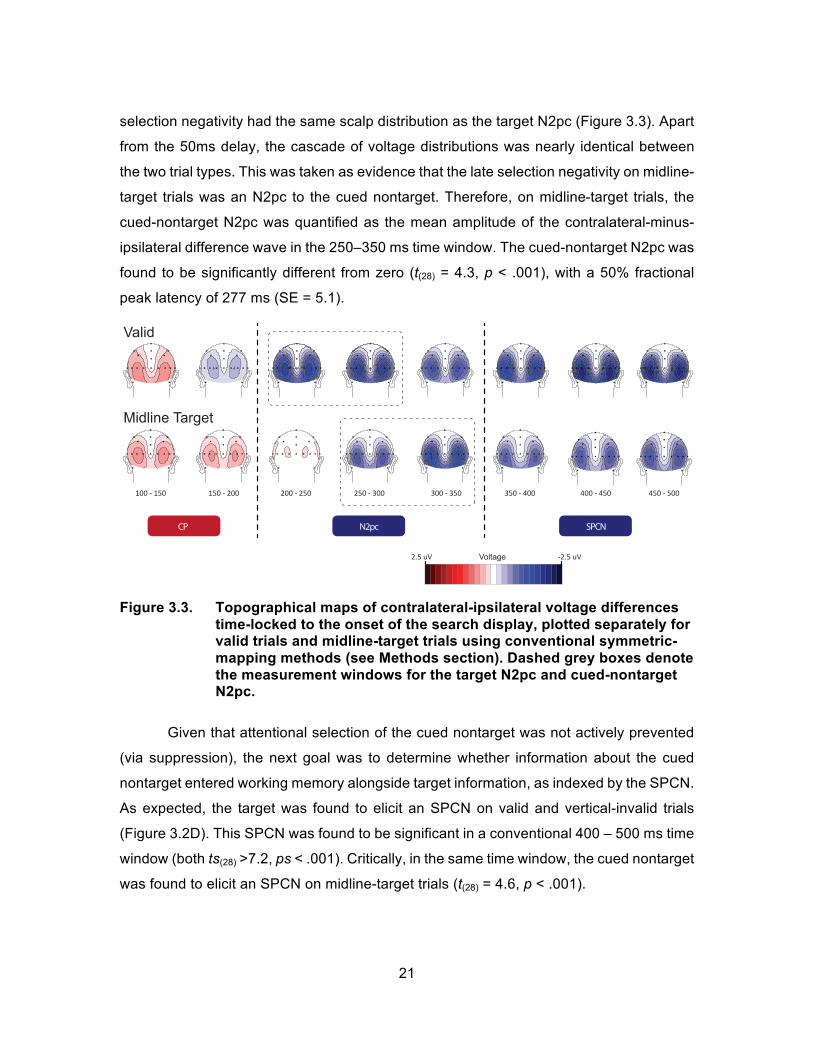
Figure 3.3. Topographical maps of contralateral-ipsilateral voltage differences time-locked to the onset of the search display, plotted separately for valid trials and midline-target trials using conventional symmetric-mapping methods (see Methods section). Dashed grey boxes denote the measurement windows for the target N2pc and cued-nontarget N2pc. .................................................................. 21
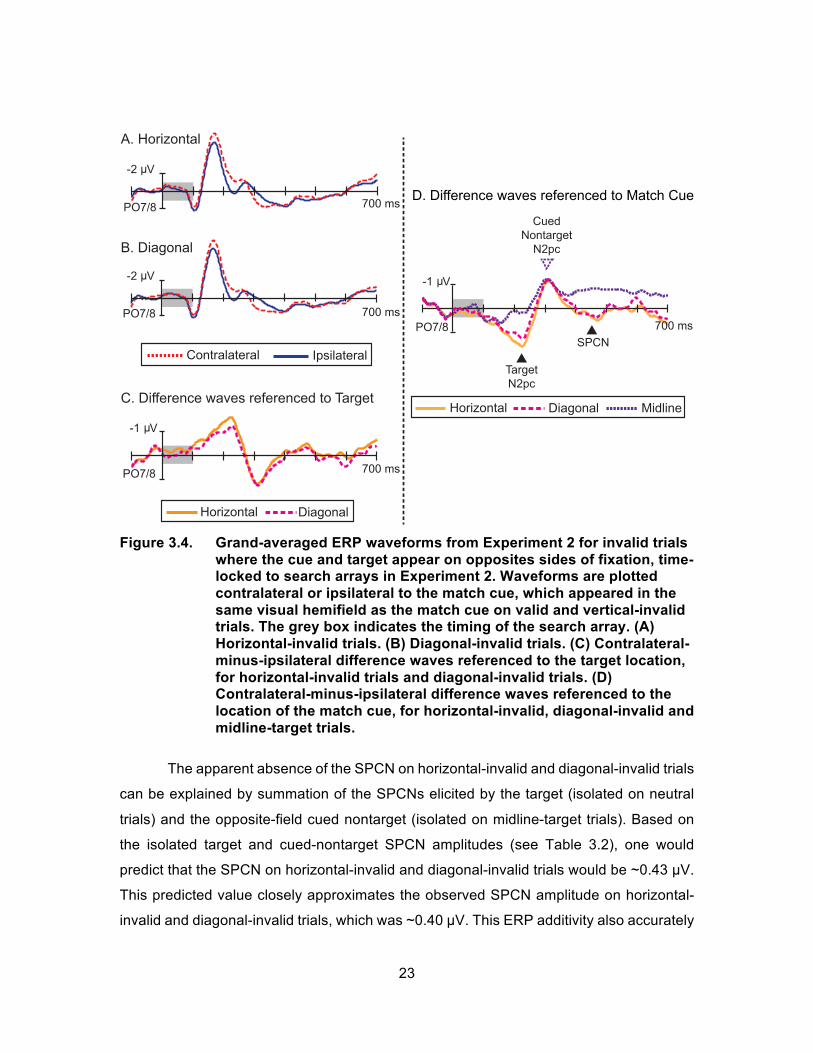
Figure 3.4. Grand-averaged ERP waveforms from Experiment 2 for invalid trials where the cue and target appear on opposites sides of fixation, time-locked to search arrays in Experiment 2. Waveforms are plotted contralateral or ipsilateral to the match cue, which appeared in the same visual hemifield as the match cue on valid and vertical-invalid trials. The grey box indicates the timing of the search array. (A) Horizontal-invalid trials. (B) Diagonal-invalid trials. (C) Contralateral-minus-ipsilateral difference waves referenced to the target location, for horizontal-invalid trials and diagonal-invalid trials. (D) Contralateral-minus-ipsilateral difference waves referenced to the location of the match cue, for horizontal-invalid, diagonal-invalid and midline-target trials. ........ 23
ix
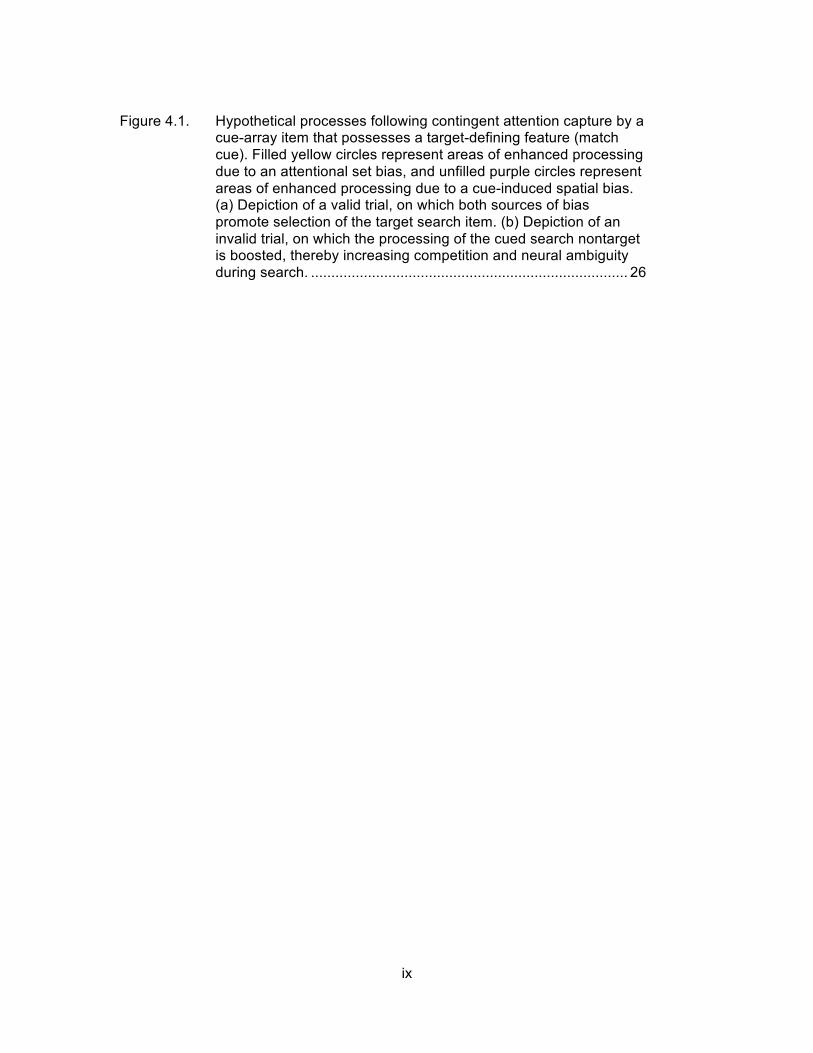
Figure 4.1. Hypothetical processes following contingent attention capture by a cue-array item that possesses a target-defining feature (match cue). Filled yellow circles represent areas of enhanced processing due to an attentional set bias, and unfilled purple circles represent areas of enhanced processing due to a cue-induced spatial bias. (a) Depiction of a valid trial, on which both sources of bias promote selection of the target search item. (b) Depiction of an invalid trial, on which the processing of the cued search nontarget is boosted, thereby increasing competition and neural ambiguity during search. .............................................................................. 26
x
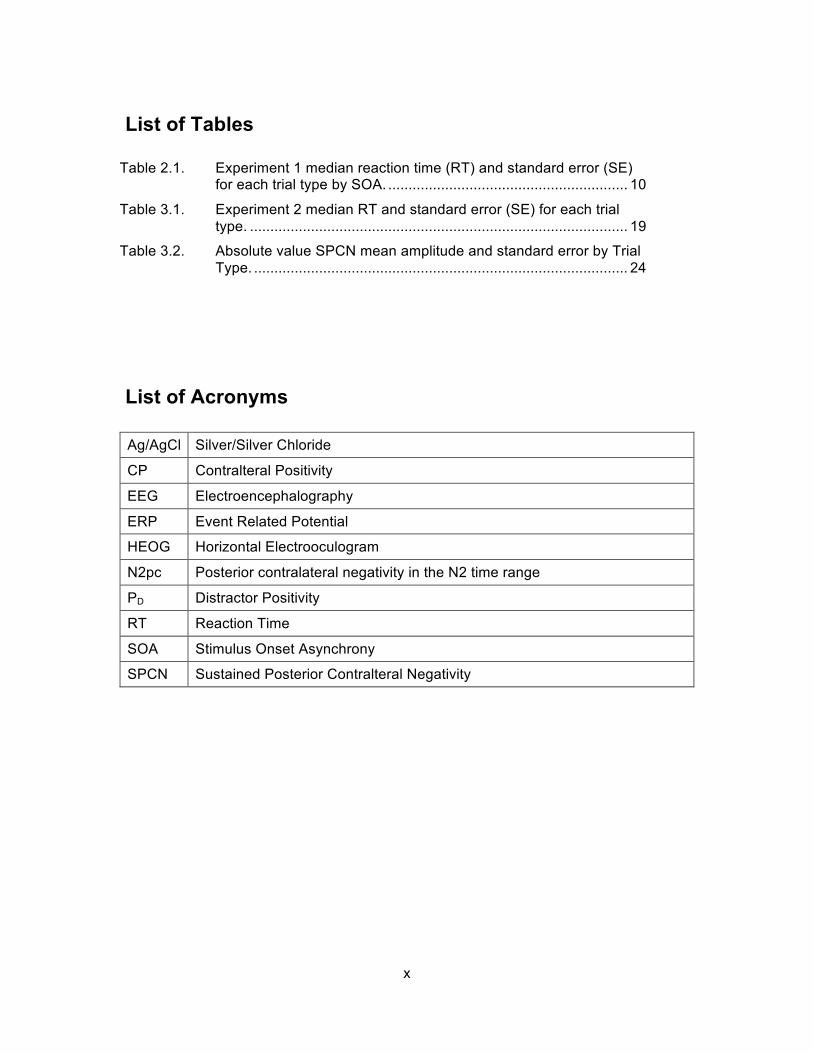
List of Tables
Table 2.1. Experiment 1 median reaction time (RT) and standard error (SE) for each trial type by SOA. ........................................................... 10
Table 3.1. Experiment 2 median RT and standard error (SE) for each trial type. ............................................................................................. 19
Table 3.2. Absolute value SPCN mean amplitude and standard error by Trial Type. ............................................................................................ 24
List of Acronyms
Ag/AgCl Silver/Silver Chloride
CP Contralteral Positivity
EEG Electroencephalography
ERP Event Related Potential
HEOG Horizontal Electrooculogram
N2pc Posterior contralateral negativity in the N2 time range
PD Distractor Positivity
RT Reaction Time
SOA Stimulus Onset Asynchrony
SPCN Sustained Posterior Contralteral Negativity
1
Chapter 1. Introduction
An observer’s visual system receives a continuous stream of information from the
environment. The processing of incoming visual information can be biased towards certain
stimuli or locations so that potentially relevant objects can be consciously perceived, acted
upon, and remembered. The neural mechanisms that bias processing of sensory
information are generally referred to as selective attention mechanisms. These attentional
mechanisms can be influenced by several factors, including an observer’s goals (top-down
control; Egeth & Yantis, 1997) and the properties of the stimulus themselves (bottom-up
control; Theeuwes, 1991).
Researchers have employed the cue-target paradigm to investigate top-down and
bottom-up control of attention (e.g. Posner, 1980). In the general paradigm, a cue display
is used to orient attention to a particular location of the visual field shortly before the
appearance of a task-relevant target stimulus or display. Typically, observers are required
to detect the target or discriminate one of its features, and to make an appropriate manual
response as quickly and as accurately as possible. Researchers employ peripheral cues
(i.e. abrupt visual onsets appearing at a potential target location) or a centrally presented
symbolic cue to investigate the effects of involuntary (i.e. reflexive) and voluntary shifts of
attention, respectively (e.g. Jonides, 1981; McDonald & Ward, 1999; Störmer, McDonald,
& Hillyard, 2009; Theeuwes, 1991; Woodman & Luck, 1999; Wright & Ward, 1994; Yantis
& Jonides, 1990).
The contingent capture cueing paradigm was developed to determine the precise
interplay between bottom-up and top-down control processes mediating shifts of attention
to peripheral cues (Folk & Remington, 2006 & 2008; Folk, Remington, & Johnston, 1992;
Folk, Remington, & Wright, 1994). In this paradigm, the target appears in a multi-item
search display and is defined by a unique feature. Participants must establish an
‘attentional set’ for that specific feature in order to find the target. Figure 1.1 depicts a
2
sequence of events on a trial of a contingent-capture cueing task with a colour-defined
target (i.e. the red item). In this example, observers might be required to discriminate the
shape of the target as quickly as possible (circle vs. square). On each trial, an irrelevant
cue display precedes the search display. For the majority of trials, one item within the cue
display appears with the same target-defining feature (termed the match cue). Typically,
observers are faster to respond to targets appearing at the location of a previous match
cue (valid trials) than to targets appearing elsewhere (invalid trials). No such validity effect
is evident when none of the cue items possess the target-defining feature, even when one
of the cue items is highly salient (e.g. an abrupt onset or singleton). This pattern of results
indicates that the ability of an irrelevant visual item to capture attention reflexively is
contingent upon a match between that item’s features and the observer’s ‘attentional set’.
Figure 1.1. Prototypical display used in the contingent attentional capture
cueing paradigm where colour (i.e. red) is the target-defining feature.
Recent research has turned to electrophysiological measures to provide
converging evidence for the contingent capture of attention. Specifically, the event-related
potential (ERP) technique has been used to assess whether selection of a cue item is
contingent on a match between its features and the attentional set. Most ERP studies of
contingent capture have focused on the N2pc component, which has been associated with
attentional selection in visual search tasks (Hickey, Di Lollo, & McDonald, 2009; Luck &
Hillyard, 1994; Woodman & Luck, 2003). The N2pc component is a negative ERP
difference beginning ~175 ms post stimulus at electrode sites contralateral to a target
relative to electrode sites ipsilateral to a target (Hickey, Di Lollo, & McDonald, 2009; Luck
Cue Display
Search Display
Time
Cue Display Search Display
3
& Hillyard, 1994). Several ERP studies have found that match cues elicit the N2pc,
whereas cues that do not match the observer’s attentional set do not (Eimer & Kiss, 2008,
2010; Eimer, Kiss, Press, & Sauter, 2009; LeBlanc, Prime, & Jolicœur, 2007; Lien,
Ruthruff, Goodin, & Remington, 2008). This pattern of results is consistent with the
contingent attention capture hypothesis (Folk et al, 1992 & 1994; Folk & Remington, 2006
& 2008) but not with the perspective that attention capture is completely automatic
(Theeuwes, 1994).
Despite converging behavioural and ERP evidence for contingent attention
capture, it is still unclear how these spatial shifts of attention manifest in the reaction time
(RT) effects routinely reported. One view that is consistent with most models of visual
selection is that reflexive orienting of attention to the cued location enhances early
perceptual processing of subsequent items appearing nearby (e.g. Hopfinger & West,
2005). In the context of the contingent capture paradigm, it would follow that perceptual
processing of the target would be enhanced on valid trials relative to invalid trials, thereby
biasing selection in favour of the task-relevant search item. Although this view is widely
accepted, results of a recent ERP study provided evidence for suppression at the location
of a match cue (Sawaki & Luck, 2013). Specifically, a contralateral positivity (CP) that was
assumed to reflect suppression (i.e. a distractor positivity, or PD; Gaspar, Christie, Prime,
Jolicœur, & McDonald, in press; Gaspar & McDonald, 2014; Hickey et al., 2009; Sawaki,
Geng, & Luck, 2012) was observed after the cue-elicited N2pc. To account for the
facilitatory cueing effect (shorter RTs on valid trials), Sawaki and Luck concluded that the
cued location was not fully suppressed.
Two timing-centered considerations call into question the conclusion that
processing the match-cue location was suppressed in Sawaki and Luck’s (2013) study.
First, the CP started 400 ms after the onset of the cue display, whereas the PD typically
appears 180 – 250 ms after the appearance of a search display (Gaspar et al., in press;
Gaspar & McDonald, 2014; Hickey et al., 2009; Sawaki et al., 2012). Second, the putative
PD onset was actually about 100 ms after the appearance of the subsequent search
display. Sawaki and Luck argued that the CP was too early to reflect cortical activity
triggered by the target, but because the SOA was fixed, in their study, it is currently not
4
possible to determine whether the CP was time-locked to the cue display or to the search
display.
Consistent with the possibility that the CP was triggered by the search display,
several prior ERP studies have demonstrated that orienting attention to the left or right in
advance of a bilateral visual target array can modulate the amplitude of the target-elicited
P1 component. Specifically, across a variety of paradigms, the target-elicited ERP
waveform is more positive contralateral to an attended side than ipsilateral to an attended
side in the time range of the P1 (and subsequent N1; Fukuda & Vogel, 2009; Heinze, Luck,
Mangun, & Hillyard, 1990; Luck, Heinze, Mangun, & Hillyard, 1990; McDonald, Teder-
Sälejärvi, Russo, & Hillyard, 2005; Störmer, McDonald, Hillyard, 2009). Such contralateral
positivities have been observed when attention is sustained at a location for several trials
(Heinze et al., 1990; Luck et al., 1990), symbolically cued to a location on a trial-by-trial
basis (e.g. Mangun & Hillyard, 1991; Sawaki et al., 2012), cued reflexively by peripheral
visual transients (Hopfinger & Mangun, 1998), or cued reflexively by sudden peripheral
sounds (McDonald et al., 2005; Störmer et al., 2009). These target-elicited CP
components have been hypothesized to reflect signal enhancement at early stages of
perceptual processing. Thus, it is possible that the CP reported by Sawaki and Luck
reflected enhancement of the cued search items rather than suppression of the match
cue.
The research described in this thesis was conducted to address two outstanding
questions about the contingent capture cueing paradigm. Experiment 1 was designed to
test the nature of the contralateral positivity reported by Sawaki and Luck (2013) by varying
the cue-target stimulus onset asynchrony (SOA). If the CP reflects cue suppression, it
would be time-locked to the onset of the cue display regardless of when the target
appeared. Alternatively, if the CP reflects enhancement of the cued search display item,
it would be time-locked to the onset of the search display rather than the cue display. To
foreshadow the results, the CP was found to be time-locked to the search array.
Experiment 2 was designed to track processing of a cued nontarget search item beyond
the CP. The main objective of Experiment 2 was to determine whether the cued nontarget
was selectively processed at the stage of visual processing indexed by the N2pc.

5
Surprisingly, the cued nontarget was found to trigger not only the N2pc but a subsequent
contralateral ERP negativity associated with item identification and active representation
in working memory.
6
Chapter 2. Experiment 1
2.1. Methods
2.1.1. Ethics
The Office of Research Ethics at Simon Fraser University approved all
experimental procedures.
2.1.2. Participants
Forty-nine neurologically healthy observers participated in Experiment 1 after
giving informed consent. Data from four participants were excluded from the analysis
because their ocular artifacts exceeded our standard laboratory limits (>25% of the trials
contaminated by ocular artifacts or averaged horizontal electrooculogram (HEOG)
deflections > 3.2 µV; see below). In the end, data from 44 participants (22 in condition 1;
22 in condition 2; 17 men; mean age = 19.5 years; three left-handed) were analyzed.
Participants reported normal or corrected-to-normal vision and were screened for colour
blindness using the Ishihara colour plates.
2.1.3. Stimuli and procedure
All stimuli were presented on a black background (u’ = .280, v’ = .360). Participants
viewed sequences of two four-item displays. The first display (cue display) contained four
filled circles (1.4° radius), whereas the second display (target display) consisted of four
unfilled squares (1.4° x 1.4°) that each had one missing side. Stimuli on both displays
appeared 1.6° above and below the horizontal meridian and 2.7° to the left and right of
the vertical meridian (Figure 1). At the start of each trial, participants were presented with
one of two cue displays: a match-cue display or a neutral-cue display. Each item in the
match cue and search displays possessed a unique colour: red (u’ = .655, v’ = .320), green
(u’ = .313, v’ = .633), blue (u’ = .142, v’ = .045), or yellow (u’ = .425, v’ = .536); whereas,
only white circles (u’ = .303, v’ = .325) were presented for neutral cue displays.
7
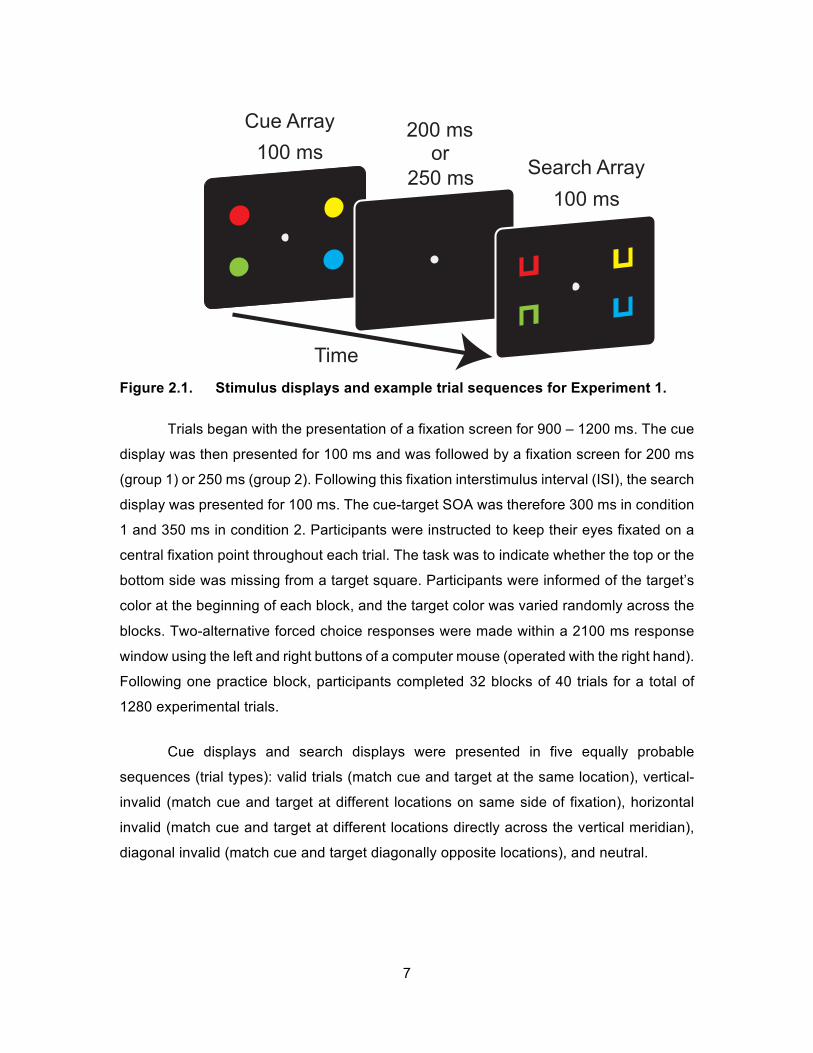
Figure 2.1. Stimulus displays and example trial sequences for Experiment 1.
Trials began with the presentation of a fixation screen for 900 – 1200 ms. The cue
display was then presented for 100 ms and was followed by a fixation screen for 200 ms
(group 1) or 250 ms (group 2). Following this fixation interstimulus interval (ISI), the search
display was presented for 100 ms. The cue-target SOA was therefore 300 ms in condition
1 and 350 ms in condition 2. Participants were instructed to keep their eyes fixated on a
central fixation point throughout each trial. The task was to indicate whether the top or the
bottom side was missing from a target square. Participants were informed of the target’s
color at the beginning of each block, and the target color was varied randomly across the
blocks. Two-alternative forced choice responses were made within a 2100 ms response
window using the left and right buttons of a computer mouse (operated with the right hand).
Following one practice block, participants completed 32 blocks of 40 trials for a total of
1280 experimental trials.
Cue displays and search displays were presented in five equally probable
sequences (trial types): valid trials (match cue and target at the same location), vertical-
invalid (match cue and target at different locations on same side of fixation), horizontal
invalid (match cue and target at different locations directly across the vertical meridian),
diagonal invalid (match cue and target diagonally opposite locations), and neutral.
Cue Array 100 ms
Time
250 ms
200 msor
100 msSearch Array
250 ms
A.
B.
Time
8
2.1.4. Apparatus
Participants sat approximately 57cm from the display monitor in a sound
attenuated and electrically shielded booth under LED lighting. A 24-inch LCD monitor with
a screen resolution of 1980 x 1080 pixels was used for stimulus presentation. Stimulus
presentation and recording of participants’ responses was controlled by Presentation
(Neurobehavioral Systems Inc, Albany, CA) from a Windows-based computer. Custom
software (Acquire) responsible for EEG acquisition was run from a second Windows-
based computer. A 64-channel, 12-bit A-to-D board (PCI 6071e, National Instruments,
Austin, TX) housed in the acquisition computer was connected to an EEG amplifier system
with high electrode impedance (SA Instruments, San Diego, CA). Sintered Ag/AgCl
electrodes mounted in an elastic cap (Electrode Arrays, El Paso, TX) were used to record
EEG.
2.1.5. Electrophysiological recording
EEG was recorded from 25 sintered Ag/AgCl electrodes placed at FP1, FPz, FP2,
F7, F3, Fz, F4, F8, T7, C3, Cz, C4, T8, P7, P3, Pz, P4, P8, PO7, POz, PO8, O1, Oz, O2,
& M1. All EEG signals were referenced to the right mastoid during recording of the EEG.
Bipolar electrodes positioned lateral to the external canthi of each eye monitored
horizontal eye movements (HEOG). Electrode impedances were kept below 10 kOhms.
All signals were recorded with a bandpass filter of 0.01 – 100Hz and a gain of 20,000
using SA Instrument amplifiers and custom Windows software (Acquire). All EEG signals
were digitized at 500 Hz.
2.1.6. Data analysis
Artifact rejection and ERP averaging were conducted using ERPLAB (Lopez-
Calderon & Luck, 2014). The EEG and HEOG were segmented into 1.25-s epochs,
starting 250ms before cue display onset. Epochs containing incorrect responses or ocular
artifacts (saccades or blinks) were excluded from further analyses. Saccades and blinks
were detected in the HEOG and Fp2 channel, respectively, and were defined as sudden
changes in voltage (step functions), over the course of 50 ms, greater than 16 microvolts
for a saccade and 35 microvolts for a blink. If any artifact was detected, the epoch was
9
rejected from subsequent averaging and analysis. We replaced any participants for whom
the residual HEOG activity was more than 3.2 μV, meaning that the residual eye
movements in the remaining participants was less than 0.2o (Lins, Picton, Berg, & Scherg,
1993; McDonald & Ward, 1999).
EEG and HEOG signals were digitally low-pass filtered with a half-power cutoff at
30 Hz to remove high frequency noise. EEG signals were then digitally re-referenced to
the average of the left and right mastoids. ERPs time-locked to the presentation of the cue
display and referenced to the cue location were computed from artifact-free trials on which
participants correctly identified the target. For each participant, the ERP waveforms were
collapsed across left and right visual hemifields and left and right electrode sites to create
waveforms recorded contralateral and ipsilateral to the match-cue item. Lateralized ERP
difference waveforms were then derived for each trial type by subtracting the ipsilateral
waveform from the corresponding contralateral waveform using lateral occipital electrode
sites (PO7 and PO8). Negative voltages were plotted upward, such that cue- and target-
elicited N2pc components would appear as upward deflections and any contralateral
positivities would appear as downward deflections.
The mean amplitudes of the lateralized ERP components of interest were
measured at lateral occipital electrodes (PO7/PO8) within time windows selected a priori
on the basis of prior studies and/or specific hypotheses. All measurements were based on
the contralateral-ipsilateral difference waves. The cue-elicited N2pc was measured 175–
225 ms post-cue, whereas the target-elicited N2pc was measured 200–300 ms post-target
(cf. Sawaki & Luck, 2013). The CP was measured in two time intervals, one that matched
Sawaki and Luck’s (2013) PD measurement window (400–450 ms post-cue; 100–150 ms
post-target) and one that was delayed by 50 ms to match the difference in SOAs across
the two conditions (450–500 ms post-cue; 100–150 ms post-target).
10
2.2. Results
2.2.1. Behavioural
Median RT data for all trial types is presented in Table 2.1. For both SOA
conditions, RTs were shortest on valid trials, intermediate on neutral trials and longest on
invalid trials. RTs were subjected to a mixed-model ANOVA with Trial Type as the within
subject factor and SOA condition as the between subject factor. The ANOVA revealed a
significant main effect of Trial Type: F(4,168) = 87.1, p < .001. The Trial Type x SOA
interaction was not significant (F(1,168) = 0.23, p > .05), indicating that the pattern of RTs
across trial types was similar between SOAs. Planned pairwise comparisons determined
that valid trials were significantly shorter than all other trial types for each SOA (ps < .01,
Bonferroni corrected). Finally, there was no main effect of SOA on RT (F(1,43) = 4.0, p >
.05). RTs follow the cost/benefit pattern reported by Sawaki and Luck (2013), and previous
studies using the contingent capture cueing paradigm (e.g. Eimer & Kiss, 2008, 2010;
Eimer et al., 2009).
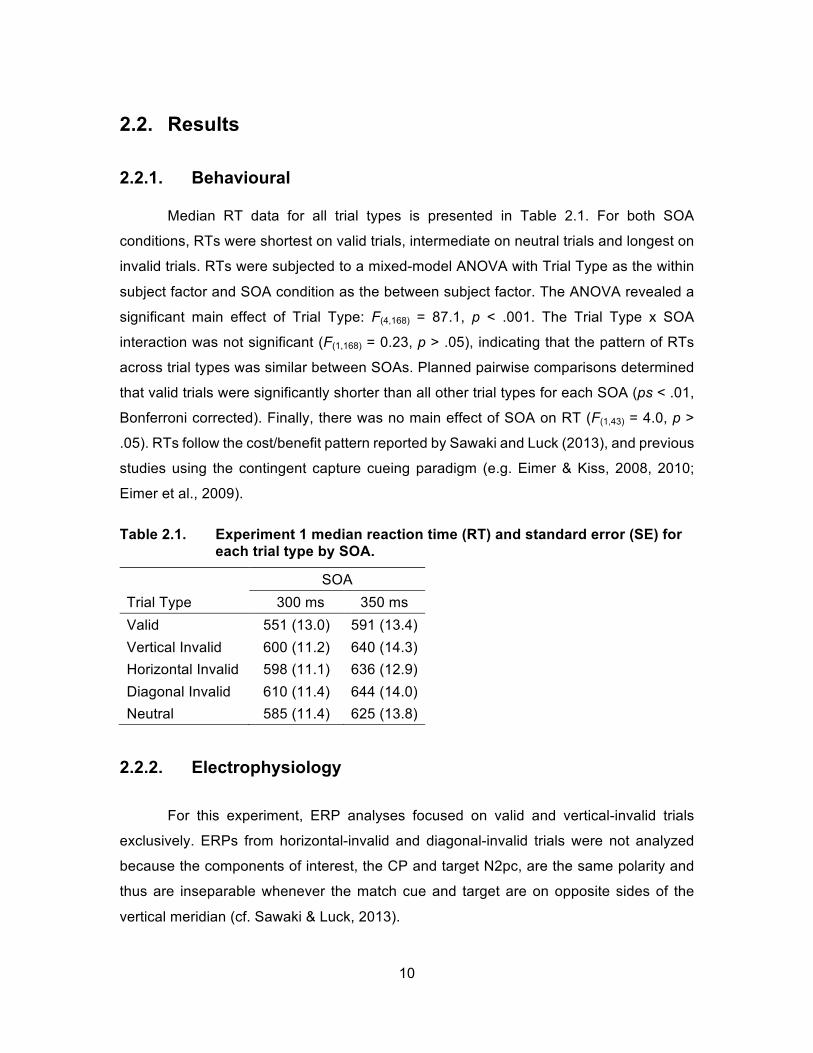
Table 2.1. Experiment 1 median reaction time (RT) and standard error (SE) for each trial type by SOA.
SOA Trial Type 300 ms 350 ms Valid 551 (13.0) 591 (13.4) Vertical Invalid 600 (11.2) 640 (14.3) Horizontal Invalid 598 (11.1) 636 (12.9) Diagonal Invalid 610 (11.4) 644 (14.0) Neutral 585 (11.4) 625 (13.8)
2.2.2. Electrophysiology
For this experiment, ERP analyses focused on valid and vertical-invalid trials
exclusively. ERPs from horizontal-invalid and diagonal-invalid trials were not analyzed
because the components of interest, the CP and target N2pc, are the same polarity and
thus are inseparable whenever the match cue and target are on opposite sides of the
vertical meridian (cf. Sawaki & Luck, 2013).
11
The first goal of Experiment 1 was to replicate Sawaki and Luck’s 2013 findings
using a 300 ms SOA. In the left column of Figure 2.2, the ERP (panels A-C) and difference
waveforms (panel D) are depicted for the 300 ms SOA condition. On Valid and vertical-
invalid trials, a small match-cue elicited N2pc was evident in the ERP waveforms
beginning approximately 150 ms post cue display. A measurement window of 175 – 225
ms (identical to the window used by Sawaki and Luck, 2013) was used to assess mean
amplitude of the match-cue N2pc. Valid and vertical-invalid match-cue N2pcs were found
to be significantly different from zero (both ts(21) > 2.80, ps < .01). A contralateral positivity
(CP) was observed for both the valid and vertical-invalid trials beginning at approximately
400 ms. Again, using a measurement window identical to Sawaki and Luck’s (i.e. 100 –
150 ms post search display), the mean amplitude of the CP was found to be significantly
different from zero (both ts(21) > 3.13, ps < .01). The target-elicited N2pc began ~180 ms
after the presentation of the search display. Measured 200 – 300 ms post search display
onset, the target N2pc was found to significantly differ from zero (both ts(21) > 4.68, ps <
.001). The neutral cue elicited neither an N2pc nor the subsequent CP (both ts(21) < .26,
ps > .05); however, a target-elicited N2pc was observed beginning approximately 150 ms
post search display onset (t(21) = 5.07, p < .001). This pattern of lateralized activity closely
replicated Sawaki and Luck’s (2013) ERP findings.
As can be seen in the right column of Figure 2.2, similar lateralized deflections
were found in the 350-ms SOA condition. As in the 300-ms SOA condition, small match-
cue-elicited N2pc deflections were evident in the difference waveforms beginning
approximately 150 ms post cue display. These N2pc deflections were significantly different
from zero for both valid trials and vertical-invalid trials (both ts(21) > 3.36 ps < .01) but not
for neutral trials (t(21) = 1.20, p > .05). Paralleling these N2pc results, a CP was observed
on both valid and vertical-invalid trials and was significantly different from zero 100 – 150
ms post search display (both ts(21) > 4.62, ps < .001). The target-elicited N2pc began ~180
ms after the presentation of the search display and was significantly different from zero in
the 200–300 ms measurement window (both ts(21) > 3.91, ps < .01). On neutral trials, the
match-cue N2pc and CP were absent (both ts(21) < 2.01, p > .05), but a target N2pc was
present as expected (t(21) = 4.98, p < .001).
12
Figure 2.2. Grand-averaged ERP waveforms time locked to cue arrays in
Experiment 1. Waveforms are plotted contralateral or ipsilateral to the target, which appeared in the same visual hemifield as the match cue on valid and vertical-invalid trials. The left-most and right-most grey boxes indicate the timing of the cue array and search array, respectively. (A) Valid trials. (B) Vertical-invalid trials. (C) Neutral trials. (D) Contralateral-minus-ipsilateral difference waves for valid trials and vertical-invalid trials.
Two converging methods were employed to assess the timing of the CP. First, the
mean amplitude of the difference waveforms for each SOA, collapsed across valid and
vertical-invalid trials, was measured in two consecutive time windows: 400 – 450 ms and
SOA: 300 ms SOA: 350 ms
A. Valid
B. Vertical
C. Neutral
D. Difference Waves
Target N2pc
CP
Cue N2pc
Contralateral Ipsilateral
Valid Vertical
PO7/8
Cue N2pc
CP
Target N2pc
PO7/8 700 ms 700 ms
ȝ-1 V ȝ-1 V
ȝ
PO7/8 700 ms
ȝ-2 V
700 ms
ȝ-2 V
700 ms
ȝ-2 V
700 ms
ȝ-2 V
700 ms
ȝ-2 V
700 ms
ȝ-2 V
13
450 – 50 ms. The mean amplitudes were submitted to a mixed-model ANOVA, with Time
Window as the within subject factor and SOA as the between subject factor. A significant
Time Window x SOA interaction was present (F(1,42) = 27.0, p < .001), indicating that
different patterns of amplitude effects were observed in the two SOA conditions. As
displayed in Figure 2.3, the CP was larger in the early measurement window than in the
late window for the 300-ms SOA condition, while the CP was larger in the late window
than in the early window for the 350-ms SOA condition. A significant main effect of Time
Window was found (F(1,42) = 5.16, p < .05), but no significant main effect of SOA was found
(F(1,42) = .33, p > .05). Second, the onset latency of the CP was compared across the two
SOAs. The onset latency was operationally defined as the 50% fractional peak latency of
the positive deflection (in the contralateral-ipsilateral difference wave); this was measured
for valid and vertical-invalid trials, separately for each SOA condition. Following
convention, jackknife sub-averages were computed in order to extract the 50% fractional
peak latency (Miller, Patterson, & Ulrich, 1998). From these sub-averages, estimates of
individual-subject latencies were computed (Smulders, 2010) and entered into a mixed-
model ANOVA with Trial type (valid & vertical-invalid) as a within subject factor, and SOA
as a between subject factor. Critically, the CP was found to onset 49 ms earlier in the 300-
ms SOA condition than in the 350-ms SOA condition, resulting in a significant main effect
for SOA (F(1,42) = 7.3, p < .01). Specified in relation to the onset of the cue display, the CP
onset at 402 ms and at 451 ms for the 300-ms and 350-ms conditions, respectively.
Specified in relation to the onset of the search display, the CP onset at 102 ms and 101
ms in the two conditions. In other words, the CP was time-locked to the search array rather
than the cue display. Neither the Trial Type main effect nor the Trial Type x SOA
interaction were found to be significant (F(1,42) = .01, p > .05; F(1,42) = .14, p > .05).
14
Figure 2.3. Mean amplitude of the contralateral positivity (CP) as a function of
stimulus onset asynchrony (SOA) and measurement window.
2.3. Experiment 1 Discussion
The behavioural and electrophysiological results from Experiment 1 are broadly
consistent with past research. As expected, RTs were shorter on valid trials than on the
various invalid trial types. Consistent with several ERP studies of contingent capture, the
match cue elicited an N2pc, thereby confirming that observers selectively attended to the
cue item that shared the target’s colour. Finally, following presentation of the search
display, a robust target N2pc was measured, indicating that observers selectively attended
to the target search item.
The main objective of Experiment 1 was to determine whether the CP was time-
locked to the cue display or to the search display. The results were clear-cut: the CP was
found to be time-locked not to the cue display but to the subsequent search array.
Consequently, it is highly unlikely that the CP is an index of cue suppression, as proposed
by Sawaki and Luck (2013). Given the similarities between the CP observed here and
those previously attributed to attention-induced enhancement of target visual processing
400 - 450 ms 450 - 500 ms
-0.20
0.0
0.20
0.40
0.60
0.80350 ms SOA
300 ms SOA
Time Window (ms)
CP
Am
plitu
de (ȝ
V)
-0.10
15
(Fukuda & Vogel, 2009; Luck et al., 1990; McDonald et al., 2005; Störmer et al., 2009), it
is concluded that the CP reflects signal enhancement at the location of the (attended)
match cue. This signal-enhancement account offers a straight forward explanation for the
usual cue-validity effect on behavioural performance: when the match cue and target
appear at the same location (valid trials), processing of the task-relevant search item is
boosted, thereby speeding responses. By contrast, when the match cue and target appear
at different locations (invalid trials), selection of the match cue leads to a boost of one of
the non-target search items. Presumably, boosting the perceptual processing of a
nontarget either delays search for the target or otherwise slows target identification once
that item is located. The purpose of Experiment 2 was to elucidate the neural mechanisms
involved in processing the cued nontarget on invalid trials.
16
Chapter 3. Experiment 2
In Experiment 1 it was difficult to track processing of the cued nontarget beyond
the CP because of overlapping lateralized ERP components associated with the target.
As discussed in chapter 1, the target was found to elicit a large N2pc starting ~200 ms
after the appearance of the search display. The target and cued nontarget always
appeared at lateral locations (either on the same side or opposite side); therefore, it is not
possible to confidently ascribe any part of the observed ERPs to one stimulus or the other
(although, as the name suggests, the target N2pc was assumed to be primarily associated
with the target search item). Because the target N2pc is computed by comparing
contralateral and ipsilateral ERP waveforms to targets in a lateral visual field, no target
N2pc will be elicited when the target appears on the vertical meridian (Eimer & Grubert,
2014; Eimer, Kiss, & Nicholas, 2011; Hickey et al., 2009; Hickey, McDonald, & Theeuwes,
2006; Woodman & Luck, 1999). On these midline-target trials, lateralized activity observed
after the CP will reflect processing of the cued non-target item.
In Experiment 2, lateralized ERP activity associated with the cued-nontarget (and
the target on lateral-target display configurations) was tracked to determine what happens
after a match cue inadvertently enhances the early perceptual processing of an irrelevant
search item. Two hypotheses were considered. First, the cued nontarget may be actively
supressed to prevent that item from being attended. If the cued nontarget was actively
suppressed, a PD should be found contralateral to that item in the conventional PD time
range (250 – 350 ms; e.g. Gaspar & McDonald, 2014; Gaspar et al., in press; Hickey et
al., 2009). Second, top-down control might not prevent the cued nontarget item from
“capturing” attention. In this case, the cued nontarget should elicit an N2pc rather than a
PD.
17
3.1. Methods
3.1.1. Participants
Thirty-five new observers participated after providing informed consent. Data from
six participants were excluded using the same criteria as in Experiment 1, thereby leaving
29 participants in the final sample (eight men, mean age = 19.5, two left-handed).
3.1.2. Apparatus
The apparatus was identical to Experiment 1.
3.1.3. Stimuli and Procedure
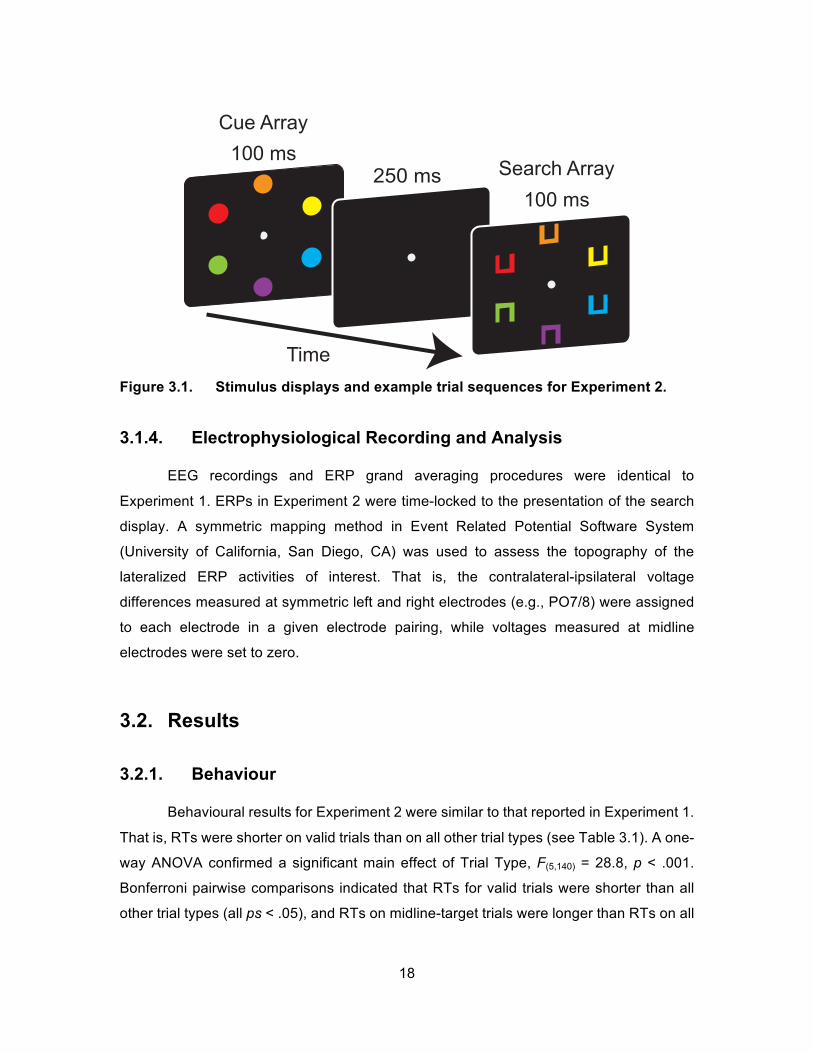
Stimuli were similar to those in used in Experiment 1, with the exception that the
cue and target displays contained two additional items four degrees above and below
fixation (six items in total; see Figure 3.1). The colours of the six items were now sampled
without replacement from a set of six colours, including orange (u’ = .514, v’ = .383), purple
(u’ = .306, v’ = .132), and the four colours from Experiment 1. The SOA between cue
display and search display was 350 ms.
Participants completed 24 blocks of 48 trials, for a total of 1152 trials. A sixth trial
type was added to the original five from Experiment 1. Specifically, trials with a lateral
match cue and target above or below fixation were designated as midline-target trials.
Each trial type was presented with equal probability (16.7%).
18
Figure 3.1. Stimulus displays and example trial sequences for Experiment 2.
3.1.4. Electrophysiological Recording and Analysis
EEG recordings and ERP grand averaging procedures were identical to
Experiment 1. ERPs in Experiment 2 were time-locked to the presentation of the search
display. A symmetric mapping method in Event Related Potential Software System
(University of California, San Diego, CA) was used to assess the topography of the
lateralized ERP activities of interest. That is, the contralateral-ipsilateral voltage
differences measured at symmetric left and right electrodes (e.g., PO7/8) were assigned
to each electrode in a given electrode pairing, while voltages measured at midline
electrodes were set to zero.
3.2. Results
3.2.1. Behaviour
Behavioural results for Experiment 2 were similar to that reported in Experiment 1.
That is, RTs were shorter on valid trials than on all other trial types (see Table 3.1). A one-
way ANOVA confirmed a significant main effect of Trial Type, F(5,140) = 28.8, p < .001.
Bonferroni pairwise comparisons indicated that RTs for valid trials were shorter than all
other trial types (all ps < .05), and RTs on midline-target trials were longer than RTs on all
Cue Array 100 ms
Time
250 ms
200 msor
100 msSearch Array
250 ms
A.
B.
Time
Cue Array 100 ms
100 msSearch Array
19
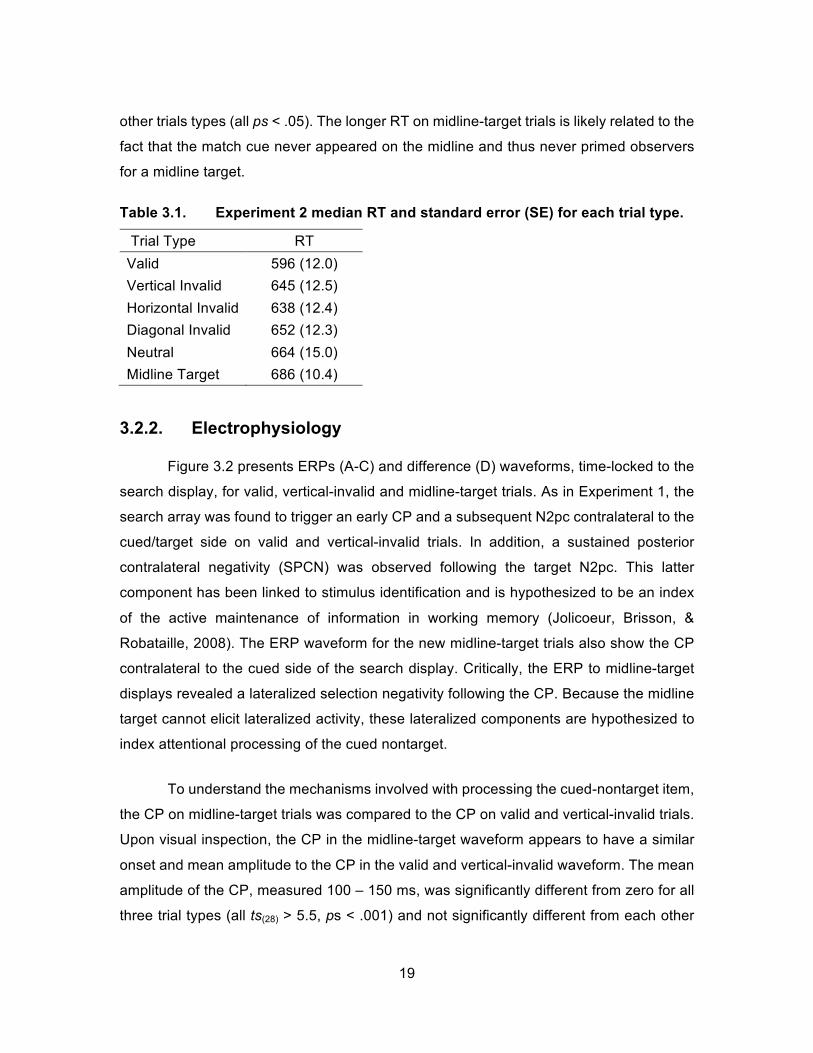
other trials types (all ps < .05). The longer RT on midline-target trials is likely related to the
fact that the match cue never appeared on the midline and thus never primed observers
for a midline target.
Table 3.1. Experiment 2 median RT and standard error (SE) for each trial type.
Trial Type RT Valid 596 (12.0) Vertical Invalid 645 (12.5) Horizontal Invalid 638 (12.4) Diagonal Invalid 652 (12.3) Neutral 664 (15.0) Midline Target 686 (10.4)
3.2.2. Electrophysiology
Figure 3.2 presents ERPs (A-C) and difference (D) waveforms, time-locked to the
search display, for valid, vertical-invalid and midline-target trials. As in Experiment 1, the
search array was found to trigger an early CP and a subsequent N2pc contralateral to the
cued/target side on valid and vertical-invalid trials. In addition, a sustained posterior
contralateral negativity (SPCN) was observed following the target N2pc. This latter
component has been linked to stimulus identification and is hypothesized to be an index
of the active maintenance of information in working memory (Jolicoeur, Brisson, &
Robataille, 2008). The ERP waveform for the new midline-target trials also show the CP
contralateral to the cued side of the search display. Critically, the ERP to midline-target
displays revealed a lateralized selection negativity following the CP. Because the midline
target cannot elicit lateralized activity, these lateralized components are hypothesized to
index attentional processing of the cued nontarget.
To understand the mechanisms involved with processing the cued-nontarget item,
the CP on midline-target trials was compared to the CP on valid and vertical-invalid trials.
Upon visual inspection, the CP in the midline-target waveform appears to have a similar
onset and mean amplitude to the CP in the valid and vertical-invalid waveform. The mean
amplitude of the CP, measured 100 – 150 ms, was significantly different from zero for all
three trial types (all ts(28) > 5.5, ps < .001) and not significantly different from each other
20
(F(2,56) = 0.9, p > .05). Across the three trial types, the onset of the CP did not differ;
however, the offset latency of the CP (as measured by the 50% fractional peak amplitude
following the peak) was found to be significantly later on midline-target trials (F(2,56) = 40.1,
p < .001), suggesting that the initial enhancement of the cued-nontarget continues into the
N2pc time range.
Figure 3.2. Grand-averaged ERP waveforms from Experiment 2 time locked to
search arrays in Experiment 2. Waveforms are plotted contralateral or ipsilateral to the match cue, which appeared in the same visual hemifield as the match cue on valid and vertical-invalid trials. The grey box indicates the timing of the search array. (A) Valid trials. (B) Vertical-invalid trials. (C) Midline-target trials. (D) Contralateral-minus-ipsilateral difference waves for valid trials, vertical-invalid trials and midline-target trials.
The next comparison was made between the target N2pc on valid and vertical-
invalid trials and the somewhat later contralateral negativity on midline-target trials. On
valid and vertical-invalid trials, a large target N2pc was observed in the expected time
window of 180 – 300 ms. Using the same time window from Experiment 1 (200 – 300 ms),
the mean amplitude was extracted and compared against zero. Both valid and vertical-
invalid target N2pcs were found to be significantly different from zero (both ts(28) > 5.0, ps
< .001). On midline target trials, a negativity contralateral to the cued-nontarget item was
evident between 250 – 350 ms after the onset of the search display. Topographical maps
of the valid and midline-target difference waves were plotted to determine if the late
A. Valid
B. Vertical
C. Midline
D. Difference Waves
Contralateral Ipsilateral
Target N2pc
Cued Nontarget
N2pc
SPCN
Valid Vertical Midline
700 msPO7/8
CP
-1 µV
700 msPO7/8
-2 µV
700 msPO7/8
-2 µV
700 msPO7/8
-2 µV
21
selection negativity had the same scalp distribution as the target N2pc (Figure 3.3). Apart
from the 50ms delay, the cascade of voltage distributions was nearly identical between
the two trial types. This was taken as evidence that the late selection negativity on midline-
target trials was an N2pc to the cued nontarget. Therefore, on midline-target trials, the
cued-nontarget N2pc was quantified as the mean amplitude of the contralateral-minus-
ipsilateral difference wave in the 250–350 ms time window. The cued-nontarget N2pc was
found to be significantly different from zero (t(28) = 4.3, p < .001), with a 50% fractional
peak latency of 277 ms (SE = 5.1).
Figure 3.3. Topographical maps of contralateral-ipsilateral voltage differences
time-locked to the onset of the search display, plotted separately for valid trials and midline-target trials using conventional symmetric-mapping methods (see Methods section). Dashed grey boxes denote the measurement windows for the target N2pc and cued-nontarget N2pc.
Given that attentional selection of the cued nontarget was not actively prevented
(via suppression), the next goal was to determine whether information about the cued
nontarget entered working memory alongside target information, as indexed by the SPCN.
As expected, the target was found to elicit an SPCN on valid and vertical-invalid trials
(Figure 3.2D). This SPCN was found to be significant in a conventional 400 – 500 ms time
window (both ts(28) >7.2, ps < .001). Critically, in the same time window, the cued nontarget
was found to elicit an SPCN on midline-target trials (t(28) = 4.6, p < .001).
CP N2pc SPCN
100 - 150 150 - 200 200 - 250 250 - 300 450 - 500400 - 450350 - 400300 - 350
Midline Target
Valid
2.5 uV -2.5 uVVoltage
22
Figure 3.4 displays ERPs from horizontal-invalid and diagonal-invalid trials
together with ERP results from the new midline-target trial (Figure 3.4D) As discussed in
Experiment 1 (and in Sawaki and Luck, 2013), the CP triggered by the cued nontarget and
the N2pc triggered by the target sum linearly to produce a larger negative peak that spans
the CP and N2pc time ranges when the cue and target appear on opposite sides of fixation
(Figure 3.4C). Following this combined peak, a positive deflection is evident in the
difference waveform between 270 – 370 ms. Upon initial inspection, this peak appears as
a target positivity (PT; also called a target PD) that reflects active termination of target
processing (Jannati, Gaspar, & McDonald, 2013; Sawaki et al., 2012). This component
was found to be significant in the typical PT time window of 290 – 340 ms (Sawaki et al.,
2012) on both horizontal-invalid and diagonal-invalid trials (both ts(28) > 2.45, p < .05).
However, a different interpretation emerges once the ERPs from horizontal-invalid and
diagonal-invalid trials are compared with the ERPs from the midline-target trials. In figure
3.4D, the contralateral-ipsilateral difference waveforms is re-plotted relative to the match
cue’s location so that the early combined CP/N2pc appears as a positive peak and the
putative PT becomes a negative peak. Plotted in this way, it is apparent that the timing and
amplitude of the PT match the timing and amplitude of the N2pc elicited by the cued
nontarget on midline-target trials. Statistical analyses confirmed that the 50% factional
peak latencies and the mean amplitudes in the 290–340 ms measurement window were
indistinguishable across horizontal-invalid, diagonal-invalid and midline-target trial types
(amplitudes: F(2,56) = 1.86, p > .05; latencies: F(2,56) = 2.3, p > .05). Based on these results,
it is concluded that the post-N2pc deflection observed on horizontal-invalid and diagonal-
invalid trials reflects the relatively late N2pc elicited by the cued nontarget rather than a
positivity elicited by the target itself.
23
Figure 3.4. Grand-averaged ERP waveforms from Experiment 2 for invalid trials
where the cue and target appear on opposites sides of fixation, time-locked to search arrays in Experiment 2. Waveforms are plotted contralateral or ipsilateral to the match cue, which appeared in the same visual hemifield as the match cue on valid and vertical-invalid trials. The grey box indicates the timing of the search array. (A) Horizontal-invalid trials. (B) Diagonal-invalid trials. (C) Contralateral-minus-ipsilateral difference waves referenced to the target location, for horizontal-invalid trials and diagonal-invalid trials. (D) Contralateral-minus-ipsilateral difference waves referenced to the location of the match cue, for horizontal-invalid, diagonal-invalid and midline-target trials.
The apparent absence of the SPCN on horizontal-invalid and diagonal-invalid trials
can be explained by summation of the SPCNs elicited by the target (isolated on neutral
trials) and the opposite-field cued nontarget (isolated on midline-target trials). Based on
the isolated target and cued-nontarget SPCN amplitudes (see Table 3.2), one would
predict that the SPCN on horizontal-invalid and diagonal-invalid trials would be ~0.43 µV.
This predicted value closely approximates the observed SPCN amplitude on horizontal-
invalid and diagonal-invalid trials, which was ~0.40 µV. This ERP additivity also accurately
A. Horizontal
B. Diagonal
Contralateral Ipsilateral
Horizontal Diagonal Midline
Target
N2pc
Cued
Nontarget
N2pc
SPCN
D. Difference waves referenced to Match Cue
C. Difference waves referenced to Target
Horizontal Diagonal
PO7/8 700 ms
μ-1 V
PO7/8700 ms
μ-1 V
PO7/8 700 ms
PO7/8 700 ms
μ-2 V
μ-2 V
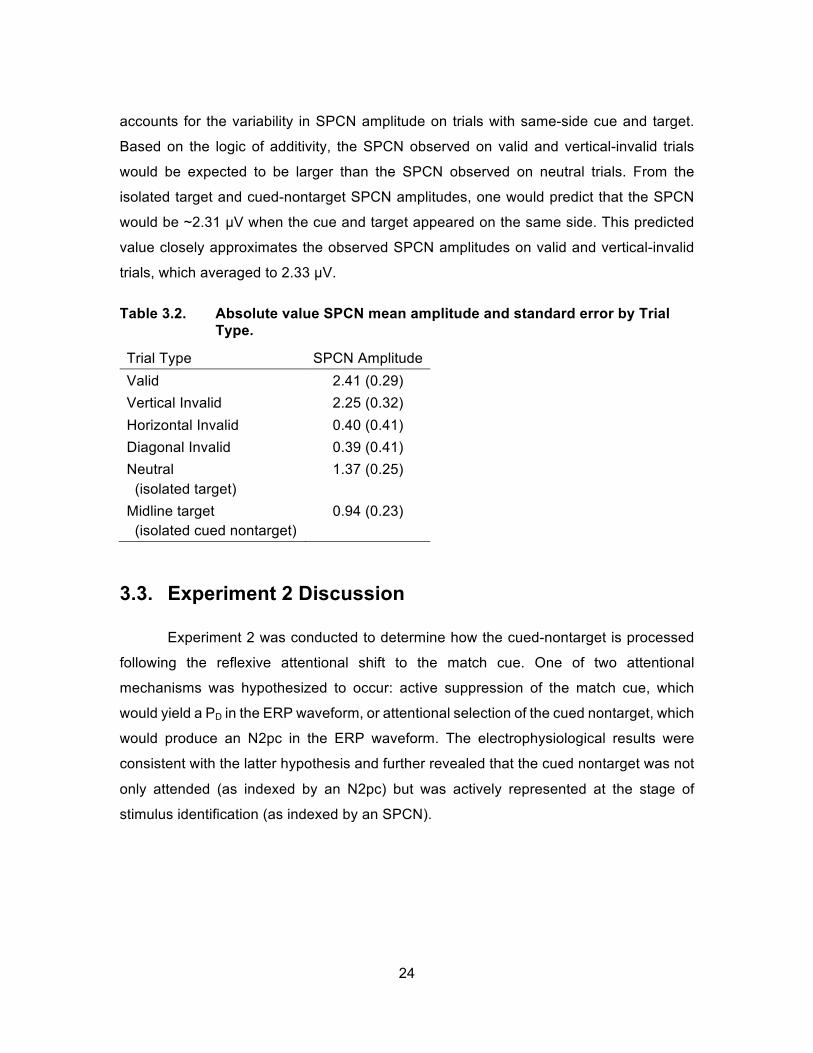
24
accounts for the variability in SPCN amplitude on trials with same-side cue and target.
Based on the logic of additivity, the SPCN observed on valid and vertical-invalid trials
would be expected to be larger than the SPCN observed on neutral trials. From the
isolated target and cued-nontarget SPCN amplitudes, one would predict that the SPCN
would be ~2.31 µV when the cue and target appeared on the same side. This predicted
value closely approximates the observed SPCN amplitudes on valid and vertical-invalid
trials, which averaged to 2.33 µV.
Table 3.2. Absolute value SPCN mean amplitude and standard error by Trial Type.
Trial Type SPCN Amplitude Valid 2.41 (0.29) Vertical Invalid 2.25 (0.32) Horizontal Invalid 0.40 (0.41) Diagonal Invalid 0.39 (0.41) Neutral (isolated target)
1.37 (0.25)
Midline target (isolated cued nontarget)
0.94 (0.23)
3.3. Experiment 2 Discussion
Experiment 2 was conducted to determine how the cued-nontarget is processed
following the reflexive attentional shift to the match cue. One of two attentional
mechanisms was hypothesized to occur: active suppression of the match cue, which
would yield a PD in the ERP waveform, or attentional selection of the cued nontarget, which
would produce an N2pc in the ERP waveform. The electrophysiological results were
consistent with the latter hypothesis and further revealed that the cued nontarget was not
only attended (as indexed by an N2pc) but was actively represented at the stage of
stimulus identification (as indexed by an SPCN).
25
Chapter 4. General Discussion
The purpose of Experiment 1 was to elucidate whether the CP reported by Sawaki
and Luck (2013) indexed suppression of the match cue or enhanced processing of the
cued item in the search display. In Experiment 1, the cue-target SOA was varied in order
to track which stimulus display elicited the CP. When the onset of the search display was
delayed by 50 ms, the onset of the CP was delayed by 50 ms as well. This result strongly
indicates that the CP was time-locked to the search display. Contralateral positivities
beginning approximately 100 ms after display onsets have been reported in the
electrophysiology literature and have been ascribed to reflect attentional enhancement of
incoming sensory signals (e.g. Fukuda & Vogel, 2009; Heinze et al., 1990; Luck et al.,
1990; McDonald et al., 2005; Störmer et al., 2009). Thus, in the present study, the CP
most likely reflects attentional facilitation of incoming sensory signals for search items at
the cued location. On valid trials, this facilitation resulted in shorter RTs; however, on
invalid trials, it was still unclear how enhancement of cued-nontarget items resulted in
longer RTs.
The purpose of Experiment 2 was to track and understand the neural mechanisms
involved in processing the cued nontarget on invalid trials. To do this, target items were
placed on the vertical meridian to remove lateralized activity specific to target processing,
which enabled measurement of lateralized activity associated with processing of the cued
nontarget. The results indicate that following selection of the target item (indexed by the
target N2pc), observers attend to and process the cued nontarget (indexed by the cued-
nontarget N2pc and subsequent SPCN). Examination of the SPCN from all trial types
provided further supporting evidence that information regarding the cued nontarget enters
working memory. Cued-nontarget information then competes with task-relevant target
information for attentional resources, resulting in longer RTs on invalid trials.
On the basis of these findings, it is hypothesized that two sources of attentional
bias contribute to the RT cost/benefit in the contingent capture cueing paradigm (Figure
4.1). First, an attentional-set bias (depicted by the filled yellow circle) facilitates selection
of items containing the task-relevant feature. Electrophysiologically, this attentional-set
bias leads to the N2pc to the match cue and subsequent search target. Second, following
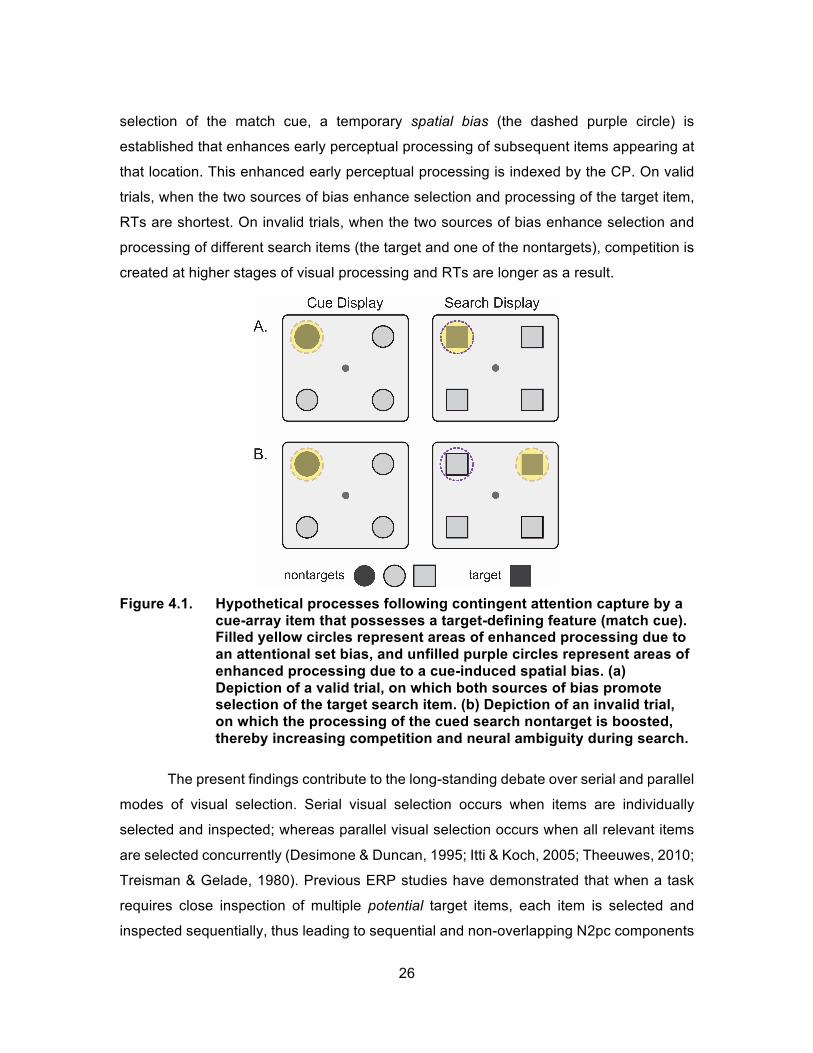
26
selection of the match cue, a temporary spatial bias (the dashed purple circle) is
established that enhances early perceptual processing of subsequent items appearing at
that location. This enhanced early perceptual processing is indexed by the CP. On valid
trials, when the two sources of bias enhance selection and processing of the target item,
RTs are shortest. On invalid trials, when the two sources of bias enhance selection and
processing of different search items (the target and one of the nontargets), competition is
created at higher stages of visual processing and RTs are longer as a result.
Figure 4.1. Hypothetical processes following contingent attention capture by a
cue-array item that possesses a target-defining feature (match cue). Filled yellow circles represent areas of enhanced processing due to an attentional set bias, and unfilled purple circles represent areas of enhanced processing due to a cue-induced spatial bias. (a) Depiction of a valid trial, on which both sources of bias promote selection of the target search item. (b) Depiction of an invalid trial, on which the processing of the cued search nontarget is boosted, thereby increasing competition and neural ambiguity during search.
The present findings contribute to the long-standing debate over serial and parallel
modes of visual selection. Serial visual selection occurs when items are individually
selected and inspected; whereas parallel visual selection occurs when all relevant items
are selected concurrently (Desimone & Duncan, 1995; Itti & Koch, 2005; Theeuwes, 2010;
Treisman & Gelade, 1980). Previous ERP studies have demonstrated that when a task
requires close inspection of multiple potential target items, each item is selected and
inspected sequentially, thus leading to sequential and non-overlapping N2pc components
27
(Woodman & Luck, 1999, 2003). However, recent studies have shown that when a task
requires rapid inspection of multiple target items (presented either sequentially or
simultaneously), each item of interest is selected in parallel, as indexed by concurrent
N2pc components (Eimer & Grubert, 2014; Grubert & Eimer, 2015). The present ERP
findings support parallel selection and identification of the cued nontarget and target in the
contingent-capture cueing paradigm, indexed by overlapping N2pc components to the two
items.
One avenue of future research would be to examine how individual differences in
visual working memory (VWM) capacity impact the present electrophysiological and
behavioural results. Research has demonstrated that VWM capacity is related to the ability
to suppress distracting information (Gaspar & McDonald, 2014; Gaspar et al., in press).
Do individuals who have a higher working memory capacity experience less capture by
the match cue (indexed by a smaller cue N2pc)? Are these individuals less likely to select
the cued nontarget for processing, thus decreasing the amount of extraneous information
in working memory on invalid trials? How is the RT cost/benefit different for high capacity
individuals? It is hypothesized that high-capacity individuals may not experience any less
capture by the match cue, but would be able to disengage attention from the cued
nontarget more quickly (possibly preventing the cued nontarget from eliciting an N2pc).
Research examining individual differences in cognitive functioning could be
extended to include subclinical populations, for instance individuals who have sustained
a concussion. Several studies have demonstrated that VWM capacity is related to overall
cognitive functioning (Johnson et al., 2013; Fukuda et al., 2010). Severely concussed
individuals routinely report having cognitive impairments, such as an inability to focus (e.g.
Guskiewicz et al., 2003; McCrea et al., 2003). Testing concussed individuals using the
contingent capture cueing paradigm would allow for assessment of both bottom-up and
top-down processes. It is possible that once the attentional set is in place, concussed
individuals may have a difficult time recovering from the reflexive shift to the match cue
(likely measured by a larger and longer lasting cue N2pc). Concussed individuals may
also have difficulty recovering from the spatial bias induced by the match cue in order to
select the target on invalid trials, possibly indexed by an N2pc to the cued nontarget first
with a subsequent N2pc to the target. This cueing paradigm could lend considerable

28
insights into how the concussed brain functions, as electrophysiological changes in
selective visual attention have been largely uncharacterized.
29
References
Desimone, R., & Duncan, J. (1995). Neural mechanisms of selective visual attention. Annual Review of Neuroscience, 18(1), 193-222.
Eimer, M., & Grubert, A. (2014). Spatial attention can be allocated rapidly and in parallel to new visual objects. Current Biology, 24(2), 193–198. http://doi.org/10.1016/j.cub.2013.12.001
Eimer, M., & Kiss, M. (2008). Involuntary attentional capture is determined by task set: Evidence from event-related brain potentials. Journal of Cognitive Neuroscience, 20(8), 1423–1433. http://doi.org/10.1162/jocn.2008.20099
Eimer, M., & Kiss, M. (2010). Top-down search strategies determine attentional capture in visual search: Behavioral and electrophysiological evidence. Attention, Perception, & Psychophysics, 72(4), 951–962. http://doi.org/10.3758/APP.72.4.951.
Eimer, M., Kiss, M., & Nicholas, S. (2011). What top-down task sets do for us: An ERP study on the benefits of advance preparation in visual search. Journal of Experimental Psychology: Human Perception & Performance, 37(6), 1758–1766. http://doi.org/10.1037/a0024326
Eimer, M., Kiss, M., Press, C., & Sauter, D. (2009). The roles of feature-specific task set and bottom-up salience in attentional capture: An ERP study. Journal of Experimental Psychology: Human Perception & Performance, 35(5), 1316–1328. http://doi.org/10.1037/a0015872
Egeth, H. E., & Yantis, S. (1997). Visual attention: Control, representation, and time course. Annual Review of Psychology, 48(1), 269–297. http://doi.org/10.1146/annurev.psych.48.1.269.
Folk, C. L., & Remington, R. (2006). Top-down modulation of preattentive processing: Testing the recovery account of contingent capture. Visual Cognition, 14(4-8), 445–465. http://doi.org/10.1080/13506280500193545
Folk, C. L., & Remington, R. W. (2008). Bottom-up priming of top-down attentional control settings. Visual Cognition, 16(2-3), 215–231. http://doi.org/10.1080/13506280701458804
30
Folk, C. L., Remington, R. W., & Johnston, J. C. (1992). Involuntary covert orienting is contingent on attentional control settings. Journal of Experimental Psychology: Human Perception & Performance, 18(4), 1030–1044. http://doi.org/10.1037/0096-1523.18.4.1030
Folk, C. L., Remington, R. W., & Wright, J. H. (1994). The structure of attentional control: Contingent attentional capture by apparent motion, abrupt onset, and colour. Journal of Experimental Psychology: Human Perception & Performance, 20(2), 317–329. http://doi.org/10.1037/0096-1523.20.2.317
Fukuda, K., Awh, E., & Vogel, E. K. (2010). Discrete capacity limits in visual working memory. Current Opinion in Neurobiology, 20(2), 177–182. http://doi.org/10.1016/j.conb.2010.03.005
Fukuda, K., & Vogel, E. K. (2009). Human variation in overriding attentional capture. The Journal of Neuroscience, 29(27), 8726–8733. http://doi.org/10.1523/JNEUROSCI.2145-09.2009
Gaspar, J. M., Christie, G. J., Prime, D. J., & Jolicoeur, P., & McDonald, J. J. (in press) Inability to suppress salient distractors predicts low visual working memory capacity. Proceedings of the National Academy of Sciences.
Gaspar, J. M., & McDonald, J. J. (2014). Suppression of salient objects prevents distraction in visual search. The Journal of Neuroscience, 34(16), 5658–5666. http://doi.org/10.1523/JNEUROSCI.4161-13.2014.
Grubert, A., & Eimer, M. (2015). Rapid parallel attentional target selection in single-color and multiple-color visual search. Journal of Experimental Psychology: Human Perception & Performance, 41(1), 86–101. http://doi.org/10.1037/xhp0000019.
Guskiewicz, K.M., McCrea, M., Marshall, S.W., & et al. (2003). Cumulative effects associated with recurrent concussion in collegiate football players: The NCAA concussion study. The Journal of the American Medical Association, 290(19), 2549–2555. http://doi.org/10.1001/jama.290.19.2549
Heinze, H. J., Luck, S. J., Mangun, G. R., & Hillyard, S. A. (1990). Visual event-related potentials index focused attention within bilateral stimulus arrays. I. Evidence for early selection. Electroencephalography & Clinical Neurophysiology, 75(6), 511–527. http://doi.org/10.1016/0013-4694(90)90138-A
Hickey, C., McDonald, J. J., & Theeuwes, J. (2006). Electrophysiological evidence of the capture of visual attention. Journal of Cognitive Neuroscience, 18(4), 604–613. http://doi.org/10.1162/jocn.2006.18.4.604.
31
Hickey, C., Di Lollo, V., & McDonald, J. J. (2009). Electrophysiological indices of target and distractor processing in visual search. Journal of Cognitive Neuroscience, 21(4), 760–775. http://doi.org/10.1162/jocn.2009.21039
Hopfinger, J. B., & Mangun, G. R. (1998). Reflexive attention modulates processing of visual stimuli in human extrastriate cortex. Psychological Science, 9(6), 441–447. http://doi.org/10.1111/1467-9280.00083
Hopfinger, J. B., & West, V. M. (2006). Interactions between endogenous and exogenous attention on cortical visual processing. NeuroImage, 31(2), 774–789. http://doi.org/10.1016/j.neuroimage.2005.12.049
Itti, L., & Koch, C. (2001). Computational modelling of visual attention. Nature Reviews Neuroscience, 2(3), 194–203. http://doi.org/10.1038/35058500
Jannati, A., Gaspar, J. M., & McDonald, J. J. (2013). Tracking target and distractor processing in fixed-feature visual search: Evidence from human electrophysiology. Journal of Experimental Psychology: Human Perception & Performance, 39(6), 1713–1730. http://doi.org/10.1037/a0032251
Johnson, M. K., McMahon, R. P., Robinson, B. M., Harvey, A. N., Hahn, B., Leonard, C. J., Luck, S. J., & Gold, J. M. (2013). The relationship between working memory capacity and broad measures of cognitive ability in healthy adults and people with schizophrenia. Neuropsychology, 27(2), 220–229. http://doi.org/10.1037/a0032060
Jolicoeur, P., Brisson, B., & Robitaille, N. (2008). Dissociation of the N2pc and sustained posterior contralateral negativity in a choice response task. Brain Research, 1215(18), 160–172.
Jonides, J. (1980). Towards a model of the mind’s eye’s movement. Canadian Journal of Psychology/Revue Canadienne de Psychologie, 34(2), 103–112. http://doi.org/10.1037/h0081031
Leblanc, É., Prime, D. J., & Jolicoeur, P. (2007). Tracking the location of visuospatial attention in a contingent capture paradigm. Journal of Cognitive Neuroscience, 20(4), 657–671. http://doi.org/10.1162/jocn.2008.20051
Lien, M.-C., Ruthruff, E., Goodin, Z., & Remington, R. W. (2008). Contingent attentional capture by top-down control settings: Converging evidence from event-related potentials. Journal of Experimental Psychology: Human Perception & Performance, 34(3), 509–530. http://doi.org/10.1037/0096-1523.34.3.509
32
Lopez-Calderon, J., & Luck, S. J. (2014). ERPLAB: An open-source toolbox for the analysis of event-related potentials. Frontiers in Human Neuroscience, 8:213. doi: 10.3389/fnhum.2014.00213
Luck, S. J., & Hillyard, S. A. (1994). Spatial filtering during visual search: Evidence from human electrophysiology. Journal of Experimental Psychology: Human Perception & Performance, 20(5), 1000–1014. http://doi.org/10.1037/0096-1523.20.5.1000
Luck, S. J., Heinze, H. J., Mangun, G. R., & Hillyard, S. A. (1990). Visual event-related potentials index focused attention within bilateral stimulus arrays. II. Functional dissociation of P1 and N1 components. Electroencephalography & Clinical Neurophysiology, 75(6), 528–542. http://doi.org/10.1016/0013-4694(90)90139-B
Mangun, G. R., & Hillyard, S. A. (1991). Modulations of sensory-evoked brain potentials indicate changes in perceptual processing during visual-spatial priming. Journal of Experimental Psychology. Human Perception & Performance, 17(4), 1057–1074.
McCrea, M., Guskiewicz, K.M., Marshall, S.W., & et al. (2003). Acute effects and recovery time following concussion in collegiate football players: The NCAA concussion study. The Journal of the American Medical Association, 290(19), 2556–2563. http://doi.org/10.1001/jama.290.19.2556
McDonald, J. J., Teder-Sälejärvi, W. A., Di Russo, F., & Hillyard, S. A. (2005). Neural basis of auditory-induced shifts in visual time-order perception. Nature Neuroscience, 8, 1197-1202.
McDonald, J. J., & Ward, L. M. (1999). Spatial relevance determines facilitatory and inhibitory effects of auditory covert spatial orienting. Journal of Experimental Psychology. Human Perception & Performance, 25(5), 1234.
Miller, J., Patterson, T., & Ulrich, R. (1998). Jackknife-based method for measuring LRP onset latency differences. Psychophysiology, 35(01), 99–115. http://doi.org/null
Posner, M. I. (1980). Orienting of attention. Quarterly Journal of Experimental Psychology, 32(1), 3–25. http://doi.org/10.1080/00335558008248231
Sawaki, R., & Luck, S. J. (2013). Active suppression after involuntary capture of attention. Psychonomic Bulletin & Review, 20(2), 296–301. http://doi.org/10.3758/s13423-012-0353-4
33
Sawaki, R., Geng, J. J., & Luck, S. J. (2012). A common neural mechanism for preventing and terminating the allocation of attention. The Journal of Neuroscience, 32(31), 10725–10736. http://doi.org/10.1523/JNEUROSCI.1864-12.2012
Smulders, F. T. Y. (2010). Simplifying jackknifing of ERPs and getting more out of it: Retrieving estimates of participants’ latencies. Psychophysiology, 47(2), 387–392. http://doi.org/10.1111/j.1469-8986.2009.00934.x
Störmer, V. S., McDonald, J. J., & Hillyard, S. A. (2009). Cross-modal cueing of attention alters appearance and early cortical processing of visual stimuli. Proceedings of the National Academy of Sciences, 106(52), 22456–22461. http://doi.org/10.1073/pnas.0907573106
Theeuwes, J. (1991). Exogenous and endogenous control of attention: The effect of visual onsets and offsets. Perception & Psychophysics, 49(1), 83–90. http://doi.org/10.3758/BF03211619
Theeuwes, J. (2010). Top–down and bottom–up control of visual selection. Acta Psychologica, 135(2), 77–99. http://doi.org/10.1016/j.actpsy.2010.02.006
Treisman, A. M., & Gelade, G. (1980). A feature-integration theory of attention. Cognitive Psychology, 12(1), 97–136. http://doi.org/10.1016/0010-0285(80)90005-5
Woodman, G. F., & Luck, S. J. (1999). Electrophysiological measurement of rapid shifts of attention during visual search. Nature, 400(6747), 867–869. http://doi.org/10.1038/23698
Woodman, G. F., & Luck, S. J. (2003). Serial deployment of attention during visual search. Journal of Experimental Psychology: Human Perception & Performance, 29(1), 121–138. http://doi.org/10.1037/0096-1523.29.1.121
Wright, R. D., & Ward, L. M. (2008). Orienting of Attention. New York: Oxford University Press.
Yantis, S., & Jonides, J. (1990). Abrupt visual onsets and selective attention: Voluntary versus automatic allocation. Journal of Experimental Psychology: Human Perception & Performance, 16(1), 121–134. http://doi.org/10.1037/0096-1523.16.1.121