Eltek R3601-W2 User Manual Eltek R3601-W2 SFP Gigabit Ethernet ...

El tekAnnual Report 1998
Eltek
El tek
The El tek Group consists of 24 companies in Norway, Europe and Asia. E l tek has two business areas:
El tek Energy is a supplier of power supply systems, primari ly to the te lecommunications industry.El tek Fire & Safety is a supplier of f ire protection systems.
The Group has a total of 637 employees ,220 of whom are employed outside Norway.El tek ASA was f loated on the Oslo StockExchange in 1998. The company’s headquarter is in Drammen, 40 ki lometressouth of Oslo.

Contents
Important events in 1998 4Key f igures 5A sound platform for continued growth 6Eltek Energy 8Eltek Fire & Safety 10Directors ’ report 1998 12Profit and loss account 16Balance sheet 17Cash f low analysis 18Comments to the accounts 19Notes to the accounts 20Accounts for the parent company 26Auditor ’s report 27Eltek towards new horizons 28Fire protection pays 30Organisation and management 32International network 33Addresses 34

Important events in 1998
Eltek ASA
■ Divested Ucom and Wireless Systems■ Raised fresh capital through a NOK 79.9 million share issue■ Floated on the Oslo Stock Exchange
Eltek Energy
■ Established Eltek Energy France ■ Purchased a further 50.5 % of shares in Unitech (increasing ownership share to 76 %)■ Entered into a frame agreement worth NOK 40 million with the Canadian Department
of Defence ■ Entered into a frame agreement worth NOK 25 million with Singapore Telecom
Eltek Fire & Safety
■ Merged with Norfass ■ Acquired Magnus Fergin Belysning in Sweden■ Purchased the remaining 80 % of shares in Intelligent Emergency Lighting Systems (IEL)■ Completed the fire alarm system at Oslo Airport Gardermoen
4
Eltek participated indeveloping OsloAirport Gardermoenby supplying the firealarm system.
In 1998, a number ofcountries in Asia
developed their tele-communications
infrastructure with power supply
systems from Eltek.

5
Key figures (MNOK)
1998 1997 1996 1995 1994
Results
Operating revenue 822.6 613.5 526.9 451.0 371.8Operating profit 57.2 42.6 17.1 27.7 26.6Pre-tax profit 62.0 38.7 15.7 25.8 24.9Net profit for the year (ordinary) 1) 45.7 27.2 4.9 13.3 14.0Operating margin 2) 7.0 % 6.9 % 3.2 % 6.1 % 7.2 %Profit margin (before tax) 3) 7.5 % 6.3 % 3.0 % 5.7 % 6.7 %
Capital
Total capital 475.5 319.1 242.6 224.3 160.2Equity capital (total) 4) 223.4 109.8 80.3 76.1 40.9Equity ratio 47.0 % 34.4 % 33.1 % 33.9 % 25.5 %
Shares
Shares, total (thousands) 13 825 10 428 9 700 9 700 700Profit per share 5) 3.60 2.70 0.51 2.56 20.00Dividend per share 1.00 1.44 0.00 1.19 7.14
Employees
Employees as at 31 December 637 532 465 373 275
1) Profit after tax and minority interests + extraordinary expenses2) Operating profit as a percentage of operating revenue3) Pre-tax profit as a percentage of operating revenue4) Equity capital + minority interests5) Ordinary profit for the year as a percentage of average number of shares as at 1 January and 31 December
Development of operating revenue for
the Eltek Group
Development of netprofit for the year forthe Eltek Group
Key f igures

A sound pla t form for cont inued growth
Around three or four years ago it became clearthat Eltek would have to undergo a maturingprocess, both in financial and ownership terms,in order to grow in line with market challenges.With owners such as Telenor Venture and theGovernment Fund for Industry and RegionalDevelopment (SND), we staked out a coursewhich would culminate in the company’s listingon the Oslo Stock Exchange. In July 1998, wewere quoted on the Oslo Stock Exchange with ashare price NOK 40 per share.
Flotation on the Oslo Stock Exchange coincided with a general downturn in the stock market,and Eltek’s shares performed like those of similar-sized companies. There is a clear trend in thestock market that larger companies fare better than smaller companies in a bear market. We arenaturally disappointed with developments and consider the value of the company to be signific-antly higher than that indicated by current market pricing.
We are hardly the first people to experience that a flotation renders the valuation of the companydependent on a number of factors over which we have no control. In the longer term, however,only our own results count, and in order to achieve continued growth, Oslo Stock Exchange willbe an important instrument for us in the years ahead.
All market evaluations indicate that we must continue to grow in order to move up one divisionas an attractive investment object. Such an expansion requires insight into the market and availa-ble capital, but this alone is not enough. Expansion must be controlled if it is to bear fruit. In thisrespect, the composition of our Board of Directors is a stimulus and a prerequisite for continuedgrowth in Eltek.
Major structural changes are occurring in the market within both our business areas. Globalisat-ion is bearing down on us with full strength. A supplier of telecommunications equipment in amarket with a diminishing number of players cannot base its operations on restricted geographicalniches. Within the fire protection segment in Norway, there have been a number of mergers andinternational acquisitions. Today we are the only remaining Norwegian-owned company. Thisdevelopment is also an incitement for continued growth. We have announced our participation inthe race.
To meet these demands, we have planned an aggressive strategy for continued expansion throughacquisitions and technological development. Eltek has the financial strength to tackle such an
The year 1998 has been a very specialyear for El tek. Never before have wegrown so strongly in terms of sales . Wehave surprised analysts and the rest ofthe market , with a result that was better than anticipated. We have laid the foundation for continued growthboth in Norway and worldwide.
6
Number of employeesin the Eltek Group
Global distribution of sales

7
expansion. We have an equity ratio which many would envy us, and our partners regard us assound, serious and future-oriented.
To document the result of our development, we attach great importance to providing our ownerswith information. In 1999, we will raise our profile several notches. Given Eltek’s development,there is no reason to appear to be a well-kept secret in the market. We also welcome an improveddialogue with our present and potential investors and hope that the information we provide will contribute to this. It is therefore with considerable optimism that we have made a start on anew year.
Regards,
Alain F. AngelilGroup CEO
ÒEltek has planned anaggressive strategyfor continued expansion.Ó
8
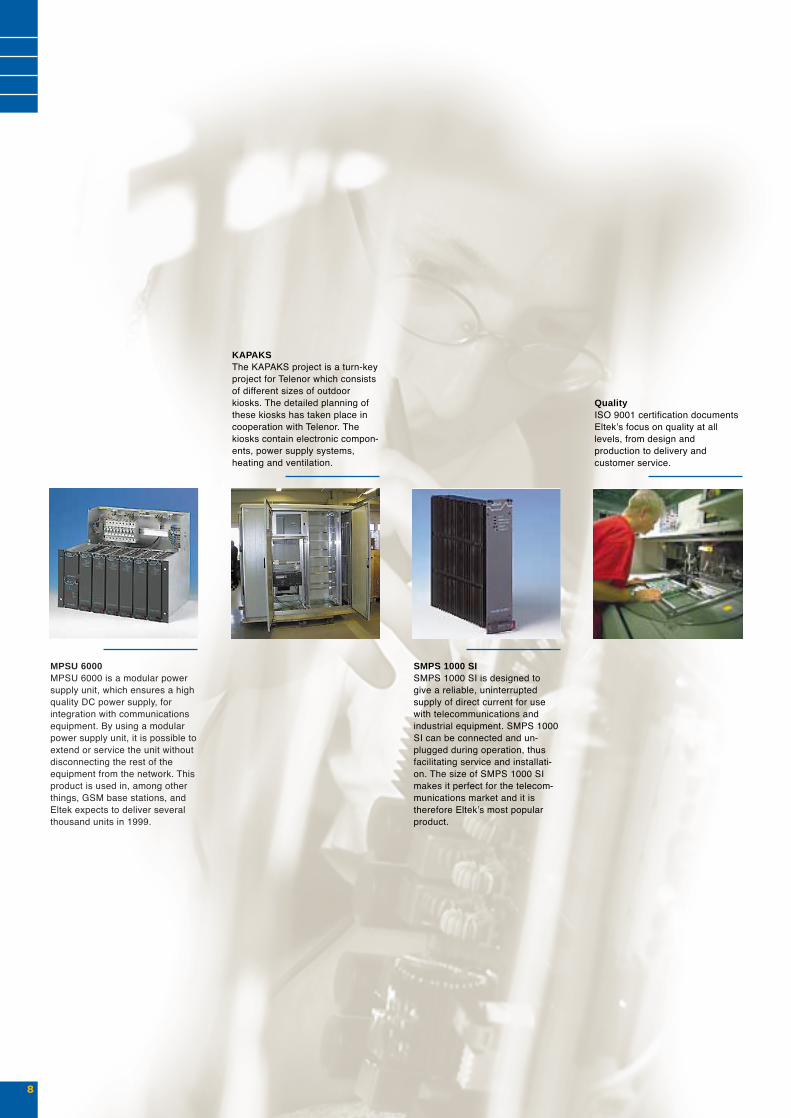
MPSU 6000MPSU 6000 is a modular powersupply unit, which ensures a highquality DC power supply, forintegration with communicationsequipment. By using a modularpower supply unit, it is possible toextend or service the unit withoutdisconnecting the rest of theequipment from the network. Thisproduct is used in, among otherthings, GSM base stations, andEltek expects to deliver severalthousand units in 1999.
KAPAKSThe KAPAKS project is a turn-keyproject for Telenor which consistsof different sizes of outdoorkiosks. The detailed planning ofthese kiosks has taken place incooperation with Telenor. Thekiosks contain electronic compon-ents, power supply systems,heating and ventilation.
SMPS 1000 SISMPS 1000 SI is designed togive a reliable, uninterruptedsupply of direct current for usewith telecommunications andindustrial equipment. SMPS 1000SI can be connected and un-plugged during operation, thusfacilitating service and installati-on. The size of SMPS 1000 SImakes it perfect for the telecom-munications market and it istherefore EltekÕs most popularproduct.
QualityISO 9001 certification documentsEltekÕs focus on quality at alllevels, from design andproduction to delivery andcustomer service.

Eltek Energy’s business area is the supply of uninterrupted power supplysystems to telecommunications installations (fixed network, mobile net-work, cable TV and the Internet). The company has two productionfacilities – one in Drammen in connection with Eltek’s main office andone in Hemel Hempstead in connection with Eltek UK Ltd.
■ Eltek Energy’s market is global and consists of large and small tele-communications operators and their suppliers.
■ A complete power supply system consists of rectifier modules which transform alternating current from the electricity network into directcurrent, batteries, a monitoring unit and a distribution unit for inter-facing with the network.
■ Eltek Energy’s operations are primarily export-oriented. The European market outside of Norway accounts for 51 % of turnover while the Asian market accounts for 27 %. Sales in Norway comprise 20 % of total turnover.
■ Eltek Energy is represented through wholly or part-owned companies in Norway, England, France, Germany, Poland, Hong Kong, Singapore and India. In addition, the company’s products are sold directly to end-users or through distributors in a number of countries.
Product development
Eltek Energy’s research and development unit is located in Drammen and employs 20 people.This division works in close cooperation with research institutes such as the Norwegian Universityof Science and Technology (NTNU) and SINTEF. Eltek Energy is presently involved in a researchproject with these institutions, with funding from the Research Council of Norway. One of Eltek’sengineers is currently working on an industrial doctorate under the auspices of NTNU. EltekEnergy represents one of the strongest professional environments within the field of powerelectronics in Norway.
Eltek UK is “Exporter of the Year”
Eltek UK received the prestigious ÒExport Times Exporter of the Year AwardÓ in the categoryÒNew ExporterÓ. The ÒNew ExporterÓ prize is awarded to businesses which were establishedas export companies in the last three years and which have achieved significant results anda considerable breakthrough in the market.
9
El tek Energy
Global distribution of sales

10
Fire extinguishing systemsEltek Fire & Safety can deliver all establish-ed forms of fire extinguishing methods usingwater, gas, foam and powder. As a replace-ment for halogen gas systems, which, inaccordance with the regulations, must bereplaced by the end of 1999, one canchoose between several different types ofgas and/or early detection systems. Our fireextinguishing systems are certified for usewithin the offshore, shipping, constructionand manufacturing sectors.
Fireguar d DELTANew operating unit with a pioneeringdesign. Network-based for maximum flexi-bility. Individually adapted to each installat-ion. Graphical presentation with FireWin.100 % compatible with other Eltek systems.A entirely new fire alarm concept has beendeveloped in EltekÕs laboratories. Based on recognised technology, it offersthe customer increased safety andimproved functionality.
Emergency lightingStandard fittings from IEL are simple,elegant light fittings which can be expandedwith self-tester functions and different com-munications solutions. The light fittingshave received an award for good designfrom the Norwegian Design Council. Thelight fittings are EN compliant. As the firstand only manufacturer of emergency lightfittings in Europe, IEL now supplies lightfittings which are compatible with E.I.B ÐEuropean Installation Bus.
Service/Pr ojectEltek Fire & Safety has a well-developedservice apparatus responsible for installa-tion, control and routine maintenance.Our project divisions assist the principalin designing complete fire protection sys-tems.
El tek F ire & Safe ty
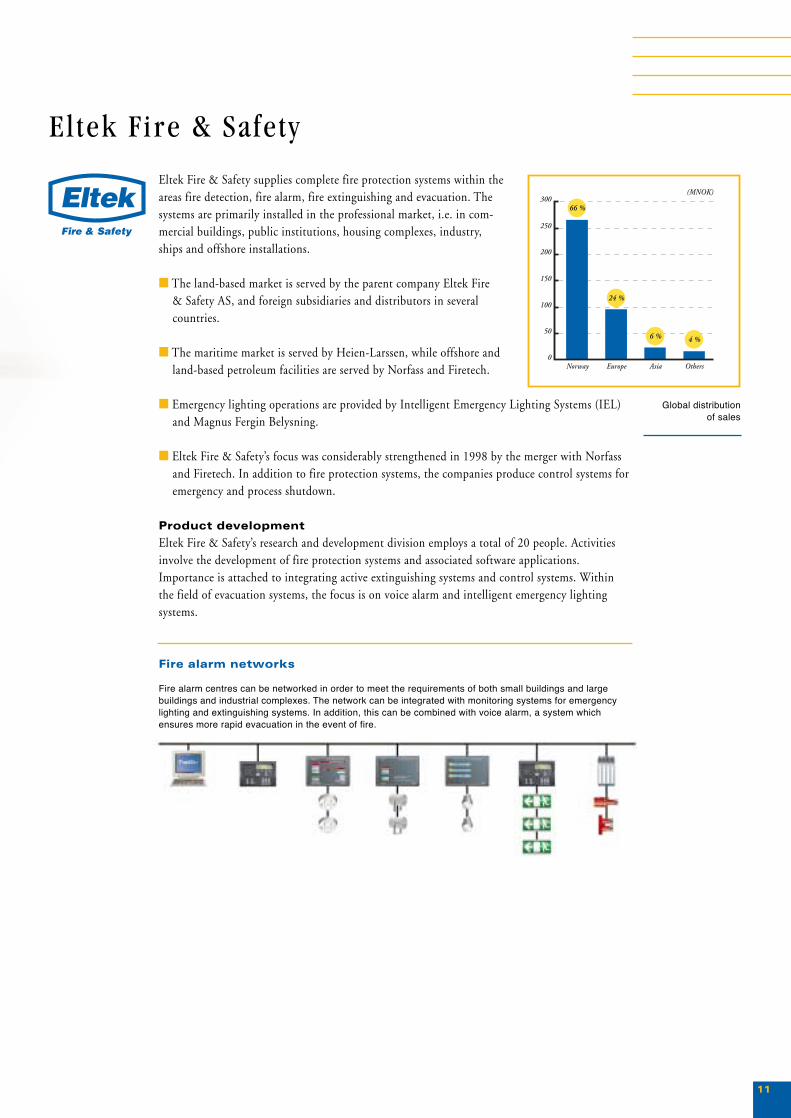
Eltek Fire & Safety supplies complete fire protection systems within theareas fire detection, fire alarm, fire extinguishing and evacuation. Thesystems are primarily installed in the professional market, i.e. in com-mercial buildings, public institutions, housing complexes, industry,ships and offshore installations.
■ The land-based market is served by the parent company Eltek Fire & Safety AS, and foreign subsidiaries and distributors in several countries.
■ The maritime market is served by Heien-Larssen, while offshore and land-based petroleum facilities are served by Norfass and Firetech.
■ Emergency lighting operations are provided by Intelligent Emergency Lighting Systems (IEL) and Magnus Fergin Belysning.
■ Eltek Fire & Safety’s focus was considerably strengthened in 1998 by the merger with Norfass and Firetech. In addition to fire protection systems, the companies produce control systems foremergency and process shutdown.
Product development
Eltek Fire & Safety’s research and development division employs a total of 20 people. Activitiesinvolve the development of fire protection systems and associated software applications.Importance is attached to integrating active extinguishing systems and control systems. Withinthe field of evacuation systems, the focus is on voice alarm and intelligent emergency lighting systems.
Fire alarm networks
Fire alarm centres can be networked in order to meet the requirements of both small buildings and largebuildings and industrial complexes. The network can be integrated with monitoring systems for emergencylighting and extinguishing systems. In addition, this can be combined with voice alarm, a system which ensures more rapid evacuation in the event of fire.
11
Global distribution of sales

Directors ’ report 1998
Results
Eltek recorded an increase of 34 % in both sales and operating profit in 1998 as a result of acquis-itions, one merger and organic growth. Group revenue was NOK 822.6 million, an increase ofNOK 209.1 million on the previous year. Operating profit increased by NOK 14.6 million toNOK 57.2 million and net profit for the year rose by NOK 21.1 million to NOK 45.7 million.In 1998, the sale of shares in companies yielded a total gain of NOK 8.3 million before tax andNOK 6.3 million after tax.
Compared with the pro forma consolidated figures for 1997 (given below in brackets), as theywould have been inclusive of those companies that were acquired in 1998 and exclusive of thosecompanies that were divested in 1998, turnover increased by 14 %, operating profit grew by 18%, while profit before tax rose by 42 %.
Group order intake was NOK 847 (774) million in 1998 and the order backlog at year-end wasNOK 202 (178) million.
Merger, acquisition and divestment of companies
To strengthen Eltek’s position within fire protection, a merger was implemented in 1998 betweenNorfass AS and a company in Eltek Fire & Safety. Eltek has sold emergency lighting as part of itsfire protection concept for many years and invested in a 20 % share when Intelligent EmergencyLighting Systems AS (IEL) was established in 1995. In 1998, Eltek’s emergency lighting businesswas strengthened through the acquisition of the remaining 80 % of IEL and the acquisition of theSwedish company Magnus Fergin Belysning AB. Both companies are owned by Eltek Fire &Safety and were consolidated into the accounts with effect from 1 April 1998. Unitech AS, whichin 1997 became an associated company after Eltek acquired 25.5 % of its shares, became asubsidiary in 1998 following the acquisition of a further 50.5 % of the shares. Eltek Energycurrently owns 76 % of this company.
To streamline Eltek’s involvement in power supply and fire protection systems, shares in the subsi-diary Universal Communication AS (UCOM) and in the associated company Wireless Systems ASwere sold in June 1998.
Eltek Energy
Eltek Energy’s turnover was NOK 443.8 million, a 21% increase in relation to 1997. Operatingprofit was NOK 22.8 million, a reduction of 9 % from last year. The operating margin was 5.1(6.9) %. The reduction in operating profit is largely due to technical problems experienced in thethird quarter when a newly-developed rectifier was recalled for modification.
Order intake in 1998 was NOK 455 (409) million and the order backlog as at 31 December 1998was NOK 89 (78) million.
Eltek Energy increased its sales in Asia by 6 % in spite of the difficult economic situation in thismarket. In addition to China, Singapore and Thailand became important markets in 1998. Thestrongest growth in sales was achieved in Europe (22 %). To strengthen its marketing apparatus inSouthern Europe, Eltek Energy France S.A. was established at the beginning of this year. On theAmerican continent, a frame agreement worth NOK 40 million in total was signed with theCanadian Department of Defence.
12

Eltek Fire & Safety
Eltek Fire & Safety’s turnover was NOK 398 million in 1998, which represents an increase of 92% compared with 1997. Operating profit rose by 153 % to NOK 34.4 million following a strongprofit performance in all segments of the market. The operating margin was 8.6 (6.3) %.
Order intake in 1998 was NOK 411 (386) million while the order backlog as at 31 December1998 was NOK 118 (105) million.
The merger with Norfass AS has made Eltek Fire & Safety a leading supplier of fire protectionsystems to the offshore sector. The acquisition of Magnus Fergin Belysning AB and IEL SystemsAS had a similar effect on the emergency lighting sector. Within the fire alarm sector, Eltek hasstrengthened its position as a market leader in Norway, increasing its market share from 30 % to32 %. The largest land-based project implemented in 1998 was the installation of the fire alarmsystem at Oslo Airport Gardermoen. The Czech Republic and China gave Eltek’s fire alarm systemnational approval, which means that the system has now been approved in 16 countries.
Organisation and environment
Eltek’s activities do not cause any pollution of the external environment. There were no industrialdisputes in 1998. The working environment is regarded as good, and efforts are constantly beingmade to make further improvements in this area.
The Eltek Group had a total of 637 (577) employees as at 31 December 1998. Of these, 417 wereemployed in Norway while 220 worked abroad. At year-end, the parent company had 8 (6)employees.
Preparations for the Millennium
In 1999, the administrative IT systems in the companies in Norway are being replaced, and thesolutions chosen can also be installed in the foreign subsidiaries. All software connected to Eltek’sown products is prepared for the transition to the year 2000, and the Board of Directors is of theopinion that Eltek is on schedule with the system changes that must be implemented before theMillennium.
Financial matters
Through share issues prior to Eltek’s floating on the Oslo Stock Exchange in July, equity capitalwas increased by NOK 79.9 million. In this connection, the nominal value of the shares waschanged from NOK 500 to NOK 1. Following share issues and the merger with Norfass AS, theshare capital was increased by NOK 3,397,103 to NOK 13,824,603. As at 31 December 1998,group equity inclusive of minority interests was NOK 223.4 million, an increase of NOK 113.6million in relation to 1997, equivalent to an equity capital share of 47 %.
Shareholder structure
Eltek had 761 shareholders at the end of 1998. Alain F. Angelil and Wenche Angelil controlled,directly and indirectly, a total of 48.2 % of the company’s shares. Other major shareholders wereSND Invest AS (8.2 %), Norfass Holding AS (8 %) and Telenor Venture AS (4.5 %). The privateshare offering to employees prior to flotation on the Oslo Stock Exchange was well supported. Atyear-end, 321 employees owned 4.7 % of the company’s shares.
13

Strategy and prospects
Eltek’s business concept is to supply advanced products to the professional markets. In order toachieve its growth objectives, Eltek will continue its strategy with an aggressive development ofthe market apparatus by acquiring and establishing companies. In February 1999, Eltek Energypurchased 51 % of the shares in the French company Société de Fabrications Electriques etElectroniques S.A. (S.F.E.E.). In 1999, Eltek Fire & Safety established a new company in theUnited Arab Emirates.
In the opinion of the Board of Directors, the market prospects for 1999 are positive. For EltekEnergy, extensive development programmes within the telecommunications sector in both Europeand Asia provide a good basis for continued growth. Focus will be given to launching newproducts and reducing production costs in order to improve the profit margin in 1999. For EltekFire & Safety, the Norwegian market for new constructions both on land and offshore, whichforms the basis for around fifty per cent of activities in Norway, is expected to be slightly reducedin 1999. For the remaining operations, which are directed at service and upgrading, this develop-ment is expected to be of less significance. The European fire protection market is in a maturephase with relatively stable growth. For Eltek Fire & Safety, growth in 1999 will be secured byfurther internationalisation and an increased focus on service, and by exploiting the synergiesbetween the companies in the business area.
Allocation of the profit for the year
Eltek ASA recorded a net profit for the year of NOK 22.6 million. The Board of Directors recom-mends the allocation to dividend of NOK 1 per share, equivalent to NOK 13.8 million, and thatthe remainder, NOK 8.8 million, be transferred to free reserve.
Drammen, 31 December 1998 / 17 March 1999On the Board of Directors of Eltek ASA
Tore Egil HolteChairman
Leif Rune Rinnan Arve Johansen Alain F. Angelil
Morten F. Angelil Thomas Hoel Øivind Aass
14

The Boar d of Director s of Eltek ASA.From the left:
Morten F. Angelil, Thomas Hoel, Alain F. Angelil, Tore Egil Holte,
¯ivind Aass and Leif Rune Rinnan.
Arve Johansen was not present at the time.
15
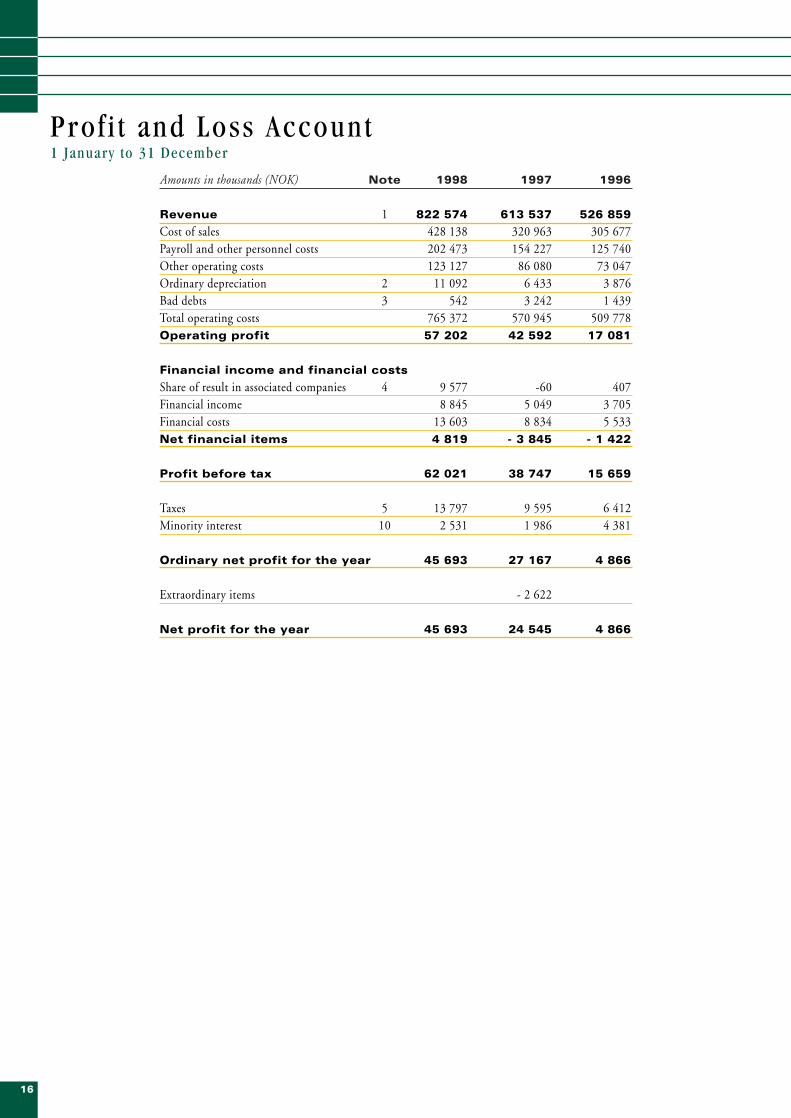
Amounts in thousands (NOK) Note 1998 1997 1996
Revenue 1 822 574 613 537 526 859
Cost of sales 428 138 320 963 305 677 Payroll and other personnel costs 202 473 154 227 125 740 Other operating costs 123 127 86 080 73 047 Ordinary depreciation 2 11 092 6 433 3 876 Bad debts 3 542 3 242 1 439 Total operating costs 765 372 570 945 509 778 Operating profit 57 202 42 592 17 081
Financial income and financial costs
Share of result in associated companies 4 9 577 -60 407 Financial income 8 845 5 049 3 705 Financial costs 13 603 8 834 5 533 Net financial items 4 819 - 3 845 - 1 422
Profit before tax 62 021 38 747 15 659
Taxes 5 13 797 9 595 6 412 Minority interest 10 2 531 1 986 4 381
Ordinary net profit for the year 45 693 27 167 4 866
Extraordinary items - 2 622
Net profit for the year 45 693 24 545 4 866
16
Prof i t and Loss Account 1 January to 31 December

Amounts in thousands (NOK) Note 1998 1997 1996
ASSETS
Current assets
Cash in hand and bank deposits 6 48 358 12 503 10 049Trade debtors 3 182 465 130 156 92 679Other short-term receivables 12 852 22 139 12 651Raw materials 40 139 47 312 31 868Work in progress 34 520 23 220 18 003Finished goods 57 627 29 726 37 382Total current assets 375 961 265 056 202 633
Fixed assets
Shares in associated companies 4 2 657 5 889 837Other shares 7 217 487 835Other receivables 813 862 1 597Goodwill 2 42 951 10 714 10 216Cars, machinery and equipment 2 27 442 15 238 12 697Land and buildings 2 25 445 20 816 13 782Total fixed assets 99 525 54 006 39 964
Total assets 475 486 319 063 242 597
LIABILITIES AND EQUITY
Short-term debt
Trade creditors 97 017 81 832 53 395Bank overdraft 8 8 141 11 127 15 783Holiday pay, payroll tax and VAT 33 983 16 856 16 840Advance payment from customers 17 024 6 843 7 837Tax liability 5 15 943 9 221 8 183Unpaid dividend 13 825 15 965 398Other short-term debt 31 228 33 889 36 213Total short-term debt 217 161 175 734 138 648
Long-term debt
Other long-term debt 25 624 26 134 18 996Pension liabilities 9 9 312 7 394 4 691Total long-term debt 34 936 33 528 23 687
Minority interests 10 8 565 8 447 6 440
Equity
Share capital 13 825 10 428 9 700Other equity capital 200 999 90 926 64 122Total equity 11 214 824 101 353 73 822
Total liabilities and equity 475 486 319 063 242 597
Mortgages 12 65 386 61 972 22 788Guarantees 13 457 768 1 223
17
Balance Sheet As a t 31 December

18
Amounts in thousands (NOK) 1998 1997 1996
Funds generated from/spent on activities
Additions from activities for the year* 46 536 33 023 13 870+/- Change in stock, trade debtors and trade creditors -69 152 -31 530 -21 233+/- Change in other accruals 40 184 1 027 5 390
= (A) Net liquidity change from activities 17 568 2 520 -1 973
Funds generated from/spent on investments
- Investment in fixed assets -59 136 -17 503 -21 445- Investment in shares -217 -4 337 -3 126+ Sales of fixed assets 202 570 274+ Sales of shares 15 000 0 0
+/- Change in other investments/ long-term receivables 49 735 267= (B) Net liquidity change from investments -44 102 -20 535 -24 030
Funds generated from/spent on financing
+ New long-term debt 4 909 5 782 9 069- Repayment of debt -5 310 0 -572+ Change in pension liability 1 809 2 843 -409+ Injection of equity capital 79 932 16 898 -1 051- Distributed dividend -15 965 -398 -14 594
= (C) Net liquidity change from financing 65 375 25 125 -7 557
A+B+C Net change in liquid funds during the year 38 841 7 110 -33 560
+ Liquid funds as at 01.01 1 376 -5 734 27 826= Liquid funds as at 31.12 40 217 1 376 -5 734
Unused overdraft limit as at 31.12 55 859 24 613 18 717
*) Figure calculated from:Net profit for the year, Group 48 224 26 530 9 247
+ Ordinary depreciation 11 092 6 433 3 876- Gain/+ loss at disposal of fixed assets -8 333 0 1 154
+/- Change deferred tax -3 135 0 0+/- Share of result in associated companies -1 312 60 -407
= Additions from activities for the year 46 536 33 023 13 870
Cash F low Analys is

Consolidated accounting principlesThe consolidated accounts consist of Eltek ASA and companies in which EltekASA has a controlling interest. All intragroup transactions and balances havebeen eliminated in the accounts. In the profit and loss accounts, minority inter-ests are included in the profit before taxes and stated on a separate line so thatnet profit for the year shows the majority shareholders’ share of the profit aftertax.
In connection with the acquisition of shares in a subsidiary, the cost price of theshares is eliminated against the equity capital in the subsidiary at the time ofacquisition. Added values are distributed on the other assets or entered as good-will. Goodwill is amortised over the estimated useful life. Goodwill is writtendown if the value is considered to be significantly lower than book value andthis change is expected to be permanent. Mergers are booked in accordance withthe continuity method.
The conversion of foreign companies’ accounts takes place by the profit and lossaccounts being converted at the average exchange rate for the year, whereasbalance sheet items are converted at the current exchange rate as at 31December. Conversion differences are entered directly under the Group’s equitycapital.
Associated companies in which Eltek has a strategic ownership of 20–50 % areincluded in accordance with the equity method. The share of the result isentered on a separate line. In the consolidated balance sheet, associated compan-ies are entered at cost price with the addition of accumulated shares of result.
Booking of income and expenses Income is booked at the time of delivery for goods sold and at the time of pro-vision for service sales. For projects with a long production time, current settle-ment is used so that earned income is booked as income in accordance with thedegree of completion.
Costs are matched with and expensed at the same time as the income to whichthey relate. Costs which cannot be related directly to income are charged toexpense as they accrue. All costs relating to the restructuring and winding-up ofoperations are expensed at the time the decision was taken. Provisions have beenmade for guarantee liability based on historically ascertained guarantee costs anda concrete evaluation of the individual projects.
Classification in the balance sheetAssets attached to the circulation of goods are classified as current assets. Thesame rule also applies in the case of short-term debt. Trade debtors and debtswhich are not attached to the circulation of goods are classified as currentassets/short-term debt if they fall due for payment within one year after thecompletion of the accounting period. Shares which are not intended to beowned permanently are recorded as current assets.
Other assets are classified as fixed assets while other debts are classified as long-term debt.
Items denominated in foreign currencyShort-term balance sheet items denominated in foreign currency are convertedat the exchange rate effective on the balance sheet date. Exchanged gains/lossesare entered as financial income/costs.
Long-term receivables/debt denominated in foreign currency are converted atthe exchange rate effective on the balance sheet date. Unrealised exchange lossesare entered as expenditure, while unrealised exchange gains are only booked asincome as a reversal of prior loss charged or to cover unrealised loss denominat-ed in the same currency.
Trade debtorsTrade debtors are booked at nominal value less provisions for bad debts.Provisions for bad debts are determined on the basis of an individual evaluationof the accounts receivable.
StocksRaw materials are valued at the lower of original cost and actual value. Work inprogress and finished goods of own production are valued at the lower of pro-duction cost and actual value. The FIFO principle is used in connection withthe disposal of stocks.
Work in progressWork in progress on long-term production contracts includes a share of theestimated profit calculated on the basis of the degree of completion of eachcontract. Payments from customers are deducted from the value of work in pro-gress in the same contract or are entered as advanced payments to the extent towhich they exceed this value. Any loss on future work on long-term productioncontracts is charged against income and classified as costs incurred in thebalance sheet.
MaintenanceMaintenance is expensed on a continuous basis. Upgrading and replacement offixed assets are capitalised.
Fixed assetsFixed assets are entered at historical cost adjusted for any revaluation/write-down and accumulated depreciation. Fixed assets are depreciated on a linear basis over their estimated useful life. Gains and losses in connection with thedisposal of fixed assets are included in the operating result.
Research and development costsExpenses incurred in connection with research and development of newproducts are expensed on a continuous basis.
Pension liabilitiesPension liabilities which are defined as contribution schemes are valued at thepresent value of the future pension contributions earned on the balance sheetdate and calculated on the basis of assumptions regarding discount rate, estimat-ed future pay increases and pension regulations. Pension funds are valued atmarket value. Net pension liabilities on under-financed contracts are entered aslong-term interest-free debt, while net pension funds on over-financed contractsare entered as long-term interest-free receivables provided it is likely that theover-financing can be utilised. Net pension cost, which is gross pension costminus the estimated return on pension funds, adjusted for the distributed effectof change in estimates and pension plans, is included in the item payroll and other personnel costs. For pension schemes which for accounting purposes havebeen defined as benefit plans, the benefit is charged as the pension cost for theperiod.
LeasingA distinction is made between financial and operational leasing based on aconcrete evaluation of the individual leasing agreement. Financial leasing meansagreements where the lessee assumes the major part of the advantages and risksassociated with owning the fixed asset. Financially-leased fixed assets are enteredin the balance sheet and depreciated as ordinary fixed assets, whereas the leasingagreement’s payment liabilities are treated as debt. The instalments on the termpayments are treated as debt instalments, while interest charges are treated asfinancial expenses. In the case of operational leasing, the term payments arecharged as expenditure in the period in which the cost relates to.
TaxesTaxes in the profit and loss account include both tax payable and the change indeferred tax. The payable tax effect and deferred tax effect of items chargeddirectly against equity capital have also been charged directly against equitycapital. Deferred tax is assessed in accordance with the debt method as anequilisation of positive and negative temporary variances between tax and bookvalues plus loss which can be carried forward. In accordance with current rules,the net deferred tax advantage is not recorded in the balance sheet.
Cash flowLiquid funds are defined as the sum of cash in hand and bank deposits reducedby utilised overdraft. The cash flow analysis is drawn up in accordance with theindirect method.
19
Comments to the accounts
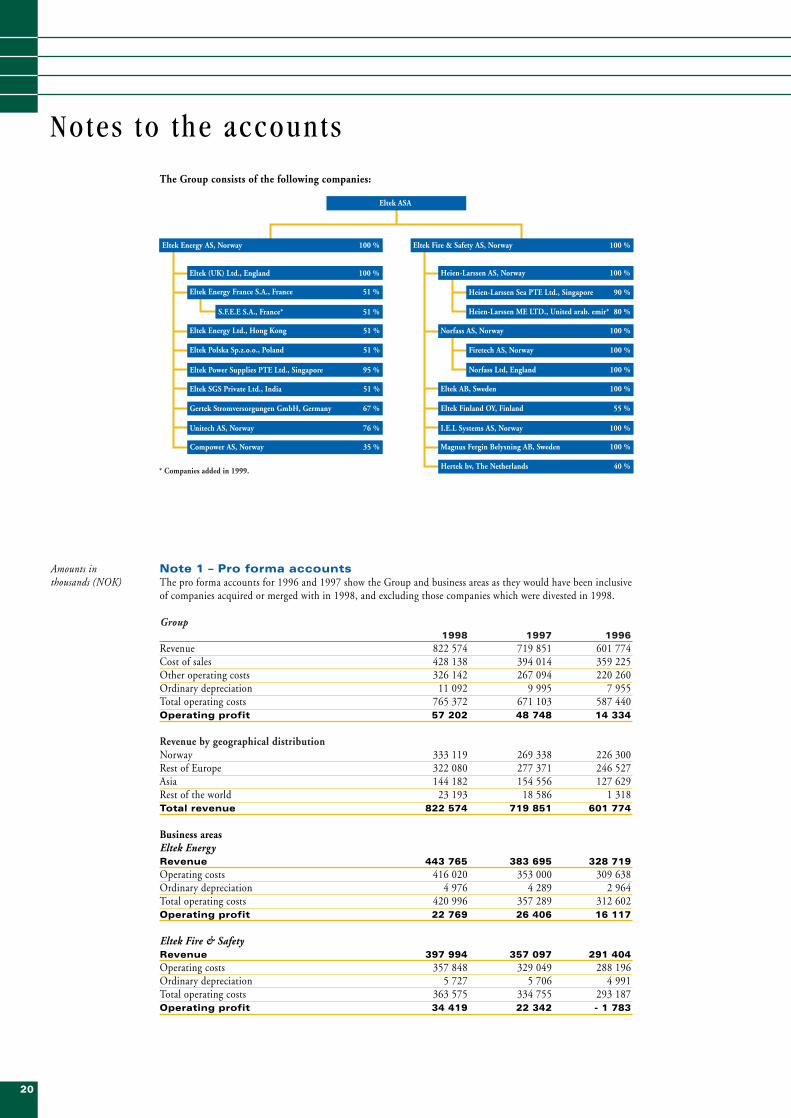
Note 1 – Pro forma accountsThe pro forma accounts for 1996 and 1997 show the Group and business areas as they would have been inclusiveof companies acquired or merged with in 1998, and excluding those companies which were divested in 1998.
Group 1998 1997 1996
Revenue 822 574 719 851 601 774Cost of sales 428 138 394 014 359 225Other operating costs 326 142 267 094 220 260Ordinary depreciation 11 092 9 995 7 955Total operating costs 765 372 671 103 587 440Operating profit 57 202 48 748 14 334
Revenue by geographical distributionNorway 333 119 269 338 226 300Rest of Europe 322 080 277 371 246 527Asia 144 182 154 556 127 629Rest of the world 23 193 18 586 1 318Total revenue 822 574 719 851 601 774
Business areasEltek EnergyRevenue 443 765 383 695 328 719Operating costs 416 020 353 000 309 638Ordinary depreciation 4 976 4 289 2 964Total operating costs 420 996 357 289 312 602Operating profit 22 769 26 406 16 117
Eltek Fire & Safety Revenue 397 994 357 097 291 404Operating costs 357 848 329 049 288 196Ordinary depreciation 5 727 5 706 4 991Total operating costs 363 575 334 755 293 187Operating profit 34 419 22 342 - 1 783
20
The Group consists of the following companies:
Notes to the accounts
Amounts inthousands (NOK)

Note 2 – Fixed assetsGroup
Goodwill Machinery, etc. Buildings, etc. TotalOriginal cost as at 01.01 10 417 41 411 25 821 77 649Additions 38 876 16 328 2 898 58 102Disposals 0 1 072 0 1 072Accumulated depreciation 6 342 29 225 3 274 38 841Book value as at 31.12 42 951 27 442 25 445 95 838Depreciation for the year 3 474 6 575 1 043 11 092Rate of depreciation 5–10 % 10–33 % 2–20 %
Investments in and sales of (sales price) fixed assets and real property in the past five years:1998 1997 1996 1995 1994
Inv. Sales Inv. Sales Inv. Sales Inv. Sales Inv. SalesGoodwill 38 876 0 427 0 11 032 0 0 0 0 0Machinery, etc. 16 328 202 9 767 570 6 329 274 5 842 381 3 137 284Land/buildings 2 898 0 6 882 0 3 268 0 1 318 0 3 246 0Total 58 102 202 17 076 570 20 629 274 7 160 381 6 383 284
Parent companyMachin etc. Buildings, etc Total
Original cost as at 01.01 10 530 1 046 11 576Additions 8 252 121 8 373Disposals 610 0 610Accumulated depreciation 8 699 984 9 683Book value as at 31.12 9 473 183 9 656Depreciation for the year 320 53 374Rate of depreciation 10–33 % 10 %
Investments in and sales of (sales price) fixed assets and real property in the past five years:1998 1997 1996 1995 1994
Inv. Sale Inv. Sale Inv. Sale Inv. Sale Inv. SaleMachinery, etc. 8 252 110 354 9 908 3 169 274 2 109 40 1 808 174Land/buildings 121 0 73 6 896 3 203 0 323 0 114 0Total 8 373 110 427 16 804 6 372 274 2 432 40 1 922 174
Note 3 – Trade debtorsGroup
1998 1997 1996Trade debtors at nominal value as at 31.12 187 343 134 961 95 910Provisions for bad debts 4 878 4 805 3 231Trade debtors as at 31.12 182 465 130 156 92 679
Accounting valuation:Provisions for bad debts as at 01.01 4 805 3 231 1 976Provisions for bad debts as at 31.12 4 877 4 805 3 231Change in provision for bad debts -72 -1 574 -1 255Net loss booked during the year -470 -1 668 -184Net cost in the profit and loss account -542 -3 242 -1 439
Parent companyTrade debtors at nominal value as at 31.12 3 603 3 030 62 743Provisions for bad debts 0 0 1 400Trade debtors as at 31.12 3 603 3 030 61 343
Accounting valuation:Provisions for bad debts as at 01.01 0 1 400 1 200Provisions for bad debts as at 31.12 0 0 1 400Change in provisions for bad debts 0 1 400 - 200Transferred by intragroup transfers 0 - 1 400 0Net loss booked during the year 0 -435 -125Net cost in the profit and loss account 0 -435 -325
Amounts inthousands (NOK)
21

Note 4 – Shares in associated companiesGroupShares in associated companies comprise the following:
Share of value Share of Share of bookas at 01.01 result value as at 31.12
Ucom AS (48 % ownership share) 279Compower AS (35 % ownership share) 406 233 639Hertek bv (40 % ownership share) 1 172 800 2 018Gain from sale of shares in associated companies 4 311 8 265Total associated companies 5 889 9 577 2 657
Note 5 – TaxesGroupReconciliation of taxes:
1998 1997 1996Tax payable 16 932 9 595 6 412Change in deferred tax -3 135 0 0Taxes 13 797 9 595 6 412
Deferred tax on temporary variances related to:Current assets/short-term debt 13 558 -5 343 -6 032Fixed assets/long-term debt -7 535 -5 651 894Other variances - 7 255 - 1 433 0
Net negative temporary variances - 1 232 -12 427 - 5 138
Estimated deferred tax advantage -345 - 3 480 -1 439
Parent companyReconciliation between profit before tax and tax base for the year:
1998 1997 1996Profit before tax 29 854 437 011 14 070Gain on intragroup transfer -1 600 -425 000 0Permanent variances 276 3 313 1 839Change, temporary variances -1 621 -4 872 805Intragroup contribution 0 0 -9 321Share issue costs, eliminated against equity -8 073 0 0Risk -1 867 0 -4 511Tax base for the year 16 969 10 452 2 882
Of which 28 % tax 4 751 2 927 807Tax on share of result Eltek Energy Ltd. 0 0 200Payment of share dividend for the year 0 -1 536 0Tax payable 4 751 1 391 1 007Tax receivable offset in previous years 1 474 1 474 462Net tax payable/receivable as at 31.12 3 277 -83 545
Reconciliation of taxes:Allocated tax payable 4 751 1 391 1 007Reduction in tax payable, eliminated against equity 2 253 0 0Excess allocation for previous years -242 0 - 37Refund claim in accordance with division model (excess allocation) 0 0 - 104Change in deferred tax 454 8 0Taxes 7 217 1 399 866
Deferred tax on temporary variances related to:Current assets/short-term debt 0 0 - 5 454Fixed assets/long-term debt 1 653 32 614
Net positive/- negative temporary variances 1 653 32 - 4 840Estimated deferred tax/tax advantage 463 9 - 1 355
Note 6 – Bank depositsGroupWithholding tax in the Group is secured through a Group guarantee.
Parent companyWithholding tax is secured by a bank guarantee.
22
Amounts inthousands (NOK)

Note 7 – Other sharesGroupThe holding of other shares in the group as at 31.12 consists of:
Share Total No. of Nominal value Recordedin % share capital shares per share value
Vendosafe AS 7.1 % 3 260 100 2 311 NOK 100 208Technor ASA 9Total shares in other companies 217
Note 8 – Credit ceilingThe consolidated companies have overdraft facilities totalling NOK 64 000.
Note 9 - Pension cost and pension liabilitiesEstimated pension cost Group Parent company
1998 1997 1996 1998 1997 1996Earned pension for the year 4 969 4 417 3 399 207 1 664 2 710Interest charges on pension liability incurred 1 614 1 275 1 097 115 499 865Estimated return on the pension funds -1 454 -1 293 -977 -197 -590 -763Amortisation -11 -233 -115 -30 -96 -134Withholding of employee pay -1 481 -1 158 -1 092 -62 -540 -997Net pension cost 3 637 3 008 2 312 32 937 1 681
Pension liability as at 31.12Estimated value of pension funds 22 468 18 517 17 733 2 454 3 239 14 351Estimated value of pension liability 31 885 25 911 22 679 2 270 3 098 17 932Net unamortised loss 105 0 255 151 0 83Net pension liability as at 31.12 9 312 7 394 4 691 -33 -141 3 664
This calculation has been based on the following assumptions:Discount rate 6.0 %Expected return 7.0 %Pay regulation 3.3 %
Eltek ASA’s collective pension scheme in an insurance company covers 8 employees, whereas the Group’s collective pension scheme covers 254 employees.
Eltek (UK) Ltd. pays a contribution to two self-managed pension schemes, one for individuals members of theBoard of Directors and executives and another for other employees. The pension funds have not been entered inthe company’s balance sheet.
Note 10 – Minority interestsGroup
1998 1997 1996Minority interests as at 01.01 8 447 6 440 6 371Minority share of the result 2 531 1 985 4 381Acq. of minority shares/capital changes -2 567 0 - 3 499Dividend 0 - 852 - 412Conversion differences 154 874 - 401Minority interests as at 31.12 8 565 8 447 6 440
Note 11 – EquityGroup
1998 1997 1996Equity as at 01.01 101 353 73 822 69 694Share issue/capital reduction 79 932 16 536 - 1 254Ordinary net profit 45 693 24 545 4 866 Dividend -13 825 -15 000 0Conversion differences 637 1 450 516Effect of merger 1 034 0 0Equity as at 31.12 214 824 101 353 73 822
Parent companyEquity as at 01.01 504 393 67 246 63 362Share issue in parent company 79 932 16 536 0Ordinary net profit 22 638 435 612 13 205Intragroup contribution made 0 0 - 9 321Dividend -13 825 - 15 000 0Cash payment, merger -9 910 0 0Equity as at 31.12 583 228 504 393 67 246
23
Amounts inthousands (NOK)
Inflation/Basic amount reg. 2.5 %Pension regulation 2.5 %Voluntary retirement 5.0 %
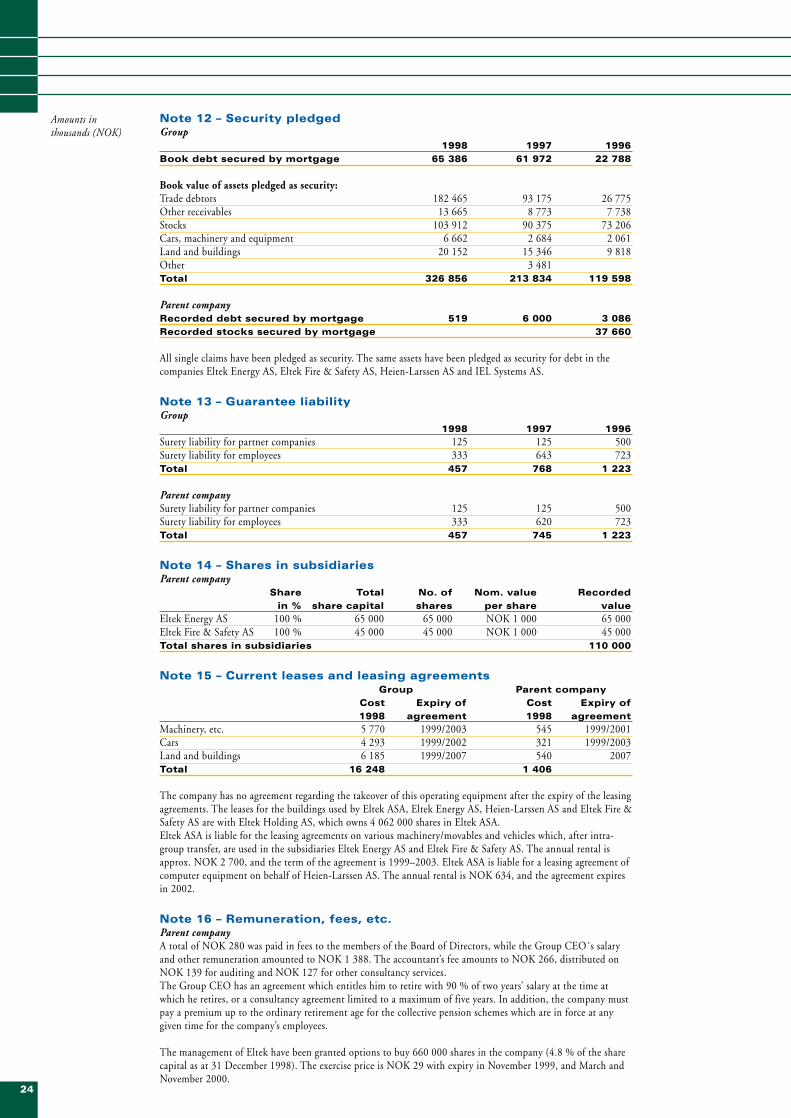
Note 12 – Security pledgedGroup
1998 1997 1996Book debt secured by mortgage 65 386 61 972 22 788
Book value of assets pledged as security:Trade debtors 182 465 93 175 26 775 Other receivables 13 665 8 773 7 738 Stocks 103 912 90 375 73 206 Cars, machinery and equipment 6 662 2 684 2 061 Land and buildings 20 152 15 346 9 818 Other 3 481 Total 326 856 213 834 119 598
Parent companyRecorded debt secured by mortgage 519 6 000 3 086 Recorded stocks secured by mortgage 37 660
All single claims have been pledged as security. The same assets have been pledged as security for debt in thecompanies Eltek Energy AS, Eltek Fire & Safety AS, Heien-Larssen AS and IEL Systems AS.
Note 13 – Guarantee liabilityGroup
1998 1997 1996Surety liability for partner companies 125 125 500Surety liability for employees 333 643 723Total 457 768 1 223
Parent companySurety liability for partner companies 125 125 500Surety liability for employees 333 620 723Total 457 745 1 223
Note 14 – Shares in subsidiariesParent company
Share Total No. of Nom. value Recordedin % share capital shares per share value
Eltek Energy AS 100 % 65 000 65 000 NOK 1 000 65 000Eltek Fire & Safety AS 100 % 45 000 45 000 NOK 1 000 45 000Total shares in subsidiaries 110 000
Note 15 – Current leases and leasing agreementsGroup Parent company
Cost Expiry of Cost Expiry of 1998 agreement 1998 agreement
Machinery, etc. 5 770 1999/2003 545 1999/2001Cars 4 293 1999/2002 321 1999/2003Land and buildings 6 185 1999/2007 540 2007Total 16 248 1 406
The company has no agreement regarding the takeover of this operating equipment after the expiry of the leasingagreements. The leases for the buildings used by Eltek ASA, Eltek Energy AS, Heien-Larssen AS and Eltek Fire &Safety AS are with Eltek Holding AS, which owns 4 062 000 shares in Eltek ASA. Eltek ASA is liable for the leasing agreements on various machinery/movables and vehicles which, after intra-group transfer, are used in the subsidiaries Eltek Energy AS and Eltek Fire & Safety AS. The annual rental isapprox. NOK 2 700, and the term of the agreement is 1999–2003. Eltek ASA is liable for a leasing agreement ofcomputer equipment on behalf of Heien-Larssen AS. The annual rental is NOK 634, and the agreement expiresin 2002.
Note 16 – Remuneration, fees, etc.Parent companyA total of NOK 280 was paid in fees to the members of the Board of Directors, while the Group CEO´s salaryand other remuneration amounted to NOK 1 388. The accountant’s fee amounts to NOK 266, distributed onNOK 139 for auditing and NOK 127 for other consultancy services.The Group CEO has an agreement which entitles him to retire with 90 % of two years’ salary at the time atwhich he retires, or a consultancy agreement limited to a maximum of five years. In addition, the company mustpay a premium up to the ordinary retirement age for the collective pension schemes which are in force at anygiven time for the company’s employees.
The management of Eltek have been granted options to buy 660 000 shares in the company (4.8 % of the sharecapital as at 31 December 1998). The exercise price is NOK 29 with expiry in November 1999, and March andNovember 2000.
24
Amounts inthousands (NOK)

Note 17 – Shares owned and options granted to members of theBoard of DirectorsParent companyMembers of the Board of Directors of Eltek ASA own/control the following shares and options in the com-pany:
Name Board affiliation No. of shares No. of optionsTore Egil Holte Board chairman 0 0Leif Rune Rinnan Board member * 618 500 0Arve Johansen Board member 39 000 13 000Øivind Aass Board member 400 0Thomas Hoel Board member 0 0Morten F. Angelil Board member 0 50 000Alain F. Angelil Board member/Group CEO ** 6 668 603 50 000
* Telenor Venture owns the shares** 4 062 000 shares are owned by Eltek Holding AS and 1 035 000 shares by Wenche Angelil.
Note 18 – Forward exchange contractsMajor contracts entered into in a foreign currency have been secured by means of forward exchange contracts. In addition, forward contracts have been entered into in the currencies in which the Group has considerablerunning revenues.
Outstanding forward exchange contracts as at 31.12.98:Currency Buy/sale Amount in
currency (1,000)EURO sale 3 581GBP sale 1 600CAD sale 2 250THB sale 6 000
Note 19 – Research and development costsGroup
1998 1997 1996Expensed research and development costs 26 578 22 070 18 605
Note 20 – RiskThe risk amount per share as at 01.01.98 143.07 * Estimated risk amount per share as at 01.01.99 0.47
* Calculated on the basis of the number of shares as at 01.01.98, which was 20,855.
Note 21 – The ten largest shareholders in Eltek ASA as at 31.12.98
No. of shares Share in %Eltek Holding AS 4 062 000 29.4 %Alain F. Angelil 1 571 603 11.4 %SND Invest AS 1 128 500 8.2 %Norfass Holding AS 1 108 000 8.0 %Wenche Angelil 1 035 000 7.5 %Telenor Venture AS 618 500 4.5 %Tine Pensjonskasse 450 900 3.3 %Omega Investment Fund 400 000 2.9 %Closa Corp. 225 236 1.6 %Aksjefondet Gambak 220 000 1.6 %
Amounts inthousands (NOK)
25

Accounts for the parent company El tek ASA
Profit and Loss Account
Amounts in thousands (NOK) Note 1998 1997 1996Revenue 9 198 545 513 280 078 Cost of sales 601 60 770 147 953 Payroll and other personnel costs 5 460 41 037 79 882 Other operating costs 2 734 19 650 41 013 Ordinary depreciation 2 374 877 2 175 Bad debts 3 0 435 325 Total operating costs 9 170 122 769 271 348
Operating profit 28 422 744 8 730
Financial income and financial costsGain on sales of shares 9 918 0 0Dividend from subsidiaries 0 5 486 4 511 Financial income 20 630 15 206 2 436 Financial costs -722 - 3 803 - 1 607 Net financial items 29 826 16 889 5 340
Profit before tax 29 854 439 633 14 070
Taxes 5 7 217 1 399 866 Ordinary net profit 22 638 438 234 13 204
Extraordinary items -2 622 Net profit for the year 22 638 435 612 13 204
TransfersIntragroup contribution 0 0 9 321Statutory reserve 0 0 1 320Dividend 13 825 15 000 0Restricted funds 0 0 - 375Free reserve 8 813 420 612 2 938Total transfers 22 638 435 612 13 204
Cash Flow Analysis
Amounts in thousands (NOK) 1998 1997 1996Net liquidity change from activities 52 781 37 398 1 339
Net liquidity change from investments -48 470 -25 782 -20 315
Net liquidity change from financing 49 541 5 612 -2 875
Net change in liquid funds during the year 53 852 17 228 -21 851
Liquid funds 01.01 17 644 416 22 267
Liquid funds 31.12 71 496 17 644 416
Balance Sheet
Amounts in thousands (NOK) Note 1998 1997 1996ASSETSCurrent assetsCash in hand and bank deposits 6 71 496 17 644 3 502 Trade debtors 3 3 603 3 030 61 343 Other short-term receivables 408 35 419 10 319 Raw materials 0 0 17 386 Work in progress 0 0 12 869Finished goods 0 0 7 405 Total current assets 75 507 56 093 112 824
Fixed assetsShares in subsidiaries 14 110 000 78 763 22 363 Other shares 0 2 805 918Intragroup receivables 414 768 402 547 0 Other receivables 77 175 1 419 Cars, machinery and equipment 2 9 473 1 579 6 866 Land and buildings 2 183 115 3 783 Total fixed assets 534 501 485 984 35 349 Total assets 610 008 542 077 148 173
LIABILITIES AND EQUITYShort-term debtTrade creditors 4 609 2 048 19 753 Bank overdraft 8 0 0 3 086 Holiday pay, payroll tax and VAT 1 077 4 396 12 285 Advance payment from customers 0 0 1 753 Tax liability 5 3 277 - 83 545 Unpaid dividend 13 825 15 000 0 Short-term debt to subsidiaries 1 871 0 0Other short-term debt 1 139 10 314 27 309 Total short-term debt 25 798 31 675 64 731
Long-term debtPension liabilities 0 0 3 664 Other long-term debt 519 6 000 12 532Deferred tax 5 463 9 0Total long-term debt 982 6 009 16 196
EquityShare capital (13 825 603 shares à NOK 1) 13 825 10 428 9 700 Reserve fund 54 010 54 010 54 010Free reserve 515 393 439 955 3 536Total equity 11 583 228 504 393 67 246
Total liabilities and equity 610 008 542 077 148 173
Mortgages 12 519 6 000 3 086 Guarantees 13 457 745 1 223
26

Audi tor ’s report
27

The Asian market:
El tek towards new horizons
This result is due to a number of years spentdeveloping business relations and over time anextensive knowledge of how to conduct businessin Asia. Eltek Energy’s offices in the highestbuilding in the Chinese town of Guangzhou arein two senses a lookout post over one of theworld’s fastest growing markets for telecom-munications products.
It all began eight years ago. Eltek was represent-ed at Telecom 91 in Geneva, which is renownedas one of the largest trade fairs of its kind in theworld. No one of any significance had visited the
stand in the first days of the exhibition and Eltek representatives were beginning to get impatient.Alain Angelil decided to travel back home and to leave a junior behind to pack up.
Just before the fair closed, two Chinese businessmen from Hong Kong appeared. They wereinterested in what Eltek had to offer as regards power supply technology and promised to contactEltek later. One year passed, by which time most people at Eltek had forgotten the Chinese. Yetthey reappeared at the beginning of the summer and in only a short period of time an agreementto supply goods worth NOK 50 million had been negotiated - in the space of three months!
The equipment was to be delivered to China, which at that time was taking its first tentativesteps into a new telecommunications world.
“Things got hot that summer,” says a key employee in Eltek Energy. “We worked day andnight, but we managed to deliver the equipment.”
Set the ball rolling
The order was extended to supplies for NOK 100 million and the ball began rolling. In the spaceof these years, supplies to China have surpassed a quarter of a billion kroner and Eltek Energy hasestablished a subsidiary in Hong Kong. Inside the Chinese border, in the Guangdong province,plans were laid to manufacture Eltek products under license - a major prerequisite for continuedexpansion.
Guangdong is the most important Chinese province as far as telecommunications are concerned,with a catchment area representing more than 20 % of the Chinese market.
According to Eltek, everything in the telecommunications sector happens here. And develop-ments largely follow the same trends as in Europe. The former regional telephone company hasbeen divided into a variety of businesses which partly compete with one another. Other compani-es too have entered the market. Compared to the West, the biggest difference is of course thateverything is owned by the authorities.
Eltek has entered this conglomerate through its contact with its Chinese partners in Hong Kong,a valuable form of cooperation. Today Eltek is a key supplier of power supply systems to the tele-communications industry in the Chinese market – one of three “Switch Mode Power Supply” -suppliers with more than a 10% market share over the last six years. Furthermore, Eltek is theforeign supplier with the best established foothold in China in the power supply industry. In thispart of the world, it means a lot to make contacts as early as possible – and to hang on to them.
Frankie Kong, who is in charge of Eltek Energy in Hong Kong, feels that the company’s merithas been its willingness to share its experiences with the Chinese. In particular, Eltek has beenwilling to learn from the Chinese and local conditions. It’s important to know this since theChinese authorities regularly change their attitudes towards trade protectionism. Without priorwarning, import duties can sky-rocket and all channels of import dry up.
“That’s what happened at the end of 1998,-” says Morten Angelil, who has been involved in
The Asian market has been l ike a rol lercoaster r ide over the last two years . Upand down - and most ly down. However,El tek Energy has managed to hold i tsown against the strongest ef fects of therecession in this area. In the last year,the company has seen an increase in sales in the region, from NOK 114 mil l ion to NOK 121mil l ion.
From Eltek EnergyÕsChinese office in
Guangzhou, one canlook out over an
expanding market forpower supply
products.
28

the Asian operations right from the outset.“We’re up and running again now, thanks inparticular to our good cooperative relations-hip with the Chinese.”
Expansion in Asia
In February 1997, Eltek established a compa-ny in Singapore, originally as a joint venturewith Jasper Suah, a local partner. Over timeEltek has taken over 95% of Eltek PowerSupplies PTE Ltd.. In its first year of trading,the company achieved a turnover of NOK 12million. Today, under the management of theNorwegian Lars Jervan, Eltek has out-competed virtually all the local competitionin Singapore. Eltek’s customer is SingaporeTelecom.
Since then, Thailand too has opened upas a market for Eltek Energy. Through cooperation with the company KSCOM, Eltek has becomemarket leader in a short space of time, with AIS, Thailand’s largest mobile telephone operator, asits main customer. The manager of AIS, in justifying his company’s choice of supplier, points toEltek’s technology and the service and support it offers.
“By supplying 300 systems via Nokia, Eltek has proven that its products measure up.” Greatimportance is attached to Eltek’s plans to establish a local service centre in the region.
New growth
Only four months after Eltek sent Lars Jervan to Singapore in 1997, the Asian market suffered itsbiggest collapse ever. There was hardly a country in the region that was not affected by the suddenfall on the bourses in Japan and Korea.
“It’s obvious that the timing was extremely unfortunate,” says Morten Angelil. “The flow ofinvestments was shut off everywhere. Nevertheless, we managed to maintain our client relations-hip. Eltek did not suffer a drop in sales during the crisis,” he says – not without a hint of pride.
Anyone who can manage to survive through a crisis like that has a special advantage. Now, at thebeginning of 1999, things look a lot brighter. Friday evening’s mobile phone traffic statistics aresaid to be one of the most reliable indicators of business activity in the telecommunications sectorin Thailand. This traffic suffered a serious setback from the autumn of 1997, but in December1998 and the first two months of 1999 there has been a steady upturn in activity. The samesignals are also evident in other countries in the region.
New challenges
At the beginning of 1999, Eltek faces new challenges in Asia. Malaysia and the Philippines arenext on the agenda. And there are plans for investments in Australia, too.
The biggest challenges are nevertheless linked to the Chinese market. The potential there isenormous, but every foreign supplier faces challenges in adapting to the market. Still, Eltek isonly optimistic.
“We can manage to pull this off,” says Morten Angelil. “But I’m very happy we have beenworking in China for several years. Starting outas a new player today would be almostimpossible,” he says.
And he expects to have a lot of new things onhis plate in the space of a few months.
Singapore andThailand are the mainfocus of EltekÕs involvement in Asia.
Cooperation in Chinais rooted in manufact-
uring under licenceand the transfer of
technology.
29
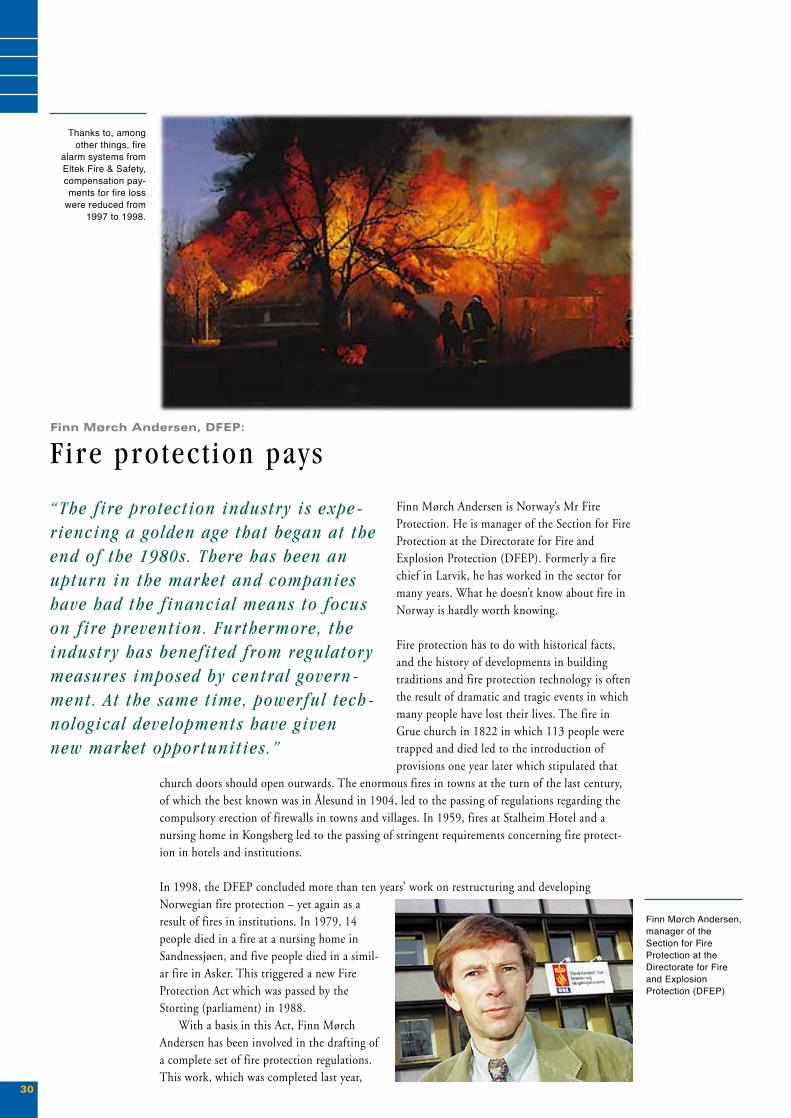
Finn Mørch Andersen, DFEP:
Fire protec t ion pays
Finn Mørch Andersen is Norway’s Mr FireProtection. He is manager of the Section for FireProtection at the Directorate for Fire andExplosion Protection (DFEP). Formerly a firechief in Larvik, he has worked in the sector formany years. What he doesn’t know about fire inNorway is hardly worth knowing.
Fire protection has to do with historical facts,and the history of developments in buildingtraditions and fire protection technology is oftenthe result of dramatic and tragic events in whichmany people have lost their lives. The fire inGrue church in 1822 in which 113 people weretrapped and died led to the introduction ofprovisions one year later which stipulated that
church doors should open outwards. The enormous fires in towns at the turn of the last century,of which the best known was in Ålesund in 1904, led to the passing of regulations regarding thecompulsory erection of firewalls in towns and villages. In 1959, fires at Stalheim Hotel and anursing home in Kongsberg led to the passing of stringent requirements concerning fire protect-ion in hotels and institutions.
In 1998, the DFEP concluded more than ten years’ work on restructuring and developingNorwegian fire protection – yet again as aresult of fires in institutions. In 1979, 14people died in a fire at a nursing home inSandnessjøen, and five people died in a simil-ar fire in Asker. This triggered a new FireProtection Act which was passed by theStorting (parliament) in 1988.
With a basis in this Act, Finn MørchAndersen has been involved in the drafting ofa complete set of fire protection regulations.This work, which was completed last year,
“The f ire protection industry is expe -riencing a golden age that began at theend of the 1980s. There has been an upturn in the market and companieshave had the f inancial means to focuson fire prevention. Furthermore, the industry has benefited from regulatorymeasures imposed by central govern-ment. At the same time, powerful tech -nological developments have given new market opportunities .”
30
Thanks to, among other things, fire
alarm systems fromEltek Fire & Safety,compensation pay-ments for fire loss
were reduced from1997 to 1998.
Finn M¿rch Andersen,manager of theSection for FireProtection at theDirectorate for Fireand ExplosionProtection (DFEP)

resulted in the Regulations concerning the Sweeping of Chimneys and the Inspection ofFireplaces.
Positive development
Norwegian fire statistics have not been much to boast about, but they appear to be more positivetowards the end of the 1990s, even though Mr Mørch Andersen is the first person to claim thatthe positive figures from the 1998 statistics may be a chance variation. In 1998, a total of NOK2.4 billion was paid out in compensatory damages, and this represents a reduction of NOK 400million from the year before. The number of fire-related deaths has fallen from 67 in 1997 to 52in 1998. This is the lowest figure since 1983.
The large fires in the 1980s were a peculiarly Norwegian phenomenon, and we fared worsethan countries with which we generally compare ourselves, such as Sweden, Denmark and theUnited Kingdom. Last year’s figures have brought us to the same level as these countries!
“Without a doubt, this development has a lot to do with the strategic efforts of the DFEP inthe early 1990s, when ambitious objectives were set. One objective was that material losses frommajor fires (= fires in which assets worth more than NOK 5 million are lost) should be reduced by50%. Another objective was that the total material losses should be reduced by 30%. The firstobjective has been achieved. As far as the second one is concerned, there is still some way to go,even though the trend is positive.”
Exciting new technology
Mr Mørch Andersen feels that some of the credit for this positive trend should go to technologicaldevelopments in fire alarms and fire protection. He is positive to the market prospects for theindustry. In particular, he thinks there is a great potential for fire protection systems with voicealarm warnings. He believes that more and more companies will show interest in the newly-developed systems – new detection technology in combination with spoken warnings:
“There is no doubt that most people have more respect for a spoken message than a triggeredalarm bell. There is so much noise around that people have become totally immune to alarm bells.Furthermore, the technology provides an opportunity for improved differentiation. A bell is abell, whereas a voice can be adapted to the degree of danger. It’s really quite amazing that morepeople haven’t recognised the potential in the improved utilisation of detection technology,” hesays.
He remembers an episode involving a false fire alarm at “Paleet”, a shopping centre in thecentre of Oslo. Everyone on the premises had to be evacuated in the middle of Saturday shopping.The alarm cost the shopping centre an estimated NOK 2–2.5 million in reduced takings!
Costly consequences
Just inside the entrance to DFEP’s offices in Tønsberg one can see an Eltek automatic fire detect-or system. The directorate does not own the building, but the system was installed following“mild pressure from the owner of the building”. Mr Mørch Andersen stresses that while there areno formal requirements stating that a building of this size should install a detector system, it doesenhance security considerably.
The DFEP tests the system on a regular basis. On the first Monday of each month the alarm is sounded at precisely 9 o’clock. In addition to the alarm warning, the DFEP has automated switch-board that issues a warning via all the telephones in the building.
One should practice what one preaches!
31
Compensation for fireloss paid out byNorwegian insurancecompanies.

Organisa t ion and management
All Eltek’s operational activities are divided intothe business areas Eltek Energy and Eltek Fire &Safety. The Group is managed by a managementteam consisting of the Group CEO, the manag-ers of the two business areas and the GroupDirector of Finance.
The organisation of the business area Eltek Energy is based on a division of the geographicalmarkets between Norway, UK and France, while the organisation of Eltek Fire & Safety is basedon the market segments offshore, onshore, marine and emergency lighting.
As at 17 March 1999, the Group CEO was acting Group Director of Eltek Energy.
Eltek is a worldwide group with subsidiaries in Europe and Asia and anetwork of distributors and agents covering al l continents .
32
Alain F. Angelil,Group CEO
J¿rgen Larsen,Group Director
Finance
Odd Magne Olsen,Group Director
Eltek Fire & Safety

33
The main offices ofEltek ASA and Eltek
Energy at Eikhaugen
The main office ofEltek Fire & Safety
at Lierstranda.
In ternat ional network

Eltek Fire & Safety ASP.O.Box 3514, 3007 Drammen
Lierstranda Industriområde, 3412 Lierstranda, NorwayTel.no.: 004732244800 Fax.no.: 004732244801
Heien-Larssen ASP.O.Box 3643, 3007 Drammen
Lierstranda Industriområde, 3412 Lierstranda, NorwayTel.no.: 004732244900 Fax.no.: 004732244901
Heien-Larssen SEA Pte. Ltd.Block 8, #01-128
Pandan LoopSingapore 128226, Singapore
Tel.no.: 00657751368 Fax.no.: 00657766330
Heien-Larssen Middle East Ltd.P.O.Box 302
62 Dubai, United Arab EmiratesTel.no.: 009714351138 Fax.no.: 009714351218
Eltek ABMöllersvärdsgatan 12
S-75450 Uppsala, SwedenTel.no.: 004618122060 Fax.no.: 004618122035
Eltek Finland OYKuokkamaantie 4B
SF-33800 Tampere, FinlandTel.no.: 0035832121050 Fax.no.: 0035832121049
Intelligent Emergency Lighting Systems ASP.O.Box 1584, 3007 Drammen
Gråterudvn. 39, 3036 Drammen, NorwayTel.no.: 004732203200 Fax.no.: 32880853
Magnus Fergin Belysning ABP.O.Box 1125
S-581111 Linköping, SwedenTel.no.: 004613130310 Fax.no.: 004613130721
Norfass ASP.O.Box 8250 Vågsbygd
Bosmyrkollen 2, 4676 Kristiansand, NorwayTel.no.: 004738002500 Fax.no.: 004738002550
Firetech ASP.O.Box 275
4033 Forus, NorwayTel.no.: 004751816670 Fax.no.: 004751816671
Norfass Ltd.Telford Point, Telford Road, Basingstoke
Hants RG21 6XZ, EnglandTel.no.: 00441256355532 Fax.no.: 00441256816568
Hertek bvP.O.Box 7144
5605 JC Eindhoven, The NetherlandsTel.no.: 0031402661111 Fax.no.: 0031402661110
Eltek Energy ASP.O.Box 1500, 3007 Drammen
Gråterudvn. 8, 3036 Drammen, NorwayTel.no.: 004732203200 Fax.no.: 004732203210
Eltek (UK) Ltd.2 Maxted Road, Hemel Hempstead
Herts HP2 7DX, EnglandTel.no.: 00441442219355 Fax.no.: 00441442247194
Eltek Energy France S.A.Z.I. de Bastillac-Nord65000 Tarbes, France
Tel.no.: 0033562340930 Fax.no.: 0033562345869
S.F.E.E. S.ASociètè de Fabrications Electriques et Electroniques S.A
Z.I. de Bastillac-Nord65000 Tarbes, France
Tel.no.: 0033562340930 Fax.no.: 0033562345869
Eltek Energy Ltd.Rm. 812, Eight Comm. Tower
8 Sun Yip St, Chai Wan, Hong KongTel.no.: 0085228982689 Fax.no.: 0085228983189
Eltek Polska Sp.Z.ooUl Szczawiowà 53B, 70-010 Szczecin, Polan
Tel.no.: 004891825797 Fax.no.: 004891825786
Eltek SGS Pvt. Ltd.899 Udyog Vihar, Phasa 1,
Gurgaon 122016 (Haryana) 1, IndiaTel.no.: 0091124346996 Fax.no.: 0091124346996
Eltek Power Supplies PTE. Ltd.194 Pandan loop # 07-19
Pantech Industrial ComplexSingapore 128383, Singapore
Tel.no.: 00657732326 Fax.no.: 00657753602
Gertek Stromversorgungen GmbHP.O.Box 1135, Friedrich Luber strasse 31
D-90592 Schwarzenbruck, GermanyTel.no.: 00499128916486 Fax.no.: 00499128916487
Unitech ASP.O.Box 43
Billingstadsletta 90D, 1375 Billingstad, NorwayTel.no.: 004766980400 Fax.no.: 004766981440
Compower ASP.O.Box 2416 Solheimsviken, 5824 Bergen
Damsgaardsveien 59B, 5058 Bergen, NorwayTel.no.: 004755209050 Fax.no.: 004755209059
34

EltekEltek ASA
P.O.Box 1500, 3007 DrammenGråterudvn. 8, 3036 Drammen,
Norway
Tel.no: +47 32 20 32 00Fax.no.: +47 32 20 32 10
www.eltek.no

El tekAnnual Report 1998
Eltek
Eltek
• Table of Contents
• Overview
• Summary 1998
• Key figures
• Report of the Board of Directors
• Income Statement
• Balance Sheet
• Cash Flow Analysis
• Notes
• Shareholders Policy
Main menu HUGIN 1999. All rights reserved