Ella B. Allen Elementary School
12
2015-16 School Accountability Report Card for Ella B. Allen Elementary School Page 1 of 12 Ella B. Allen Elementary School 4300 Allen School Lane • Bonita, CA 91902-2309 • (619) 479-3662 • Grades K-6 Maria (Sisi) Garcia, Principal [email protected] 2015-16 School Accountability Report Card Published During the 2016-17 School Year ---- ---- Chula Vista Elementary School District 84 East J Street Chula Vista, CA 91910-6100 (619) 425-9600 www.cvesd.org District Governing Board Leslie Bunker Armando Farias Laurie Humphrey Eduardo Reyes, Ed.D. Francisco Tamayo District Administration Francisco Escobedo, Ed.D. Superintendent Jeffrey Thiel Assistant Superintendent, Human Resources Services and Support Oscar Esquivel Assistant Superintendent, Business Services and Support Matthew Tessier Assistant Superintendent, Innovation and Instruction Services and Support ---- ---- School Description Vision of Learning: The students of Ella B. Allen Elementary School are well-balanced citizens of an ever-changing global community. Allen students possess a continued focus on academic, social, and emotional learning. They are innovative, kind, compassionate, creative, collaborative, and self-aware citizens of the 21st century. Mission – All adults of the Allen Elementary School community work collaboratively to provide a safe and nurturing learning environment. The staff apply a deep understanding of the California Content Standards and provide rigorous and relevant learning experiences to engage and challenge all students. Additionally, the teaching staff integrate science, technology, math, and the arts across all content areas while providing the appropriate scaffolds and supports for every child to be a successful learner. The yearlong theme for 2016-17 is "Allen Eagles, together we are strong." All members of the Allen community will focus on strengths of students to promote growth and build on those strengths. Values – We value: kindness, respect, integrity, individuality, cooperation, creativity, responsibility, safety, focus, and diversity. Description Ella B. Allen Elementary is a kindergarten through sixth grade elementary school in the Chula Vista Elementary School District and serves a diverse student population of 392 students. We have 15 general education classrooms in kindergarten through sixth grade including a Resource Specialist and a Language, Speech, and Hearing program that supports 30 students with IEPs. Technology is vital to the academic success of our students. There is one technology lab on campus for whole group instruction on digital literacy and digital citizenship. Each of the 15 classrooms has a variety of technology devices including Lenovo Thinkpads, Asus tablets, iPads, and MacBook Pro laptop for the teacher. Kindergarten, first and second grade classes have a combination of laptops and desktops for students to access. Additionally, Grades 3rd through 6th are integrating the 48 Asus tablets and 108 Lenovo ThinkPads daily in all curricular areas. Each classroom has a 65 inch screen TV that is connected to Apple TV, Screen Beam, and a document camera to project from the teacher's laptop. There are also projectors in the library and the auditorium for group events and meetings. There are 15 iPads and 30 iPad Mini's used by students in classrooms, Resource Specialist's, and Visual And Performing Arts classes. Students use these devices to work on the 21st century skills of collaboration, communication, creativity, and critical thinking skills to create multimedia/visual and performing arts projects or other projects related tho the California Content Standards. The integration of technology in all academic areas is an expectation of every teacher and staff member. During the 2016-17 school year, Visual and Performing Arts teachers will provide VAPA instruction in a variety of disciplines including Music, Visual Arts, and Digital Arts. Despite the changes to the previous art program at Allen, every adult is committed to looking to the future to insure each child has access to visual and performing arts, technology, science, literacy, and math instruction integrated and connected with California Content Standards to promote a well balanced educational program.
Transcript of Ella B. Allen Elementary School

2015-16 School Accountability Report Card for Ella B. Allen Elementary School Page 1 of 12
Ella B. Allen Elementary School
4300 Allen School Lane • Bonita, CA 91902-2309 • (619) 479-3662 • Grades K-6 Maria (Sisi) Garcia, Principal
2015-16 School Accountability Report Card
Published During the 2016-17 School Year
--------
Chula Vista Elementary School District
84 East J Street Chula Vista, CA 91910-6100
(619) 425-9600 www.cvesd.org
District Governing Board
Leslie Bunker
Armando Farias
Laurie Humphrey
Eduardo Reyes, Ed.D.
Francisco Tamayo
District Administration
Francisco Escobedo, Ed.D. Superintendent
Jeffrey Thiel Assistant Superintendent, Human Resources Services and Support
Oscar Esquivel Assistant Superintendent, Business
Services and Support
Matthew Tessier Assistant Superintendent, Innovation and Instruction Services and Support
---- ----
School Description Vision of Learning: The students of Ella B. Allen Elementary School are well-balanced citizens of an ever-changing global community. Allen students possess a continued focus on academic, social, and emotional learning. They are innovative, kind, compassionate, creative, collaborative, and self-aware citizens of the 21st century. Mission – All adults of the Allen Elementary School community work collaboratively to provide a safe and nurturing learning environment. The staff apply a deep understanding of the California Content Standards and provide rigorous and relevant learning experiences to engage and challenge all students. Additionally, the teaching staff integrate science, technology, math, and the arts across all content areas while providing the appropriate scaffolds and supports for every child to be a successful learner. The yearlong theme for 2016-17 is "Allen Eagles, together we are strong." All members of the Allen community will focus on strengths of students to promote growth and build on those strengths. Values – We value: kindness, respect, integrity, individuality, cooperation, creativity, responsibility, safety, focus, and diversity.
Description Ella B. Allen Elementary is a kindergarten through sixth grade elementary school in the Chula Vista Elementary School District and serves a diverse student population of 392 students. We have 15 general education classrooms in kindergarten through sixth grade including a Resource Specialist and a Language, Speech, and Hearing program that supports 30 students with IEPs. Technology is vital to the academic success of our students. There is one technology lab on campus for whole group instruction on digital literacy and digital citizenship. Each of the 15 classrooms has a variety of technology devices including Lenovo Thinkpads, Asus tablets, iPads, and MacBook Pro laptop for the teacher. Kindergarten, first and second grade classes have a combination of laptops and desktops for students to access. Additionally, Grades 3rd through 6th are integrating the 48 Asus tablets and 108 Lenovo ThinkPads daily in all curricular areas. Each classroom has a 65 inch screen TV that is connected to Apple TV, Screen Beam, and a document camera to project from the teacher's laptop. There are also projectors in the library and the auditorium for group events and meetings. There are 15 iPads and 30 iPad Mini's used by students in classrooms, Resource Specialist's, and Visual And Performing Arts classes. Students use these devices to work on the 21st century skills of collaboration, communication, creativity, and critical thinking skills to create multimedia/visual and performing arts projects or other projects related tho the California Content Standards. The integration of technology in all academic areas is an expectation of every teacher and staff member. During the 2016-17 school year, Visual and Performing Arts teachers will provide VAPA instruction in a variety of disciplines including Music, Visual Arts, and Digital Arts. Despite the changes to the previous art program at Allen, every adult is committed to looking to the future to insure each child has access to visual and performing arts, technology, science, literacy, and math instruction integrated and connected with California Content Standards to promote a well balanced educational program.

2016-17 School Accountability Report Card for Ella B. Allen Elementary School Page 2 of 12
Allen Elementary is known as the “Home of the Allen Eagles” and continues to promote and support excellence throughout the various disciplines of study as well as through its character building program known as the “Allen Eagle Allstars”. The school has an active School Climate Committee and focuses on promoting the social, emotional, and self-regulation skills of every student. Students recite the school rules of be kind, be respectful, be responsible, and be safe each morning following the Pledge of Allegiance to remind themselves of the importance of taking care of themselves and others. Various activities and assemblies are scheduled throughout the year for students to develop character and make good choices to promote their learning. There are two outdoor gardens that are considered the heart of Allen School. During the modernization, the gardens were relocated to provide a space for a new building. This year, the seasonal vegetable garden and perennial garden continue to be a work in progress. A committee by students, parents, teachers, and community volunteers has been established and plans for a new garden are in the works. The perennial garden will be the first task as this is a campus center for thought and reflection. The Allen staff is in the process of developing science inquiry units of study centered around the seasonal vegetable garden and the perennial garden. Allen School serves a diverse population of learners consisting of 24% English Language Learners, 7.9% students with disabilities, 57% Hispanic/Latino, 28% White, 10% dispersed among African American, Asian and Filipino and 5% other. 31.6% of our students qualify for a free or reduced price lunch. The school qualifies for Title I funding as 40.5% of the student population are considered socioeconomically disadvantaged after the 2014-2015 school year. Full-time Certificated Staff:
* 15 general education teachers * 1 Resource Specialist * 1 District Resource Teacher * 1 Principal * 1 VAPA Resource Teacher
Part-time Certificated Staff:
* 1 Language, Speech, and Hearing Specialist * 1 Psychologist * 1 Registered Nurse + additional daily nurse support * 1 VAPA Resource Teacher
Full-time Classified Staff:
* 2 Instructional Assistants * 1 Secretary * 1 Attendance Health Secretary * 1 Student Attendant * 2 Custodians * 3 Child Nutrition Services employees
Part-time Classified Staff:
* 1 Technology Hardware Specialist * 1 Instructional Assistant for English Learners * 4 Noon Duty Supervisors * 1 Library Technology Technician
School Characteristics
* Rigorous, California Content Standards instructional programs in all grade levels * Formative and summative assessment data used to drive instruction * Self-contained classrooms * Fully-equipped technology lab * Response to Intervention Team of teachers and Special Education Staff (RTI) support for at-risk students based upon a
Response to Intervention (RtI) approach * Weekly student recognition for positive behavior * Quarterly awards assemblies for academic achievement and citizenship * Quarterly recognition for perfect attendance * Parent Participation through School Site Council, Parent-Teacher Club, English Language Acquisition Committee, GATE Parent
Committee, Parent Patrol * Extended Day sessions throughout the year * Onsite child care through YMCA and City of Chula Vista (DASH)
2015-16 School Accountability Report Card for Ella B. Allen Elementary School Page 3 of 12
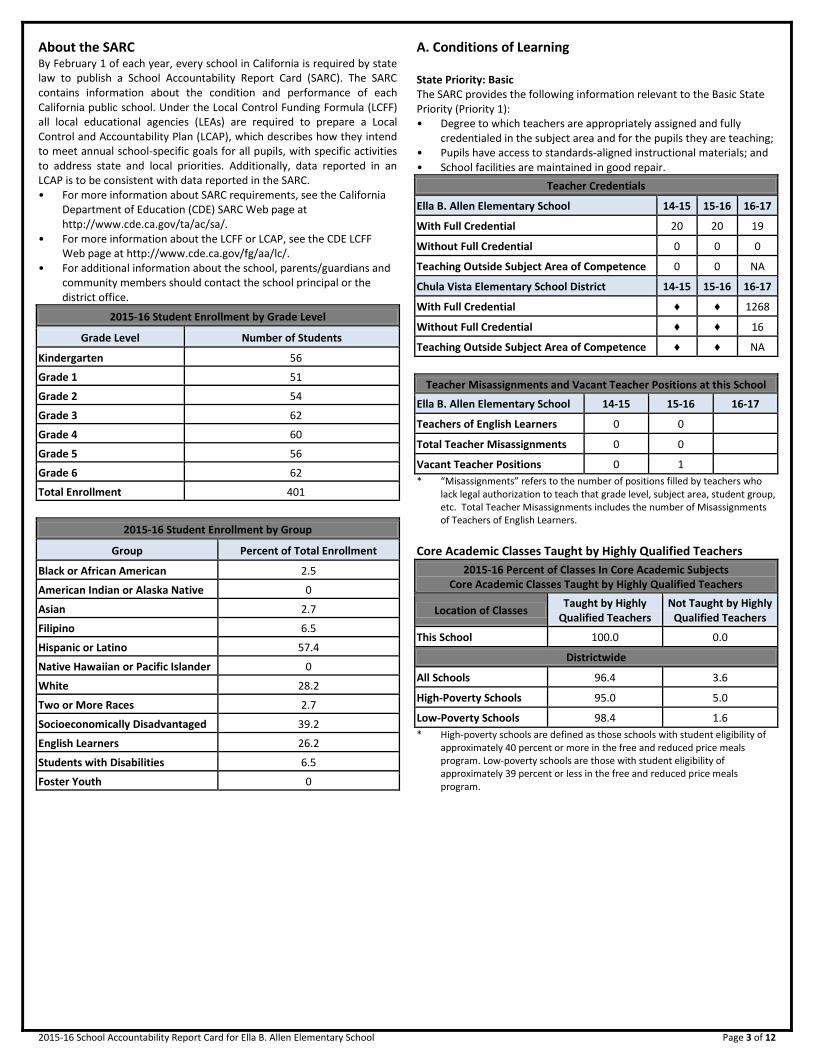
About the SARC By February 1 of each year, every school in California is required by state law to publish a School Accountability Report Card (SARC). The SARC contains information about the condition and performance of each California public school. Under the Local Control Funding Formula (LCFF) all local educational agencies (LEAs) are required to prepare a Local Control and Accountability Plan (LCAP), which describes how they intend to meet annual school-specific goals for all pupils, with specific activities to address state and local priorities. Additionally, data reported in an LCAP is to be consistent with data reported in the SARC. • For more information about SARC requirements, see the California
Department of Education (CDE) SARC Web page at http://www.cde.ca.gov/ta/ac/sa/.
• For more information about the LCFF or LCAP, see the CDE LCFF Web page at http://www.cde.ca.gov/fg/aa/lc/.
• For additional information about the school, parents/guardians and community members should contact the school principal or the district office.
2015-16 Student Enrollment by Grade Level
Grade Level Number of Students
Kindergarten 56
Grade 1 51
Grade 2 54
Grade 3 62
Grade 4 60
Grade 5 56
Grade 6 62
Total Enrollment 401
2015-16 Student Enrollment by Group
Group Percent of Total Enrollment
Black or African American 2.5
American Indian or Alaska Native 0
Asian 2.7
Filipino 6.5
Hispanic or Latino 57.4
Native Hawaiian or Pacific Islander 0
White 28.2
Two or More Races 2.7
Socioeconomically Disadvantaged 39.2
English Learners 26.2
Students with Disabilities 6.5
Foster Youth 0
A. Conditions of Learning State Priority: Basic The SARC provides the following information relevant to the Basic State Priority (Priority 1): • Degree to which teachers are appropriately assigned and fully
credentialed in the subject area and for the pupils they are teaching; • Pupils have access to standards-aligned instructional materials; and • School facilities are maintained in good repair.
Teacher Credentials
Ella B. Allen Elementary School 14-15 15-16 16-17
With Full Credential 20 20 19
Without Full Credential 0 0 0
Teaching Outside Subject Area of Competence 0 0 NA
Chula Vista Elementary School District 14-15 15-16 16-17
With Full Credential ♦ ♦ 1268
Without Full Credential ♦ ♦ 16
Teaching Outside Subject Area of Competence ♦ ♦ NA
Teacher Misassignments and Vacant Teacher Positions at this School
Ella B. Allen Elementary School 14-15 15-16 16-17
Teachers of English Learners 0 0
Total Teacher Misassignments 0 0
Vacant Teacher Positions 0 1
* “Misassignments” refers to the number of positions filled by teachers who lack legal authorization to teach that grade level, subject area, student group, etc. Total Teacher Misassignments includes the number of Misassignments of Teachers of English Learners.
Core Academic Classes Taught by Highly Qualified Teachers
2015-16 Percent of Classes In Core Academic Subjects Core Academic Classes Taught by Highly Qualified Teachers
Location of Classes Taught by Highly
Qualified Teachers Not Taught by Highly
Qualified Teachers
This School 100.0 0.0
Districtwide
All Schools 96.4 3.6
High-Poverty Schools 95.0 5.0
Low-Poverty Schools 98.4 1.6
* High-poverty schools are defined as those schools with student eligibility of approximately 40 percent or more in the free and reduced price meals program. Low-poverty schools are those with student eligibility of approximately 39 percent or less in the free and reduced price meals program.

2015-16 School Accountability Report Card for Ella B. Allen Elementary School Page 4 of 12
Quality, Currency, Availability of Textbooks and Instructional Materials (School Year 2016-17) The Chula Vista Elementary School District follows the State’s curriculum cycle to adopt updated, high quality textbooks and related materials. The evaluation and adoption of textbooks and instructional materials is based on recommendations by committees of our District’s school staffs and community members. Students are provided with an adequate supply of Board-approved textbooks for all subject areas. The reading/language arts and mathematics curricula are aligned with California Common Core Standards.. All of our students have access to textbooks and supportive instructional materials in all core subjects, which are in good condition. Core materials are available in both English and Spanish. An inventory of books is warehoused centrally for growth needs at the schools. The District’s vision is to prepare students to succeed in the 21st Century and is committed to providing students with 21st century tools, and the necessary infrastructure to support said tools. The District also invested in software applications to assist with formative and summative assessments, literacy skills, mathematics and language acquisition. In addition, teachers are integrating technology tools to facilitate day to day tasks such as attendance, report cards and electronic communication.
Textbooks and Instructional Materials
Year and month in which data were collected: June 2015
Core Curriculum Area Textbooks and Instructional Materials/Year of Adoption
Reading/Language Arts Houghton Mifflin Reading K-6 and Houghton Mifflin Lectura K-6 Spanish. Adopted in 2002-03.
The textbooks listed are from most recent adoption: Yes
Percent of students lacking their own assigned textbook: 0%
Mathematics Mc Graw Hill Mathematics K-6, English and Spanish. Adopted in 2001-02.
The textbooks listed are from most recent adoption: Yes
Percent of students lacking their own assigned textbook: 0%
Science Houghton-Mifflin Science series for Kindergarten to Sixth Grade English and Spanish. Adopted Spring 2008.
The textbooks listed are from most recent adoption: Yes
Percent of students lacking their own assigned textbook: 0%
History-Social Science Harcourt Social Studies Kindergarten – Sixth grade (English & Spanish). Adopted Spring 2007.
The textbooks listed are from most recent adoption: Yes
Percent of students lacking their own assigned textbook: 0%
School Facility Conditions and Planned Improvements (Most Recent Year) Classroom space at Allen Elementary School is adequate to support our school's current enrollment. The District maintains a planned program, which ensures routine maintenance functions are performed on a scheduled basis. Allen custodial staff performs basic cleaning operations daily. A modernization of the facility occurred during the summer of 2015. This modernization included upgrades to electrical, plumbing, HVAC, and wireless broadband connectivity. Additionally, each of the classrooms was modernized with new carpet, bulletin boards, furniture, TVs, LED lighting, and energy efficient windows. The modernization is funded by the school bond Proposition E. The school plant includes four main wings, an auditorium building, a visual and performing arts room, a school library, and a separate building housing five additional classrooms. A security system monitors the school after school hours and on the weekends. Each classroom on the Allen Elementary School campus is equipped with a telephone allowing intercommunication between administrators, the school office, and other teachers. Each wing of the school has one walkie-talkie available for communication should telephones become non-operational. Each Kindergarten through 2nd Grade classroom is equipped with a minimum of 6 desktop computers and 4 iPad Minis. Additionally, there are one-to-one devices purchased by LCAP funds in 3rd grade and 4th grade and 50 laptops for student use in the 5th, and 6th grade classrooms. Every teacher has an assigned laptop and there are wireless access points located throughout the campus. Learning is enhanced in the 5th and 6th grades through the use of 2 interactive Smart Boards. A variety of student activities and services are available on the school campus outside of the school day. These include

2015-16 School Accountability Report Card for Ella B. Allen Elementary School Page 5 of 12
• DASH (Dynamic After School Hours): a free two-hour after school program conducted by the City of Chula Vista Library and Recreation Department that provides structured activities for 1st through 6th grade children.
• Extended Day Learning offers additional academic support for students in grades K through 6. None of the eight emergency facilities needs specified in Education Code Section 17592.72 (c) (1) exist at our school.
School Facility Good Repair Status (Most Recent Year) Year and month in which data were collected: 5/24/2016
System Inspected Repair Status Repair Needed and
Action Taken or Planned Good Fair Poor
Systems: Gas Leaks, Mechanical/HVAC, Sewer
X
Interior: Interior Surfaces
X 301 CR: sink cabinet door - laminate peeling off - sharp edges 303 CR: sink cabinet counter chipped - sharp edge; fountain low; 1 household cleaner - goo gone 401 CR Comp. Lab: sink cabinet door - laminate peeling off on top Kinder Play Toy: cement at electrical room - corner needs patching - trip hazard
Cleanliness: Overall Cleanliness, Pest/ Vermin Infestation
X 501 CR: wall vent dirty 502 CR: wall vent dirty 503 CR: wall vent dirty 504 CR: wall vent dirty 701 Creativity Lab: floor needs attention Play Toy outside 400 Bldg.: paint peeling; cobwebs Storage: stained ceiling tile
Electrical: Electrical
X 101 Kinder: work room - electrical panel blocked 302 CR: electrical panel blocked
Restrooms/Fountains: Restrooms, Sinks/ Fountains
X 102 Kinder: fountain low 303 CR: sink cabinet counter chipped - sharp edge; fountain low; 1 household cleaner - goo gone
Safety: Fire Safety, Hazardous Materials
X 303 CR: sink cabinet counter chipped - sharp edge; fountain low; 1 household cleaner - goo gone 405 CR: 1 unmarked spray bottle
Structural: Structural Damage, Roofs
X
External: Playground/School Grounds, Windows/ Doors/Gates/Fences
X 402 CR: outside - large crevice
Overall Rating Exemplary Good Fair Poor
---------- X

2015-16 School Accountability Report Card for Ella B. Allen Elementary School Page 6 of 12
B. Pupil Outcomes
State Priority: Pupil Achievement The SARC provides the following information relevant to the State priority: Pupil Achievement (Priority 4): • Statewide assessments (i.e., California Assessment of Student
Performance and Progress [CAASPP] System, which includes the Smarter Balanced Summative Assessments for students in the general education population and the California Alternate Assessments [CAAs] for English language arts/literacy [ELA] and mathematics given in grades three through eight and grade eleven. The CAAs have replaced the California Alternate Performance Assessment [CAPA] for ELA and mathematics, which were eliminated in 2015. Only eligible students may participate in the administration of the CAAs. CAA items are aligned with alternate achievement standards, which are linked with the Common Core State Standards [CCSS] for students with significant cognitive disabilities); and
• The percentage of students who have successfully completed
courses that satisfy the requirements for entrance to the University of California and the California State University, or career technical education sequences or programs of study
2015-16 CAASPP Results for All Students
Subject
Percent of Students Meeting or Exceeding the State Standards (grades 3-8 and 11)
School District State
14-15 15-16 14-15 15-16 14-15 15-16
ELA 66 71 55 62 44 48
Math 56 57 43 48 34 36
* Percentages are not calculated when the number of students tested is ten or less, either because the number of students in this category is too small for statistical accuracy or to protect student privacy.
CAASPP Results for All Students - Three-Year Comparison
Subject
Percent of Students Scoring at Proficient or Advanced (meeting or exceeding the state standards)
School District State
13-14 14-15 15-16 13-14 14-15 15-16 13-14 14-15 15-16
Science 83 63 38 71 67 62 60 56 54
* Science test results include California Standards Tests (CSTs), California Modified Assessment (CMA), and California Alternate Performance Assessment (CAPA) in grades five, eight, and ten. Scores are not shown when the number of students tested is ten or less, either because the number of students in this category is too small for statistical accuracy or to protect student privacy.
Grade Level
2015-16 Percent of Students Meeting Fitness Standards
4 of 6 5 of 6 6 of 6
---5--- 15.8 28.1 33.3
* Percentages are not calculated when the number of students tested is ten or less, either because the number of students in this category is too small for statistical accuracy or to protect student privacy.
2015-16 CAASPP Results by Student Group
Science (grades 5, 8, and 10)
Group Number of Students Percent of Students
Enrolled with Valid Scores w/ Valid Scores Proficient or Advanced
All Students 154 153 99.4 37.9
Male 80 79 98.8 32.9
Female 74 74 100.0 43.2
Hispanic or Latino 123 122 99.2 32.8
White 18 18 100.0 61.1
Socioeconomically Disadvantaged 111 111 100.0 27.9
English Learners 61 61 100.0 6.6
Students with Disabilities 24 23 95.8 30.4
* Science test results include CSTs, CMA, and CAPA in grades five, eight, and ten. The “Proficient or Advanced” is calculated by taking the total number of students who scored at Proficient or Advanced on the science assessment divided by the total number of students with valid scores. Scores are not shown when the number of students tested is ten or less, either because the number of students in this category is too small for statistical accuracy or to protect student privacy.

2015-16 School Accountability Report Card for Ella B. Allen Elementary School Page 7 of 12
School Year 2015-16 CAASPP Assessment Results - English Language Arts (ELA) Disaggregated by Student Groups, Grades Three through Eight and Eleven
Student Group Grade
Number of Students Percent of Students
Enrolled Tested Tested Standard Met or
Exceeded
All Students 3 62 56 90.3 76.8
4 63 60 95.2 56.7
5 59 57 96.6 71.4
6 61 61 100.0 78.7
Male 3 31 27 87.1 77.8
4 27 26 96.3 50.0
5 31 30 96.8 60.0
6 27 27 100.0 74.1
Female 3 31 29 93.5 75.9
4 36 34 94.4 61.8
5 28 27 96.4 84.6
6 34 34 100.0 82.3
Black or African American 4 -- -- -- --
6 -- -- -- --
Asian 6 -- -- -- --
Filipino 3 -- -- -- --
4 -- -- -- --
5 -- -- -- --
6 -- -- -- --
Hispanic or Latino 3 38 32 84.2 71.9
4 38 35 92.1 54.3
5 39 37 94.9 63.9
6 32 32 100.0 68.8
White 3 16 16 100.0 87.5
4 20 20 100.0 60.0
5 14 14 100.0 78.6
6 16 16 100.0 93.8
Two or More Races 3 -- -- -- --
4 -- -- -- --
5 -- -- -- --
6 -- -- -- --
Socioeconomically Disadvantaged 3 29 26 89.7 73.1
4 28 26 92.9 46.1
5 22 20 90.9 60.0
6 26 26 100.0 61.5

2015-16 School Accountability Report Card for Ella B. Allen Elementary School Page 8 of 12
School Year 2015-16 CAASPP Assessment Results - English Language Arts (ELA) Disaggregated by Student Groups, Grades Three through Eight and Eleven
Student Group Grade
Number of Students Percent of Students
Enrolled Tested Tested Standard Met or
Exceeded
English Learners 3 15 10 66.7 50.0
4 14 11 78.6 27.3
5 -- -- -- --
6 -- -- -- --
Students with Disabilities 3 -- -- -- --
4 -- -- -- --
5 -- -- -- --
Foster Youth 3 -- -- -- --
4 -- -- -- --
5 -- -- -- --
6 -- -- -- --
ELA test results include the Smarter Balanced Summative Assessment and the CAA. The “Percent Met or Exceeded” is calculated by taking the total number of students who met or exceeded the standard on the Smarter Balanced Summative Assessment plus the total number of students who met the standard on the CAAs divided by the total number of students who participated in both assessments. Double dashes (--) appear in the table when the number of students is ten or less, either because the number of students in this category is too small for statistical accuracy or to protect student privacy. The number of students tested includes all students who participated in the test whether they received a score or not; however, the number of students tested is not the number that was used to calculate the achievement level percentages. The achievement level percentages are calculated using only students who received scores.
School Year 2015-16 CAASPP Assessment Results - Mathematics Disaggregated by Student Groups, Grades Three through Eight and Eleven
Student Group Grade
Number of Students Percent of Students
Enrolled Tested Tested Standard Met or
Exceeded
All Students 3 62 58 93.5 67.2
4 63 62 98.4 50.0
5 59 57 96.6 42.1
6 61 61 100.0 68.8
Male 3 31 28 90.3 67.9
4 27 27 100.0 48.1
5 31 30 96.8 46.7
6 27 27 100.0 63.0
Female 3 31 30 96.8 66.7
4 36 35 97.2 51.4
5 28 27 96.4 37.0
6 34 34 100.0 73.5
Black or African American 4 -- -- -- --
6 -- -- -- --
Asian 6 -- -- -- --

2015-16 School Accountability Report Card for Ella B. Allen Elementary School Page 9 of 12
School Year 2015-16 CAASPP Assessment Results - Mathematics Disaggregated by Student Groups, Grades Three through Eight and Eleven
Student Group Grade
Number of Students Percent of Students
Enrolled Tested Tested Standard Met or
Exceeded
Filipino 3 -- -- -- --
4 -- -- -- --
5 -- -- -- --
6 -- -- -- --
Hispanic or Latino 3 38 34 89.5 67.7
4 38 37 97.4 51.4
5 39 37 94.9 29.7
6 32 32 100.0 59.4
White 3 16 16 100.0 68.8
4 20 20 100.0 45.0
5 14 14 100.0 57.1
6 16 16 100.0 81.3
Two or More Races 3 -- -- -- --
4 -- -- -- --
5 -- -- -- --
6 -- -- -- --
Socioeconomically Disadvantaged 3 29 27 93.1 55.6
4 28 27 96.4 40.7
5 22 21 95.5 23.8
6 26 26 100.0 53.9
English Learners 3 15 12 80.0 41.7
4 14 13 92.9 15.4
5 -- -- -- --
6 -- -- -- --
Students with Disabilities 3 -- -- -- --
4 -- -- -- --
5 -- -- -- --
Foster Youth 3 -- -- -- --
4 -- -- -- --
5 -- -- -- --
6 -- -- -- --
Mathematics test results include the Smarter Balanced Summative Assessment and the CAA. The “Percent Met or Exceeded” is calculated by taking the total number of students who met or exceeded the standard on the Smarter Balanced Summative Assessment plus the total number of students who met the standard on the CAAs divided by the total number of students who participated in both assessments. Double dashes (--) appear in the table when the number of students is ten or less, either because the number of students in this category is too small for statistical accuracy or to protect student privacy. The number of students tested includes all students who participated in the test whether they received a score or not; however, the number of students tested is not the number that was used to calculate the achievement level percentages. The achievement level percentages are calculated using only students who received scores.

2015-16 School Accountability Report Card for Ella B. Allen Elementary School Page 10 of 12
C. Engagement
State Priority: Parental Involvement The SARC provides the following information relevant to the Parental Involvement State Priority (Priority 3): • Efforts the school district makes to seek parent input in making decisions for the school district and each schoolsite. Opportunities for Parental Involvement (School Year 2016-17) Contact person: Principal Maria E. Garcia Contact Person Phone Number: 619-479-3662 Research shows a high correlation between parent involvement and effective schools. We encourage parents to become actively involved in our school. We have Parent Information Nights to keep parents informed about assessment, curriculum and instruction and we provide parents with ways in which they can become partners with us in the education of their children. Additionally, Allen School collaborates with two other elementary schools in the Bonita area to provide parent trainings on English Language Development, Social/Emotional Learning, and Literacy. Allen Elementary has a very active Parent-Teacher Club (PTC) that sponsors and coordinates many activities such as Educational Assemblies, Book Fairs, Red Ribbon Week, Harvest Ball, Variety Show, Silent Auction, Yearbook, Parent Patrol, and Fundraisers. The PTC also provides funding for teacher mini-grants, computers/technology, disaster preparedness, study trips, technology and other projects for the benefit and welfare of Allen children and the community. The school has several active committees that oversee the various programs of the school which include School Site Council, Technology, and English Language Acquisition Committee (also known as the Bonita Valley Culture and Climate Committee).
State Priority: School Climate The SARC provides the following information relevant to the School Climate State Priority (Priority 6): • Pupil suspension rates; • Pupil expulsion rates; and • Other local measures on the sense of safety. School Safety Plan Student safety and well-being is promoted by activities including bus evacuation drills, playground supervision, drug and alcohol abuse prevention education programs, child abuse awareness, an anti-bullying program, Parent Patrol Program, consultation and collaboration with a district social worker, and School Safety Patrol. Established procedures are in place at Allen Elementary School to handle disasters such as fire, earthquakes, bomb threats and/or dangerous intruders. Disaster preparedness drills are conducted on a routine basis and we are continuing to improve upon our strategies to handle such emergencies. Students are not allowed to leave the school building and the grounds with anyone other than their parent or guardian, or a designated adult who is listed on the student's emergency card. Students must be signed out in the office by the parent or guardian prior to leaving the school grounds. Unfamiliar individuals will be required to show a picture identification to office personnel before the child can be released. Parents and guardians will be asked to wait in the office while school personnel call the child to the office. In an effort to promote the greatest safety possible, Allen Elementary is a closed campus. The Safety Plan was approved by School Site Council on October 11, 2016.
Suspensions and Expulsions
School 2013-14 2014-15 2015-16
Suspensions Rate 0.0 0.0 0.0
Expulsions Rate 0.0 0.0 0.0
District 2013-14 2014-15 2015-16
Suspensions Rate 0.8 0.7 0.6
Expulsions Rate 0.0 0.0 0.0
State 2013-14 2014-15 2015-16
Suspensions Rate 4.4 3.8 3.7
Expulsions Rate 0.1 0.1 0.1

2015-16 School Accountability Report Card for Ella B. Allen Elementary School Page 11 of 12
D. Other SARC Information
The information in this section is required to be in the SARC but is not included in the state priorities for LCFF.
2016-17 Federal Intervention Program
Indicator School District
Program Improvement Status Not in PI In PI
First Year of Program Improvement 2013-2014
Year in Program Improvement Year 1
Number of Schools Currently in Program Improvement 16
Percent of Schools Currently in Program Improvement 43.2
Academic Counselors and Other Support Staff at this School
Number of Full-Time Equivalent (FTE)
Academic Counselor-------
Counselor (Social/Behavioral or Career Development)
Library Media Teacher (Librarian)
Library Media Services Staff (Paraprofessional) 0.75
Psychologist------- 0.3
Social Worker-------
Nurse------- 1
Speech/Language/Hearing Specialist 0.4
Resource Specialist------- 1
Other-------
Average Number of Students per Staff Member
Academic Counselor------- * One Full Time Equivalent (FTE) equals one staff member working full time;
one FTE could also represent two staff members who each work 50 percent of full time.
Average Class Size and Class Size Distribution (Elementary)
Grade Average Class Size
Number of Classrooms*
1-20 21-32 33+
2013-14 2014-15 2015-16 2013-14 2014-15 2015-16 2013-14 2014-15 2015-16 2013-14 2014-15 2015-16
K
21 19 19 3 3 3
1
24 20 20 2 2 2
2
23 25 25 2 2 2
3
24 24 24 3 3 3
4
28 27 27 2 2 2
5
31 30 30 2 2 2
6
23 31 31 1 2 2 2
Other
7 2
Professional Development provided for Teachers Each year, targeted professional improvement activities are provided for teachers, instructional aides, and other employees. Activities reflect the school's goals and objectives and are part of our School Single Site Plan. Staff development topics for the next three academic year school years are aligned with District Multiple Measures, CAASPP assessment data, and CELDT/ELPAC data. This information, in conjunction with the Common Core State Standards, establishes a need for Systematic English Language Development, Writing Strategies within Text Types, and developing strategies for students to access and evaluate more complex text. Staff continues to receive training to enhance reading instruction, students' critical thinking skills, and conceptual development of mathematics. Students' speaking and listening skills are developed through designated English Language Development and planned academic discourse opportunities. Content mastery is determined through performance-based assessments and tasks. Professional development is conducted in a variety of ways, for example, after school workshops, grade level collaboration, vertical cross-grade level collaboration, individual mentoring of teachers, a professional learning cycle, support from the District Resource Teacher, and an observation-feedback cycle from the principal.
2015-16 School Accountability Report Card for Ella B. Allen Elementary School Page 12 of 12
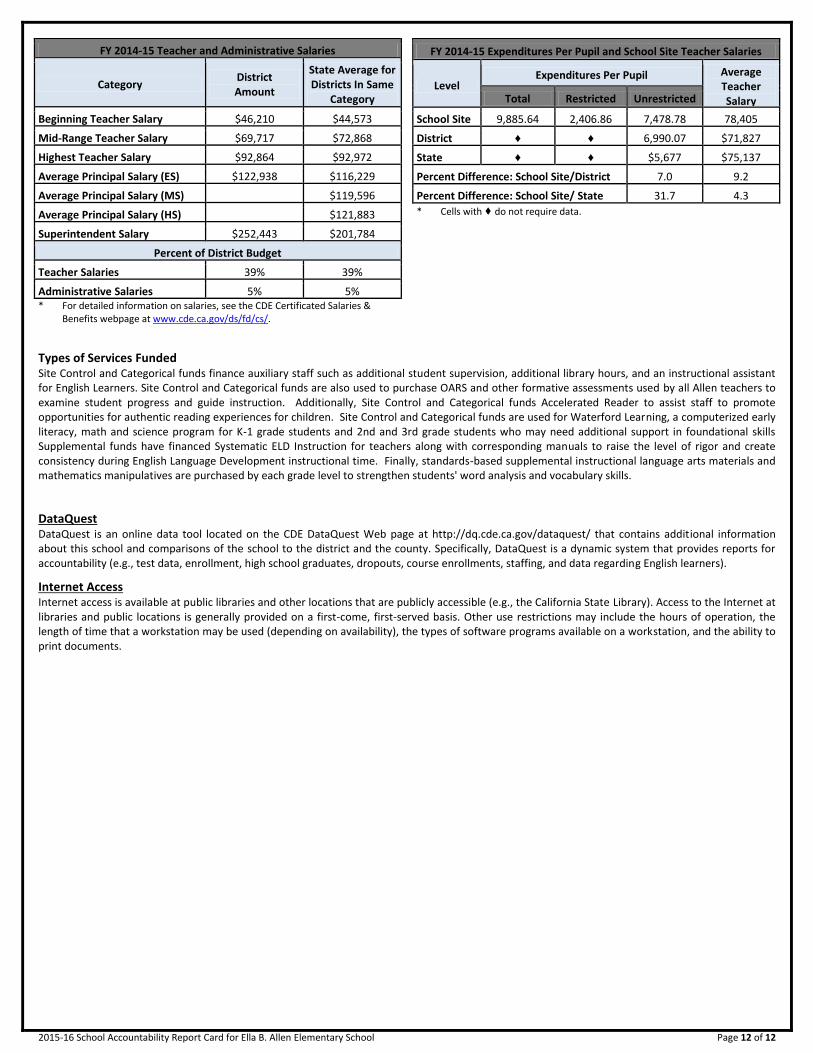
FY 2014-15 Teacher and Administrative Salaries
Category District Amount
State Average for Districts In Same
Category
Beginning Teacher Salary $46,210 $44,573
Mid-Range Teacher Salary $69,717 $72,868
Highest Teacher Salary $92,864 $92,972
Average Principal Salary (ES) $122,938 $116,229
Average Principal Salary (MS) $119,596
Average Principal Salary (HS) $121,883
Superintendent Salary $252,443 $201,784
Percent of District Budget
Teacher Salaries 39% 39%
Administrative Salaries 5% 5% * For detailed information on salaries, see the CDE Certificated Salaries &
Benefits webpage at www.cde.ca.gov/ds/fd/cs/.
FY 2014-15 Expenditures Per Pupil and School Site Teacher Salaries
Level Expenditures Per Pupil Average
Teacher Salary Total Restricted Unrestricted
School Site-------
9,885.64 2,406.86 7,478.78 78,405
District-------
♦ ♦ 6,990.07 $71,827
State------- ♦ ♦ $5,677 $75,137
Percent Difference: School Site/District 7.0 9.2
Percent Difference: School Site/ State 31.7 4.3
* Cells with ♦ do not require data.
Types of Services Funded
Site Control and Categorical funds finance auxiliary staff such as additional student supervision, additional library hours, and an instructional assistant for English Learners. Site Control and Categorical funds are also used to purchase OARS and other formative assessments used by all Allen teachers to examine student progress and guide instruction. Additionally, Site Control and Categorical funds Accelerated Reader to assist staff to promote opportunities for authentic reading experiences for children. Site Control and Categorical funds are used for Waterford Learning, a computerized early literacy, math and science program for K-1 grade students and 2nd and 3rd grade students who may need additional support in foundational skills Supplemental funds have financed Systematic ELD Instruction for teachers along with corresponding manuals to raise the level of rigor and create consistency during English Language Development instructional time. Finally, standards-based supplemental instructional language arts materials and mathematics manipulatives are purchased by each grade level to strengthen students' word analysis and vocabulary skills.
DataQuest DataQuest is an online data tool located on the CDE DataQuest Web page at http://dq.cde.ca.gov/dataquest/ that contains additional information about this school and comparisons of the school to the district and the county. Specifically, DataQuest is a dynamic system that provides reports for accountability (e.g., test data, enrollment, high school graduates, dropouts, course enrollments, staffing, and data regarding English learners).
Internet Access Internet access is available at public libraries and other locations that are publicly accessible (e.g., the California State Library). Access to the Internet at libraries and public locations is generally provided on a first-come, first-served basis. Other use restrictions may include the hours of operation, the length of time that a workstation may be used (depending on availability), the types of software programs available on a workstation, and the ability to print documents.