ELEG 454/654 Sensor and Data Wireless Networks Spring 2010.
60
ELEG 454/654 Sensor and Data Wireless Networks Spring 2010
-
date post
18-Dec-2015 -
Category
Documents
-
view
215 -
download
0
Transcript of ELEG 454/654 Sensor and Data Wireless Networks Spring 2010.

ELEG 454/654
Sensor and Data Wireless Networks
Spring 2010
Before anything happens
• Add / drop– Does anyone know of anyone who is dropping?– A few people can add! (Don’t tell anyone)
• Meeting time– One day a week?– Earlier in the day?

Basics
• Instructor: Stephan Bohacek• TA: none, but Vinay Sridhara will help with
Lab stuff.• Web page: http://www.eecis.udel/~bohacek
– But nothing is there yet.
• Textbook: none. A reader will be available soon.

Course Focus
• Introduction to sensor networks and wireless networks• Network protocols at various layers.
– MAC, routing, transport. (there is cross-over here with wired and other wireless)
• Application issues.– Data fusion, localization
• Analytical methods in networks– Optimization (routing, and power control)– Modeling (analysis of MAC)
• Unique issues: energy efficiency, self managing, data driven, arbitrarily large scale, etc.
• And everything

Prerequisites
• Basic networking– For example, you know
• what the transport layer does• what exponential back-off is• at least one MAC protocol• what flooding is and how it works
• Programming– For example, you can implement flooding.
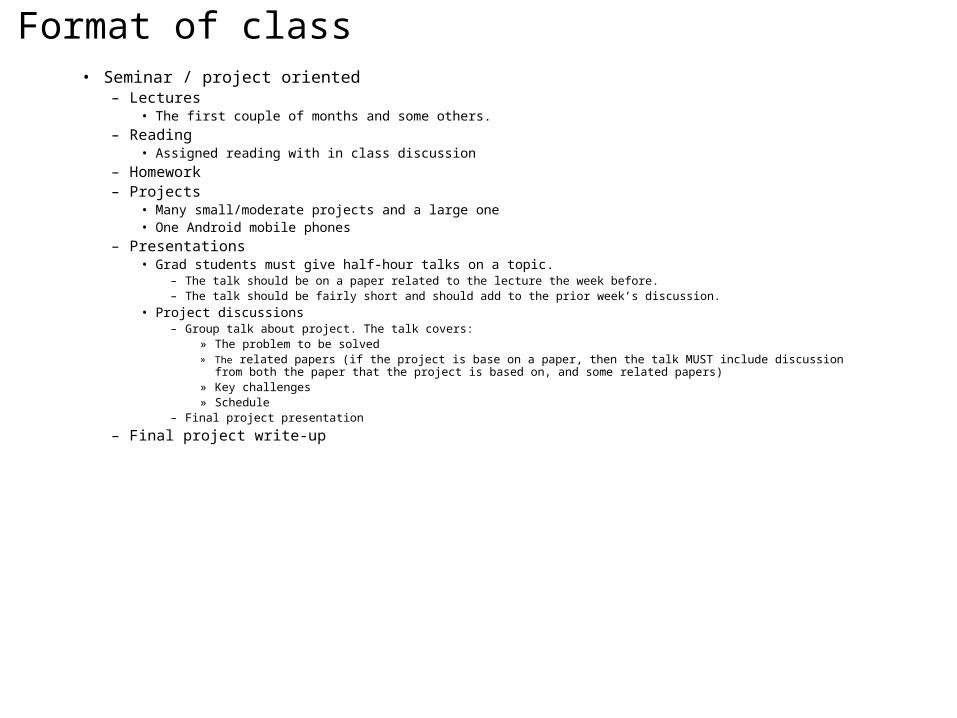
Format of class• Seminar / project oriented
– Lectures• The first couple of months and some others.
– Reading• Assigned reading with in class discussion
– Homework– Projects
• Many small/moderate projects and a large one• One Android mobile phones
– Presentations • Grad students must give half-hour talks on a topic.
– The talk should be on a paper related to the lecture the week before. – The talk should be fairly short and should add to the prior week’s discussion.
• Project discussions– Group talk about project. The talk covers:
» The problem to be solved» The related papers (if the project is base on a paper, then the talk MUST include discussion from both the paper that the
project is based on, and some related papers)» Key challenges» Schedule
– Final project presentation
– Final project write-up

Projects
• Project selection and presentation (by 3/30)– Projects may be related to grad student lecture topic
• Project progress report (4/20)
• Project presentation (5/20 and 5/25)

Grading
• Class discussion/reading (10%)• Small/moderate projects (30%)• Homework (10%)• Presentations (20%)• Final project (30%)

Reading material• Reader available from the web site and papers listed on web site.• Also:
– Wireless sensor networks. Editors: Ragavendra, Sivalingam, and Znati
– Wireless sensor networks. Feng Zhao and Leonidas Guibas
– Protocols and Architecture for Wireless Sensor Networks. Karl and Willig\
– Wireless Sensor Networks. Bulusu and Jha
– Topology control in wireless ad hoc and sensor networks. Santi
– Handbook of sensor networks: algorithms and architectures. Ed. Stojmenovic
– Ad Hoc wireless networks. Murthy and Manoj.
– Wireless Sensor Networks. Edgar and Callaway
– Handbook of sensor networks. Editors: Ilyas and Mahgoub

Topics (approximate)
• Overview of networks – this week
• Propagation of wireless signals
• Energy• MAC protocols• Routing• Transport
• Applications– Localization– Tracking– Time synchronization– Data
• Gathering
• Processing
• Compression
• Fusion
• Architecture

Today: Introduction to Sensor Networks
• Sensor networks.– Definition, motivation, examples
• Challenges.

What are sensor networks?
• Networks of devices that are able to sense the environment, perform on-board computation, (and communicate)
• Why? Because we can: Technology– Circuit integration
• Ability to integrate more functions into chips with lower energy
– Wireless communication• Better communication theory• Better devices• Bit-rates are slowly increasing• Transmission power is decreasing
– Sensor technology
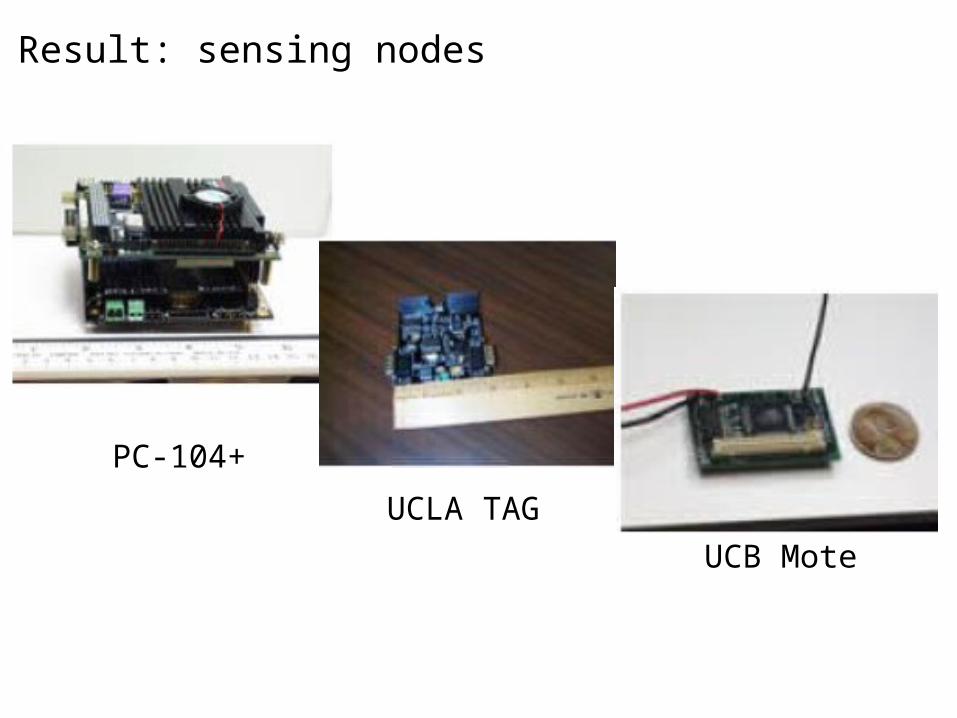
Result: sensing nodes
PC-104+
UCLA TAG
UCB Mote

Embedded Networked Sensing
• Micro-sensors,– on-board processing,– wireless interfaces – small scale and low cost => large numbers of sensor fields can be
deployed– monitor phenomena “up close”.
• Enables spatially and temporally dense monitoring– Nyquist Sampling – you must sample often enough (in time or
space)– Inverse problems are very difficult, e.g., by sensing the temperature
at a few places, determine the temperature everywhere (numerically unstable, i.e., errors are amplified). Instead, directly sense the temperature everywhere.
– Wireless interface allow little infrastructure – easy deployment– Wireless interface allow cooperation and distributed computing

Instability of an inverse problem
for T=1:.25:10 G=zeros(21,21); for i=-10:10 G(i+11,:) = normpdf([-10:10]-i,0,T); end u0=sin([-10:10]/10*pi)'; %rand(21,1); u2=G*u0; u0hat = inv(G)*u2; u0NoiseEst = inv(G)*(u2+rand(size(u2))*.01); figure(1) clf plot(u0) hold on plot(u2,'g') plot(u0hat,'r') legend('original','observed','inverse') axis([0,21,-1,1]); title(sprintf('Inverse problem at %.2f ',T)) T pauseend
Contaminate sources Air sensors
Objective: use the sensors to determine the source of the contaminate.
Assume that the density at (x,y) isx
y
Wind direction
where U is the flow into the environment at the source
Solution: put the sensor near to the source
x,y
gx s,y 0,yds
gx,y 1
2 x2exp 1
2 yx
2
T, : G 0, :

Vision
Embed numeroussensing nodes tomonitor and interactwith physical world
Network these devicesso that they canexecute more complex tasks.
Note that these two problems are very different. Different scales and different requirements. It is difficult to lump them into a single “sensors” group.

Sensor networks applications…

Vision: “Embed the World”
• Buildings self-detect and self-correct from structural faults (e.g., weld cracks).
• Schools detect airborne toxins at low concentrations, trace contaminant transport to source.
• Buoys alert swimmers to dangerous bacterial levels (or an excellent set of waves coming, brah).
• Earthquake-rubbled building infiltrated with robots and sensors: locate survivors, evaluate structural damage.
• Ecosystems infused with chemical, physical, acoustic, image sensors to track global change parameters.
• More??

Buoys along the east coast

Sensor to assist surfers!

Sensors are not always small…
• For example, Umass’s CASA (Collaborative Adaptive Sensing of the Atmosphere). Network of meteorological radars to observe, detect, and predict atmospheric phenomena.

Deployments
• Ecological Habitat Monitoring– UCB/Intel Berkeley: Great Duck Island– UCLA-CENS: James Reserve– Princeton: ZebraNet in Kenya
• Structural Monitoring– UCLA-CENS: Factor Building– USC: Networked SHM – UCB/Intel Berkeley: SF Golden Gate Bridge– UD
• Biomedical Applications– Artificial retina– “Bio-monitors”
• Industrial and Commercial Apps– Ember Corp: Thermal Process Control, Shipment Tracking– CCM

Environmental monitoring
• Petrel habitat on Great Duck Island in Maine.• Questions to answer:
– Usage pattern of nesting burrows over the 24-72 hour cycle.– Changes in the burrow and surface environmental
parameters.– Differences in the micro-environments with and without large
numbers of nesting petrels.

Hierarchical deployment

Sensors
• Mica platform– Atmel AVR w/ 512kB Flash– 916MHz 40kbps RFM Radio
• Range: max 100 ft• Affected by obstacles, RF propogation
– 2 AA Batteries, boost converter• Mica weather board – “one size fits all”
– Digital Sensor Interface to Mica• Onboard ADC sampling analog photo, humidity and passive IR sensors• Digital temperature and pressure sensors
– Designed for Low Power Operation• Individual digital switch for each sensor
– Designed to Coexist with Other Sensor Boards• Hardware “enable” protocol to obtain exclusive access to connector
resources
• Packaging– Conformal sealant + acrylic tube
– Placement– Place above ground and in burrows (propagation?)

Gateway
• Communicate with sensor and base station.• Solar powered (sensors are just battery
powered).• Directional antenna pointed toward base
station.

Base station
• Laptops
• In lighthouse keepers house.
• Log all data and transmit via satellite to D.C. and then on to the Internet.

Smart Dust
• Design goals– Cubic millimeter.– Very low energy.
• Result: sensor package containing:– Sensors– Optical transmitter (passive and active) and receiver– Signal processing– Solar power source

Smart dust applications
• Environmental monitoring.– Insects.– Meteorological phenomena.
• Special operations.

Smart dust components
1-2 mm
Thick-Film Battery
Solar Cell
Power Capacitor
Analog I/O, DSP, Control
Active Transmitter with Laser
Diode and Beam SteeringPassive Transmitter with
Corner-Cube Retroreflector
Sensors
Receiver with Photodetector

Smart dust: passive transmission
High power laser emitted from BS for downlink and uplink communication.
DownlinkLaser
Uplink
CCD Corner-Cube
Uplink
DataIn
Data
ImageSensor
Retroreflector
DataIn
Photo-
DownlinkDataOut
detector
Base-StationTransceiver
DustMote
Signal Selectionand Processing
UplinkData ...
OutNOut1
Array
UnmodulatedInterrogation
ModulatedReflected
ModulatedDownlinkDataor
BeamforUplink
BeamforUplink
Lens
Lens

Passive transmissions
• Reflect illuminating beam (from BS) back encoding data.• BS decodes data by reading the “on” and “off” reflections.• Rates of up to 1 kbps over 150m.• Low power sensor power• But, uninterrupted LoS with BS.• A single CCD can decode multiple communications at the
same time. – Each CCD element can “see” a small region of space. Each element
can decode one communication.– Spatial multiplexing.
• While smart dust was introduced several years ago, they are not yet feasible.

RFID
• Very low or no power identification• Very widely used
– Tolls (ez-pass)– Walmart– DoD– ..
• Since DoD and Wal-Mart require RFID, many supplies use RFID. However, Wal-Mart’s deployment has only been moderately successful.
• Energy method– Active RF ID (uses a battery)– Passive
• Electromagnetic Inductive Coupling– the current from the antenna is used to run a processor and send the signal– Driving the processor is not so hard, but transmitting the signal is difficult with such small power. – This approach only works to a meter (or less)
• Backscatter
• Because of energy issues, RFID misses cause problems

Backscatter Radio Links
• When an antenna receives the signal, current moves along the antenna.
• On the other hand, if current is moving along an antenna, the antenna is transmitting a signal.
• However, if the antenna is an open circuit, then no current can flow, and hence no transmission occurs.
• By controlling whether the antenna is an open or closed circuit, we can generate and not generate a transmitted signal.
Backscatter Radio Links
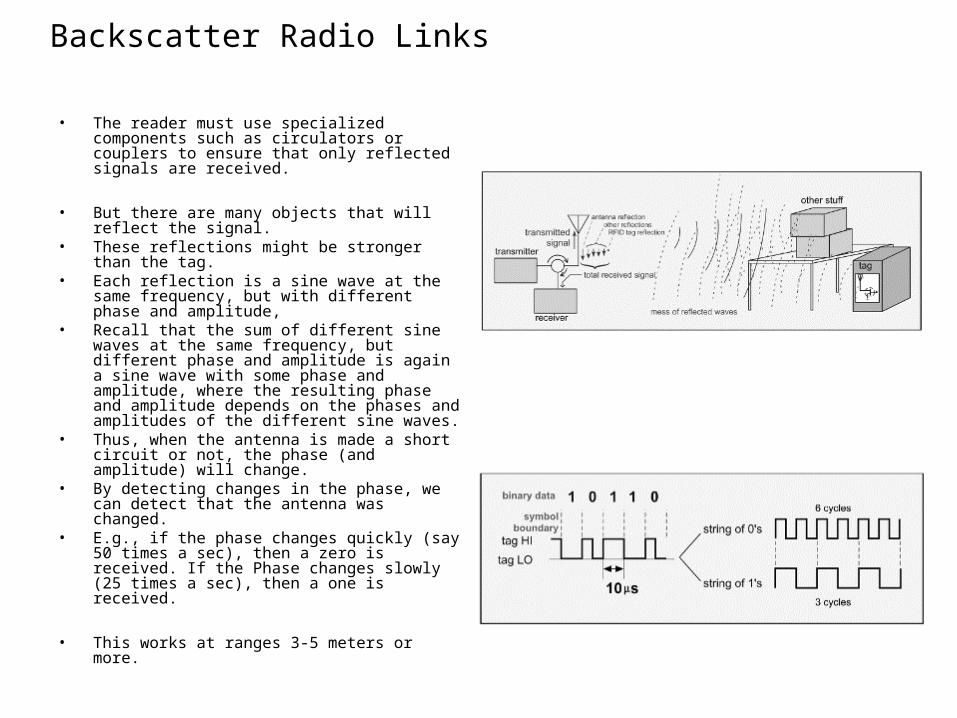
• The reader must use specialized components such as circulators or couplers to ensure that only reflected signals are received.
• But there are many objects that will reflect the signal.
• These reflections might be stronger than the tag.• Each reflection is a sine wave at the same
frequency, but with different phase and amplitude, • Recall that the sum of different sine waves at the
same frequency, but different phase and amplitude is again a sine wave with some phase and amplitude, where the resulting phase and amplitude depends on the phases and amplitudes of the different sine waves.
• Thus, when the antenna is made a short circuit or not, the phase (and amplitude) will change.
• By detecting changes in the phase, we can detect that the antenna was changed.
• E.g., if the phase changes quickly (say 50 times a sec), then a zero is received. If the Phase changes slowly (25 times a sec), then a one is received.
• This works at ranges 3-5 meters or more.
Biomedical applications
• Health monitors.– Glucose level.– Digestive system.– Vascular system, etc.
• Artificial retina.

Sensors for vision

Today: Introduction
• Sensor networks.– Definition, motivation, examples
• Challenges.

Challenges
• Energy• Self-configuring/adapting• Data processing• Scalability
Energy
• Sensors may require long life times– Great Duck Island required 9 months
– If embedded in highways, 10 years is required
– Pacemaker (not just a sensor!) last 5-10 years• (supervisory control and data acquisition (SCADA))

Energy
• Sensors may require long life times– Great Duck Island required 9 months– If embedded in highways, 10 years is required– Pacemaker (not just a sensor!) last 5-10 years
• (supervisory control and data acquisition (SCADA))
• Approaches– Low duty cycle systems.
• Sleep: deep sleep (everything off), listening but not transmitting, periodic listening
• Increases delay => impacts QoS
• Nodes must be synchronized– Requires good clocks (which require more power)– As battery power drops, clocks may experience severe drift, reducing effective lifetime

Energy
• Sensors may require long life times– Great Duck Island required 9 months
– If embedded in highways, 10 years is required
– Pacemaker (not just a sensor!) last 5-10 years• (supervisory control and data acquisition (SCADA))
• Approaches– Low duty cycle systems.
• Sleep: deep sleep (everything off), listening but not transmitting, periodic listening• Increases delay => impacts QoS• Nodes must by synchronized
– Requires good clocks (which require more power)– As battery power drops, clocks may experience severe drift, reducing effective lifetime
– Low bit-rate• Low power transmissions require low bit-rate
– Complicated communication schemes• Nodes can cooperate to transmit far with low power.• Advanced data compression• However, CPU uses power as well. But CPU power usage is decreasing as technology
advances.

Energy
• Sensors may require long life times– Great Duck Island required 9 months– If embedded in highways, 10 years is required– Pacemaker (not just a sensor!) last 5-10 years
• (supervisory control and data acquisition (SCADA))
• Approaches– Low duty cycle systems.
• Sleep: deep sleep (everything off), listening but not transmitting, periodic listening• Increases delay => impacts QoS• Nodes must by synchronized
– Requires good clocks (which require more power)– As battery power drops, clocks may experience severe drift, reducing effective lifetime
– Low bit-rate• Low power transmissions require low bit-rate
– Complicated communication schemes• Nodes can cooperate to transmit far with low power.• Advanced data compression• However, CPU uses power as well. But CPU power usage is decreasing as technology advances.
– Efficient protocols• Avoid retransmissions
– Avoid end-to-end retransmission with link layer retransmissions and data caching
• Avoid contention – FDM– TDM

Energy
• Approaches– Renewable power/scavenging.
– Solar energy.
– Mechanical vibrations (sneakers)
– Radio-Frequency inductance (RFID)
– Infrared inductance (passive optical)

Self-configuring/adapting
• Ad hoc deployment; inaccessible areas; – E.g, dropped from airplane
• Adapt to unpredictable environment.– E.g., nodes break, crash, run out of power (consider a deployment
where each node will last only a week, but nodes come out of hibernation at random times so the network has a lifetime of several months (see HW on next page))
• Unattended, untethered– There is no one to reboot …
• Fault tolerant and robust– approaches
• Each sensor operate autonomously from neighbors.• Overlapped services area.• No single point of failure.

Homework
• Suppose that there are N sensor.• Each sensor turns on at time t where t is a random
variable that is uniformly distributed between 0 and T.• Once on, the sensor will remain on for seconds.• Find N (as a function of T and ) such that at time
T/2, the average number of on sensors is M.• Hint:
– What is the probability that a particular sensor will be on at time T/2?
– Use binomial distribution

Challenges for embedded biomedical sensors:
• Limited capabilities: power, processing, storage, and communication.
• Continuous operation.• Robustness and fault tolerance.• Scalabilty.• Self-configuring, self-managing, self-healing.• Data-related issues.

Application-specific issues
• Material Constraints.– Bio-Compatibility.– Inconspicuous.
• Imitative of the environment.• Detect-proof: e.g. stealth flight.
• Security.– Privacy.– Interference.
• Regulatory issues– Such as FDA requirements.

Data processing
• Cooperation – Exploit computation near data to reduce communication.– Collaborative signal processing
• E.g., nearby images are combined to determine the exact location of an object. The position of the object is the data sent to the base station, not the images.
– Data aggregation/compression• If data is spatially correlated, then data can be aggregated and compressed,
taking advantage of correlation
• Limited computation and storage capabilities
• Error propagation – decrease fault tolerance– The more sensors a process uses, the lower the robustness but more
efficient.
• Complicated cooperation may require intensive communication.
• Heterogeneous power dissipation and lifetime– Nodes closer to base station must carry more data and are also in a better
position to aggregate data. But these will expend energy.
• Trade-off between latency and energy

Data processing• Distributed representation/storage• Data Centric Protocols, in-network processing:
– Interpretation of spatially distributed data (Per-node processing alone is not enough).
– Network performs in-network processing based on distribution of data.– Queries automatically directed towards nodes that maintain relevant/matching data.– Pattern-triggered data collection
• Multi-resolution data storage and retrieval.– E.g., many nodes hold general information, thus it is easy to get.– More detailed information requires contacting more nodes– Highly detailed information requires commutation with a large number of nodes.– If mostly low resolution data is required, then such a scheme is very useful
» low resolution = the enemy is crossing the border» Medium resolution = the enemy is in the north» High resolution = there is a enemy truck at the corner of Delaware and S. Chapel st.
• Distributed edge/feature detection.• Index data for easy temporal and spatial searching.• Finding global statistics (e.g., distribution).

Traditional approach: warehousing
• Data extracted from sensors, stored on server.
• Query processing takes place on server.
Sensor Database System
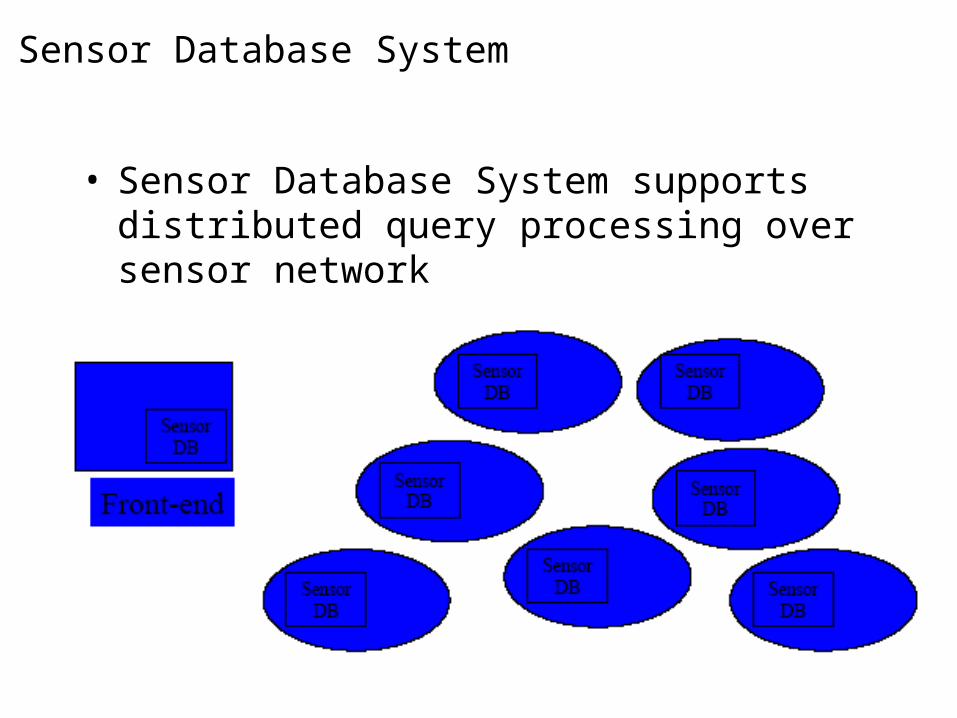
• Sensor Database System supports distributed query processing over sensor network

Sensor database system
• Characteristics of a sensor network:– Streams of data.– Large number of nodes– Multi-hop network.– No global knowledge
about the network.– Node failure and
interference is common.– Energy scarce.– Limited memory– No administration,
• Can existing database techniques be reused?
• What are the new problems and solutions?– Representing sensor data.– Representing sensor queries. – Processing query fragments
on sensor nodes.– Distributing query fragments.– Adapting to changing network
conditions. – Dealing with site and
communication failures.– Deploying and managing a
sensor database system.

Time and location
• Unlike the Internet, time and spatial location essential for some applications.– E.g., localization and time synchronization needed to detect
events, compare detections across nodes, perform collaborative processing, geo forwarding/routing, etc.
– GPS provides solution (with differential GPS providing finer granularity).
– GPS not always available.– Resolution is not very good (10’s of meters)– Other approaches?
• To correlate events, the time of the event must be known.• For coordinated sleeping, the sensors must be
synchronized.

Coverage
• Area coverage:fraction of area covered by sensors– Detectability: probability that
sensors detect moving objects
– Overlap: fraction of sensors covered by other sensors
– Control:• Where to add new nodes
for max coverage.• How to move existing
nodes for max coverage.

Why not Internet protocols?
• Traditional networks have hosts and routers.• Sensor nodes are both hosts and routers• Internet protocols were designed following an e2e approach.• For efficiency, need to use information from lower-layers.• Sensor networks are data-driven; end points don’t matter. • IP are bidirectional• Sensor networks are directional - Data flow and control flow• TCP/IP is wasteful, lazy convergence – it will work eventually• Sensor networks must be very thrifty - energy constraint issues • IP – the system admin is never very far away• Sensor network - Self-organization, self-management.• IP – local networks are fairly small• Sensor networks could contain of an arbitrarily large number of small
sensors generating data.

Today: Introduction
• Sensor networks.– Definition, motivation
• Challenges.

Sample layered architecture
Resource constraints call for more tightly integrated layers
Open Question:What are definingarchitecturalprinciples?