electrophoresis - bio-rad.com€¦ · electrophoresis, gels to be stained with Oriole stain were...
4
Oriole ™ Fluorescent Gel Stain: Characterization and Comparison with SYPRO Ruby Gel Stain Following staining, gels were transferred to water and photographed with the Molecular Imager ® VersaDoc ™ MP 4000 imaging system (Bio-Rad) using UV transillumination, a 520 nm LP filter, and a 10 sec exposure. Images were analyzed with Quantity One ® software (Bio-Rad). Gels used for evaluation of mass spectrometric protein identification were loaded with dilutions of broad range SDS-PAGE standards (960, 240, and 60 ng) and stained with either Oriole or SYPRO Ruby gel stains. Gel plugs were excised from each dilution of b-galactosidase, ovalbumin, and lysozyme using the EXQuest ™ spot cutter (Bio-Rad). Following excision, the gel plugs were treated with 20 μl of 5 μg/ml trypsin in 50 mM ammonium carbonate buffer, pH 8.0. Eluted peptides were cleaned up with ZipTip C18 pipette tips (Millipore) and spotted on a MALDI target prespotted with 2,5 dihydroxybenzoic acid matrix. Matrix-assisted laser desorption/ionization-time-of-flight mass spectrometry (MALDI-TOF MS) was performed using an autoflex II instrument and the data were analyzed using flex Analysis software (both from Bruker Daltonics). Staining Protocol Comparison The basic staining protocol for SYPRO Ruby stain consists of four steps and lasts overnight plus 90 min. Oriole stain uses a single step protocol that lasts 90 min (Table 1). Table 1. Basic staining protocols for SYPRO Ruby and Oriole gel stains. Step* SYPRO Ruby Gel Stain Oriole Gel Stain Fixing Fix 2 x 30 min (No fix step) (Total time: 1 hr) Staining Stain overnight Stain 90 min Destaining or washing Wash 30 min (No destain or wash step) * All steps were carried out at room temperature. Results and Discussion Fluorescence Spectra Oriole fluorescent stain has broad UV excitation with a maximum around 270 nm (Figure 1). It is thus optimally imaged using UV transillumination. UV transilluminator- based imaging systems typically use lamps that emit broad spectrum UV light centered around 300 nm, which is very compatible with the excitation properties of Oriole stain. Oriole stain is poorly excited by visible light (above 400 nm), so compatibility with imaging systems that use visible light for excitation is not expected. Tom Berkelman and John Walker II, Life Science Group, Bio-Rad Laboratories, Inc., 6000 James Watson Drive, Hercules, CA 94547 Introduction Fluorescent stains are widely used to visualize and quantitate proteins following SDS-PAGE due to their high sensitivity and wide dynamic range. Oriole fluorescent gel stain is a novel reagent for staining SDS-PAGE gels. It is applied in a simple one-step staining protocol, and is optimally imaged using UV transillumination. The ability to be imaged using UV light is a desirable feature because UV-based imaging equipment is relatively simple and inexpensive and tends to be more generally available to laboratory researchers. SYPRO Ruby protein gel stain is another commercial reagent for fluorescent staining of SDS-PAGE gels. It shares with Oriole stain the property of bright fluorescence when excited with UV light, but requires a more complicated and time consuming staining protocol. In this study, the performance of Oriole gel stain is characterized with respect to its spectral properties, detection sensitivity, protein-to-protein variability, and compatibility with mass spectrometry. These properties are evaluated relative to SYPRO Ruby stain. Methods Fluorescence spectra were generated with a Cary Eclipse fluorescence spectrophotometer (Varian, Inc.). Criterion ™ Tris-HCl, 18-well, 4–20% linear gradient gels (Bio-Rad Laboratories, Inc.) were used for SDS-PAGE. Gels were loaded with a dilution series of broad range SDS-PAGE standards (Bio-Rad). Dilutions were prepared to give the following sample load (for each individual protein) in a loading volume of 5 μl: 960 ng, 480 ng, 240 ng, 120 ng, 60 ng, 30 ng, 15 ng, 8 ng, 4 ng, 2 ng, 1 ng, 0.5 ng, 0.25 ng, 125 pg, and 60 pg. 2-D gels were run using 40 μg of E. coli total protein. First dimension was run on 11 cm pH 5–8 ReadyStrip ™ IPG strips (Bio-Rad). Second dimension was run on Criterion Tris-HCl 8–16% linear gradient SDS-PAGE gels. Following electrophoresis, gels to be stained with Oriole stain were stained for 1.5 hr (unless otherwise indicated) in 100 ml of staining solution. No fixing or destaining treatments were employed. Gels to be stained with SYPRO Ruby were stained according to manufacturer’s instructions. electrophoresis tech note 5921
Transcript of electrophoresis - bio-rad.com€¦ · electrophoresis, gels to be stained with Oriole stain were...
Oriole™ Fluorescent Gel Stain: Characterization and Comparison with SYPRO Ruby Gel Stain
Following staining, gels were transferred to water and photographed with the Molecular Imager® VersaDoc™ MP 4000 imaging system (Bio-Rad) using UV transillumination, a 520 nm LP filter, and a 10 sec exposure. Images were analyzed with Quantity One® software (Bio-Rad).
Gels used for evaluation of mass spectrometric protein identification were loaded with dilutions of broad range SDS-PAGE standards (960, 240, and 60 ng) and stained with either Oriole or SYPRO Ruby gel stains. Gel plugs were excised from each dilution of b-galactosidase, ovalbumin, and lysozyme using the EXQuest™ spot cutter (Bio-Rad). Following excision, the gel plugs were treated with 20 μl of 5 μg/ml trypsin in 50 mM ammonium carbonate buffer, pH 8.0. Eluted peptides were cleaned up with ZipTip C18 pipette tips (Millipore) and spotted on a MALDI target prespotted with 2,5 dihydroxybenzoic acid matrix. Matrix-assisted laser desorption/ionization-time-of-flight mass spectrometry (MALDI-TOF MS) was performed using an autoflex II instrument and the data were analyzed using flex Analysis software (both from Bruker Daltonics).
Staining Protocol Comparison
The basic staining protocol for SYPRO Ruby stain consists of four steps and lasts overnight plus 90 min. Oriole stain uses a single step protocol that lasts 90 min (Table 1).
Table 1. Basic staining protocols for SYPRO Ruby and Oriole gel stains.
Step* SYPRO Ruby Gel Stain Oriole Gel Stain
Fixing Fix 2 x 30 min (No fix step) (Total time: 1 hr)
Staining Stain overnight Stain 90 minDestaining or washing Wash 30 min (No destain or wash step)
* All steps were carried out at room temperature.
Results and DiscussionFluorescence Spectra
Oriole fluorescent stain has broad UV excitation with a maximum around 270 nm (Figure 1). It is thus optimally imaged using UV transillumination. UV transilluminator-based imaging systems typically use lamps that emit broad spectrum UV light centered around 300 nm, which is very compatible with the excitation properties of Oriole stain. Oriole stain is poorly excited by visible light (above 400 nm), so compatibility with imaging systems that use visible light for excitation is not expected.
Tom Berkelman and John Walker II, Life Science Group, Bio-Rad Laboratories, Inc., 6000 James Watson Drive, Hercules, CA 94547
IntroductionFluorescent stains are widely used to visualize and quantitate proteins following SDS-PAGE due to their high sensitivity and wide dynamic range. Oriole fluorescent gel stain is a novel reagent for staining SDS-PAGE gels. It is applied in a simple one-step staining protocol, and is optimally imaged using UV transillumination. The ability to be imaged using UV light is a desirable feature because UV-based imaging equipment is relatively simple and inexpensive and tends to be more generally available to laboratory researchers.
SYPRO Ruby protein gel stain is another commercial reagent for fluorescent staining of SDS-PAGE gels. It shares with Oriole stain the property of bright fluorescence when excited with UV light, but requires a more complicated and time consuming staining protocol. In this study, the performance of Oriole gel stain is characterized with respect to its spectral properties, detection sensitivity, protein-to-protein variability, and compatibility with mass spectrometry. These properties are evaluated relative to SYPRO Ruby stain.
MethodsFluorescence spectra were generated with a Cary Eclipse fluorescence spectrophotometer (Varian, Inc.). Criterion™ Tris-HCl, 18-well, 4–20% linear gradient gels (Bio-Rad Laboratories, Inc.) were used for SDS-PAGE. Gels were loaded with a dilution series of broad range SDS-PAGE standards (Bio-Rad). Dilutions were prepared to give the following sample load (for each individual protein) in a loading volume of 5 μl: 960 ng, 480 ng, 240 ng, 120 ng, 60 ng, 30 ng, 15 ng, 8 ng, 4 ng, 2 ng, 1 ng, 0.5 ng, 0.25 ng, 125 pg, and 60 pg. 2-D gels were run using 40 μg of E. coli total protein. First dimension was run on 11 cm pH 5–8 ReadyStrip™ IPG strips (Bio-Rad). Second dimension was run on Criterion Tris-HCl 8–16% linear gradient SDS-PAGE gels. Following electrophoresis, gels to be stained with Oriole stain were stained for 1.5 hr (unless otherwise indicated) in 100 ml of staining solution. No fixing or destaining treatments were employed. Gels to be stained with SYPRO Ruby were stained according to manufacturer’s instructions.
electrophoresis tech note 5921

© 2010 Bio-Rad Laboratories, Inc. Bulletin 5921
Fig. 3. Comparison of gels stained with Oriole and SYPRO Ruby stains. Unadjusted images of two identically loaded gels, stained with Oriole and SYPRO Ruby gel stains respectively. Both gels were imaged on a VersaDoc MP 4000 imaging system using UV transillumination, a 520 nm LP filter, and a 10 sec exposure.
Oriole Stain
SYPRO Ruby Stain
Fig. 2. Time course of staining. A single gel was stained with 100 ml of Oriole stain. The gel was imaged and returned to the staining solution at the indicated intervals from the commencement of staining.
7 min
30 min
90 min
300 min
15 min
60 min
150 min
Fig. 1. Fluorescence excitation and emission spectra of Oriole stain. Oriole stain has its excitation maximum at 270 nm and emission maximum at 604 nm, making it compatible with UV-based imagers. —, Excitation spectrum; —, Emission spectrum.
Fluo
resc
ence
, nor
mal
ized
120
100
80
60
40
20
0 200 300 400 500 600 700 800
Wavelength, nm
The fluorescence emission of Oriole stain is broad as well, covering most of the visible range with a maximum around 600 nm (Figure 1). The emission is visibly red-orange in color. There is practically no overlap between excitation and
emission, so low-background imaging is possible simply using a longpass filter that excludes UV light. Most of the emitted light is transmitted, allowing short exposures with high sensitivity.
Time Required for Optimal Staining
Staining with Oriole stain is complete within 90 minutes. Overstaining did not occur within 5 hours of staining (Figure 2).
Comparison to SYPRO Ruby StainAppearance of Stained Gels
The relative appearance, background, and sensitivity of gels stained with Oriole stain and SYPRO Ruby stain were evaluated using gels that were loaded, run, and imaged identically, and presented without adjusting or transforming the resulting images. A gel stained with Oriole stain and a gel stained with SYPRO Ruby stain gave images of comparable brightness (Figure 3). Standards bands are visible on both images out to the tenth or eleventh dilution (2 ng and 1 ng per band, respectively, on these gels). The gel stained with SYPRO Ruby stain showed visibly higher background staining than the gel stained with Oriole stain, but otherwise, the appearance of the two gel images is similar.
© 2010 Bio-Rad Laboratories, Inc. Bulletin 5921
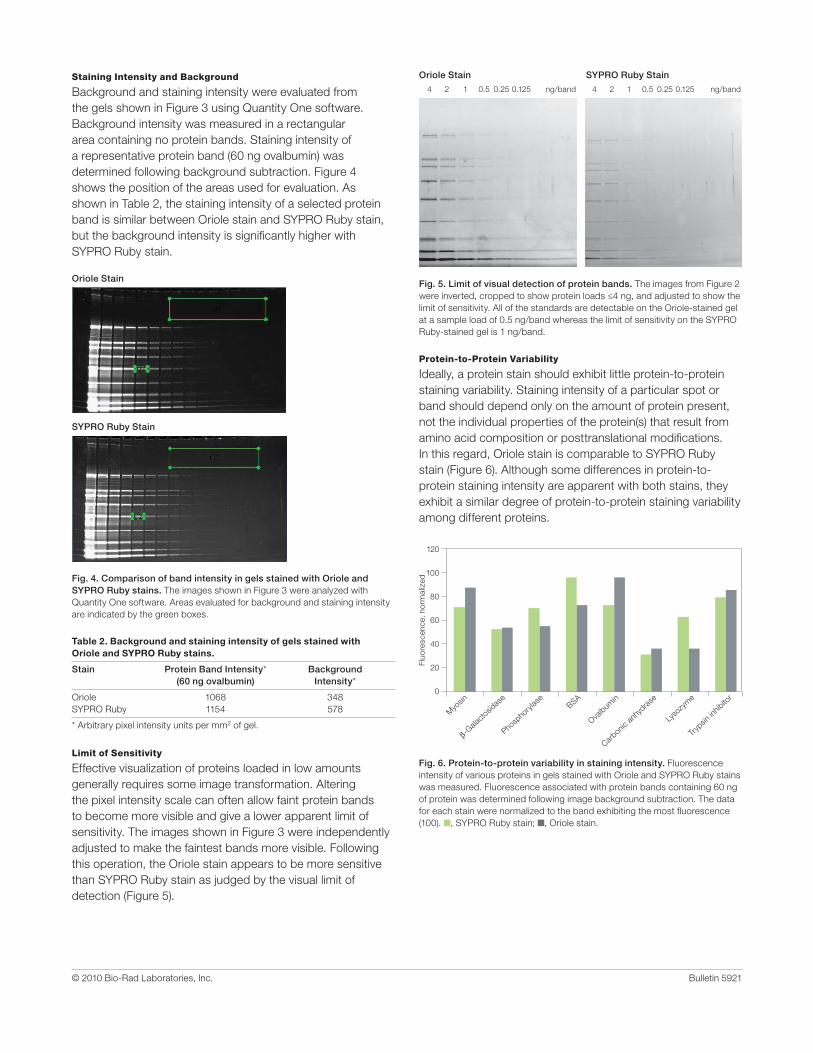
Fig. 4. Comparison of band intensity in gels stained with Oriole and SYPRO Ruby stains. The images shown in Figure 3 were analyzed with Quantity One software. Areas evaluated for background and staining intensity are indicated by the green boxes.
Fig. 5. Limit of visual detection of protein bands. The images from Figure 2 were inverted, cropped to show protein loads ≤4 ng, and adjusted to show the limit of sensitivity. All of the standards are detectable on the Oriole-stained gel at a sample load of 0.5 ng/band whereas the limit of sensitivity on the SYPRO Ruby-stained gel is 1 ng/band.
Oriole Stain
Oriole Stain
4 2 1 0.5 0.25 0.125 ng/band 4 2 1 0.5 0.25 0.125 ng/band
SYPRO Ruby Stain
SYPRO Ruby Stain
Myosin
b-Gala
ctosid
ase
Phosp
horyl
ase
BSA
Ovalbum
in
Carbonic
anhy
drase
Lyso
zyme
Tryp
sin in
hibito
r
120
100
80
60
40
20
0
Fig. 6. Protein-to-protein variability in staining intensity. Fluorescence intensity of various proteins in gels stained with Oriole and SYPRO Ruby stains was measured. Fluorescence associated with protein bands containing 60 ng of protein was determined following image background subtraction. The data for each stain were normalized to the band exhibiting the most fluorescence (100). n, SYPRO Ruby stain; n, Oriole stain.
Fluo
resc
ence
, nor
mal
ized
Staining Intensity and Background
Background and staining intensity were evaluated from the gels shown in Figure 3 using Quantity One software. Background intensity was measured in a rectangular area containing no protein bands. Staining intensity of a representative protein band (60 ng ovalbumin) was determined following background subtraction. Figure 4 shows the position of the areas used for evaluation. As shown in Table 2, the staining intensity of a selected protein band is similar between Oriole stain and SYPRO Ruby stain, but the background intensity is significantly higher with SYPRO Ruby stain.
Protein-to-Protein Variability
Ideally, a protein stain should exhibit little protein-to-protein staining variability. Staining intensity of a particular spot or band should depend only on the amount of protein present, not the individual properties of the protein(s) that result from amino acid composition or posttranslational modifications. In this regard, Oriole stain is comparable to SYPRO Ruby stain (Figure 6). Although some differences in protein-to-protein staining intensity are apparent with both stains, they exhibit a similar degree of protein-to-protein staining variability among different proteins.
Table 2. Background and staining intensity of gels stained with Oriole and SYPRO Ruby stains.
Stain Protein Band Intensity* Background (60 ng ovalbumin) Intensity*
Oriole 1068 348SYPRO Ruby 1154 578
* Arbitrary pixel intensity units per mm2 of gel.
Limit of Sensitivity
Effective visualization of proteins loaded in low amounts generally requires some image transformation. Altering the pixel intensity scale can often allow faint protein bands to become more visible and give a lower apparent limit of sensitivity. The images shown in Figure 3 were independently adjusted to make the faintest bands more visible. Following this operation, the Oriole stain appears to be more sensitive than SYPRO Ruby stain as judged by the visual limit of detection (Figure 5).
Life Science Group
09-0956 0110 Sig 1109Bulletin 5921 Rev A US/EG
Bio-Rad Laboratories, Inc.
Web site www.bio-rad.com USA 800 424 6723 Australia 61 2 9914 2800 Austria 01 877 89 01 Belgium 09 385 55 11 Brazil 55 31 3689 6600 Canada 905 364 3435 China 86 20 8732 2339 Czech Republic 420 241 430 532 Denmark 44 52 10 00 Finland 09 804 22 00 France 01 47 95 69 65 Germany 089 31 884 0 Greece 30 210 777 4396 Hong Kong 852 2789 3300 Hungary 36 1 459 6100 India 91 124 4029300 Israel 03 963 6050 Italy 39 02 216091 Japan 03 6361 7000 Korea 82 2 3473 4460 Mexico 52 555 488 7670 The Netherlands 0318 540666 New Zealand 0508 805 500 Norway 23 38 41 30 Poland 48 22 331 99 99 Portugal 351 21 472 7700 Russia 7 495 721 14 04 Singapore 65 6415 3188 South Africa 27 861 246 723 Spain 34 91 590 5200 Sweden 08 555 12700 Switzerland 061 717 95 55 Taiwan 886 2 2578 7189 United Kingdom 020 8328 2000
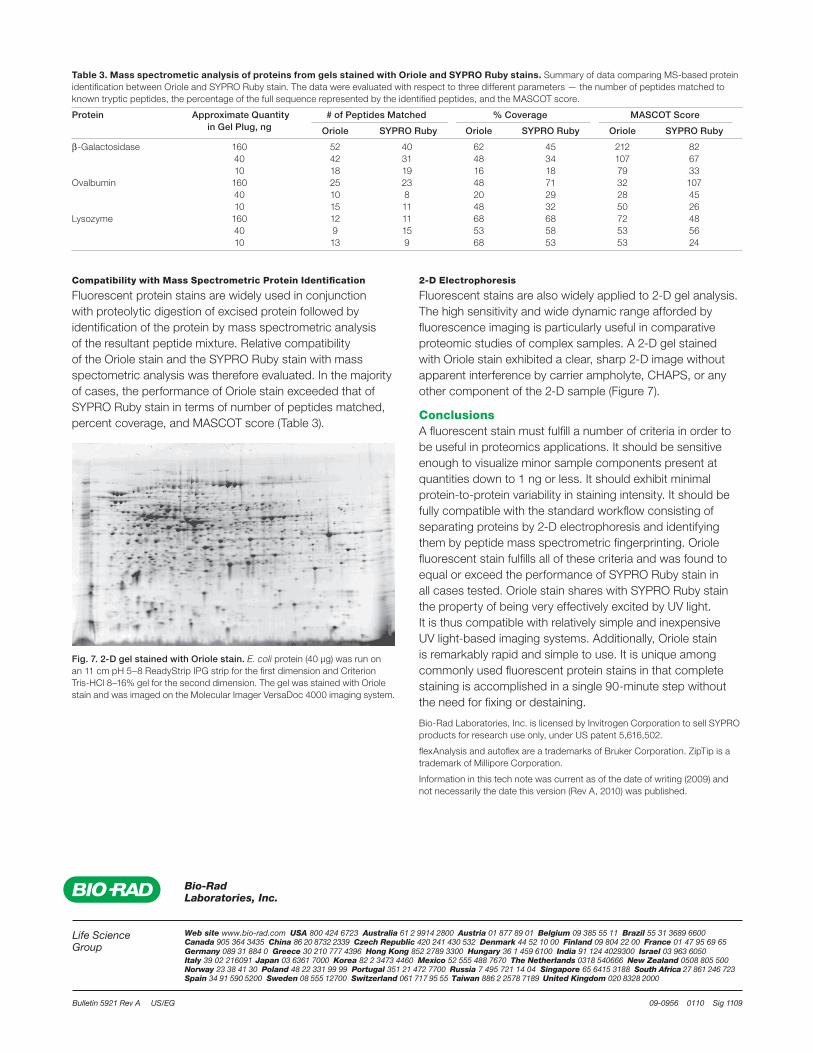
Fig. 7. 2-D gel stained with Oriole stain. E. coli protein (40 μg) was run on an 11 cm pH 5–8 ReadyStrip IPG strip for the first dimension and Criterion Tris-HCl 8–16% gel for the second dimension. The gel was stained with Oriole stain and was imaged on the Molecular Imager VersaDoc 4000 imaging system.
Compatibility with Mass Spectrometric Protein Identification
Fluorescent protein stains are widely used in conjunction with proteolytic digestion of excised protein followed by identification of the protein by mass spectrometric analysis of the resultant peptide mixture. Relative compatibility of the Oriole stain and the SYPRO Ruby stain with mass spectometric analysis was therefore evaluated. In the majority of cases, the performance of Oriole stain exceeded that of SYPRO Ruby stain in terms of number of peptides matched, percent coverage, and MASCOT score (Table 3).
2-D Electrophoresis
Fluorescent stains are also widely applied to 2-D gel analysis. The high sensitivity and wide dynamic range afforded by fluorescence imaging is particularly useful in comparative proteomic studies of complex samples. A 2-D gel stained with Oriole stain exhibited a clear, sharp 2-D image without apparent interference by carrier ampholyte, CHAPS, or any other component of the 2-D sample (Figure 7).
ConclusionsA fluorescent stain must fulfill a number of criteria in order to be useful in proteomics applications. It should be sensitive enough to visualize minor sample components present at quantities down to 1 ng or less. It should exhibit minimal protein-to-protein variability in staining intensity. It should be fully compatible with the standard workflow consisting of separating proteins by 2-D electrophoresis and identifying them by peptide mass spectrometric fingerprinting. Oriole fluorescent stain fulfills all of these criteria and was found to equal or exceed the performance of SYPRO Ruby stain in all cases tested. Oriole stain shares with SYPRO Ruby stain the property of being very effectively excited by UV light. It is thus compatible with relatively simple and inexpensive UV light-based imaging systems. Additionally, Oriole stain is remarkably rapid and simple to use. It is unique among commonly used fluorescent protein stains in that complete staining is accomplished in a single 90-minute step without the need for fixing or destaining.
Bio-Rad Laboratories, Inc. is licensed by Invitrogen Corporation to sell SYPRO products for research use only, under US patent 5,616,502.
flexAnalysis and autoflex are a trademarks of Bruker Corporation. ZipTip is a trademark of Millipore Corporation.
Information in this tech note was current as of the date of writing (2009) and not necessarily the date this version (Rev A, 2010) was published.
Table 3. Mass spectrometic analysis of proteins from gels stained with Oriole and SYPRO Ruby stains. Summary of data comparing MS-based protein identification between Oriole and SYPRO Ruby stain. The data were evaluated with respect to three different parameters — the number of peptides matched to known tryptic peptides, the percentage of the full sequence represented by the identified peptides, and the MASCOT score.
Protein Approximate Quantity # of Peptides Matched % Coverage MASCOT Score
in Gel Plug, ng Oriole SYPRO Ruby Oriole SYPRO Ruby Oriole SYPRO Ruby
b-Galactosidase 160 52 40 62 45 212 82 40 42 31 48 34 107 67 10 18 19 16 18 79 33Ovalbumin 160 25 23 48 71 32 107 40 10 8 20 29 28 45 10 15 11 48 32 50 26Lysozyme 160 12 11 68 68 72 48 40 9 15 53 58 53 56 10 13 9 68 53 53 24