ELECTRONIC WORD-OF-MOUTH, EXPERIENTIAL MARKETING, BRAND IMAGE, BRAND … volume JITBM/chih.pdf ·...
18
International Journal of Information Technology and Business Management 29 th June 2017. Vol.60 No.1 © 2012-2017 JITBM & ARF. All rights reserved ISSN 2304-0777 www.jitbm.com 1 ELECTRONIC WORD-OF-MOUTH, EXPERIENTIAL MARKETING, BRAND IMAGE, BRAND LOYALTY, AND PURCHASE INTENTION: A STUDY OF INNISFREE 1 Ying-Xuan Su, 2 Chih-Chao Lai, Ph.D, Advisor Dept. of Applied Foreign Languages, National Yunlin University of Science and Technology, Taiwan E-mail: [email protected] Abstract Owing to the impact of Korean drama and K-POP, Korean cosmetics in Taiwan are increasingly popular, also widely accepted by Taiwan consumers. With the increase in female consuming ability, the demand for cosmetics also increased, but how to attract consumers to buy their products cannot be ignored. In addition to through eWOM / WOM, experiential marketing, how to retain the original customers, attract new consumers, the design of the appropriate brand image, and raise the purchase intention are also important. In this study, I used an online questionnaire to survey and SPSS as a tool to analyze data, such as: descriptive statistics, reliability analysis, factor analysis, correlation analysis and regression analysis. The research aims to explore the relationship between eWOM, experiential marketing, brand image, brand loyalty, and purchase intention. Keywords: e-WOM, experiential marketing, brand image, brand loyalty, purchase intention INTRODUCTION Cosmetics have become indispensable to women in their daily life. In recent years, with the rise of Korean culture, Korean cosmetics industries have been expanding to the world, further expanding stores in Taiwan. Different to the Japanese, European and American brands, Korean cosmetics are more thoughtful on its packaging design, stimulating customers’ desire to buy. Innisfree is the naturalism cosmetics developed by AmorePacific Corp., a South Korean cosmetics company. Innisfree products is developed for urban women that desire for the characteristics of the future of cosmetics: natural, healthy, simple, and stylish. Internet has become an indispensable tool for people's lives, everyone almost cannot leave the Internet environment and space. The internet plays an important role in modern society, and people increasingly use the internet to get the information they need. With the increase in the number of online shopper, more and more shopping sites and comments easily make people hesitate to buy or not. Word-of-mouth (WOM) information has an overwhelming influence on consumers' purchasing decisions, communication through the computer as a communication medium is called Computer-Mediated Communication [1]. Computer-mediated communication has a nonlinear, non-synchronous, interactive, in addition, can break the time and space constraints and other
-
Upload
hoangduong -
Category
Documents
-
view
226 -
download
1
Transcript of ELECTRONIC WORD-OF-MOUTH, EXPERIENTIAL MARKETING, BRAND IMAGE, BRAND … volume JITBM/chih.pdf ·...
International Journal of Information Technology and Business Management 29
th June 2017. Vol.60 No.1
© 2012-2017 JITBM & ARF. All rights reserved
ISSN 2304-0777 www.jitbm.com
1
ELECTRONIC WORD-OF-MOUTH, EXPERIENTIAL MARKETING,
BRAND IMAGE, BRAND LOYALTY, AND PURCHASE INTENTION: A
STUDY OF INNISFREE 1Ying-Xuan Su,
2Chih-Chao Lai, Ph.D, Advisor
Dept. of Applied Foreign Languages, National Yunlin University of Science and Technology, Taiwan E-mail: [email protected]
Abstract
Owing to the impact of Korean drama and K-POP, Korean cosmetics in Taiwan are increasingly popular, also
widely accepted by Taiwan consumers. With the increase in female consuming ability, the demand for cosmetics
also increased, but how to attract consumers to buy their products cannot be ignored. In addition to through
eWOM / WOM, experiential marketing, how to retain the original customers, attract new consumers, the design
of the appropriate brand image, and raise the purchase intention are also important.
In this study, I used an online questionnaire to survey and SPSS as a tool to analyze data, such as: descriptive
statistics, reliability analysis, factor analysis, correlation analysis and regression analysis. The research aims to
explore the relationship between eWOM, experiential marketing, brand image, brand loyalty, and purchase
intention.
Keywords: e-WOM, experiential marketing, brand image, brand loyalty, purchase
intention
INTRODUCTION
Cosmetics have become indispensable to
women in their daily life. In recent years, with the
rise of Korean culture, Korean cosmetics industries
have been expanding to the world, further expanding
stores in Taiwan. Different to the Japanese,
European and American brands, Korean cosmetics
are more thoughtful on its packaging design,
stimulating customers’ desire to buy. Innisfree is the
naturalism cosmetics developed by AmorePacific
Corp., a South Korean cosmetics company. Innisfree
products is developed for urban women that desire
for the characteristics of the future of cosmetics:
natural, healthy, simple, and stylish.
Internet has become an indispensable tool for
people's lives, everyone almost cannot leave the
Internet environment and space. The internet plays
an important role in modern society, and people
increasingly use the internet to get the information
they need. With the increase in the number of online
shopper, more and more shopping sites and
comments easily make people hesitate to buy or not.
Word-of-mouth (WOM) information has an
overwhelming influence on consumers' purchasing
decisions, communication through the computer as a
communication medium is called
C o m p u t e r - M e d i a t e d C o m m u n i c a t i o n
[1]. Computer-mediated communication has a
nonlinear, non-synchronous, interactive, in addition,
can break the time and space constraints and other
International Journal of Information Technology and Business Management 29
th June 2017. Vol.60 No.1
© 2012-2017 JITBM & ARF. All rights reserved
ISSN 2304-0777 www.jitbm.com
2
traditional media characteristics of the past. In
previous study, people who make decisions on the
Internet will first refer to the relevant comments
made by others on the Internet [2] [3] [4], therefore
the electronic word-of-mouth (eWOM) is worthy of
attention.
Owing to customers in the purchase
decision-making are no longer just pay attention to
products itself, but in the purchase process to bring
customers the experiential marketing. Therefore
traditional marketing emphasizes the performance of
products or service benefits of the way cannot
satisfied the needs of modern customers experience
already, only focus on the customer experiential
marketing experience can be achieved. Schmitt [5] is
the first scholar to propose experiential marketing
concept, compared to traditional marketing focus on
product performance and benefits, experiential
marketing will focus on the consumer experience, to
provide sense, feel, think, act and relate of the value.
Customers like to experience, and after they
recognized, will have further purchase behavior.
Sensitive and critical customers need to personally
experience to support the purchase behavior, thus
experiential marketing is a combination of rational
and emotional persuasion process.
Previous studies have pointed out that when the
brand image and brand loyalty into the relationship
between eWOM and purchase intention, the brand
image and brand loyalty will interfere with the effect.
On the other hand, studies have shown that these
extensive eWOM can provide customers with
enormous influence and enough to affect the brand
image[6][7]. Besides, the study proposed that
customers through the internet in the customer to
customer knowledge exchange and brand loyalty is
directly related [8].
This research aims to examine the relationships
among eWOM, experiential marketing, brand image,
brand loyalty and purchase intention by customers
who buy Innisfree products.
LITERATURE REVIEW
In the global recession, the Korean cosmetics
industry market trend contrarian growth of 1.9% in
2011 to reach 4.382 billion won [9]. In addition, the
Korean cosmetics exports continued to increase and
reached US $ 760 million in 2010 [10]. Korean chain
cosmetics brand are rapid expansion in Taiwan since
the introduction in 2004, the main reason not only to
high-quality and low-priced products, but through the
Korean drama and k-pop to help. Korean style is
widely favored by young women, also more
influential impact on other consumer groups
purchase intention [11]. According to the 2009
Taiwan's pharmacy statistics, Korean cosmetics in
just two to three years, has created a market value of
NT 168 billion, Korean dramas, trial supplies, and
low prices are successful factors [9].
Although the Korean cosmetics set off a boom
in Taiwan, the various brand's business approach are
similar, such as store design, Korean star
endorsement. In order to sustainable development,
the manufacturers must understand whether the brand
performance as expected, the minds of consumers
evaluation, the relevant brand competition situation,
whether the need to re-positioning, and how to
cooperate with marketing strategies, etc [11] [12]. At
the same time, the brand is also an important basis
International Journal of Information Technology and Business Management 29
th June 2017. Vol.60 No.1
© 2012-2017 JITBM & ARF. All rights reserved
ISSN 2304-0777 www.jitbm.com
3
for consumers to purchase decisions.
Innisfree
Innisfree is a natural Korean brand that creates
products with highly quality ingredients made from
the island of Jeju, allowing for beauty and an
eco-friendly green life to preserve the balance of
nature. Innisfree is cosmetic that is generally
manufactured using all-natural, non-toxic ingredients
from Jeju. Many people believe that the products of
Innisfree are safer for consumers use and gentler to
the environment. People with sensitive skin may
benefit from the use of Innisfree, since the all-natural
ingredients used in them are often gentler on the skin.
Electronic Word-of-Mouth
When the internet into the community era, the
proportion of internet users use of time in the media
are significantly shifted to the community web sites,
and social media accounted for the vast majority.
Now in the choice of channels, in fact, it is difficult
to have differentiated products and all channels are
selling similar things, coupled with company may
have done a lot of marketing, media exposure or
news reports; however, in the end, consumers will
due to their friends or comments and give up the
products. Since more and more people will ask the
product comments to users through social media,
how to promote products has become the most
difficult problem to solve. Furthermore, a large
number of messages, comments, similar products and
brands will all to affect the consumers to purchase
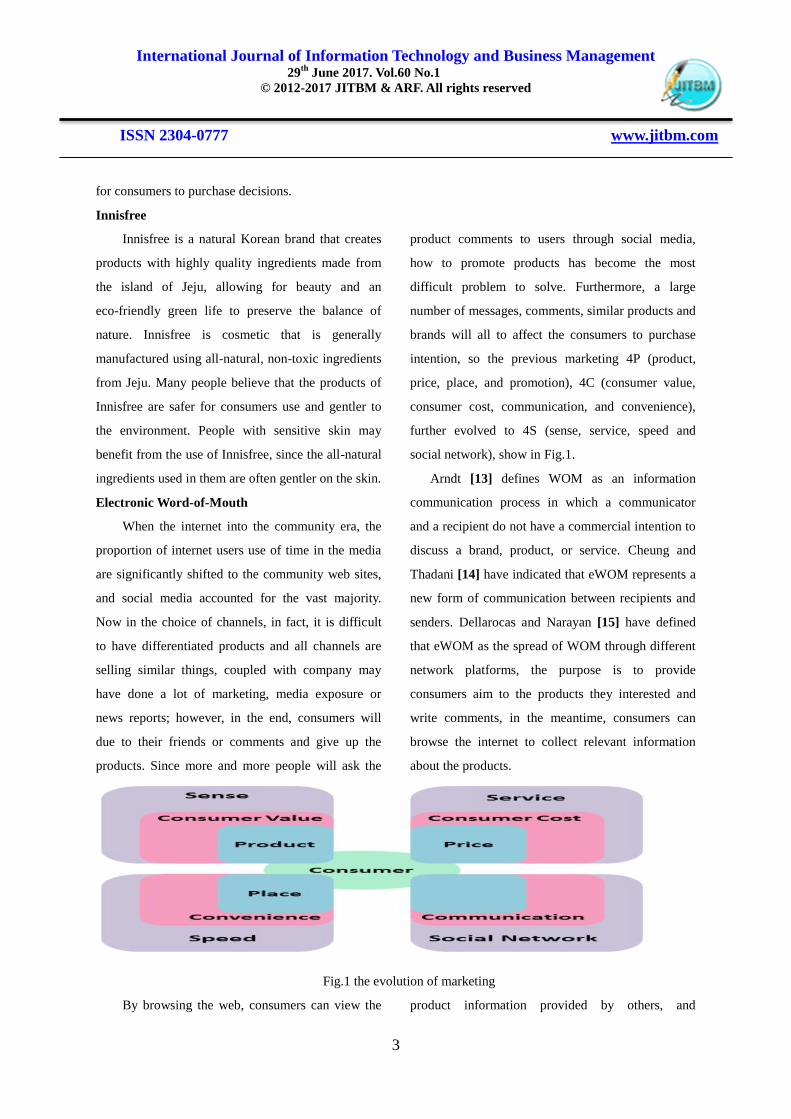
intention, so the previous marketing 4P (product,
price, place, and promotion), 4C (consumer value,
consumer cost, communication, and convenience),
further evolved to 4S (sense, service, speed and
social network), show in Fig.1.
Arndt [13] defines WOM as an information
communication process in which a communicator
and a recipient do not have a commercial intention to
discuss a brand, product, or service. Cheung and
Thadani [14] have indicated that eWOM represents a
new form of communication between recipients and
senders. Dellarocas and Narayan [15] have defined
that eWOM as the spread of WOM through different
network platforms, the purpose is to provide
consumers aim to the products they interested and
write comments, in the meantime, consumers can
browse the internet to collect relevant information
about the products.
Fig.1 the evolution of marketing
By browsing the web, consumers can view the product information provided by others, and
International Journal of Information Technology and Business Management 29
th June 2017. Vol.60 No.1
© 2012-2017 JITBM & ARF. All rights reserved
ISSN 2304-0777 www.jitbm.com
4
according to Gefen [16] pointed out when the
consumers shop in the internet will attention to the
comments of other consumers more than the
information provided by company. In addition, Bezos
[17] considered that creating experiential marketing
in a virtual environment is more important than a real
environment, since consumer will deliver a lot of
WOM through the internet after they experience.
Chao-Sheng [18] pointed out more higher the value
of the site experience, higher the willingness of
consumers to WOM of site. Moreover, a good
experience will make the consumer have a positive
behavioral intention (ex: WOM, loyalty, etc.). Turley
and Milliman [19] considered that the atmosphere
will affect the behavior of the consumer and the
consumer will respond the stimulus that they
received. On the other hand, Reynolds [6] and Urban
[7] indicated that the eWOM has a huge influence on
consumers, which further to affects the consumers'
brand image.
H1: eWOM has a positive impact on experiential
marketing.
H2: eWOM has a positive impact on brand image.
Experiential Marketing
Experiential marketing is a concept that
integrates elements of emotions, logic, and general
thought processes to connect with the consumer. Also,
experiential marketing is to establish the connection
in such a way that the consumer responds to a
product offering based on both emotional and
rational response levels that directly
engages consumers and invites and encourages them
to participate in the evolution of a brand or a brand
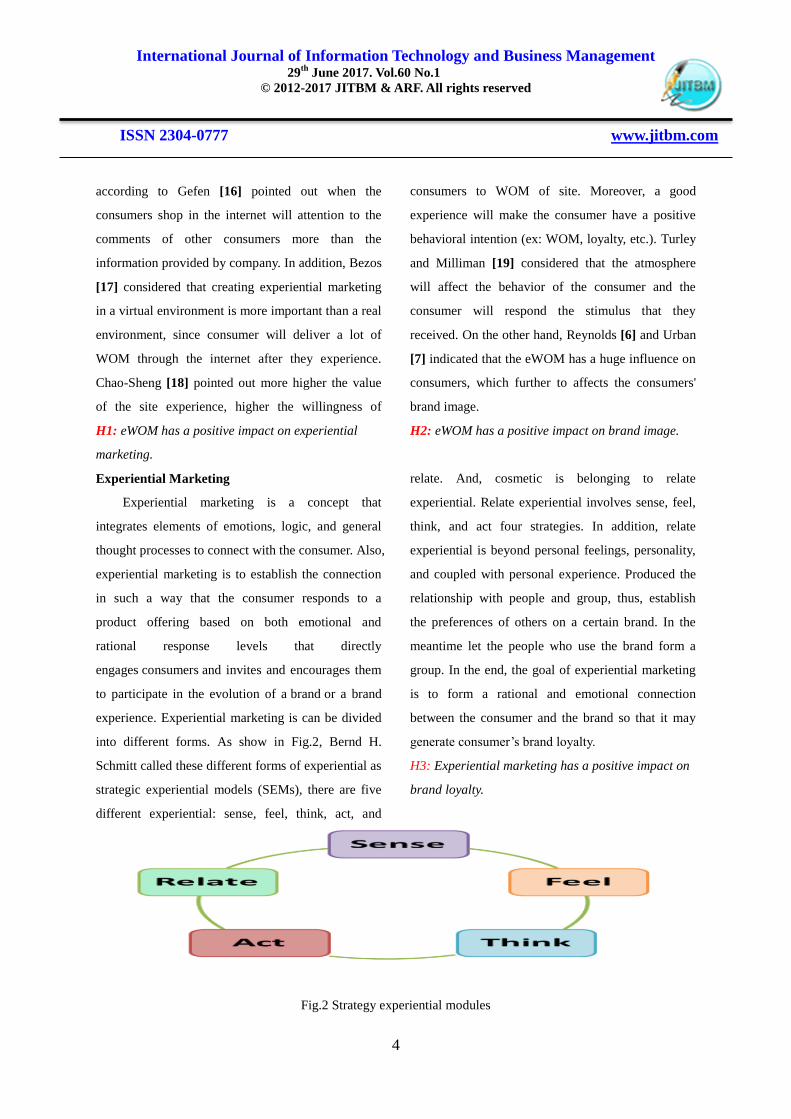
experience. Experiential marketing is can be divided
into different forms. As show in Fig.2, Bernd H.
Schmitt called these different forms of experiential as
strategic experiential models (SEMs), there are five
different experiential: sense, feel, think, act, and
relate. And, cosmetic is belonging to relate
experiential. Relate experiential involves sense, feel,
think, and act four strategies. In addition, relate
experiential is beyond personal feelings, personality,
and coupled with personal experience. Produced the
relationship with people and group, thus, establish
the preferences of others on a certain brand. In the
meantime let the people who use the brand form a
group. In the end, the goal of experiential marketing
is to form a rational and emotional connection
between the consumer and the brand so that it may
generate consumer’s brand loyalty.
H3: Experiential marketing has a positive impact on
brand loyalty.
Fig.2 Strategy experiential modules
International Journal of Information Technology and Business Management 29
th June 2017. Vol.60 No.1
© 2012-2017 JITBM & ARF. All rights reserved
ISSN 2304-0777 www.jitbm.com
5
Brand Image
The brand image refers to not only the way as a
whole views as company or product, also the
consumer based on contact with the brand
information, through their own selection and
processing, further summing up formed in the brain.
Many companies attempt to create an impressive
brand that people can identify with a product, in
addition, also want their product to have a specific
image or to be looked upon in a certain way. This
brand image can shape how they release a product,
the type of product they make, the type of advertising
they do, and the type of customers they cater to. A
brand with high awareness and good image can
promote brand loyalty to consumers [20].
H4: Brand image has a positive impact on brand
loyalty.
Brand Loyalty
The America Marketing Association (2011) defines
brand loyalty as: “The degree to which a consumer
consistently purchases the same brand within a
product class.” Brand loyalty is a pattern of
consumer behavior; consumers of loyal consistently
purchase products from their preferred brands,
regardless of convenience or price. Therefore,
companies often use various marketing strategies to
cultivate loyal customer, including trials and
incentives. Companies cultivate loyal consumers
sometimes work with brand ambassadors, consumers
who market the brand and communicate with it
positively about it among their friends on internet.
This is free eWOM marketing for the company and is
usually an effective way of building brand loyalty. If
a product is less than ideal, consumers may move on
to a different brand. Some shopping sites like
UrCosme.com have user reviews on the product
listing page so that consumers can learn about
product ingredients and get brand comments from
other users. In the previous studies, Washburn and
Plank [21] further indicate that perceived quality and
brand loyalty have a highly connection, they will
positively influence purchase intention. Moreover, a
new view and evidence to the study of brand loyalty
that customer perceived quality will influence brand
trust and brand affect, and further to influence brand
attitude and purchase behavior [22].
H5: Brand loyalty has a positive impact on purchase
intention.
Purchase Intention
Purchase intention indicates that consumers will
follow their experience, preference and external
environment to collect information, evaluate
alternatives, and make purchase decision [23] [24]
[25] [26], moreover, can measure the possibility of a
consumer to buy a product, and the higher the
purchase intention is, the higher a consumer’s
willingness is to buy a product [23] [24]. MacInnis
[27] considered that endorser marketing can give an
endorsed product a brand new image and advance
consumer purchase intention. Moreover, consumers’
brand attitude and purchase intention will be higher
when a product has high preference image and
familiarity [28] [29]. Likewise, if a product has
higher brand awareness it will have a higher market
share and a better quality evaluation [23] [30].
International Journal of Information Technology and Business Management 29
th June 2017. Vol.60 No.1
© 2012-2017 JITBM & ARF. All rights reserved
ISSN 2304-0777 www.jitbm.com
6
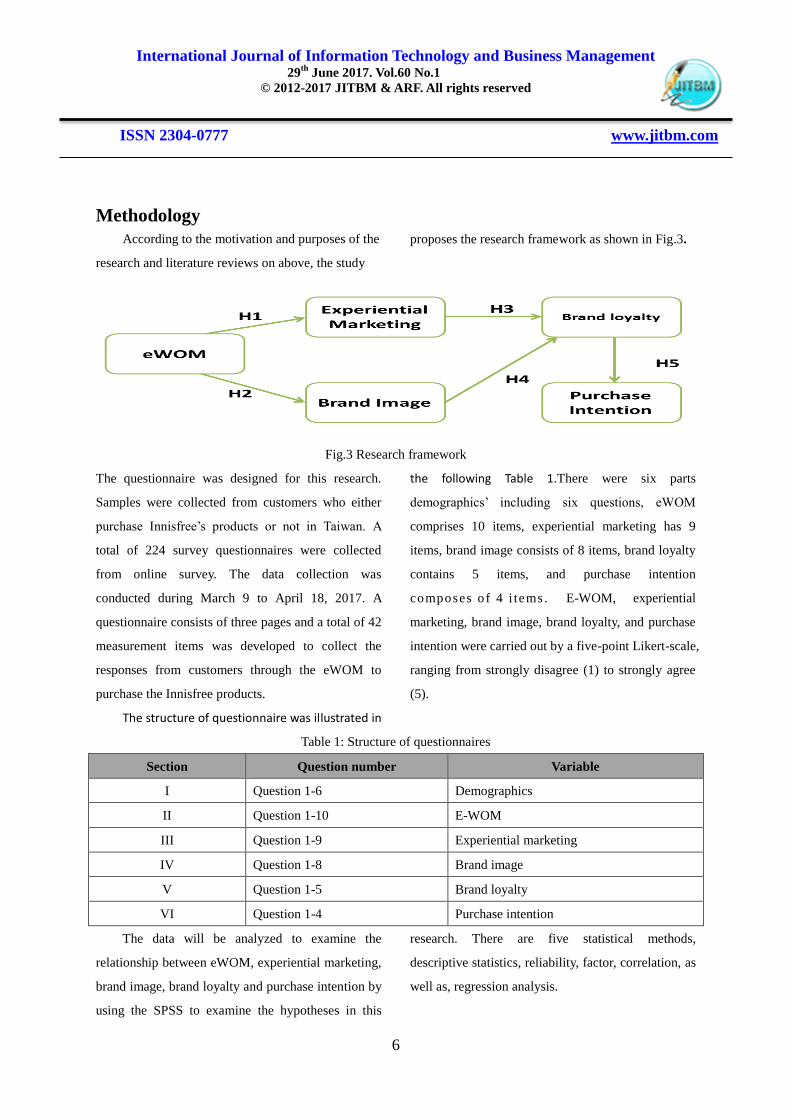
Methodology
According to the motivation and purposes of the
research and literature reviews on above, the study
proposes the research framework as shown in Fig.3.
Fig.3 Research framework
The questionnaire was designed for this research.
Samples were collected from customers who either
purchase Innisfree’s products or not in Taiwan. A
total of 224 survey questionnaires were collected
from online survey. The data collection was
conducted during March 9 to April 18, 2017. A
questionnaire consists of three pages and a total of 42
measurement items was developed to collect the
responses from customers through the eWOM to
purchase the Innisfree products.
The structure of questionnaire was illustrated in
the following Table 1.There were six parts
demographics’ including six questions, eWOM
comprises 10 items, experiential marketing has 9
items, brand image consists of 8 items, brand loyalty
contains 5 items, and purchase intention
composes o f 4 i tems . E-WOM, experiential
marketing, brand image, brand loyalty, and purchase
intention were carried out by a five-point Likert-scale,
ranging from strongly disagree (1) to strongly agree
(5).
Table 1: Structure of questionnaires
Section Question number Variable
I Question 1-6 Demographics
II Question 1-10 E-WOM
III Question 1-9 Experiential marketing
IV Question 1-8 Brand image
V Question 1-5 Brand loyalty
VI Question 1-4 Purchase intention
The data will be analyzed to examine the
relationship between eWOM, experiential marketing,
brand image, brand loyalty and purchase intention by
using the SPSS to examine the hypotheses in this
research. There are five statistical methods,
descriptive statistics, reliability, factor, correlation, as
well as, regression analysis.

International Journal of Information Technology and Business Management 29
th June 2017. Vol.60 No.1
© 2012-2017 JITBM & ARF. All rights reserved
ISSN 2304-0777 www.jitbm.com
7
Result
This study utilized statistical software SPSS to
present results. The relationships among eWOM,
experiential marketing, brand image, brand loyalty,
and purchase intention were to be examined. The
totals of 224 questionnaires were collected from
online survey.
Description of Samples
As show in Table 2, the frequency and percentage of the value of each demographic factor are displayed.
Table 2 Demographic of the samples
Factor Value Frequency Percentage
Gender Male 25 11.2
Female 199 88.9
Age <18 10 4.5
18-24 132 58.9
25-30 43 19.2
>30 39 17.4
Occupation Student 93 41.5
Business 87 38.8
Housewife 8 3.6
Others 36 16.1
Income <15, 000 104 46.4
15, 000-22, 000 28 12.5
22, 100-35, 000 58 25.9
>35, 000 34 15.2
Gender
There were 199 female respondents which accounted
for 88.9%, and 25 male respondents which
comprised 11.2%, giving a total of 224 respondents.
The majority of the respondents in this sample were
females.
Age
The majority of respondents age was fell in 18 to 24
years old, in detail under 18 years old was 10 (4.5%),
18 to 24 years old was 132 (58.9%), 25 to 30 years
old was 43 (19.2%), and over 30 years old was 39
(17.4%).
Occupation
The occupation types of respondents fell in the field
of student, business, housewife, and others. In detail,
there were 93 student (41.5%), 87 business (38.8%),
8 housewife (3.6%), and 36 others (16.1%).
Income
This questionnaire classified the different income of
respondents into four categories from below 15, 000
NTD to more than 35, 000 NTD. Among the
respondents, there were 104 respondents (46.4%)
below 15,000 NTD, more than 15, 000 NTD and less
than 22, 000 NTD were 28 respondents (12.5%),
more than 22, 100 NTD and less than 35, 000 NTD
International Journal of Information Technology and Business Management 29
th June 2017. Vol.60 No.1
© 2012-2017 JITBM & ARF. All rights reserved
ISSN 2304-0777 www.jitbm.com
8
were 58 respondents (25.9%), and more than 35, 000 NTD were 34 respondents (15.2%).
Descriptive Statistical Analysis
In order to realize the respondents’ perceptions of
eWOM, experiential marketing, brand image, brand
loyalty, and purchase intention, 36 questionnaires
were distributed to customer of Innisfree. EWOM
comprises 10 items, experiential marketing has 9
items, brand image consists of 8 items, brand loyalty
contains 5 items, and purchase intention
composes o f 4 i tems . The items were carried
out by a five-point Likert-scale, ranging from
strongly disagree (1) to strongly agree (5). Moreover,
mean and standard deviation of each construct on
table were showed in the following.
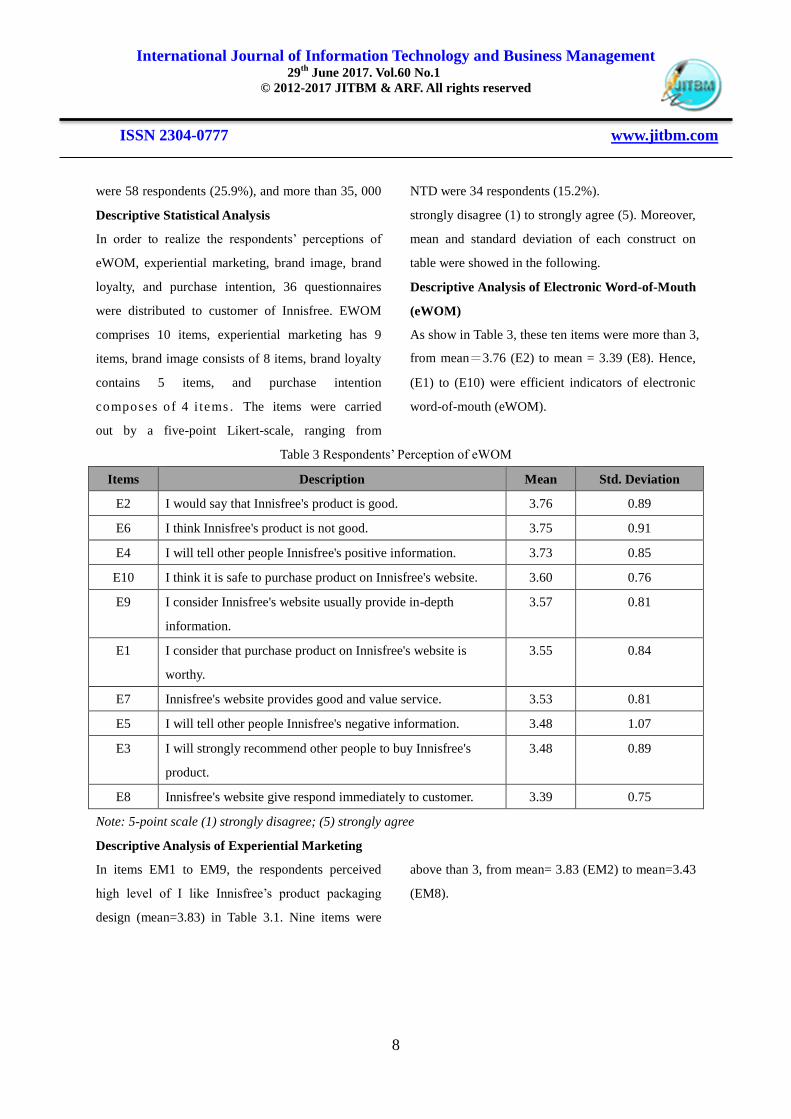
Descriptive Analysis of Electronic Word-of-Mouth
(eWOM)
As show in Table 3, these ten items were more than 3,
from mean=3.76 (E2) to mean = 3.39 (E8). Hence,
(E1) to (E10) were efficient indicators of electronic
word-of-mouth (eWOM).
Table 3 Respondents’ Perception of eWOM
Items Description Mean Std. Deviation
E2 I would say that Innisfree's product is good. 3.76 0.89
E6 I think Innisfree's product is not good. 3.75 0.91
E4 I will tell other people Innisfree's positive information. 3.73 0.85
E10 I think it is safe to purchase product on Innisfree's website. 3.60 0.76
E9 I consider Innisfree's website usually provide in-depth
information.
3.57 0.81
E1 I consider that purchase product on Innisfree's website is
worthy.
3.55 0.84
E7 Innisfree's website provides good and value service. 3.53 0.81
E5 I will tell other people Innisfree's negative information. 3.48 1.07
E3 I will strongly recommend other people to buy Innisfree's
product.
3.48 0.89
E8 Innisfree's website give respond immediately to customer. 3.39 0.75
Note: 5-point scale (1) strongly disagree; (5) strongly agree
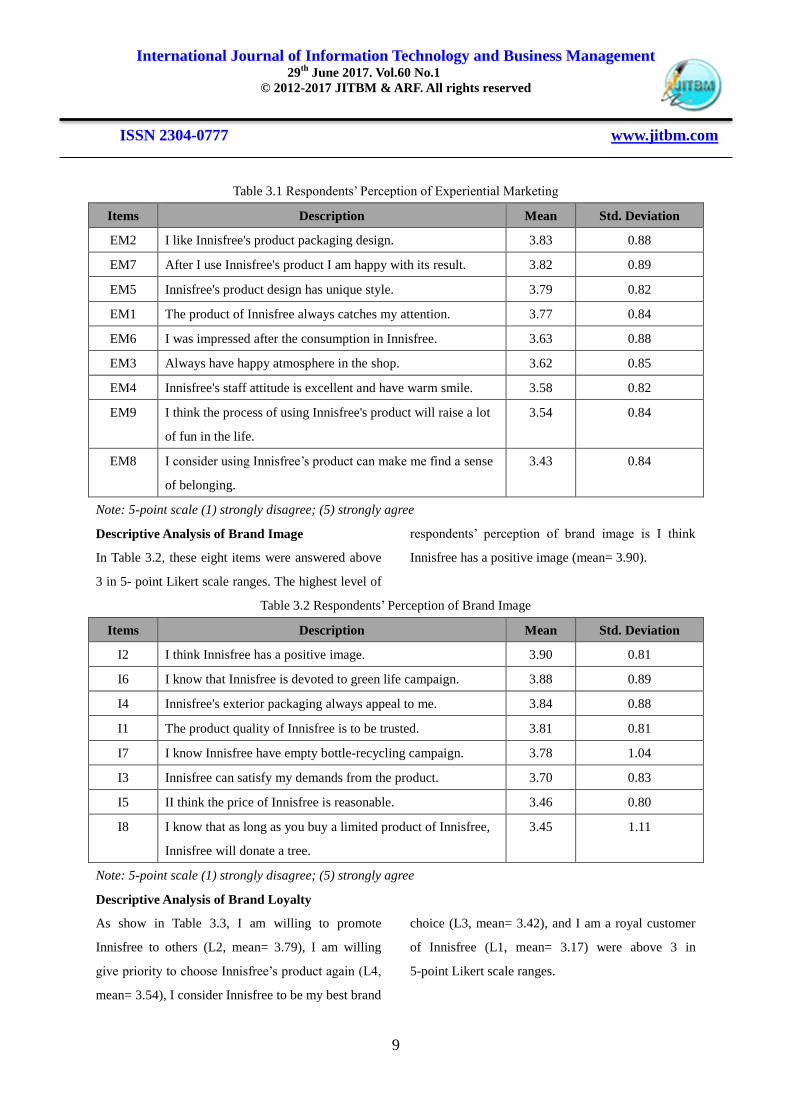
Descriptive Analysis of Experiential Marketing
In items EM1 to EM9, the respondents perceived
high level of I like Innisfree’s product packaging
design (mean=3.83) in Table 3.1. Nine items were
above than 3, from mean= 3.83 (EM2) to mean=3.43
(EM8).
International Journal of Information Technology and Business Management 29
th June 2017. Vol.60 No.1
© 2012-2017 JITBM & ARF. All rights reserved
ISSN 2304-0777 www.jitbm.com
9
Table 3.1 Respondents’ Perception of Experiential Marketing
Items Description Mean Std. Deviation
EM2 I like Innisfree's product packaging design. 3.83 0.88
EM7 After I use Innisfree's product I am happy with its result. 3.82 0.89
EM5 Innisfree's product design has unique style. 3.79 0.82
EM1 The product of Innisfree always catches my attention. 3.77 0.84
EM6 I was impressed after the consumption in Innisfree. 3.63 0.88
EM3 Always have happy atmosphere in the shop. 3.62 0.85
EM4 Innisfree's staff attitude is excellent and have warm smile. 3.58 0.82
EM9 I think the process of using Innisfree's product will raise a lot
of fun in the life.
3.54 0.84
EM8 I consider using Innisfree’s product can make me find a sense
of belonging.
3.43 0.84
Note: 5-point scale (1) strongly disagree; (5) strongly agree
Descriptive Analysis of Brand Image
In Table 3.2, these eight items were answered above
3 in 5- point Likert scale ranges. The highest level of
respondents’ perception of brand image is I think
Innisfree has a positive image (mean= 3.90).
Table 3.2 Respondents’ Perception of Brand Image
Items Description Mean Std. Deviation
I2 I think Innisfree has a positive image. 3.90 0.81
I6 I know that Innisfree is devoted to green life campaign. 3.88 0.89
I4 Innisfree's exterior packaging always appeal to me. 3.84 0.88
I1 The product quality of Innisfree is to be trusted. 3.81 0.81
I7 I know Innisfree have empty bottle-recycling campaign. 3.78 1.04
I3 Innisfree can satisfy my demands from the product. 3.70 0.83
I5 II think the price of Innisfree is reasonable. 3.46 0.80
I8 I know that as long as you buy a limited product of Innisfree,
Innisfree will donate a tree.
3.45 1.11
Note: 5-point scale (1) strongly disagree; (5) strongly agree
Descriptive Analysis of Brand Loyalty
As show in Table 3.3, I am willing to promote
Innisfree to others (L2, mean= 3.79), I am willing
give priority to choose Innisfree’s product again (L4,
mean= 3.54), I consider Innisfree to be my best brand
choice (L3, mean= 3.42), and I am a royal customer
of Innisfree (L1, mean= 3.17) were above 3 in
5-point Likert scale ranges.

International Journal of Information Technology and Business Management 29
th June 2017. Vol.60 No.1
© 2012-2017 JITBM & ARF. All rights reserved
ISSN 2304-0777 www.jitbm.com
10
Table 3.3 Respondents’ Perception of Brand Loyalty
Items Description Mean Std. Deviation
L2 I am willing to promote Innisfree to others. 3.79 0.89
L4 I am willing give priority to choose Innisfree's product again. 3.54 0.97
L3 I consider Innisfree to be my best brand choice. 3.42 0.95
L1 I am a royal customer of Innisfree. 3.17 1.08
L5 I am willing to choose other brand's product in next time. 2.68 0.85
Note: 5-point scale (1) strongly disagree; (5) strongly agree
Descriptive Analysis of Purchase Intention
Table 3.4 shows that the respondents tend to have a
high level of agreement with I am willing to buy
Innisfree’s product (P1, mean= 3.85). And, P2 (If
necessary, I would like to purchase Innisfree products
again.) was second high level (mean= 3.84) in Table
3.4.
Table 3.4 Respondents’ Perception of Purchase Intention
Items Description Mean Std. Deviation
P1 I am willing to buy Innisfree's product. 3.85 0.89
P2 If necessary, I would like to purchase Innisfree products again. 3.84 0.90
P3 I will definitely try Innisfree's product again. 3.78 0.92
P4 I will recommend my friends and families to buy the product
of Innisfree.
3.78 0.90
Note: 5-point scale (1) strongly disagree; (5) strongly agree
Reliability Analysis
The reliability analysis of questionnaires was
evaluated by using Cronbach’s Alpha. If alpha is
greater than 0.7, it means that it has high reliability,
otherwise, if alpha is smaller than 0.3, then it
represented that there is low reliability (Hair Jr,
2006). In Table 4 showed the Cronbach’s Alpha
values for each scale, and the reliability of each scale
was above 0.7.
Table 4 Reliability of Each Scale
Variable Cronbach’s Alpha Items
E-WOM 0.859 10
Experiential Marketing 0.933 9
Brand Image 0.904 8
Brand Loyalty 0.805 5
Purchase Intention 0.965 4
Factor Analysis
To estimate the construct validity of the
questionnaire, factor analysis was utilized. The KMO
value of eWOM, experiential marketing, brand image,
International Journal of Information Technology and Business Management 29
th June 2017. Vol.60 No.1
© 2012-2017 JITBM & ARF. All rights reserved
ISSN 2304-0777 www.jitbm.com
11
brand loyalty and purchase intention was
respectively .870, .915, .887, .827 and .868, which
was above 0.6 and the Bartlett’s test is significant (p
= 0).
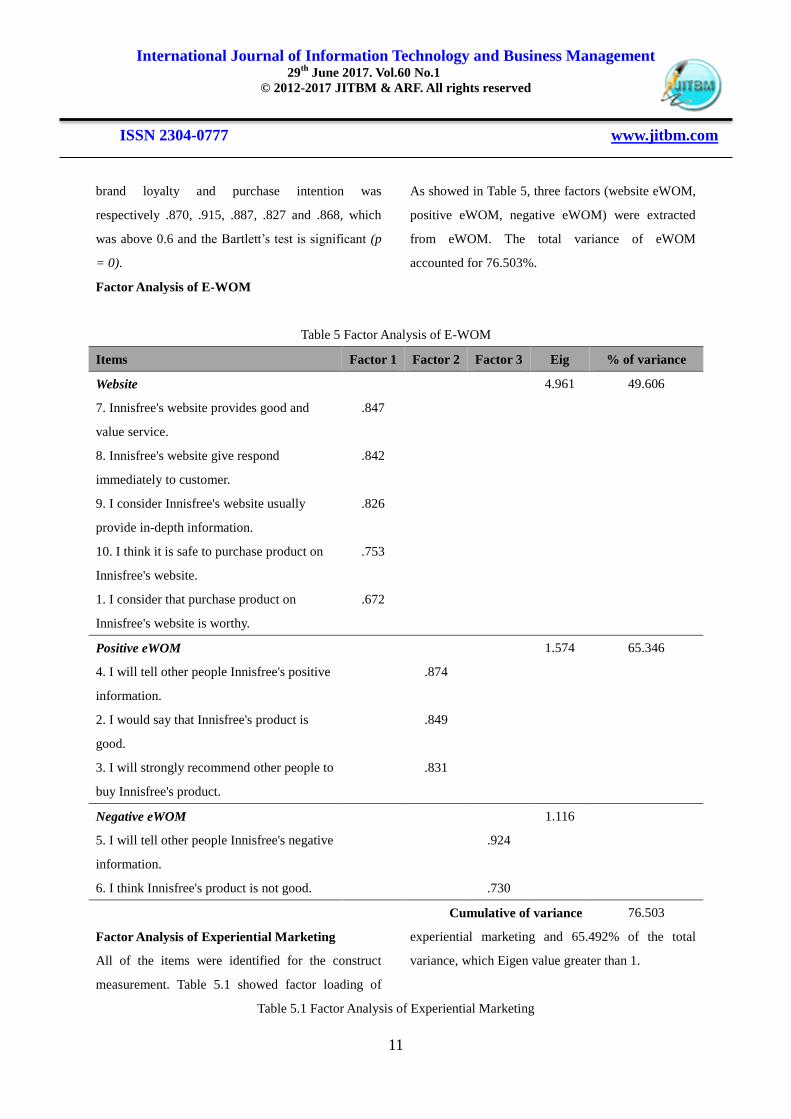
Factor Analysis of E-WOM
As showed in Table 5, three factors (website eWOM,
positive eWOM, negative eWOM) were extracted
from eWOM. The total variance of eWOM
accounted for 76.503%.
Table 5 Factor Analysis of E-WOM
Items Factor 1 Factor 2 Factor 3 Eig % of variance
Website 4.961 49.606
7. Innisfree's website provides good and
value service.
.847
8. Innisfree's website give respond
immediately to customer.
.842
9. I consider Innisfree's website usually
provide in-depth information.
.826
10. I think it is safe to purchase product on
Innisfree's website.
.753
1. I consider that purchase product on
Innisfree's website is worthy.
.672
Positive eWOM 1.574 65.346
4. I will tell other people Innisfree's positive
information.
.874
2. I would say that Innisfree's product is
good.
.849
3. I will strongly recommend other people to
buy Innisfree's product.
.831
Negative eWOM 1.116
5. I will tell other people Innisfree's negative
information.
.924
6. I think Innisfree's product is not good. .730
Cumulative of variance 76.503
Factor Analysis of Experiential Marketing
All of the items were identified for the construct
measurement. Table 5.1 showed factor loading of
experiential marketing and 65.492% of the total
variance, which Eigen value greater than 1.
Table 5.1 Factor Analysis of Experiential Marketing

International Journal of Information Technology and Business Management 29
th June 2017. Vol.60 No.1
© 2012-2017 JITBM & ARF. All rights reserved
ISSN 2304-0777 www.jitbm.com
12
Items Factor Eig % of variance
5.894
7. After I use Innisfree's product I am happy with its
result.
.885
6. I was impressed after the consumption in Innisfree. .868
9. I think the process of using Innisfree's product will
raise a lot of fun in the life.
.831
5. Innisfree's product design has unique style. .823
8. I consider using Innisfree’s product can make me find
a sense of belonging.
.816
2. I like Innisfree's product packaging design. .802
4. Innisfree's staff attitude is excellent and have warm
smile.
.799
1. The product of Innisfree always catches my attention. .792
3. Always have happy atmosphere in the shop. .644
Cumulative of variance 65.492
Factor Analysis of Brand Image
After doing exploratory of factor analysis of brand
image, the results show in Table 5.2 with factor
loading and Eigen-value was higher than 0.6 and 1.
Additionally, the item 5 (I think the price of Innisfree
is reasonable.) was deleted because low factor
loadings.
Table 5.2 Factor Analysis of Brand Image
Items Factor Eig % of variance
4.956
2. I think Innisfree has a positive image. .876
3. Innisfree can satisfy my demands from the product. .866
1. The product quality of Innisfree is to be trusted. .855
4. Innisfree's exterior packaging always appeal to me. .837
6. I know that Innisfree is devoted to green life
campaign.
.831
7. I know Innisfree have empty bottle-recycling
campaign.
.742
8. I know that as long as you buy a limited product of
Innisfree, Innisfree will donate a tree.
.655
Cumulative of variance 61.956

International Journal of Information Technology and Business Management 29
th June 2017. Vol.60 No.1
© 2012-2017 JITBM & ARF. All rights reserved
ISSN 2304-0777 www.jitbm.com
13
Factor Analysis of Brand Loyalty
The construct of brand loyalty contained one factor
with four items. Table 5.3 shows that all factor
loading were from 0.937 to 0.875, Eigen-value
(3.317) and cumulative percentage (66.344%) which
were higher than the principle of 0.6, 1, 0.6 (Hair Jr,
2006). In this study, item 5 was deleted because of
low factor loading.
Table 5.3 Factor Analysis of Brand Loyalty
Items Factor Eig % of variance
3.317
3. I consider Innisfree to be my best brand choice. .937
4. I am willing give priority to choose Innisfree's product
again.
.933
1. I am a royal customer of Innisfree. .888
2. I am willing to promote Innisfree to others. .875
Cumulative of variance 66.344
Factor Analysis of Purchase Intention
In Table 5.4, only one factor was extracted from
purchase intention. The total variance of the purchase
intention accounted for 90.488% and factor loading
were from 0.966 to 0.924.
Table 5.4 Factor Analysis of Purchase Intention
Items Factor Eig % of variance
3.620
2. If necessary, I would like to purchase Innisfree
products again.
.966
1. I am willing to buy Innisfree's product. .957
3. I will definitely try Innisfree's product again. .957
4. I will recommend my friends and families to buy the
product of Innisfree.
.924
Cumulative of variance 90.488
Correlational Analysis
H1: eWOM has a positive impact on experiential
marketing.
H2: eWOM has a positive impact on brand image.
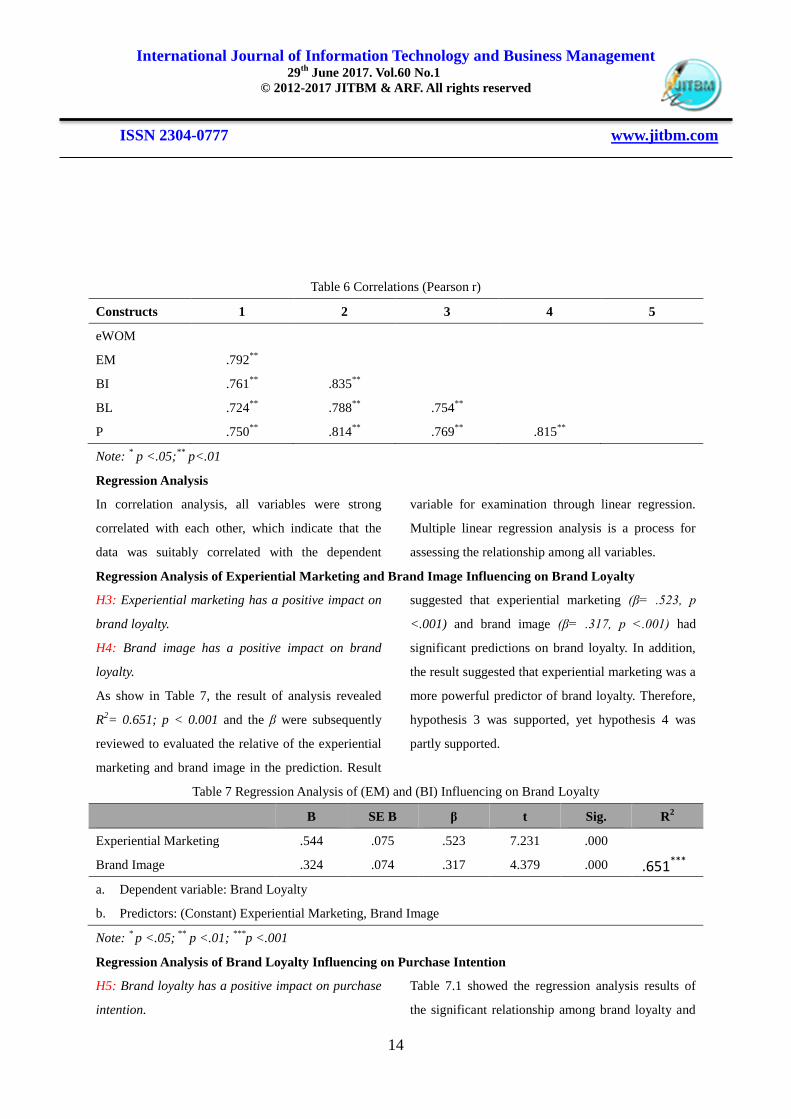
In Table 6, the results of analysis demonstrated that
there was a positive relationship among all the
constructs. E-WOM and experiential marketing had
the highest correlation coefficient with 0.792.
Moreover, eWOM and brand image had the
correlation coefficient with 0.761. Hence, hypothesis
1 was supported, yet hypothesis 2 was partly
supported.
International Journal of Information Technology and Business Management 29
th June 2017. Vol.60 No.1
© 2012-2017 JITBM & ARF. All rights reserved
ISSN 2304-0777 www.jitbm.com
14
Table 6 Correlations (Pearson r)
Constructs 1 2 3 4 5
eWOM
EM .792**
BI .761**
.835**
BL .724**
.788**
.754**
P .750**
.814**
.769**
.815**
Note: * p <.05;
** p<.01
Regression Analysis
In correlation analysis, all variables were strong
correlated with each other, which indicate that the
data was suitably correlated with the dependent
variable for examination through linear regression.
Multiple linear regression analysis is a process for
assessing the relationship among all variables.
Regression Analysis of Experiential Marketing and Brand Image Influencing on Brand Loyalty
H3: Experiential marketing has a positive impact on
brand loyalty.
H4: Brand image has a positive impact on brand
loyalty.
As show in Table 7, the result of analysis revealed
R2= 0.651; p < 0.001 and the β were subsequently
reviewed to evaluated the relative of the experiential
marketing and brand image in the prediction. Result
suggested that experiential marketing (β= .523, p
<.001) and brand image (β= .317, p <.001) had
significant predictions on brand loyalty. In addition,
the result suggested that experiential marketing was a
more powerful predictor of brand loyalty. Therefore,
hypothesis 3 was supported, yet hypothesis 4 was
partly supported.
Table 7 Regression Analysis of (EM) and (BI) Influencing on Brand Loyalty
B SE B β t Sig. R2
Experiential Marketing .544 .075 .523 7.231 .000
Brand Image .324 .074 .317 4.379 .000
a. Dependent variable: Brand Loyalty
b. Predictors: (Constant) Experiential Marketing, Brand Image
Note: * p <.05;
** p <.01;
***p <.001
Regression Analysis of Brand Loyalty Influencing on Purchase Intention
H5: Brand loyalty has a positive impact on purchase
intention.
Table 7.1 showed the regression analysis results of
the significant relationship among brand loyalty and
.651***
International Journal of Information Technology and Business Management 29
th June 2017. Vol.60 No.1
© 2012-2017 JITBM & ARF. All rights reserved
ISSN 2304-0777 www.jitbm.com
15
purchase intention (R2= 0.665; p < .001). In this
study, the result suggested that brand loyalty
(β= .815, p <.001) had significant effect on purchase
intention. Hence, hypothesis 5 was supported.
Table 7.1 Regression Analysis of Brand Loyalty Influencing on Purchase Intention
B SE B β t Sig. R2
Brand loyalty .980 .047 .815 20.985 .000 .665***
a. Dependent variable: Purchase Intention
b. Predictors: (Constant) Brand Loyalty
Note: * p <.05;
** p <.01;
***p <.001
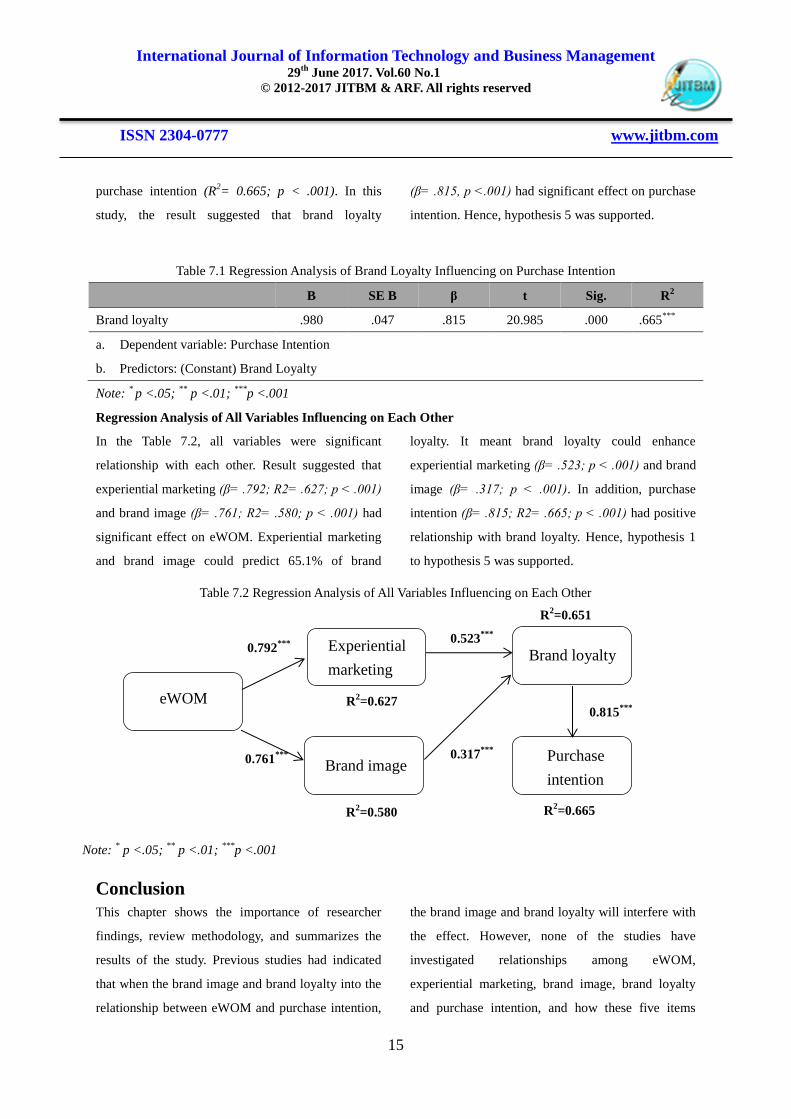
Regression Analysis of All Variables Influencing on Each Other
In the Table 7.2, all variables were significant
relationship with each other. Result suggested that
experiential marketing (β= .792; R2= .627; p < .001)
and brand image (β= .761; R2= .580; p < .001) had
significant effect on eWOM. Experiential marketing
and brand image could predict 65.1% of brand
loyalty. It meant brand loyalty could enhance
experiential marketing (β= .523; p < .001) and brand
image (β= .317; p < .001). In addition, purchase
intention (β= .815; R2= .665; p < .001) had positive
relationship with brand loyalty. Hence, hypothesis 1
to hypothesis 5 was supported.
Table 7.2 Regression Analysis of All Variables Influencing on Each Other
Conclusion
This chapter shows the importance of researcher
findings, review methodology, and summarizes the
results of the study. Previous studies had indicated
that when the brand image and brand loyalty into the
relationship between eWOM and purchase intention,
the brand image and brand loyalty will interfere with
the effect. However, none of the studies have
investigated relationships among eWOM,
experiential marketing, brand image, brand loyalty
and purchase intention, and how these five items
Brand loyalty
Purchase
intention Brand image
eWOM
Experiential
marketing
0.792***
**
0.792***
0.761***
**
0.792***
R2=0.627
**
0.792***
R2=0.580
**
0.792***
0.523***
**
0.792***
0.317***
**
0.792***
R2=0.651
0.815***
**
0.792***
R2=0.665
Note: * p <.05;
** p <.01;
***p <.001

International Journal of Information Technology and Business Management 29
th June 2017. Vol.60 No.1
© 2012-2017 JITBM & ARF. All rights reserved
ISSN 2304-0777 www.jitbm.com
16
influenced on each other. This research aims to
examine relationship among these five items by
quantitative methods. The chapter is dividing into
three sections such as discussion of research results,
implications and limitations of the study.
Discussion of Research Results
This study attempted to examine the
relationships among eWOM, experiential marketing,
brand image, brand loyalty and purchase intention.
Based on the data analysis, the research found that
there were significant and influential relationships
among each variable. Moreover, this study examined
the perception of eWOM, experiential marketing,
brand image, brand loyalty and purchase intention in
Innisfree from the respond of the customers.
The study examined statistical software SPSS to
present the relationship among eWOM, experiential
marketing, brand image, brand loyalty, and purchase
intention. In previous study, the researchers
conducted in the previous study mainly focused on
eWOM, brand image, brand loyalty and purchase
intention with ignorance the factors of experiential
marketing, which also building a model for brand
image and brand loyalty to improve and enhance.
To test the validity of the questionnaire, factor
analysis was utilized, and Cronbach’s alpha (α > 0.7)
was utilized to evaluate the reliability. The study
applied Pearson correlation to explain the correlation
among eWOM, experiential marketing, brand image,
brand loyalty and purchase intention. Linear
regression analysis was used to examine if the factors
eWOM have a respectively influence on experiential
marketing and brand image, and test if brand loyalty
have influence on purchase intention. In addition,
multiple regression analysis was employed to test if
the factors experiential marketing and brand image
have an impact on brand loyalty. Moreover,
regression was utilized to determine all variables
have a positive effect on each other. Finally, the
results of the hypothesis testing were showed in
Table 8.
Table 8 The Results of the Hypothesis
H1 eWOM has a positive impact on experiential marketing. Supported
H2 eWOM has a positive impact on brand image. Partly supported
H3 Experiential marketing has a positive impact on brand loyalty. Supported
H4 Brand image has a positive impact on brand loyalty. Partly supported
H5 Brand loyalty has a positive impact on purchase intention. Supported
Implications
According the research model in this study,
experiential marketing had increase brand loyalty;
however experiential marketing also had strong
influence on brand image. In correlation analysis,
experiential marketing and brand image had highest
correlation coefficient with 0.835 than experiential
marketing and brand loyalty correlation coefficient
with 0.788. Therefore, it provides customers through
experiential marketing to enhance brand image then
affect customer purchase intention.
In this study, all variables had powerful
influence on purchase intention, especially

International Journal of Information Technology and Business Management 29
th June 2017. Vol.60 No.1
© 2012-2017 JITBM & ARF. All rights reserved
ISSN 2304-0777 www.jitbm.com
17
experiential marketing and brand loyalty; it can infer
from research results that new customers try
Innisfree products out or customer itself is loyal
customer; the customers can be stimulated upon
perception of experience and then affect purchase
intention.
In summary, although eWOM, experiential
marketing, brand image and brand loyalty could
improve purchase intention significantly, customers
still tend to first-hand experience than eWOM.
Limitations of the Study
The study was conducted to find out the
relationship among eWOM, experiential marketing,
brand image, brand loyalty and purchase intention.
The present study has findings that theoretical
implication; however its design is not without
shortcomings.
First, half of the participants answered the
questionnaires based on eWOM and WOM, rather
than the perception of used Innisfree products before.
Second, Innisfree's Taiwan official website does not
provide direct purchase; therefore, purchase the
Innisfree products must be on the Korean official
website or G-market. As the official website and
G-market registration process is complicated, so
most of the customers will tend to purchasing broker.
Hence, some of the items of eWOM questionnaire
may be confused to participants. Third, the sample
size of the study was small, with a sample size of 224
participants; it may not represent all the customers of
Innisfree in Taiwan.
References
[1] Steinfield, C. W. (1986). Computer-mediated
communication systems. Annual Review of Information
Science and Technology (ARIST), 21, 167-202.
[2] Bonabeau, E. (2004). The perils of the imitation age.
Harvard business review, 82(6), 45-54, 135.
[3] Kamakura, W. A., Basuroy, S., & Boatwright, P. (2006).
Is silence golden? An inquiry into the meaning of silence in
professional product evaluations. Quantitative Marketing
and Economics, 4(2), 119-141.
[4] Senecal, S., & Nantel, J. (2004). The influence of
online product recommendations on consumers’ online
choices. Journal of retailing, 80(2), 159-169.
[5] Schmitt, B. (1999). Experiential marketing. Journal of
marketing management, 15(1-3), 53-67.
[6] Reynolds, G. (2006). An Army of Davids: How
Markets and Technology Empower Ordinary People to
Beat Big Media. Big Government, and Other Goliaths,
Thomas Nelson, Nashville, TN.
[7] Urban, G. (2005). Don't just relate-advocate!: a
blueprint for profit in the era of customer power: Pearson
Education.
[8] Gruen, T. W., Osmonbekov, T., & Czaplewski, A. J.
(2006). eWOM: The impact of customer-to-customer
online know-how exchange on customer value and loyalty.
Journal of Business research, 59(4), 449-456.
[9] 首爾台貿中心. (2012). 韓國:韓生技醫藥及食品熱賣
紅蔘保健品人氣最旺 國際商情雙週刊, 273.
[10] 林筱庭. (2012). 藝人推波助瀾-韓國美麗新勢力崛
起. from 新新聞
http://www.new7.com.tw/coverStory/CoverView.aspx?NU
M=1340&i=TXT20121107155800JF4
[11] 陳亮君, 黃建文, 莊淑閔, & 孟韻佳. (2011). 生活
型態與韓國化妝品消費價值之研究-台南地區女大學
生為例. [Life Style and Consumption Value of Korean
Cosmetics-A Case of Female University Students in
Tainan]. 美容科技學刊, 8(4), 115-129.
[12] 李琴、黃娜. (2006). 淺析化妝品企業的品牌管理.
International Journal of Information Technology and Business Management 29
th June 2017. Vol.60 No.1
© 2012-2017 JITBM & ARF. All rights reserved
ISSN 2304-0777 www.jitbm.com
18
青島職業技術學院學報, 19, 60-61.
[13] Arndt, J. (1967). Role of product-related conversations
in the diffusion of a new product. Journal of marketing
Research, 291-295.
[14] Cheung, C. M., & Thadani, D. R. (2010). The
effectiveness of electronic word-of-mouth communication:
A literature analysis. Proceedings of the 23rd Bled
eConference eTrust: implications for the individual,
enterprises and society, 329-345.
[15] Dellarocas, C., & Narayan, R. (2006). A statistical
measure of a population’s propensity to engage in
post-purchase online word-of-mouth. Statistical Science,
21(2), 277-285.
[16] Gefen, D. (2000). E-commerce: the role of familiarity
and trust. omega, 28 .6, 725-737.
[17] Bezos, J. (1999). Setting the standard with Jeff Bezos.
Internet Summit, 99, 20.
[18] Chao-Sheng, T. (2010). 網路體驗對網路口碑意圖之
影響-以情緒為中介變數. 台北科技大學. Available
from Airiti AiritiLibrary database. (2010年)
[19] Turley, L. W., & Milliman, R. E. (2000). Atmospheric
effects on shopping behavior: a review of the experimental
evidence. Journal of Business research, 49(2), 193-211.
[20] Aaker, D. A., & Keller, K. L. (1990). Consumer
evaluations of brand extensions. The Journal of Marketing,
27-41.
[21] Washburn, J. H., & Plank, R. E. (2002). Measuring
brand equity: An evaluation of a consumer-based brand
equity scale. Journal of Marketing Theory and Practice,
10(1), 46-62.
[22] Chi, H. K., Yeh, H. R., & Chiou, C.-Y. (2009). The
effects of brand affect on female cosmetic users brand
loyalty in Taiwan. The Journal of American Academy of
Business, Cambridge, 14(2), 230-236.
[23] Dodds, W. B., Monroe, K. B., & Grewal, D. (1991).
Effects of price, brand, and store information on buyers'
product evaluations. Journal of marketing Research,
307-319.
[24] Schiffman, L. G., & Kanuk, L. L. (2000). Consumer
behavior, 7th. NY: Prentice Hall.
[25] Yang, Y. (2009). A study of purchase intention
behavior to consumers on innovation technology smart
phone in technology acceptance model and theory of
reason action. Unpublished master thesis, Nan Hua
University, Taiwan.
[26] Zeithaml, V. A. (1988). Consumer perceptions of price,
quality, and value: a means-end model and synthesis of
evidence. The Journal of Marketing, 2-22.
[27] MacInnis, D. J., Ambar G. Rao, and Allen M. Weiss.
(2002). Assessing when increased media weight of
real-world advertisements help sales. Journal of marketing
Research, 39(4), 391-407.
[28] Kamins, M. A., & Marks, L. J. (1991). The perception
of kosher as a third party certification claim in advertising
for familiar and unfamiliar brands. Journal of the Academy
of Marketing Science, 19(3), 177-185.
[29] Laroche, M., Kim, C., & Zhou, L. (1996). Brand
familiarity and confidence as determinants of purchase
intention: An empirical test in a multiple brand context.
Journal of Business research, 37(2), 115-120.
[30] Grewal, D., Krishnan, R., Baker, J., & Borin, N.
(1998). The effect of store name, brand name and price
discounts on consumer's evaluations and purchase
intentions. Journal of retailing, 74(3), 331-352.