Electronic Supplementary information (ESI) - rsc.org · Supporting information For Photocatalytic...
13
Supporting information For Photocatalytic reactivity tuning by heterometal and addenda metal variation in Lindqvist polyoxometalates Johannes Tucher a,b , Stefanie Schlicht b , Fabian Kollhoff b and Carsten Streb* a,b a Institute of Inorganic Chemistry I, Ulm University, Albert-Einstein-Allee 11, 89081 Ulm, Germany. [email protected] b Department Chemistry and Pharmacy, Friedrich-Alexander-University Erlangen- Nuremberg, Egerlandstr. 1, 91058 Erlangen, Germany. 1. Instrumentation NMR spectroscopy: 1 H- and 13 C-NMR spectroscopy was performed on a JEOL EX 270 NMR spectrometer or JEOL EX 400 spectrometer using deuterated solvents as internal standards. UV-Vis spectroscopy: UV-Vis spectroscopy was performed on a Shimadzu UV- 2401PC spectrophotometer or Varian Cary 50 spectrophotometer. All systems were used with standard cuvettes (d = 10.0 mm). FT-IR spectroscopy: FT-IR spectroscopy was performed on a Shimadzu FT-IR-8400S spectrometer. Samples were prepared as KBr pellets. Signals are given as wavenumbers in cm -1 using the following abbreviations: vs = very strong, s = strong, m = medium, w = weak and b = broad. Elemental analysis: Elemental analysis was performed on a Euro Vector Euro EA 3000 Elemental Analyzer. Flame atomic absorption spectroscopy: Flame atomic absorption spectroscopy (FAAS) was performed on a Perkin Elmer 5100 PC Atomic Absorption System. Electrospray ionization mass spectrometry: ESI-MS spectra were recorded on a Bruker Daltonics maXis ultra high resolution ESI-Time-Of-Flight MS. Spectra were obtained in negative-ion mode. Peaks were identified using simulated isotopic patterns created within the Bruker DataAnalysis software. Electronic Supplementary Material (ESI) for Dalton Transactions. This journal is © The Royal Society of Chemistry 2014
Transcript of Electronic Supplementary information (ESI) - rsc.org · Supporting information For Photocatalytic...

Supporting information For
Photocatalytic reactivity tuning by heterometal and addenda metal variation in Lindqvist polyoxometalates
Johannes Tuchera,b, Stefanie Schlichtb, Fabian Kollhoffb and Carsten Streb*a,b
aInstitute of Inorganic Chemistry I, Ulm University, Albert-Einstein-Allee 11, 89081 Ulm,
Germany. [email protected]
bDepartment Chemistry and Pharmacy, Friedrich-Alexander-University Erlangen-
Nuremberg, Egerlandstr. 1, 91058 Erlangen, Germany.
1. Instrumentation
NMR spectroscopy: 1H- and 13C-NMR spectroscopy was performed on a JEOL EX 270
NMR spectrometer or JEOL EX 400 spectrometer using deuterated solvents as internal
standards.
UV-Vis spectroscopy: UV-Vis spectroscopy was performed on a Shimadzu UV-
2401PC spectrophotometer or Varian Cary 50 spectrophotometer. All systems were
used with standard cuvettes (d = 10.0 mm).
FT-IR spectroscopy: FT-IR spectroscopy was performed on a Shimadzu FT-IR-8400S
spectrometer. Samples were prepared as KBr pellets. Signals are given as
wavenumbers in cm-1 using the following abbreviations: vs = very strong, s = strong, m =
medium, w = weak and b = broad.
Elemental analysis: Elemental analysis was performed on a Euro Vector Euro EA 3000
Elemental Analyzer.
Flame atomic absorption spectroscopy: Flame atomic absorption spectroscopy (FAAS) was performed on a Perkin Elmer 5100 PC Atomic Absorption System.
Electrospray ionization mass spectrometry: ESI-MS spectra were recorded on a
Bruker Daltonics maXis ultra high resolution ESI-Time-Of-Flight MS. Spectra were
obtained in negative-ion mode. Peaks were identified using simulated isotopic patterns
created within the Bruker DataAnalysis software.
Electronic Supplementary Material (ESI) for Dalton Transactions.This journal is © The Royal Society of Chemistry 2014

General remarks: All chemicals were purchased from Sigma Aldrich, ABCR or ACROS
and were of reagent grade. The chemicals were used without further purification unless
stated otherwise. (nBu4N)2[Mo6O19][S1] (nBu4N)4[-Mo8O26],[S1] and (nBu4N)4[V4O12][S2] were
prepared according to literature references.
2. Synthetic section:
Synthesis of compound 1: (nBu4N)3[VMo5O19]:Synthesis of compound 1 is a modification of the original synthesis reported by
Klemperer et al:[S1] (nBu4N)4[-Mo8O26] (0.242 g, 112 mol) and (nBu4N)4[V4O12] (0.677 g,
496 mol) are suspended in a N,N-dimethylformamide-water mixture (10 ml, 20:1, v:v).
After heating to 80°C, the solid materials dissolved and the solution colour intensified to
a deep yellow. At this point, 70 mg (1.3 mmol) ammonium chloride are added and the
solution is kept at 80°C for 2 h after which the colour had changed to light yellow and
slight precipitation was observed. After centrifugation, the yellow solution was
crystallized by diffusion of ethyl acetate, giving orange crystals of single-crystal XRD
quality as the only solid product. The crystals were washed with diethyl ether and dried
under vacuum. Yield: 90 mg, (57 mol32 % based on Mo).
Elemental analysis for C48H108N3VMo5O19 (Mw: 1562.02 g/mol) in wt.-% (calcd.): C 37.09
(36.91), H 7.15 (6.97), N 2.84 (2.69), V 2.62 (3.24), Mo 31.91 (31.16).
Characteristic IR bands (in cm-1): 2959 (m), 2874 (s), 1481 (vs), 1152 (m), 976 (s), 935
(s), 874 (s), 795 (s).
Characteristic UV-Vis signals (in acetonitrile): max,1 = 219 nm, = 1.70 x 10⁴ M-1 cm-1;
max,2 = 265 nm, = 1.41 x 10⁴ M-1 cm-1; max,3 = 332 nm, = 0.66 x 10⁴ M-1 cm-1; max,4 =
425 nm, = 1.12 x 10³ M-1 cm-1 (shoulder).
Synthesis of compound 2: (nBu4N)3[VW5O19]:Synthesis of compound 2 is a modification of the original synthesis reported by
Klemperer et al:[S3] Na2WO4 . 2 H2O (9.07 g, 27.5 mmol) and V2O5 (0.5 g, 2.75 mmol)
were dissolved in H2O (30 ml) by adding aqueous NaOH (6 M) dropwise and heating the
reaction mixture to 80°C. The resulted, clear solution was adjusted to pH 2.8 with HCl (6
M). After one hour heating the yellow solution was cooled to room temperature and
precipitated by adding nBu4NBr (5.87 g, 18.2 mmol). The lemon yellow product was
filtered off and washed several times with H2O (50 ml) and dried in the desiccator. Yield:
2.66 g (1.33 mmol, 24.2 % based on W).
Elemental analysis for C48H108N3VW5O19 (Mw: 2001.52 g/mol) in wt.-% (calcd.): C 29.07
(28.80), H 5.52 (5.44), N 2.12 (2.10), V 2.04 (2.55), W 45.31 (45.93).
Characteristic IR bands (in cm-1): 2960 (vs), 2872 (s), 1482 (vs), 1382 (m), 1152 (w), 952
(vs), 886 (m), 801 (vs).
Characteristic UV-Vis signals (in acetonitrile): max,1 = 217 nm, = 1.63 x 10⁴ M-1 cm-1;
max,2 = 265 nm, = 1.16 x 10⁴ M-1 cm-1; max,3 = 391 nm, = 2.43 x 10³ M-1 cm-1.
Synthesis of compound 3: (nBu4N)3Na[V2Mo4O19]:Na2MoO4 . 2 H2O (7.84 g, 32.4 mmol) and V2O5 (1.0 g, 5.50 mmol) were dissolved in H2O
(20 ml) by adding aqueous NaOH (6 M) dropwise and heating the reaction mixture to
80°C. The resulting solution was adjusted to pH 5.0 with HClaq (6 M). After two hours,
the pale orange solution was cooled to room temperature and precipitated by adding nBu4NBr (3.06 g, 9.49 mmol). The pale orange product was filtered off and washed
several times with H2O (50 ml) and dried in the desiccator. Yield: 4.60 g (2.99 mmol,
36.9 % based on Mo).
Elemental analysis for C48H108N3NaV2Mo4O19 (Mw: 1540.01 g/mol) in wt.-% (calcd.): C
37.04 (37.44), H 7.03 (7.07), N 2.70 (2.73), V 6.42 (6.62), Mo 24.79 (24.92), Na 1.38
(1.49).
Characteristic IR bands (in cm-1): 2960 (vs), 2872 (s), 1482 (vs), 1383 (m), 1152 (m),
978 (m), 933 (vs), 884 (m), 791 (vs).
Characteristic UV-Vis signals (in acetonitrile): max,1 = 224 nm, = 4.35 x 10⁴ M-1 cm-1;
max,2 = 258 nm, = 2.73 x 10⁴ M-1 cm-1; max,3 = 318 nm, = 1.20 x 10⁴ M-1 cm-1.
Synthesis of compound 4: (nBu4N)3Na[V2W4O19]:Na2WO4 . 2 H2O (6.46 g, 19.58 mmol) and V2O5 (1.0 g, 5.50 mmol) were dissolved in
H2O (20 ml) by adding aqueous NaOH (6 M) dropwise and heating the reaction mixture
to 80°C. The resulting solution was adjusted to pH 5.0 with HClaq (6 M). After one hour,
the orange solution was cooled to room temperature and precipitated by adding nBu4NBr
(6.0 g, 18.6 mmol). The orange product was filtered off and washed several times with
H2O (50 ml) and dried in the desiccator. Yield: 2.9 g (1.53 mmol, 31.3 % based on W).
Elemental analysis for C48H108N3NaV2W4O19 (Mw: 1891.61 g/mol) in wt.-% (calcd.): C
30.04 (30.48), H 5.73 (5.75), N 2.18 (2.22), V 5.29 (5.39), W 38.79 (38.87), Na 1.12
(1.22).
Characteristic IR bands (in cm-1): 2960 (vs), 2873 (s), 1482 (vs), 1383 (m), 1152 (w), 974
(m), 950 (vs), 886 (m), 804 (vs), 740 (m).
Characteristic UV-Vis signals (in acetonitrile): max,1 = 209 nm, = 2.55 x 10⁴ M-1 cm-1;
max,2 = 233 nm, = 1.58 x 10⁴ M-1 cm-1 (shoulder); max,3 = 366 nm, = 1.28 x 10⁴ M-1 cm-1
(plateau).
3. Electrospray ionization mass spectrometry (ESI-MS)
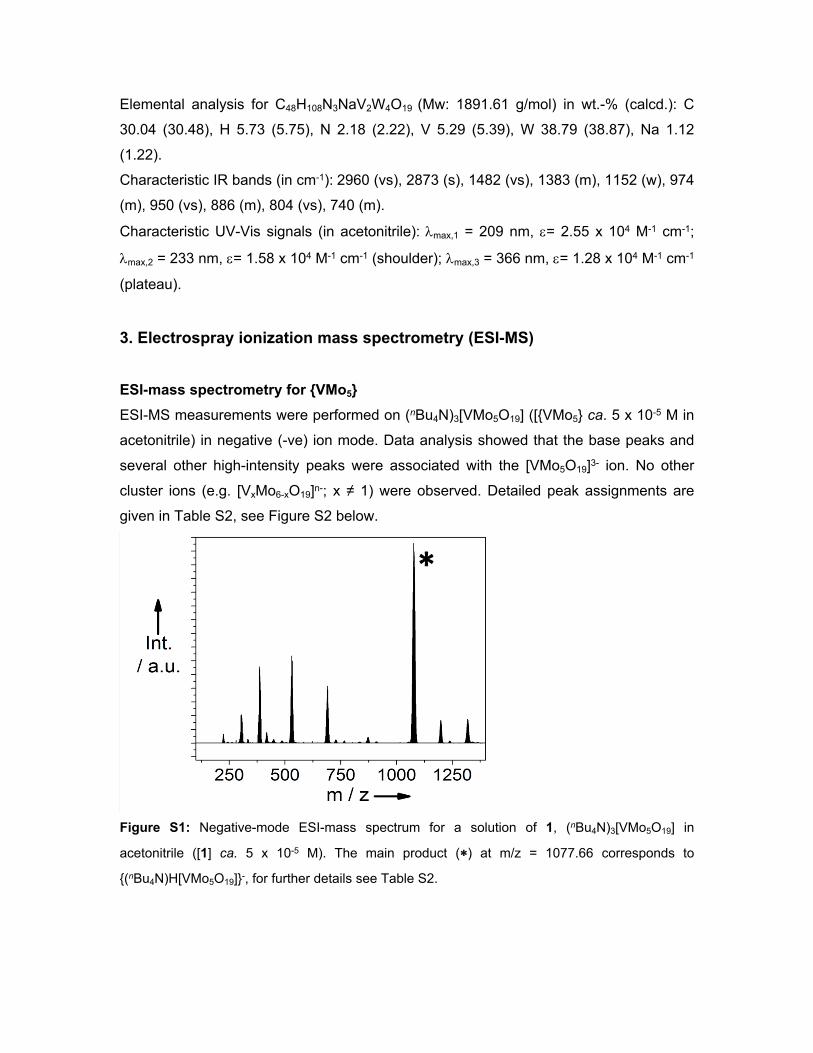
ESI-mass spectrometry for {VMo5} ESI-MS measurements were performed on (nBu4N)3[VMo5O19] ([{VMo5} ca. 5 x 10⁻⁵ M in
acetonitrile) in negative (-ve) ion mode. Data analysis showed that the base peaks and
several other high-intensity peaks were associated with the [VMo5O19]3- ion. No other
cluster ions (e.g. [VxMo6-xO19]n-; x ≠ 1) were observed. Detailed peak assignments are
given in Table S2, see Figure S2 below.
Figure S1: Negative-mode ESI-mass spectrum for a solution of 1, (nBu4N)3[VMo5O19] in
acetonitrile ([1] ca. 5 x 10⁻⁵ M). The main product (∗) at m/z = 1077.66 corresponds to
{(nBu4N)H[VMo5O19]}-, for further details see Table S2.
∗
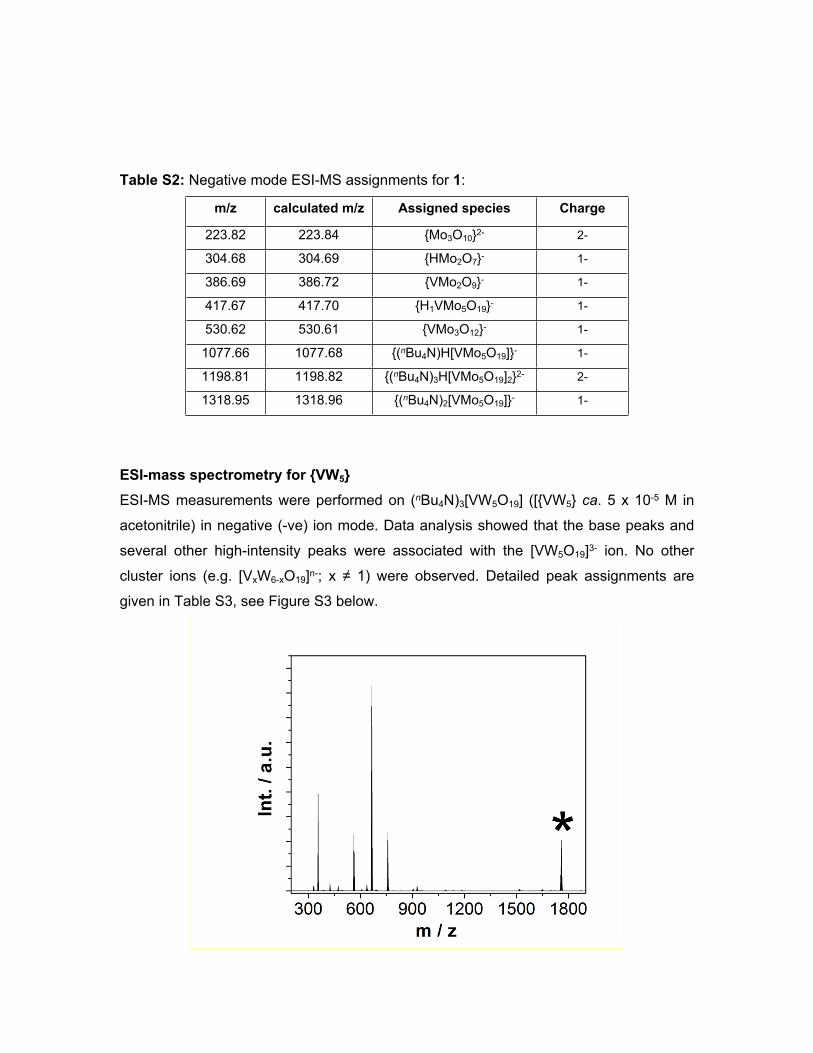
Table S2: Negative mode ESI-MS assignments for 1:
m/z calculated m/z Assigned species Charge
223.82 223.84 {Mo3O10}2- 2-
304.68 304.69 {HMo2O7}- 1-
386.69 386.72 {VMo2O9}- 1-
417.67 417.70 {H1VMo5O19}- 1-
530.62 530.61 {VMo3O12}- 1-
1077.66 1077.68 {(nBu4N)H[VMo5O19]}- 1-
1198.81 1198.82 {(nBu4N)3H[VMo5O19]2}2- 2-
1318.95 1318.96 {(nBu4N)2[VMo5O19]}- 1-
ESI-mass spectrometry for {VW5} ESI-MS measurements were performed on (nBu4N)3[VW5O19] ([{VW5} ca. 5 x 10⁻⁵ M in
acetonitrile) in negative (-ve) ion mode. Data analysis showed that the base peaks and
several other high-intensity peaks were associated with the [VW5O19]3- ion. No other
cluster ions (e.g. [VxW6-xO19]n-; x ≠ 1) were observed. Detailed peak assignments are
given in Table S3, see Figure S3 below.

Figure S2: Negative-mode ESI-mass spectrum for a solution of 2, (nBu4N)3[VW5O19] in
acetonitrile ([2] ca. 5 x 10⁻⁵ M). The main product (∗) at m/z = 1759.16 corresponds to
{(nBu4N)2[VW5O19]}-, for further details see Table S3.
Table S3: Negative mode ESI-MS assignments for 2:
m/z calculated m/z Assigned species Charge
355.87 355.90 {W3O10}2- 2-
562.77 562.80 {VW2O9}- 1-
665.81 665.80 {Na(H2O)2[VW5O19]}2- 2-
758.44 758.44 {(nBu4N)VW5O19}2- 2-
1759.15 1759.16 {(nBu4N)2VW5O19}- 1-
ESI-mass spectrometry for {V2Mo4}
ESI-MS measurements were performed on (nBu4N)3Na[V2Mo4O19] ([{V2Mo4} ca. 5 x 10⁻⁵
M in acetonitrile) in negative (-ve) ion mode. Data analysis showed that the base peaks
and several other high-intensity peaks were associated with the [V2Mo4O19]4- ion. No
other cluster ions (e.g. [VxMo6-xO19]n-; x ≠ 1) were observed. Detailed peak assignments
are given in Table S4, see Figure S4 below.
Figure S3: Negative-mode ESI-mass spectrum for a solution of 3, (nBu4N)3Na[V2Mo4O19] in
acetonitrile ([3] ca. 5 x 10⁻⁵ M). The main product (∗) at m/z = 1319.91 corresponds to
{(nBu4N)2H(MeCN)5Na(H2O)6[V2Mo4O19]}- for further details see Table S4.
Table S4: Negative mode ESI-MS assignments for 3:
m/zcalculated
m/zAssigned species Charge

384.69 384.71 {V1Mo2O9}- 1-
689.97 689.95 {(nBu4N)Mo3O10}- 1-
1319.91 1319.89 {(nBu4N)2H(MeCN)5Na(H2O)6[V2Mo4O19]}- 1-
ESI-mass spectrometry for {V2W4} ESI-MS measurements were performed on (nBu4N)3Na[V2W4O19] ([{V2W4} ca. 5 x 10⁻⁵ M
in acetonitrile) in negative (-ve) ion mode. Data analysis showed that the base peaks
and several other high-intensity peaks were associated with the [V2W4O19]4- ion. No
other cluster ions (e.g. [VxW6-xO19]n-; x ≠ 1) were observed. Detailed peak assignments
are given in Table S5, see Figure S5 below.
Figure S4: Negative-mode ESI-mass spectrum for a solution of 4, (nBu4N)3Na[V2W4O19] in
acetonitrile ([4] ca. 5 x 10⁻⁵ M). The main product (∗) at m/z = 1641.14 corresponds to
{(nBu4N)1H2(CH3OH)3(CH3CN)3(H2O)3[V2W4O19]}-, for further details see Table S5.
Table S5: Negative mode ESI-MS assignments:
m/z calculated m/z Assigned species Charge
330.85 330.87 {VWO6}- 1-
494.88 494.89 {(MeO)W2O6}- 1-
562.79 562.80 {VW2O9}- 1-
606.84 606.84 {(NH4)2(H2O)2V2W4O19}2- 2-
699.42 699.43 {(C4H12N)2(CH3CN)(CH3OH)(H2O)2V2W4O19}2- 2-
1641.09 1641.07 {(nBu4N)H2(CH3OH)3(CH3CN)3(H2O)2V2W4O19}- 1-

4. UV-Vis spectroscopic investigations
Figure S5: UV-Vis spectroscopic analysis of 1 - 4 in N, N-dimethyl formamide, showing
the tailing of the LMCT transitions into the visible region.
5. Photooxidation reactionsThe following mechanism is reported in the literature for the hydroxyl radical
mediated substrate photooxidation by polyoxometalate clusters (see references
1e, 3, 32, main manuscript).
Figure S6: Hydroxyl radical-mediated substrate photooxidation by polyoxometalate
clusters. Irradiation of a OM ligand to metal charge-transfer band leads to a charge-
separated state and formation of an oxo-centered radical on the cluster shell. Reaction
of the oxo radical with pre-associated water leads to hydrogen-atom abstraction and

hydroxyl radical formation. The hydroxyl radical dissociates from the cluster shell and
undergoes follow-up oxidative reactions.
Photooxidations were performed by dissolving 1 - 4 and indigo in N,N-dimethyl
formamide (DMF). Clear, homogeneous solutions were obtained. The solutions
were irradiated using LED light sources in custom-built irradiation setups.
Standard light source was a LED with max = 430 nm, Pnominal = 3 W. Standard
molar ratios were [Ind]0 : [1]0 – [4]0 = 5 : 1. Deaerated experiments were
performed by de-gassing the samples with Argon for 10 min prior to the
experiment. As blank references, identical samples as described above without
added photocatalyst 1 - 4 were used.
Figure S7: Photocatalytic aerated Ind decomposition catalyzed by 1 - 4. Conditions:
LED-irradiation, max = 430 nm, Pnominal = 3 W; N,N-dimethyl formamide (aerated). [Ind]0 =
5.0 µM; [1]0 – [4]0 = 1.0 µM. Ind = Indigo.

Figure S8: Photocatalytic de-aerated Ind decomposition catalyzed by 1 - 4. Conditions:
LED-irradiation, max = 430 nm, Pnominal = 3 W; N,N-dimethyl formamide; the de-aerated
samples were de-gassed with Ar for 10 min prior to the experiment. [Ind]0 = 5.0 µM; [1]0
– [4]0 = 1.0 µM. Ind = Indigo.
6. Quantum efficiency determinationQuantum efficiencies were determined using a custom-built irradiation and
quantum efficiency determination setup reported by König, Riedle et al., see
reference 18, main manuscript.
Figure S9: Quantum efficiencies for the Ind photooxidation by 1 to 4 as a function of
wavelength. Conditions: solvent: DMF, [Ind]:[cluster] = 1:1; [Ind]0 = 1.0 M, [cluster]0 = 1.0 M.
Ind = Indigo.

Table S6: Quantum efficiency determination for the indigo photooxidation by 1 - 4
/ nm {VMo5} / QE / % {VW5} / QE / % {V2Mo4} / QE / % {V2W4} / QE / %
395 0.2 0.5 0.73 0.68
400 0.19 0.35 0.45 0.4
410 0.15 0.2 0.3 0.28
430 0.13 0.11 0.17 0.14
450 0.11 0.05 0.09 0.09
465 0.1 0.04 0.08 0.08
505 0 0 0 0
7. Hydroxyl scavenging experiments
Figure S10: Photocatalytic indigo decomposition catalyzed by 1 - 4 in the presence of
ethanol (EtOH) under aerated conditions. Conditions: LED-irradiation, max = 430 nm,
Pnominal = 3 W; solvent: N,N-dimethyl formamide (DMF, aerated). [Ind]0 = 5.0 µM; [1]0 –
[4]0 = 1.0 µM, [EtOH]0 = 50 M. Ind = Indigo.

Figure S11: Photocatalytic indigo decomposition catalyzed by 1 - 4 in the presence of
ethanol (EtOH) under de-aerated conditions. Conditions: LED-irradiation, max = 430 nm,
Pnominal = 3 W; solvent: N,N-dimethyl formamide (DMF, de-aerated). [Ind]0 = 5.0 µM; [1]0
– [4]0 = 1.0 µM, [EtOH]0 = 50 M. Ind = Indigo.
8. Recyclability of 1 to 4
Figure S12: Recyclability of 1 - 4 as homogeneous indigo photooxidation catalysts under
aerated conditions. Run 1 to Run 3 were performed at [Ind]0 : [1]0 – [4]0 = 5 : 1. Conditions:
solvent: DMF (aerated), light source: monochromatic LED (max = 430 nm, Pnominal = 3 W).
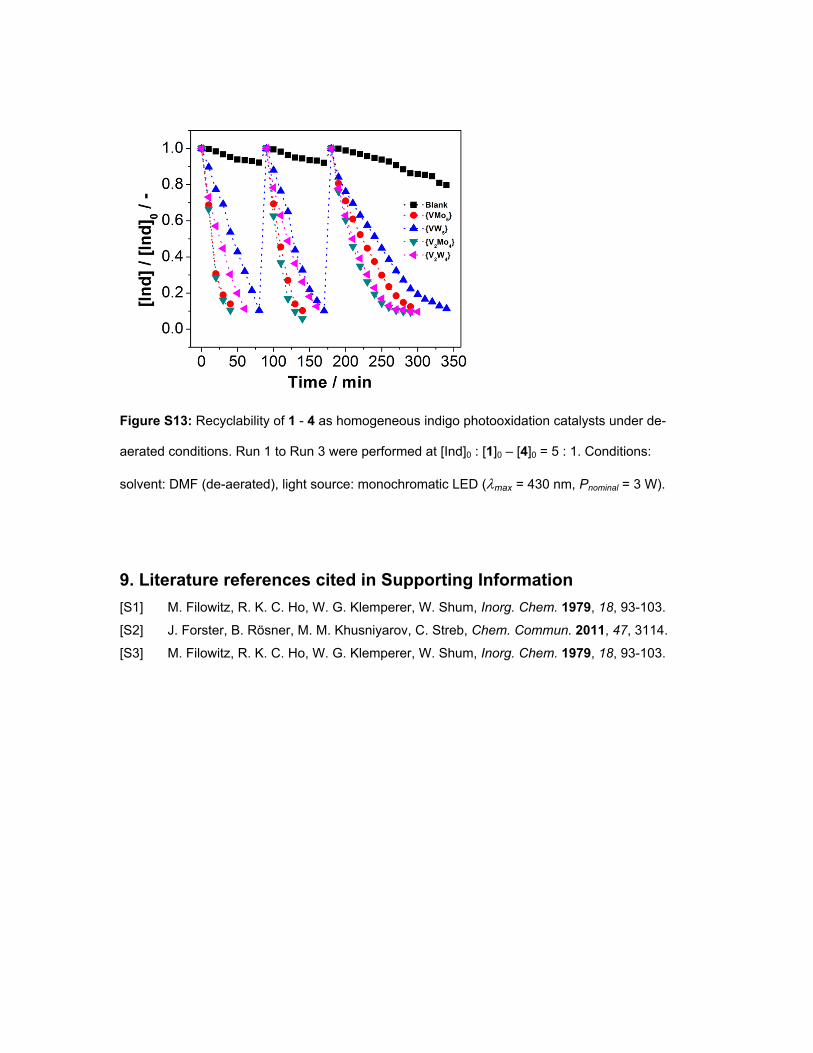
Figure S13: Recyclability of 1 - 4 as homogeneous indigo photooxidation catalysts under de-
aerated conditions. Run 1 to Run 3 were performed at [Ind]0 : [1]0 – [4]0 = 5 : 1. Conditions:
solvent: DMF (de-aerated), light source: monochromatic LED (max = 430 nm, Pnominal = 3 W).
9. Literature references cited in Supporting Information[S1] M. Filowitz, R. K. C. Ho, W. G. Klemperer, W. Shum, Inorg. Chem. 1979, 18, 93-103.
[S2] J. Forster, B. Rösner, M. M. Khusniyarov, C. Streb, Chem. Commun. 2011, 47, 3114.
[S3] M. Filowitz, R. K. C. Ho, W. G. Klemperer, W. Shum, Inorg. Chem. 1979, 18, 93-103.