Prof. Seppo Hentilä 14.3.2005 Finland’s German Policy in the framework of European Détente

Result presentation Q1/2020
29 May 2020, Seppo Kopsala, CEO / Lars Lindqvist, CFO

HighlightsJanuary – March 2020

Device segment affected by the pandemic
Market expansion to the USA has started
Software segmentperformance was solid due to the recurring revenue model
The outlook 2020 announced 19 March 2020 remains as-is
Hig
hlig
hts
Janu
ary
–M
arch
202
0
1.
2.
3.
4.
5.
Long term prospect remain stable in spite of the pandemic
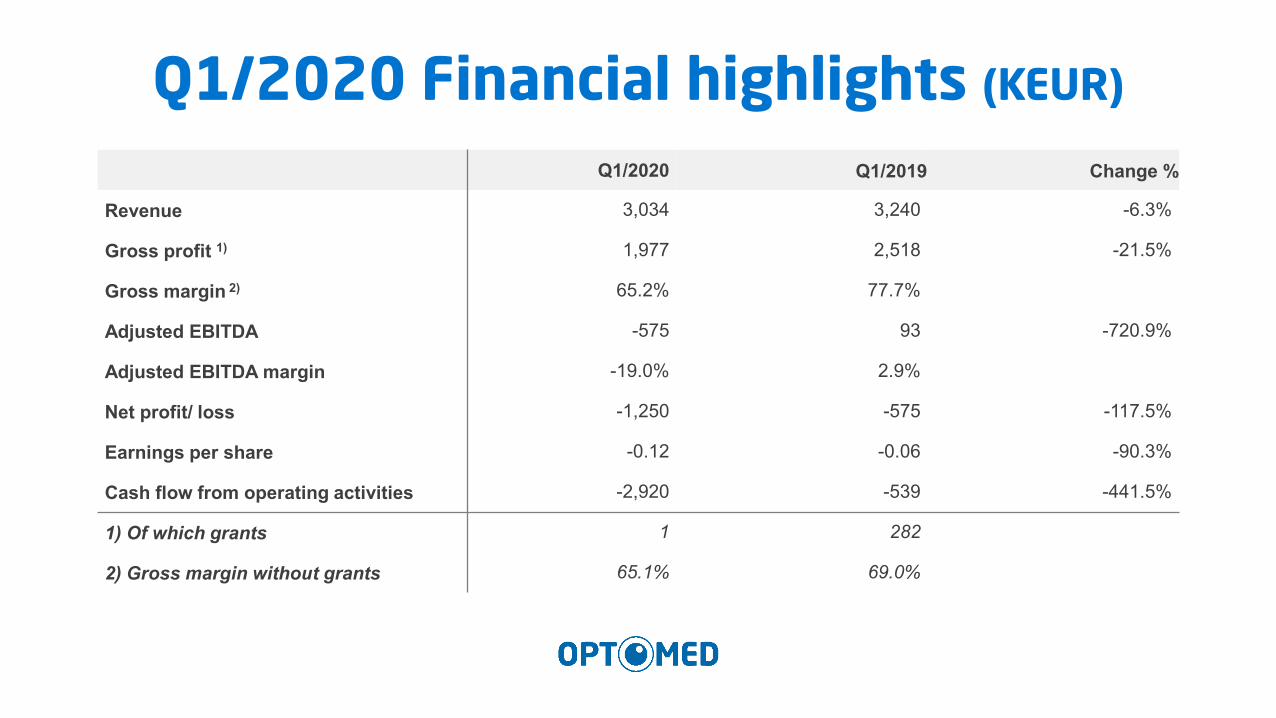
Q1/2020 Q1/2019 Change %
Revenue 3,034 3,240 -6.3%
Gross profit 1) 1,977 2,518 -21.5%
Gross margin 2) 65.2% 77.7%
Adjusted EBITDA -575 93 -720.9%
Adjusted EBITDA margin -19.0% 2.9%
Net profit/ loss -1,250 -575 -117.5%
Earnings per share -0.12 -0.06 -90.3%
Cash flow from operating activities -2,920 -539 -441.5%
1) Of which grants 1 282
2) Gross margin without grants 65.1% 69.0%
Q1/2020 Financial highlights (KEUR)

• COVID-19 Coronavirus outbreak has turned into a pandemic
• What does it mean to Optomed:
• Devices segment sales are affected whereas the Software sales areprotected by the recurring revenue model
• Precautions taken to protect its currently strong cash position:• temporary lay-offs• various other cost cuts
• Revenue expected to decrease as compared to 2019
• Recovery is expected to start from China by the end of the year
• Long term prospects remain solid
COVID-19 Coronavirus

USA market entry• Canadian medical devices license received for
Optomed’s handheld fundus camera• Previously, the similar medical devices
license (FDA) has been granted to the US market
• The Canadian registration now allows commercials activities throughout North America
• Optomed USA Inc established
• US-based Executive President Jean-ChristopheFirer engaged to lead the American operations
• The scope and speed of the market entry actionshave been adjusted to reflect the current COVID-19 market reality

Devices segment highlightsJanuary – March 2020

Gross margin decreased due to:• governmental grants of EUR 217
thousand received in 2019 • sourcing arrangements to protect
the manufacturing capability• increased OEM share of revenue
Revenue decreased mainly due tothe COVID-19 pandemic
EBITDA decreased due to lower revenue and gross margin. Theeffect was partly compensated by lower operating expensesD
evic
es s
egm
ent h
ighl
ight
s
1.
2.
3.
Q1/2020 Q1/2019 Change,%
Revenue 974 1,210 -19.5%
Gross profit 396 996 -60.2%
Gross margin 40.7% 82.2%
EBITDA -421 -233 80.6%
EBITDA margin -43.2% -19.3%

Software segment highlightsJanuary – March 2020

Software segment’s performance was solid in tough environment
Stable recurring business with the current customer base protected thesegment’s revenue
2019 gross margin included grants of EUR 65 thousandSo
ftwar
e se
gmen
t hig
hlig
hts
Q1/2020 Q1/2019 Change,%
Revenue 2,060 2,030 1.5%
Gross profit 1,581 1,523 3.8%
Gross margin 76.7% 75.1%
EBITDA 481 514 -6.4%
EBITDA margin 23.3% 25.3%
1.
2.
3.

Outlook 2020

Outlook 2020We continue to progress our expansion towards the US market and
grow our international distributor network. Additionally, we are currently investing in the development of our first fully integrated AI camera
with expected commercial launch during 2020.
Optomed expects its revenue to decline during 2020.
The COVID-19 pandemic has a negative effect on Optomed’sgrowth and business in 2020.
(Announced 19 March 2020)
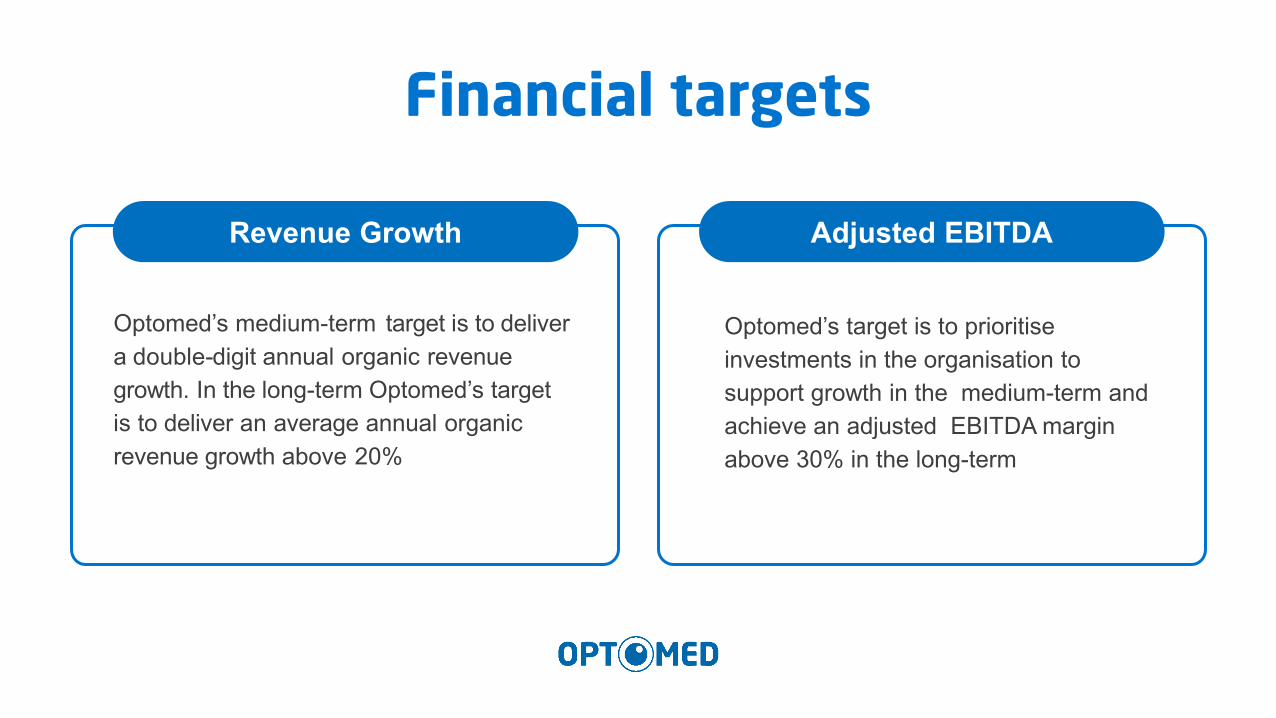
Financial targets
Optomed’s medium-term target is to delivera double-digit annual organic revenue growth. In the long-term Optomed’s target is to deliver an average annual organic revenue growth above 20%
Revenue Growth
Optomed’s target is to prioritiseinvestments in the organisation to support growth in the medium-term and achieve an adjusted EBITDA margin above 30% in the long-term
Adjusted EBITDA
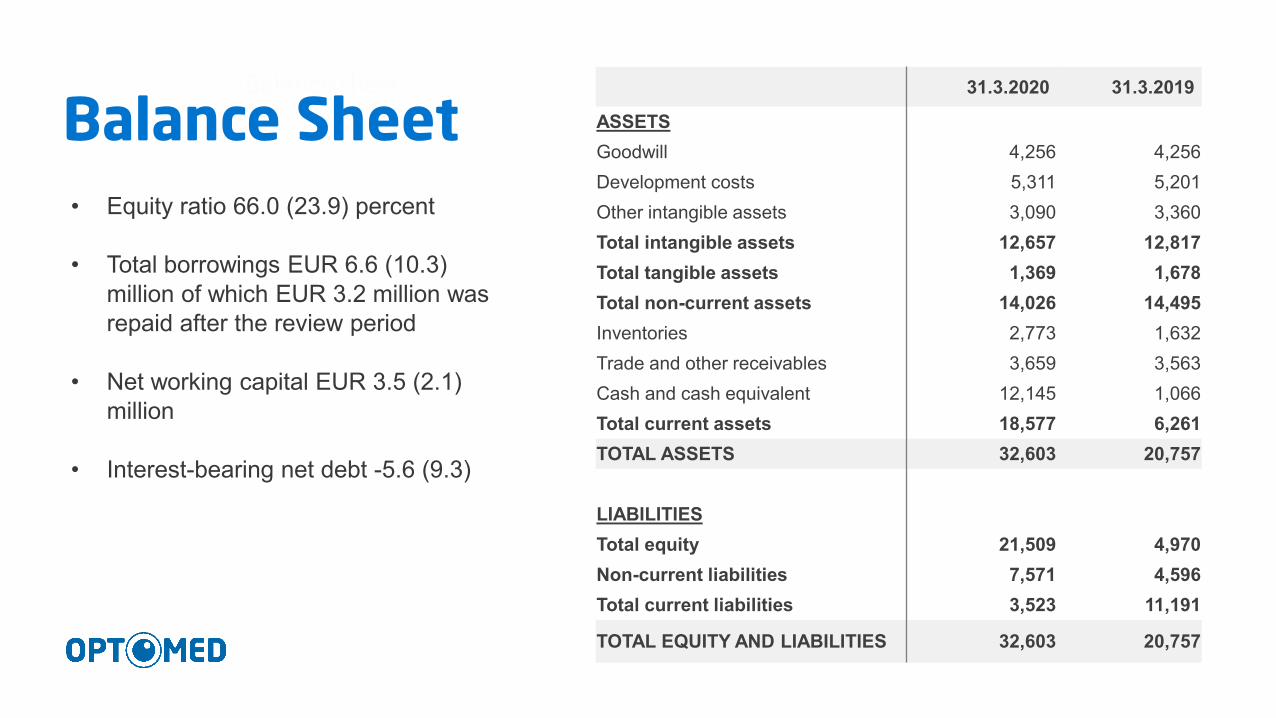
Balance sheet
Balance Sheet• Equity ratio 66.0 (23.9) percent
• Total borrowings EUR 6.6 (10.3) million of which EUR 3.2 million was repaid after the review period
• Net working capital EUR 3.5 (2.1) million
• Interest-bearing net debt -5.6 (9.3)
31.3.2020 31.3.2019
ASSETSGoodwill 4,256 4,256Development costs 5,311 5,201Other intangible assets 3,090 3,360Total intangible assets 12,657 12,817Total tangible assets 1,369 1,678Total non-current assets 14,026 14,495Inventories 2,773 1,632Trade and other receivables 3,659 3,563Cash and cash equivalent 12,145 1,066Total current assets 18,577 6,261TOTAL ASSETS 32,603 20,757
LIABILITIESTotal equity 21,509 4,970Non-current liabilities 7,571 4,596Total current liabilities 3,523 11,191
TOTAL EQUITY AND LIABILITIES 32,603 20,757

Cash Flow• Cash flow from operating activities
amounted to EUR -2.9 (-0.5) million of which the decrease in payables of EUR 2.4 million mainly relates to the previous year IPO fees and expenses that was concluded in late December
• Net cash from financing activities amounted to EUR -3,452 (-4) and are mainly related to loan restructuring.
Q1 2020 Q1 2019
Loss for the financial year -1,250 -575
Cash flows before change in net working capital -509 -24
Change in net working capital -2,212 -447
Cash flows before finance items -2,721 -470
Cash flows from finance items -199 -69
Net cash from operating activities -2,920 -539
Net cash used in investing activities -354 -399
Net cash from financing activities -3,452 -4
Net increase (decrease) in cash and cash equivalents -6,727 -942
Cash and cash equivalents at the beginning of period 18,866 2,000
Cash and cash equivalents at end of period 12,145 1,066

Optomed’smission is to prevent blindness by improving access to eye screening globally
Expansion into new geographical markets
Opening new customer segments: primary care
Bringing AI-integrated health screening to the market
“