
Electronic structure, magnetic ordering and phonons...
146
Electronic structure, magnetic ordering and phonons in molecules and solids Von der Fakult¨ at f¨ ur Chemie und Physik der TU Bergakademie Freiberg angenommene Habilitationsschrift zur Erlangung des akademischen Grades doctor rerum naturalium habilitatus Dr. rer. nat. habil. vorgelegt von Dr. rer. nat. Jens Kortus geboren am 1. Oktober 1967 in Potsdam eingereicht am 21. M¨ arz 2003 Gutachter: Prof. Dr. rer. nat. habil. Jochen Monecke,Freiberg Prof. Dr. rer. nat. Ole K. Andersen,Stuttgart Prof. Dr. rer. nat. habil. GotthardSeifert, Dresden Tag der Verleihung: 9. Dezember 2003
Transcript of Electronic structure, magnetic ordering and phonons...

Electronic structure, magnetic
ordering and phonons
in molecules and solids
Von der Fakultat fur Chemie und Physik
der TU Bergakademie Freiberg
angenommene
Habilitationsschrift
zur Erlangung des akademischen Grades
doctor rerum naturalium habilitatus
Dr. rer. nat. habil.
vorgelegt
von Dr. rer. nat. Jens Kortus
geboren am 1. Oktober 1967 in Potsdam
eingereicht am 21. Marz 2003
Gutachter: Prof. Dr. rer. nat. habil. Jochen Monecke, FreibergProf. Dr. rer. nat. Ole K. Andersen, StuttgartProf. Dr. rer. nat. habil. Gotthard Seifert, Dresden
Tag der Verleihung: 9. Dezember 2003

Contents
Preface 6
1 Introduction to DFT 7
1.1 Kohn-Sham equation . . . . . . . . . . . . . . . . . . . . . . . . . 81.2 The exchange-correlation energy . . . . . . . . . . . . . . . . . . 9
1.2.1 Local Spin Density Approximation: LSDA . . . . . . . . . 91.2.2 Generalized Gradient Approximations: GGA . . . . . . . . 10
1.3 Basis Set Expansion . . . . . . . . . . . . . . . . . . . . . . . . . . 101.4 NRLMOL implementation . . . . . . . . . . . . . . . . . . . . . . 11
1.4.1 Calculation of vibrational properties . . . . . . . . . . . . 13
2 Applications 15
2.1 The superconductor MgB � . . . . . . . . . . . . . . . . . . . . . . 152.1.1 Electronic structure . . . . . . . . . . . . . . . . . . . . . . 162.1.2 de Haas-van Alphen effect . . . . . . . . . . . . . . . . . . 182.1.3 Angle resolved photoemission spectroscopy . . . . . . . . 192.1.4 X-ray spectroscopy . . . . . . . . . . . . . . . . . . . . . . 212.1.5 What is special about MgB � ? . . . . . . . . . . . . . . . . . 21
2.2 Electric field gradients . . . . . . . . . . . . . . . . . . . . . . . . 222.3 Vibrational properties . . . . . . . . . . . . . . . . . . . . . . . . 25
2.3.1 Host guest interaction in a clathrate . . . . . . . . . . . . 252.3.2 Octanitrocubane . . . . . . . . . . . . . . . . . . . . . . . 272.3.3 Azidopentazole . . . . . . . . . . . . . . . . . . . . . . . . 30
2.4 Magnetic ordering . . . . . . . . . . . . . . . . . . . . . . . . . . 312.4.1 Magnetic and vibrational properties of the Fe ��� O � cluster . 312.4.2 Magnetic moment and anisotropy in Fe � Co � clusters . . . 33
2.5 Molecular magnets . . . . . . . . . . . . . . . . . . . . . . . . . . 352.5.1 Spin-orbit coupling and magnetic anisotropy energy . . . 362.5.2 Electronic structure of the Fe � magnet . . . . . . . . . . . 392.5.3 Magnetic anisotropy in single molecule magnets . . . . . . 422.5.4 The V ��� spin system . . . . . . . . . . . . . . . . . . . . . 46
3 Summary 51
3

CONTENTS
Bibliography 53
Appendices 62
A Kortus J., Mazin I.I., Belashchenko K.D., Antropov V.P., and Boyer L.L.
Superconductivity of metallic boron in MgB �Phys. Rev. Lett. 86, 4656-4659 (2001) 63
B Mazin I.I. and Kortus J.
Interpretation of the de Haas - van Alphen experiments in MgB �Phys. Rev. B 65, 180510-1/4 (R) (2002) 69
C Kurmaev E.Z., Lyakhovskaya I.I., Kortus J., Moewes A., Miyata N., Deme-ter M., Neumann M., Yanagihara M., Watanabe M., Muranaka T. andAkimitsu J.
Electronic structure of MgB � : X-ray emission and absorption studies
Phys. Rev. B 65 134509-1/4 (2002) 75
D Dietrich M., Kortus J., Cordts W. and Unterricker S.
Electric Field Gradients in Wurtzite - Type Semiconductors
phys. stat. sol. (b) 207, 13-17 (1998) 81
E Kortus J., Irmer G., Monecke J. and Pederson M.R.
Influence of cage structures on the vibrational modes and Raman activity
of methane
Modelling Simul. Mater. Sci. Eng. 8, 403-411 (2000) 87
F Kortus J., Pederson M. R. and Richardson S. L.
Density functional based prediction of the electronic, structural and vibra-
tional properties of the energetic molecule: Octanitrocubane
Chem. Phys. Lett. 322, 224-230 (2000) 99
G Kortus J., Richardson S. L. and Pederson M. R.
First-Principles DFT study of the structural, electronic and vibrational prop-
erties of azidopentazole
Chem. Phys. Lett. 340, 565-570 (2001) 107
H Kortus J. and Pederson M. R.
4

CONTENTS
Magnetic and vibrational properties of the uniaxial Fe ��� O � cluster
Phys. Rev. B 62, 5755-5759 (2000) 115
I Kortus J., Baruah T., Pederson M. R., Khanna S. N. and C. Ashman
Magnetic moment and anisotropy in Fe � Co � Clusters
Appl. Phys. Lett. 80, 4193-4195 (2002) 123
J Kortus J., Hellberg C. S., Pederson M. R. and Khanna S. N.
DFT studies of the molecular nanomagnet Fe � and the V ��� spin system
Eur. Phys. J. D 16, 177-180 (2001) 129
K Kortus J., Baruah T., Bernstein N., and Pederson M.R.
Magnetic ordering, electronic structure and magnetic anisotropy energy in
the high-spin Mn ��� single molecule magnet
Phys. Rev. B 66, 092403-1/4 (2002) 135
L Kortus J., Hellberg C. S. and Pederson M. R.
Hamiltonian of the V ��� Spin System from First-Principles Density-Functional
Calculations
Phys. Rev. Lett. 86, 3400-3403 (2001) 141
5
Preface
The present work gives an overview of the authors work in the field of elec-tronic structure calculations. The density functional theory (DFT) is the the-oretical background used for various applications from physics and chemistry.Therefore DFT is also the combining principle which joins the selected publi-cations of the author. The main objective is to show how electronic structuremethods can be used for the description and interpretation of experimental re-sults in order to enhance our understanding of physical and chemical propertiesof materials. DFT is a very powerful method in that respect, as recognized bythe Nobel prize in chemistry 1998.
This method has been successfully applied to many different classes of ma-terials and properties. In order to place the present work in a proper contexta brief introduction in the basics of DFT will be given. The main part of thework discusses the electronic structure of a few interesting examples. Todaythe electronic structure itself is an experimental property measured by angleresolved photo emission spectroscopy (ARPES), resonant inelastic X-ray scatter-ing or probed directly by the de Haas-van Alphen (dHvA) effect. The recentlyfound superconductor MgB � is an example where the electronic structure wasthe key to our understanding of the surprising properties of this material. Theexperimental confirmation of the predicted electronic structure from first prin-ciples calculations was very important for the acceptance of earlier theoreticalsuggestions.
The only input parameter to DFT is the atomic composition of the material,no further experimental information is required. Because it is possible to de-termine the forces acting on the atoms within the DFT, one can optimize theatomic postions, predict stable structures and calculate vibrational spectra. IRand Raman spectroscopy are widely used tools for materials characterizationand first principles electronic structure calculations deliver very important in-formation for interpreting these spectra. Not only vibrational frequencies butalso IR and Raman intensities can be calculated from DFT, as will be discussedin a few examples.
Molecular crystals build from magnetic clusters containing a few transitionmetal ions and organic ligands show fascinating magnetic properties at thenanoscale. DFT allows for the investigation of magnetic ordering and magneticanisotropy energies. The magnetic anisotropy which results mainly from thespin-orbit coupling determines many of the poperties which make the singlemolecule magnets interesting. Some recent results of the author in this fieldwill be given.
6
Chapter 1
Introduction to DFT
Molecules and solids are complicated many-particle systems which are in prin-ciple described by the corresponding Schrodinger equation. Unfortunately, an-alytic solutions are available only for a few very simple systems [1], and evennumerically exact solutions are limited to a small number of atoms or electrons.Therefore one is forced to find accurate approximations in order to describe realmaterials. The density-functional theory is one of the most successful methodsin that respect.
Within the scope of this work we will give only a brief introduction to thebasic foundations of density functional theory [2, 3]. There are excellent re-views available on that topic [4–8] which will give much more insight in thetheoretical basics, accuracy and limitations than this short overview.
In principle electrons and atomic nuclei can be treated at the same theoret-ical basis, although the problem can be simplified by decoupling the electronicand nuclear degrees of freedom. In many cases it is very appropriate to assumethat electronic and nuclear dynamics take place at different time scales and cantherefore be separated. This approach called Born-Oppenheimer approxima-tion considers all nuclei as fixed in space during the electronic relaxation.
The stationary Schrodinger equation of a system consisting of
electronsis given by:�� ����� ��� �������� �����! #" �%$ � � �'&�� ( �)+*-, �/. " � � " � . �103254 �" �769898:8:6 " $<;>=
(1.1)
where �! #" �%$<; � ��� ? � ( �)+*-, �/. @ � � " � . (1.2)@ � and ? � are the coordinates and atomic numbers of the nuclei. The spin vari-ables have been omitted for clarity (or the
" �could be interpreted as generalized
coordinates which include the spin degrees of freedom too). From here on wewill use atomic units (1 Hartree = 27.2116 eV, 1 ACB =0.529177 A).
7

CHAPTER 1. INTRODUCTION TO DFT
The most important observation for a non-degenerate ground state of thismany-electron system is, that the total energy can be expressed as a uniquefunctional of the electron density D �" $ [2], which is determined solely by thelocations @ � of the nuclei.0FEHGIE ;KJ �MLND #" $PO �RQ d
" D �" $ �� #" $ � 0TS LUD �" $PO � 0FVXW LND #" $YO (1.3)
where Z S LND #" $PO�;\[� Q d" D �" $ Z S #" $�;][� Q<Q d
"d"_^ D �" $ D #" ^ $. " � " ^ . (1.4)J �MLND #" $YO is the kinetic energy of a non-interacting electron gas with density D �" $ ,0TS
is the Hartree energy due to the average electrostatic interaction of theelectrons.
0FVXW LUD �" $YO is the exchange-correlation energy, which is in general anunknown functional of the electron density. The potential
�� �" $for an interact-
ing
-electron system is defined as a general external potential. The knowledgeof the ground state density D �" $ determines the external potential within an ir-relevant constant. The initial proof of the above statement given by Hohenbergand Kohn in 1964 [2] has been extended also to the lowest state of each sym-metry [9], degenerate ground states [7] or spin density functional theory [8].
1.1 Kohn-Sham equation
The ground state density must give the lowest energy by definition. This al-lows to use the variational principle in order to obtain the ground state energy.Instead of using the electron density directly, Kohn and Sham [3] suggestedto represent the electron density in terms of single particle orbitals ` �ba . Mini-mization of the total energy functional (1.3) with the constraint that the singleparticle orbitals fulfill a normalization condition leads to the Kohn-Sham equa-tion: c � � � � �! #" $ � Z S LUD �" $PO � Z aVXW LND+d #" $ 6�D+e #" $POHf ` �bag; , �ih a ` �ba 6 (1.5)Z aVXW LUD+d �" $ 6jD+e �" $POk;ml 0nVXW LUD+d �" $ 6jD+e �" $POl D a #" $ 6 (1.6)D �" $<; D+d �" $ � D+e �" $�; �H�ih apo �q � , �rh as$ . ` �ba . � 8 (1.7)
Here t is the u -component of the spin variable and the external potential�� �" $
is due to the nuclei. The step functiono �q � , �rh as$
ensures that all Kohn-Shamorbitals with
, �rh awv qare occupied and the chemical potential
qis defined by
conservation of charge Q d" D #" $�; 8 (1.8)
8
1.2. THE EXCHANGE-CORRELATION ENERGY
Equation (1.5) is a significant simplification compared with the initial manyelectron problem (1.1), because it presents a single particle equation. The origi-nal interacting electron system has been replaced by a system of non-interactingelectrons in an effective potential. However, all the difficulties are conserved inthe exchange correlation functional
0TVXWwhich is not explicitely known.
It should be noticed, since the functionals in (1.5) depend on the electrondensity and thus on the Kohn-Sham orbitals themselves, the Kohn-Sham equa-tion has to be solved self-consistently until input and output densities are iden-tical.
1.2 The exchange-correlation energy
The only unknown quantity is the exchange-correlation energy and many ef-forts are devoted to seek approximations for this functional. Different function-als have been proposed and today several functionals exist which give excellentresults for most molecular and solid properties.
While
0nVXWis often only a small fraction of the total energy of an atom,
molecule or solid it is an important contribution to the chemical bonding en-ergy or atomization energy. The exchange-correlation energy is the glue, with-out most matter would bind only very weakly. Therefore, very accurate ap-proximations of
0FVXWare essential in order to obtain reliable results from DFT
calculations.
1.2.1 Local Spin Density Approximation: LSDA
The most widely used approximation in the past has been the local spin densityapproximation (LSDA)0nVXW LND+d #" $ 6�D+e #" $POx; Q d
" D �" $ , VXW D+d �" $ 6jD+e �" $j$ (1.9)
where, VXW D+d �" $ 6�D+e �" $j$ is the exchange and correlation energy of a homogenous
electron gas of the corresponding spin densities. The exchange-correlation en-ergy for a uniform electron gas is known with great accuracy ( y 0.1 %) andcan be obtained by Quantum Monte-Carlo simulations [10,11] for various val-ues of the spin densities which are then parameterized. Among others, differ-ent parameterizations for
, VXW D+d �" $ 6�D+e �" $j$ have been given by Gunnarsson andLundqvist [9], von-Barth and Hedin [12], Vosko et al. [13], and Perdew andZunger [14]. This approximation is based on the assumption of slowly vary-ing densities, which is unfortunately not fulfilled in most molecules or solids.Surprisingly, LSDA has been shown to give satisfactory results for equilibriumbond lengths (1% too short), elastic constants and vibrational properties. The
9
CHAPTER 1. INTRODUCTION TO DFT
main weakness is the well known tendency to overbind, that means to over-estimate the total energies of condensed matter compared with their atomicconstituents. For example it has been shown for 20 selected molecules, thatthe mean absolute error of the atomization energies has a value of 1.3 eV [15].Similarly, energy barriers are calculated too small.
1.2.2 Generalized Gradient Approximations: GGA
The best energy functionals or potentials used currently depend on the spindensities, their gradients and their second derivatives. The most common ap-proximations for the gradient corrected functionals have been developed byPerdew and coworkers [15,16] and Becke, Lee, Yang and Parr [17,18]. This isstill an area of active research in order to achieve the goal of chemical accuracy
( y 50 meV for atomization energies).GGA normally improves significantly on energy barriers or atomization en-
ergies. The average absolute error of the atomization energies for the same 20molecules as mentioned before reduces to 0.3 eV [15]. The bond lengths showsimilar accuracy as the ones obtained from LSDA with 1% accuracy, althoughthe bond lengths are now too long compared with experiment. Some extensivetests of GGA functionals can be found in [6,15,16].
1.3 Basis Set Expansion
In order to make further progress one has to expand the Kohn-Sham orbitalsin terms of a basis set. A straight-forward approach would be the solutionof the numerical problem on a real space mesh without any restrictions. TheDMOL
�code [19] follows this approach and uses numerical functions on an
atom-centered grid as its atomic basis. The atomic basis functions are obtainedfrom solution of the DFT equations for individual atoms and are stored as setsof cubic spline.
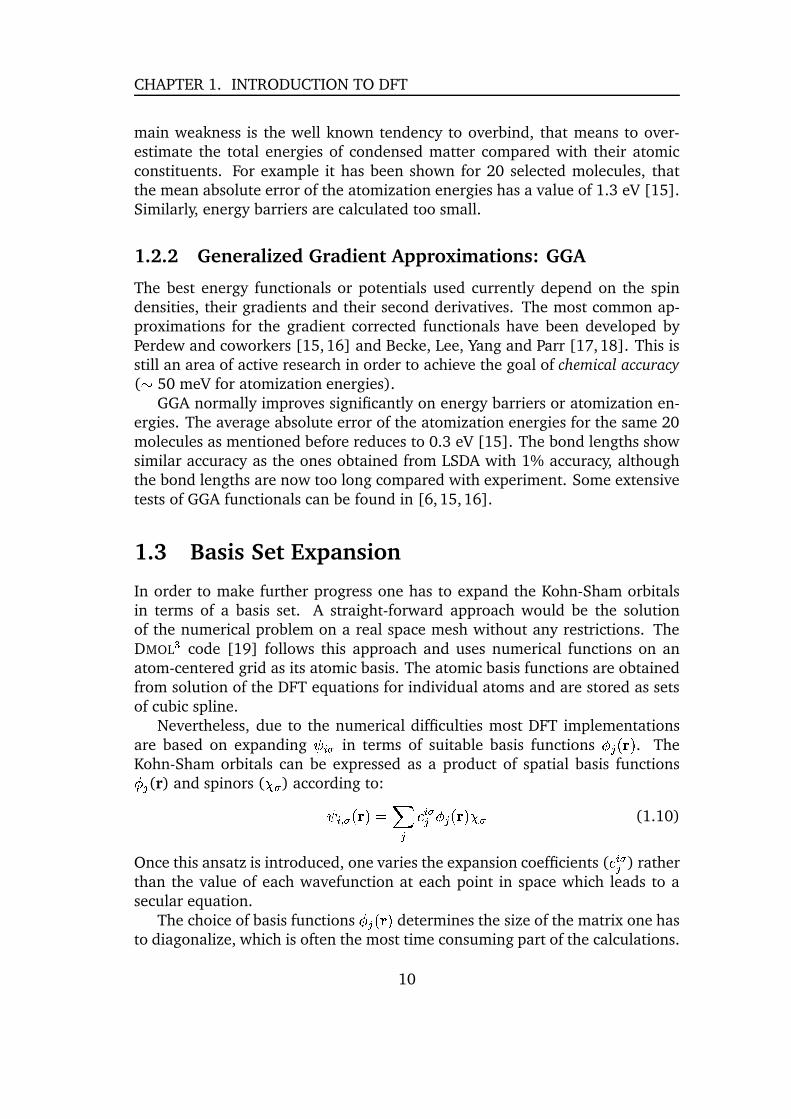
Nevertheless, due to the numerical difficulties most DFT implementationsare based on expanding ` �za in terms of suitable basis functions { � #" $ . TheKohn-Sham orbitals can be expressed as a product of spatial basis functions{ � (r) and spinors ( | a ) according to:` �rh a �" $�; �}��~ �ba� { � �" $ | a (1.10)
Once this ansatz is introduced, one varies the expansion coefficients (~ �ba�
) ratherthan the value of each wavefunction at each point in space which leads to asecular equation.
The choice of basis functions { � #" $ determines the size of the matrix one hasto diagonalize, which is often the most time consuming part of the calculations.
10
1.4. NRLMOL IMPLEMENTATION
All-electron approaches consider both core and valence electrons explicitely.The strongly localized core electrons consequently require strongly localizedbasis functions such as linearized augmented plane waves (LAPW) [20] or lin-earized muffin-tin orbitals (LMTO) [21], Slater-type orbitals [22] or Gaussian-type orbitals (GTO) [22–28]. Pseudopotentials, which effectively project outthe core states from the problem, allow for the use of plane waves as basisfunctions. Plane waves are numerically very easy to handle but result in ratherlarge basis sets. The use of intelligible and numerical efficient basis functionsis crucial for the development of the DFT method. The best suited basis shouldbe chosen based on the problem to solve, but is more often dictated by theavailability of a certain program package.
Many algorithms for the solution of the above equations exist, and the al-gorithm that one uses depends rather strongly on the form of the spatial basisfunctions that are used.
1.4 NRLMOL implementation
The Naval Research Laboratory Molecular Orbital Library (NRLMOL) programis an all-electron Gaussian-type orbital implementation of DFT [29–38]. Be-cause the author spent a large fraction of his time working on and using ex-tensively the NRLMOL program package developed by Pederson, Jackson andPorezag it seems suitable to give some details on this particular numerical im-plementation.
The molecular orbitals were expanded as linear combinations of Gaussianfunctions centered at the atomic sites. The multicenter integrals required in thesolution of the Kohn-Sham equation are calculated by integrating numericallyover a mesh of points [30]. Many LSDA and GGA functionals are available. Oneimportant feature is a very efficient parallelization which allows for calculationsof more than 100 atoms at the all-electron level, which becomes important incase of the molecular magnets discussed later in this work. Here the parallelversion will not be discussed , please see Ref. [38] for more information.
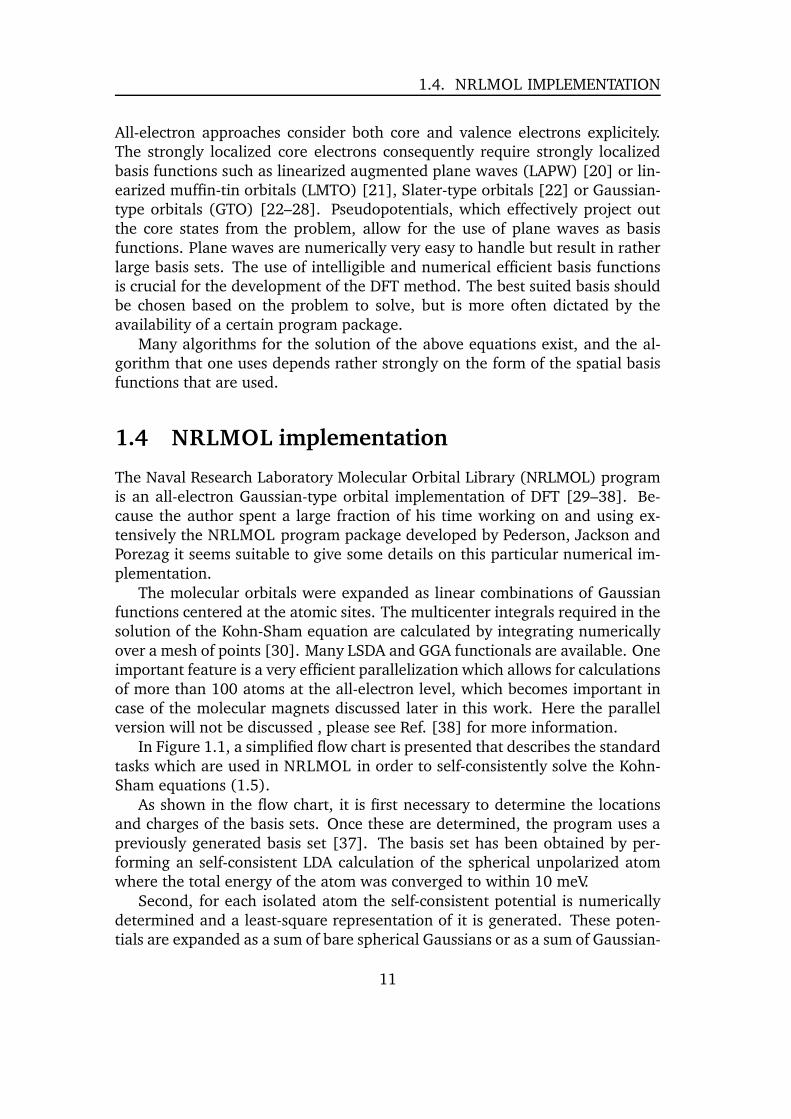
In Figure 1.1, a simplified flow chart is presented that describes the standardtasks which are used in NRLMOL in order to self-consistently solve the Kohn-Sham equations (1.5).
As shown in the flow chart, it is first necessary to determine the locationsand charges of the basis sets. Once these are determined, the program uses apreviously generated basis set [37]. The basis set has been obtained by per-forming an self-consistent LDA calculation of the spherical unpolarized atomwhere the total energy of the atom was converged to within 10 meV.
Second, for each isolated atom the self-consistent potential is numericallydetermined and a least-square representation of it is generated. These poten-tials are expanded as a sum of bare spherical Gaussians or as a sum of Gaussian-
11
CHAPTER 1. INTRODUCTION TO DFT
Figure 1.1: Flow chart of parallel version of NRLMOL. The gray area representsthe iterative part of the self-consistency cycle which is the computationally in-tensive part of the problem. The stars on the boxes represent the tasks whichare massively parallelized.
screened
[_�s�potentials.
Given the basis sets and the Gaussian-representation of the atomic poten-tials, it is possible to obtain very good insight into the class of multicenter in-tegrands that need to be integrated, and this information is used to generatea numerical variational integration mesh [30] that allows to precisely deter-mine integrals required for calculation of secular matrices, total energies andderivatives according to: � ; Q d
"M�� #" $<; ���>�� �" ��$����(1.11)
where
���is the volume associated with point
" �. Once the variational mesh is
determined the calculation starts. Errors arising from the numerical integra-tion can easily be checked and controlled by adjusting a few parameters whichcontrol the mesh construction.
For a new problem, a guess of the Hamiltonian matrix or self-consistentwavefunctions is not available so one relies on the least-square fit representa-
12
1.4. NRLMOL IMPLEMENTATION
tion of overlapping atomic potentials to determine a starting Hamiltonian. Oncethe wavefunctions are determined, by solution of Poissons equation it is possi-ble to calculate the potential due to these wavefunctions. Further, the Coulombpotential due to the electrons and the nuclei as well as the exchange-correlationenergy density and potentials are required. The exchange-correlation term re-quires the evaluation of spin densities and the first and second derivatives of thespin densities for GGA. The solution of the Kohn-Sham equation (1.5) for thatpotential determines the new wavefunctions. The equations are then solvedself-consistently by iterating until the total energy is converged to a
qHartree.
The number of iterations required to reach self-consistency can be signifi-cantly decreased by using sophisticated mixing of input and output potentialswhich were originally proposed by Broyden and others. We use the Broydenalgorithm of Johnson in our calculations [39].
Once self-consistency is achieved the forces acting on each atom are de-termined from the Hellmann-Feynman-Pulay theorem. [40] The determinationof the Hellmann-Feynman force is relatively inexpensive but the Pulay forceis computationally intensive for Gaussian-orbital methods. After obtaining allthe forces acting on all the atoms a conjugate-gradient method, or other force-based algorithms, can be used to determine a new set of atomic coordinates.Once a new set of atomic coordinates is determined we find that the wavefunc-tion expansion coefficients provide the best starting point for a calculation onthis geometry. Once an equilibrium geometry and Kohn-Sham wavefunctionsare determined there are many physical observables which one might be in-terested in calculating. These include local, total and joint electronic densitiesof states, polarizabilities, vibrational frequencies, infrared and Raman spectra,magnetic moments, charge states, magnetic anisotropy energies, and potentialand density contour plots.
1.4.1 Calculation of vibrational properties
The forces are derivatives of the total energy with respect to the nuclear co-ordinates and can be computed easily from the Hellman-Feynman theorem in-cluding the Pulay corrections [31, 40]. The Pulay corrections arise from thedependence of the basis functions on the nuclear coordinates. This correctionis particularly important in cases of atomic centered basis sets like the one usedin NRLMOL, in contrast to a plane wave basis set where the Pulay correctionvanishes. Accurate forces are an requirement for computing the vibrationalfrequencies. NRLMOL calculates the vibrational modes in the harmonic ap-proximation, using a finite difference scheme of the atomic forces to build thedynamical matrix [35]. The vibrational frequencies are calculated by directdiagonalization of the dynamical matrix. This matrix is constructed by takingfinite differences of both positive and negative displacements (0.05 a.u.) of the
13

CHAPTER 1. INTRODUCTION TO DFT
coordinates of each atom near the equilibrium geometry and calculating theforces for each corresponding geometry. The symmetry of the cluster will beused, so that only non-equivalent geometries have to be calculated. Using thisapproach NRLMOL computes on average frequencies within 3% of the experi-mental ones, where LDA give harder and GGA softer modes.
The IR and Raman intensities are a response of the matter to an electricfield. This can be described in the Kohn-Sham equation (1.5) by introducing anadditional potential due to a spatially uniform, static external electric field GZ
ext
; � ( "��+� 8 (1.12)
For finite systems like molecules it is straightforward to include an externalfield. The external potential
Zext will in general lower the point group symmetry
of the molecule, which will be the only change required. This is different in caseof infinite systems with periodic boundary conditions, because
Zext breaks the
translational invariance.The electric dipole moment
qand polarizability � �N� of a molecule can be
defined through derivatives of the total energy with respect to the externalelectric field. q �!; ��� 0�k� �}����z��� � (1.13)
and � �N�n; � � � 0�k� � �k� � ���� ��� � ; � q ��k� � ���� ��� � 8 (1.14)
The electric field derivatives are computed by finite differences using
l � �=
0.005 a.u. which yields well converged values of derivatives [35]. The usedfield strength corresponds to 2.6 10 � V/m, which is about two orders of magni-tude larger than strong laboratory fields. Despite the fact that the applied fieldsare much larger than the experimental ones, the change in total energy is stillvery small on the order of 0.3 meV. Obtaining accurate results for IR and Ramanintensities thus requires very well converged and accurate total energies.
The IR intensity depends on the change of the dipole moment and the Ra-man activity on the change of the polarizability with the atomic motions of thecorresponding vibrational mode. Consequently, for a vibrational mode to beIR active, the dipole moment of the molecule must change as a result of thedisplacements. The polarizability can be related to the volume of the molecule,therefore modes that change the molecular volume tend to be Raman active.Very high numerical accuracy is needed for Raman activities, because Ramanintensities involve second derivatives.
IR intensities calculated using the GGA functionals show 10-20% deviationsfrom experimental data, weak modes are in general reproduced in correct ex-perimental order. Strong Raman active modes are calculated with an accuracyof 20-30%.
14
Chapter 2
Applications
The electronic structure is a key to our understanding of chemical bonding,structural and elastic properties, vibrational spectra, electric field gradients,hyperfine fields or magnetic properties and many more.
The following sections present a few selected examples of the authors work.By using these examples the author intends to show how electronic structurecalculations can be used in order to obtain a better understanding of physicaland chemical properties of matter. The division into the different sections issomewhat arbitrary because many examples belong to more than one section.
2.1 The superconductor MgB �The announcement of the discovery of superconductivity in MgB � with a criti-cal temperature of 39 K by Akimitsu at a conference in Japan in January 2001was a great surprise for the scientific community [41]. Several hundreds pa-pers on that single material appeared in only two years, nearly all possibleexperimental methods have been applied, which makes MgB � one of the bestcharacterized materials. Many of its physical properties showed surprising fea-tures which called for theoretical investigation. Now, only two years later manyof the unexpected physical properties, in particular the relatively high criticaltemperature, are well understood. This is quite different from the case of high-temperature superconductors where more than one decade after their discoveryno consensus on the mechanism exists [42,43].
The simple hexagonal unit cell with only one Mg- and two B-atoms allowsfor first-principles calculations without any limiting assumptions. The key forour understanding was given by the calculation of the electronic structure [44–46], which is in excellent agreement with experimental data obtained fromde-Haas-van-Alphen [47] or ARPES measurements [48]. Nearly all key ideasin that field have been suggested from this kind of simulations and were thenexperimentally confirmed.
15

CHAPTER 2. APPLICATIONS
Γ M K Γ A L−15
−10
−5
0
5
10
Ene
rgy
(eV
)
Σ Λ ∆
Figure 2.1: Bandstructure of MgB � with the B � -character. The radii of the red(black) circles are proportional to the B
*(B t ) character.
MgB � occurs in the so-called AlB � structure. Borons form a primitive honey-comb lattice, consisting of graphite-type sheets stacked with no displacement.The borons form hexagonal prisms with the base diameter of 3.5A nearly equalto the height. This creates large, nearly spherical pores for Mg. As in graphite,the intraplanar B-B bonds are much shorter than the distance between theplanes, and hence the B-B bonding is strongly anisotropic.
2.1.1 Electronic structure
The energy bands and Fermi surface of MgB � are shown in Figure 2.1 and 2.2and discussed in detail in Appendix A. One finds that there are no Mg states atthe Fermi level. In fact, one can say that Mg is fully ionized in this compound,however the electrons donated to the system are not localized on the anion, butrather are distributed over the whole crystal. The resulting band structure canbe easily understood in terms of the boron sublattice. If the boron sublatticeaccepts the two valence electrons from the Mg atom it becomes formally isova-lent to graphene sheets. As expected, the bands are therefore quite similar to
16
2.1. THE SUPERCONDUCTOR MGB �
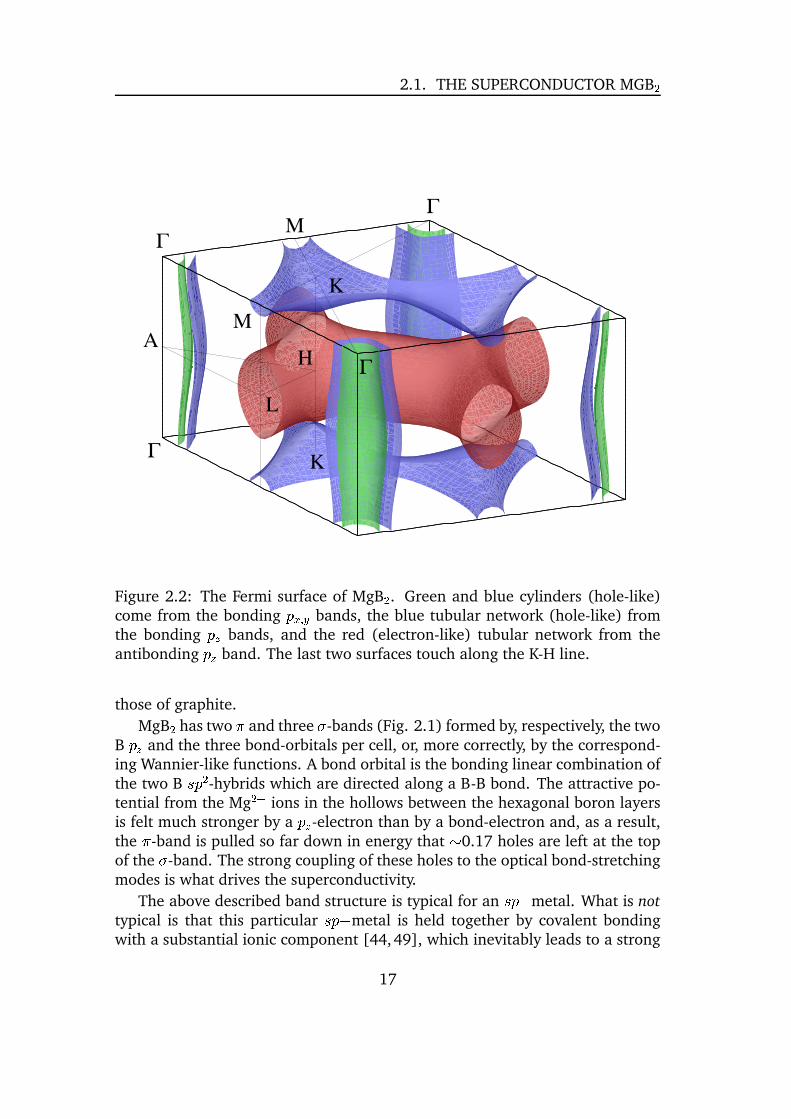
Figure 2.2: The Fermi surface of MgB � . Green and blue cylinders (hole-like)come from the bonding � V h � bands, the blue tubular network (hole-like) fromthe bonding ��� bands, and the red (electron-like) tubular network from theantibonding ��� band. The last two surfaces touch along the K-H line.
those of graphite.
MgB � has two*
and three t -bands (Fig. 2.1) formed by, respectively, the twoB ��� and the three bond-orbitals per cell, or, more correctly, by the correspond-ing Wannier-like functions. A bond orbital is the bonding linear combination ofthe two B ��� � -hybrids which are directed along a B-B bond. The attractive po-tential from the Mg
�P�ions in the hollows between the hexagonal boron layers
is felt much stronger by a �k� -electron than by a bond-electron and, as a result,the
*-band is pulled so far down in energy that y 0.17 holes are left at the top
of the t -band. The strong coupling of these holes to the optical bond-stretchingmodes is what drives the superconductivity.
The above described band structure is typical for an �j� � metal. What is not
typical is that this particular �j� � metal is held together by covalent bondingwith a substantial ionic component [44,49], which inevitably leads to a strong
17
CHAPTER 2. APPLICATIONS
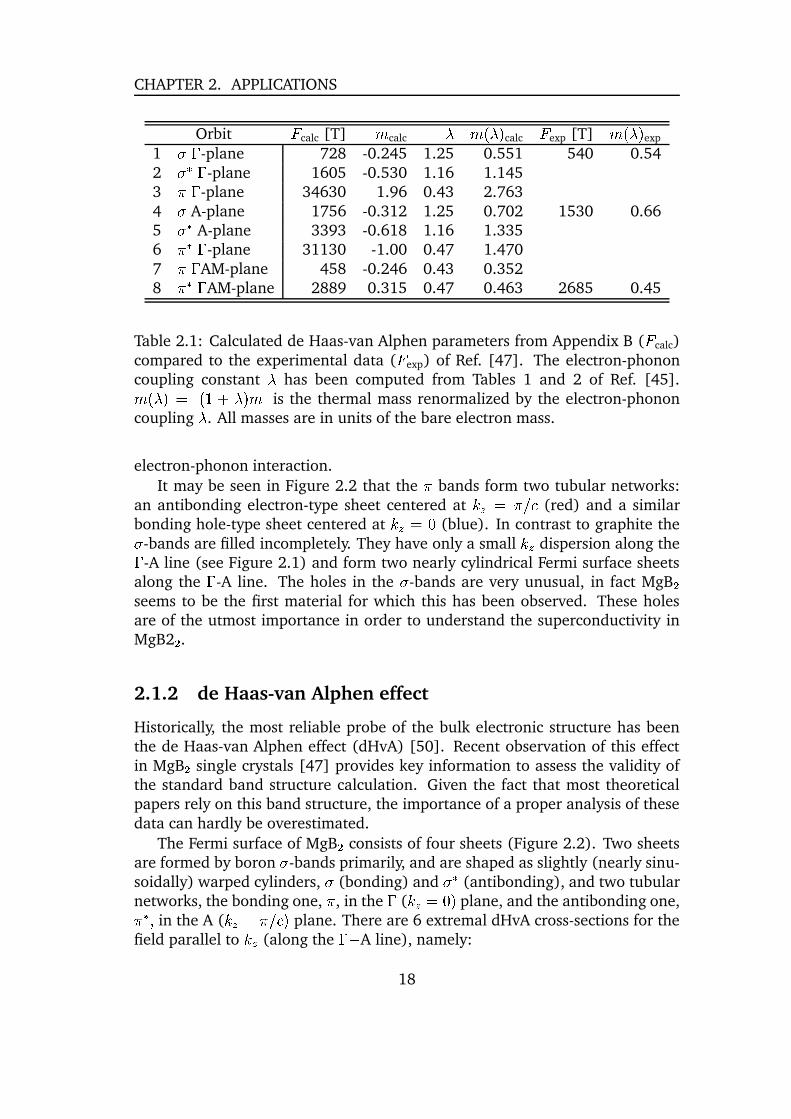
Orbit � calc [T]�
calc � � � $ calc � exp [T]� � $ exp
1 t�� -plane 728 -0.245 1.25 0.551 540 0.542 t¡ ¢� -plane 1605 -0.530 1.16 1.1453
* � -plane 34630 1.96 0.43 2.7634 t A-plane 1756 -0.312 1.25 0.702 1530 0.665 t¡ A-plane 3393 -0.618 1.16 1.3356
* ¢� -plane 31130 -1.00 0.47 1.4707
* � AM-plane 458 -0.246 0.43 0.3528
* ¢� AM-plane 2889 0.315 0.47 0.463 2685 0.45
Table 2.1: Calculated de Haas-van Alphen parameters from Appendix B ( � calc)compared to the experimental data ( � exp) of Ref. [47]. The electron-phononcoupling constant � has been computed from Tables 1 and 2 of Ref. [45].� � $£; . [ � � $ � . is the thermal mass renormalized by the electron-phononcoupling � . All masses are in units of the bare electron mass.
electron-phonon interaction.
It may be seen in Figure 2.2 that the*
bands form two tubular networks:an antibonding electron-type sheet centered at ¤�� ; * � ~
(red) and a similarbonding hole-type sheet centered at ¤�� ;�=
(blue). In contrast to graphite thet -bands are filled incompletely. They have only a small ¤¥� dispersion along the� -A line (see Figure 2.1) and form two nearly cylindrical Fermi surface sheetsalong the � -A line. The holes in the t -bands are very unusual, in fact MgB �seems to be the first material for which this has been observed. These holesare of the utmost importance in order to understand the superconductivity inMgB2 � .2.1.2 de Haas-van Alphen effect
Historically, the most reliable probe of the bulk electronic structure has beenthe de Haas-van Alphen effect (dHvA) [50]. Recent observation of this effectin MgB � single crystals [47] provides key information to assess the validity ofthe standard band structure calculation. Given the fact that most theoreticalpapers rely on this band structure, the importance of a proper analysis of thesedata can hardly be overestimated.
The Fermi surface of MgB � consists of four sheets (Figure 2.2). Two sheetsare formed by boron t -bands primarily, and are shaped as slightly (nearly sinu-soidally) warped cylinders, t (bonding) and t¦ (antibonding), and two tubularnetworks, the bonding one,
*, in the � ( ¤�� ;>=}$
plane, and the antibonding one,* 6 in the A ( ¤§� ; * � ~ $plane. There are 6 extremal dHvA cross-sections for the
field parallel to ¤}� (along the � � A line), namely:
18

2.1. THE SUPERCONDUCTOR MGB �1. t in the � plane,
2. t¡ in the � plane,
3.*
in the � plane (“holes” between the tubes),
4. t in the A plane,
5. t in the A plane,
6.* in the A-plane.
For a field parallel to ¤ � (perpendicular to the � � AM plane) there are twoextremal cross-sections (tubes’ necks), for the
*surface (7) and for the
* sur-face (8).
The agreement between the calculated and measured thermal masses (seeTable 2.1) can be characterized as excellent. Very importantly, this agreementis so good only because the calculated electron-phonon coupling differs by afactor of 3 between the t and
*bands. This is the first direct demonstration
of this important effect. The agreement between the calculated areas � andthe experimental ones is good, but not outstanding. �¢�76}� � and �¨� are overesti-mated by 35%, 15%, and 8%, respectively. The first number indicates that thecalculations underestimate the ¤�� dispersion: the �<� and � � ratio measures thedegree of the warping of the t cylinder. In fact, shifting the t band by 6 mRyup in the � plane and by 1 mRy up in the A plane, and the
* band by 6 mRydown brings the calculated areas to full agreement with the experiment.
This observation does not mean that we try to enhance agreement withexperiment by adjusting the Fermi level. The discrepancies between experimentand theory are less than 300 T, which corresponds to only 0.2% of the area ofthe hexagonal Brillouin zone. Therefore, the difference itself is not large andwill result only in quantitative corrections in the description of MgB � but willnot change the qualitative picture. Similar shifts of the Fermi level which wouldbring the experimental and calculated areas to better agreement have also beennoted by Rosner et al. [51].
2.1.3 Angle resolved photoemission spectroscopy
While at the dawn of electronic structure calculations it was not believed thatthe electronic bands themselves will be a measureable quantity, progress in ex-perimental technique proved that to be wrong. Angle resolved photo emissionspectroscopy (ARPES) allows for the detection of occupied bands close to theFermi level. The electronic structure of several metals such as Cu or Ag has beenprobed by photoemission [52, 53] in good agreement with electronic structurecalculations.
19
CHAPTER 2. APPLICATIONS
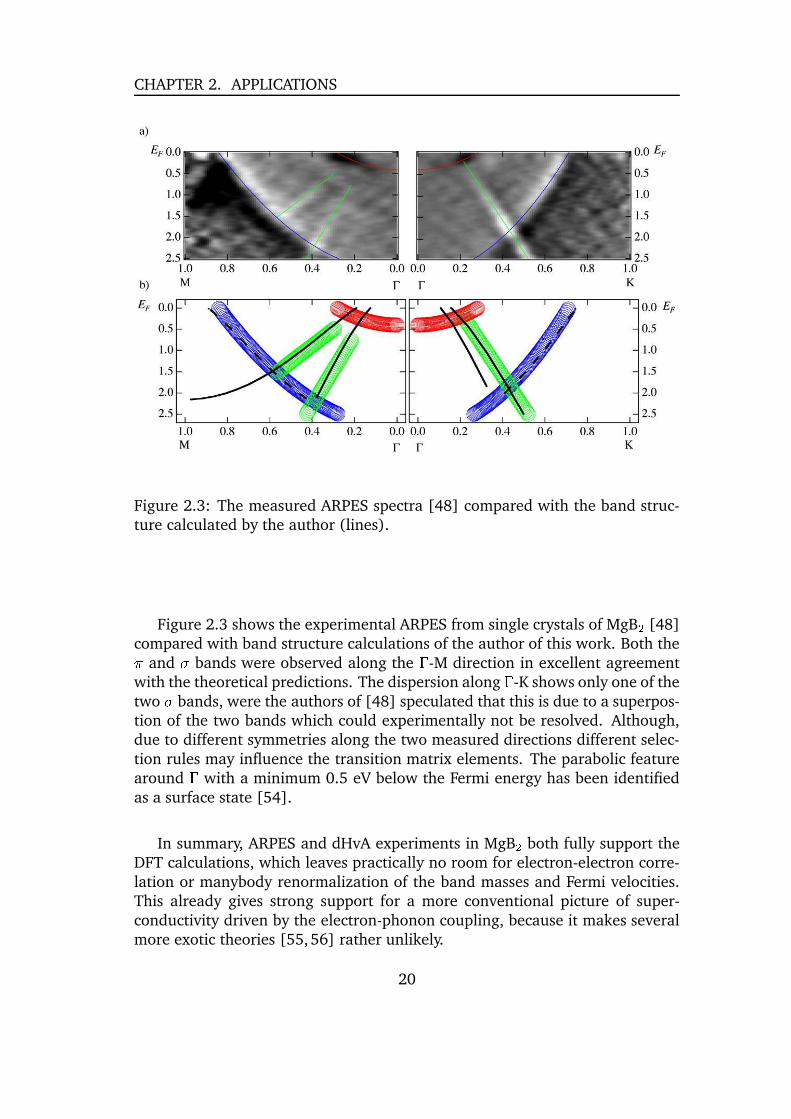
Figure 2.3: The measured ARPES spectra [48] compared with the band struc-ture calculated by the author (lines).
Figure 2.3 shows the experimental ARPES from single crystals of MgB � [48]compared with band structure calculations of the author of this work. Both the*
and t bands were observed along the � -M direction in excellent agreementwith the theoretical predictions. The dispersion along � -K shows only one of thetwo t bands, were the authors of [48] speculated that this is due to a superpos-tion of the two bands which could experimentally not be resolved. Although,due to different symmetries along the two measured directions different selec-tion rules may influence the transition matrix elements. The parabolic featurearound � with a minimum 0.5 eV below the Fermi energy has been identifiedas a surface state [54].
In summary, ARPES and dHvA experiments in MgB � both fully support theDFT calculations, which leaves practically no room for electron-electron corre-lation or manybody renormalization of the band masses and Fermi velocities.This already gives strong support for a more conventional picture of super-conductivity driven by the electron-phonon coupling, because it makes severalmore exotic theories [55,56] rather unlikely.
20

2.1. THE SUPERCONDUCTOR MGB �2.1.4 X-ray spectroscopy
X-ray emission and absorption spectroscopies are also powerful probes of theelectronic structure of solids. Photon emission and absorption involve a tran-sition between electronic states. In the soft x-ray regime, one of the states is alocalized, dispersionless core level. This allows for the interpretion of the mea-sured spectra in terms of unoccupied states for absorption and occupied statesfor emission. Since dipole selection rules govern the transitions to or from thecore level, it is actually the angular-momentum-resolved density of states thatis measured. Furthermore, since the core level is associated with a specific ele-ment in the compound, x-ray absorption and emission are also element specific.Finally, they have the advantage of being relatively insensitive to the quality ofthe sample surface, unlike x-ray photoelectron spectroscopy (XPS) or ultravio-let photoemission, where in order to measure the bulk electronic structure it isnecessary to prepare atomically clean, stoichiometric, and ordered surfaces.
Using the full potential LAPW code WIEN97, [57] the author calculated thenear edge absorption and emission X-ray spectra. According to the final-staterule formulated by von Barth and Grossmann, [58] accurate X-ray emissionand absorption spectra of simple metals may be obtained from ordinary one-electron theory if the relevant dipole matrix elements are calculated from va-lence functions obtained in the potential of the final state of the x-ray process:in other words, a potential reflecting the fully screened core hole for absorp-tion but not for emission. Because we neglected core relaxation effects in ourcalculations, we expect significantly better agreement between theory and ex-periment for emission spectra. The calculated spectra are Lorentz broadenedwith a spectrometer broadening
As shown in Appendix C, the measured x-ray emission and absorption spec-tra of the constituents of the superconductor MgB � are found in good agree-ment with results of band structure calculations and in particular calculationsof intensities of x-ray spectra taking the necessary matrix elements into ac-count. Further, according to the experimental findings magnesium is positivelycharged in this compound, which supports the results of electronic structurecalculations. The comparison of x-ray emission spectra of graphite, AlB � , andMgB � supports the idea of superconductivity driven by hole doping of the cova-lent t bands.
2.1.5 What is special about MgB © ?The previous sections discussed only the electronic structure of MgB � in somedetail together with several experiments which are able to probe this electronicstructure. Although, there are many more interesting features of this materialwhich are outside the scope of the present work. Most importantly, all aspectsof superconductivity are not mentioned here.
21

CHAPTER 2. APPLICATIONS
More than forty years ago Suhl, Matthias, and Walker predicted the exis-tence of multigap superconductivity, in which a disparity of the pairing interac-tion in different bands, such as the � - and ª -bands in transition metals, leadsto different order parameters and to an enhancement of the critical temper-ature [59]. Despite much effort, a clear materialization of this phenomenonwas not found, neither in transition metals, nor in novel transition-metal com-pounds, such as YBa � Cu � O « or Sr � RuO ¬ . The material MgB � appears to be thefirst superconductor, for which a two-gap model [45,60] offers a simple expla-nation of many anomalous experimental findings.
Recent experimental data from scanning tunneling measurements and point-contact spectroscopy [61–63], high-resolution photo-emission spectroscopy [64],Raman spectroscopy [65], specific heat measurements [66] and muon spin re-laxation studies of the magnetic penetration depth [67] support the concept ofa double gap in MgB � (see Ref. [68] for a review of experiments).
For the sake of completeness a short summary of what makes MgB � so excit-ing is given. For detailed information of the authors work in the field of MgB �please see [44,45,69–76]. There are holes at the top of the �j� � -bonding t -bands. These holes couple strongly to the optical bond-stretching modes with® v � ¤§¯ . Since ¤§¯ is merely 1/5 of the Brillouin zone radius, very few electrons and
very few phonons contribute to the electron-phonon coupling constant� a%ag° [. Since the t -holes couple stronger to the phonons than the
*-electrons,
there are two distinct superconducting order parameters. The critical temperature
J Wis enhanced by the anisotropy of the gap. These effects are visible only because impurity t � *
band scattering isnegligible, except in severely damaged samples. Multiband effects are very important also in the normal state transportand thermodynamical properties .
2.2 Electric field gradients
Electric field gradients (EFG) are determined by the non-spherical contribu-tions of the electronic charge density around a nucleus. Therefore, one can seethe efg has a sensitive probe of the quality of electronic structure calculations.While the calculation of EFG has been already implemented for some time in
22
2.2. ELECTRIC FIELD GRADIENTS
DFT codes like WIEN97 [57], it has been only recently implemented in theNRLMOL package by Jackson and Kortus [77]. Here we will give a few detailsand benchmark calculations for that implementation.
The EFG is due to the electrons and the other nuclei in the material. TheEFG at nucleus X can be calculated as:Z²±³ h ´ ; Q ª " D �" $ LNµ � ³ �1¶ ± ³ $ � ´ �·¶ ± ´}$ � . " � @ ± . � l ³ h ´MO. " � @ ± . � (2.1)� �%¸ ? ¸ µ ¶ ¸ ³ �¹¶ ± ³ $ ¶ ¸ ´ �1¶ ± ´}$ � . @ ¸ � @ ± . � l ³ ´. @ ¸ � @ ± . � (2.2)
where D �" $ is the electronic charge density at position r, the R’s represent thepositions of the nuclei and the ? ’s the corresponding atomic numbers. To eval-uate
Z ±³ h ´ , we compute the first integral numerically, and add the second term,which is a simple sum over the nuclei.
The Mossbauer quadrupole splitting arises from an interaction between thenuclear quadrupole moment and the EFG at the position of the Mossbauer nu-cleus. The quadrupole splitting for a
� ; µ � � state is given by:� ; ( � Z �P�sº [ ��» � � µ $ � � (2.3)
where Q is the nuclear quadrupole moment,
Z �P� is the largest eigenvalue of theEFG tensor and » is the asymmetry parameter,» ; Z �¼� � Z V'VZ �¼� (2.4)
Here the principle axes are chosen such that . Z �P�+.�½�. Z �¼� .�½ Z V'V.
To test the reliability of our DFT approach, we have computed EFG com-ponents for several benchmark molecules that were studied recently using ab
initio methods. In Table 2.2 we show a comparison of our DFT NRLMOL resultsand the corresponding values obtained at the Hartree-Fock (HF) and MøllerPlesset second order perturbation theory (MP2) levels of theory [78]. The ta-ble shows the value of
Z �P� at each nucleus in the molecule, in atomic units. Theab initio results were obtained using extensive basis sets. The DFT results arereported for the default basis sets implemented in NRLMOL. The table showsvery good agreement between the different methods. Typical differences be-tween DFT and MP2 results are on the order of 10 ¾ or less. We tested the DFTresults for basis set effects by recomputing the EFG components using extendedbasis sets, including additional diffuse single Gaussian orbitals for all angularmomentum types. As shown in Table 2.2, the EFG parameters change onlyslightly with the larger basis.
Coming back to the solid state, the very delicate interplay between struc-tural parameters and EFG in wurtzite semiconductors is discussed in Appendix
23

CHAPTER 2. APPLICATIONS
ab initio DFTHF-SCF MP2 default extended
H � -0.342 -0.338 -0.350 -0.388N � 1.368 1.115 1.153 1.112F � -6.944 -6.258 -6.516 -6.343HF H -0.521 -0.546 -0.566 -0.538
F -2.860 -2.591 -2.788 -2.720HCl H -0.293 -0.296 -0.294 -0.296
Cl -3.579 -3.402 -3.458 -3.469CO C 1.174 0.950 0.979 0.939
O 0.724 0.779 0.705 0.684HCN H -0.317 -0.319 -0.334 -0.322
C 0.498 0.376 0.370 0.339N 1.201 0.946 1.008 0.979
HNC H -0.419 -0.421 -0.443 -0.424N 1.035 0.833 0.864 0.834C -0.017 -0.048 -0.116 -0.130
H � O H -0.472 -0.481 -0.501 -0.477O 1.836 1.624 1.763 1.713
NH � H -0.392 -0.391 -0.407 -0.390N 0.957 0.838 0.973 0.941
Table 2.2: A comparison of calculated electric field gradient (EFG) parametersusing ab initio (Ref. [78]) vs DFT NRLMOL results. The values quoted for eachmolecule represent
Z �P� , the largest eigenvalue of the EFG tensor, at the variousatom positions shown. Values are quoted in atomic units. The ab initio resultswere obtained using extensive basis sets. The NRLMOL results are given for thedefault electronic structure basis sets and for an extended basis.
D. The wurtzite structure consists of two close packed sublattices which are dis-placed along the
~direction by ¿ ~ . There is a strong dependence of the A- and
B-site EFG on this internal ¿ parameter. A small change of ¿ (0.2%) results in alarge relative change (50%) of the EFG values at the A-site. For given hexago-nal lattice parameters A and
~one can determine a theoretical ¿ parameter from
minimization of the total energy. Theoretical values of ¿ have been calculatedfor AlN, ZnO, CdS, GaN and ZnS. These values follow a linear dependence onthe
~ � A ratio in agreement with earlier observations [79]. The experimental un-certainty of ¿ from X-ray data could be minimized by checking the theoreticalvalues against the measured and calculated EFG. A good agreement of the EFGwould give direct experimental support for the theoretical ¿ value.
24
2.3. VIBRATIONAL PROPERTIES
2.3 Vibrational properties
This section will be mainly devoted to the discussion of vibrational propertieswhich can also be obtained from DFT calculations. The examples include anaturally occurring mineral: melanophlogite, which is iso-structural to the typeI gas hydrates. The guest host interaction in this clathrate significantly influ-ences the Raman modes and their intensity. The other two examples are morechemical oriented and describe the vibrational properties of two high-energymolecules: octanitrocubane and azidopentazole. While the first one has beenalready synthesized the other one is still elusive. In case of octanitrocubane wediscuss the interesting case of a failure of the usually used harmonic approxi-mation.
2.3.1 Host guest interaction in a clathrate
Melanophlogite is a naturally occurring SiO � -based clathrate structure whichhas the same structure as type I gas hydrates. Two types of voids are found inmelanophlogite (Figure 2.4 and 2.5). The SiO ¬ tetrahedra of the host form athree-dimensional framework consisting of two different kinds of cages. In fact,melanophlogite was the first known example of a silicate framework structurewith the pentagonal dodecahedron as a framework element [80].
This framework contains two types of cages: two pentagondodecahedra(cage I) and six tetrakaidecahedra (cage II) per unit cell. The structure ofthe smaller cage I shown in Fig. 2.4 is well known from recent interest in car-bon fullerenes. It is the natural occurring equivalent of silica to a C � � fullerene.However, due to the tetrahedral coordination preferred by Si atoms the cagesshare faces to satisfy the �j� � bonding. The corners are occupied by siliconatoms, whereas the oxygen atoms are located on the middle of the edges. Thefree space within cage I can be approximately described by a sphere-like voidwith diameter ªÀy 5.7 A and a volume
Z y 97 A�.
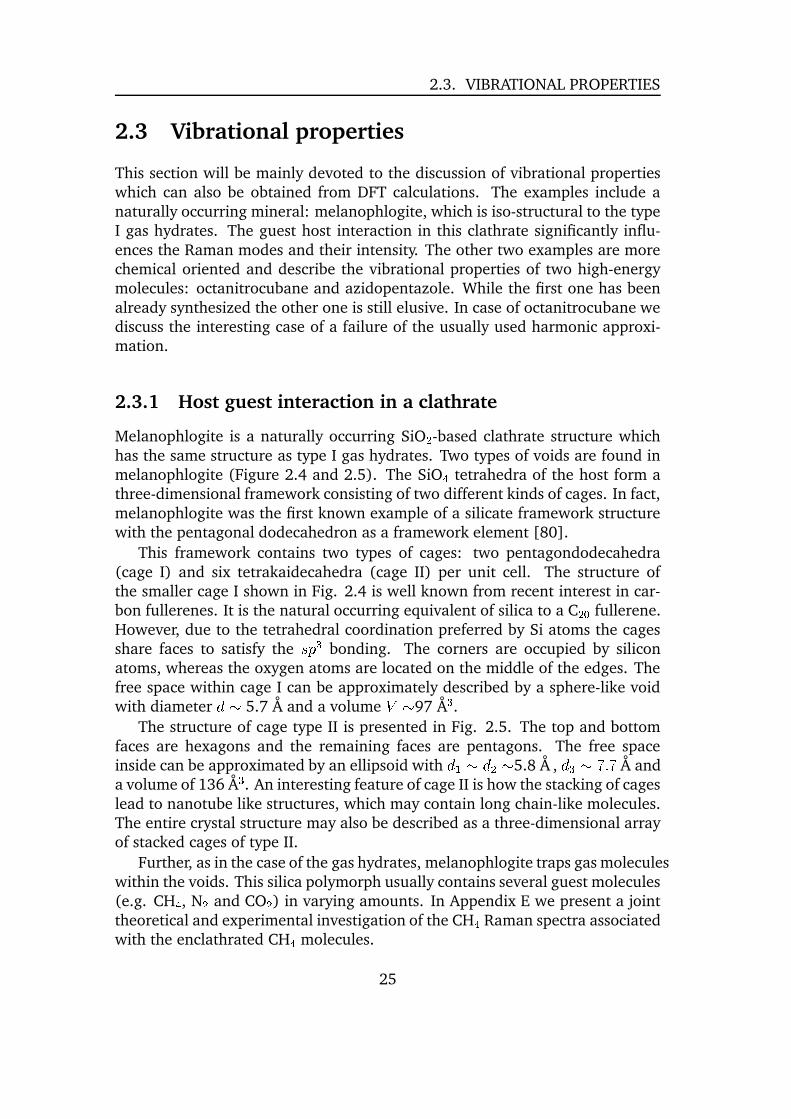
The structure of cage type II is presented in Fig. 2.5. The top and bottomfaces are hexagons and the remaining faces are pentagons. The free spaceinside can be approximated by an ellipsoid with ª���yÁª � y 5.8 A , ª}�ÂyÄÃC8Åà A anda volume of 136 A
�. An interesting feature of cage II is how the stacking of cages
lead to nanotube like structures, which may contain long chain-like molecules.The entire crystal structure may also be described as a three-dimensional arrayof stacked cages of type II.
Further, as in the case of the gas hydrates, melanophlogite traps gas moleculeswithin the voids. This silica polymorph usually contains several guest molecules(e.g. CH ¬ , N � and CO � ) in varying amounts. In Appendix E we present a jointtheoretical and experimental investigation of the CH ¬ Raman spectra associatedwith the enclathrated CH ¬ molecules.
25

CHAPTER 2. APPLICATIONS
Figure 2.4: Cage I (pentagon dodecahedra) consists of 12 pentagonal faces. Itis the natural occurring equivalent of silica to a Æ � � fullerene. The atoms on thecorners are silicon atoms (lighter balls), whereas the atoms between are oxygenatoms (dark). The broken bonds are saturated by hydrogen atoms (very lightballs). The guest molecule (methane) located inside this cage is presented too.
Raman spectroscopy provides a non destructive method for obtaining in-formation about the kind of guests by observing their vibrational fingerprints.Further, if the Raman activity of the guest molecules is known, the density ofthe guests may be determined. Since, density-functional calculations provide acost-effective ab initio means for determining the Raman activity of moleculesthe two methods combined give us a powerful tool for analyzing and charac-terizing the above mentioned structures.
We find that the Raman intensities of the totally symmetric hydrogen stretchmodes are significantly perturbed by the presence of the clathrate cage andshow that the calculated Raman spectra may be used to determine the concen-tration and location of the enclathrated gas molecules. Relative to the gas-phasestructure we identify two effects which are responsible for the change in inten-sity of the enclathrated molecules relative to the gas phase. The polarizability ofthe surrounding cage acts to increase the Raman spectra of the stretch mode inthe pentagondodecahedra cage. However, in the lower-symmetry tetrakaidec-ahedra cage, mixing between the hydrogen-stretch mode and other opticallysilent molecular vibrations counteracts this affect and accounts for the differentRaman intensities observed for the two types of voids.
We suggest that similar calculations and experiments on the gas-hydrates
26
2.3. VIBRATIONAL PROPERTIES
Figure 2.5: Cage II (tetrakaidecahedra) has two hexagonal faces on the topand bottom, remaining with 12 pentagonal faces. The atoms on the cornersare silicon atoms (lighter balls), whereas the atoms between are oxygen atoms(dark). The broken bonds are saturated by hydrogen atoms (very light balls).The guest molecule (methane) located inside this cage is presented too.
may provide an in situ diagnostic tool for determining the amount of naturalgas contained within the gas-hydrates on the sea floor.
2.3.2 Octanitrocubane
The well-known molecule cubane (C � H � ), which was first synthesized by Eatonand Cole [81], is build from a cube of carbon atoms saturated with hydrogenatoms at each corner.
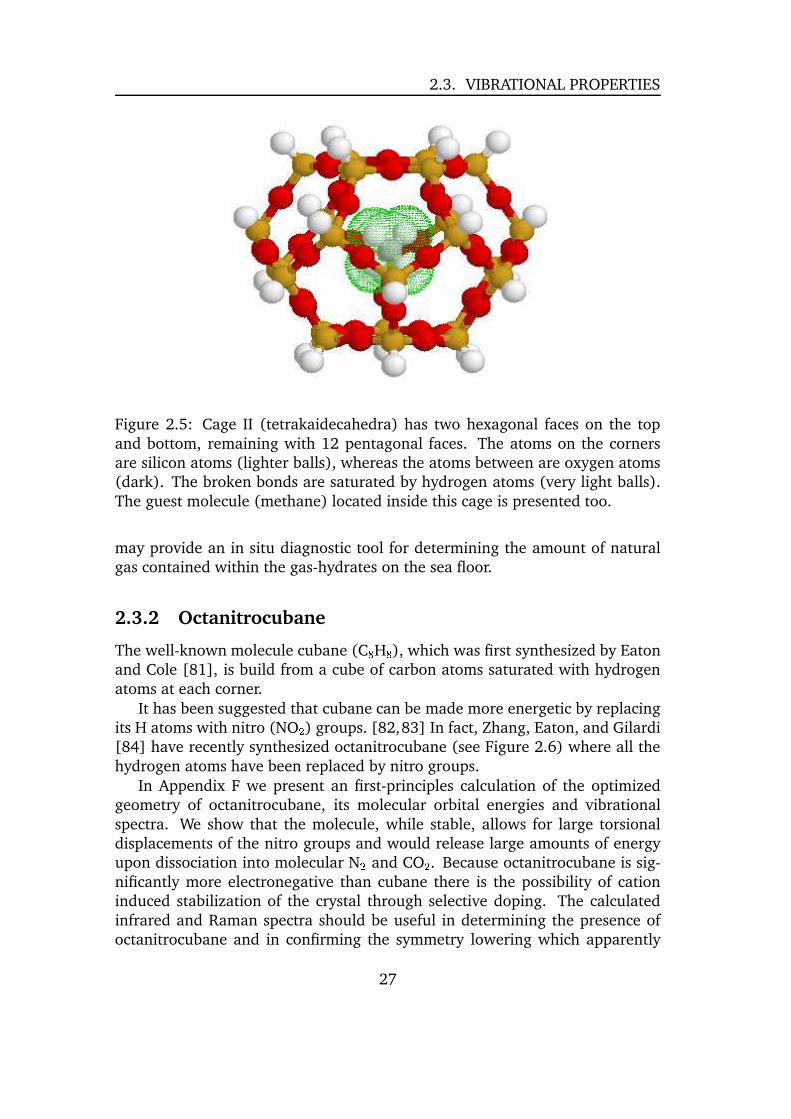
It has been suggested that cubane can be made more energetic by replacingits H atoms with nitro (NO � ) groups. [82,83] In fact, Zhang, Eaton, and Gilardi[84] have recently synthesized octanitrocubane (see Figure 2.6) where all thehydrogen atoms have been replaced by nitro groups.
In Appendix F we present an first-principles calculation of the optimizedgeometry of octanitrocubane, its molecular orbital energies and vibrationalspectra. We show that the molecule, while stable, allows for large torsionaldisplacements of the nitro groups and would release large amounts of energyupon dissociation into molecular N � and CO � . Because octanitrocubane is sig-nificantly more electronegative than cubane there is the possibility of cationinduced stabilization of the crystal through selective doping. The calculatedinfrared and Raman spectra should be useful in determining the presence ofoctanitrocubane and in confirming the symmetry lowering which apparently
27
CHAPTER 2. APPLICATIONS
Figure 2.6: The molecular structure of octanitrocubane. The carbon atoms forma cube to which the nitro groups are connected on the corners.
occurs in the solid structure.
Further, one of the very soft torsional modes exhibits strong anharmonicityand is fundamentally interesting. This extremely soft concerted torsional vibra-tion is associated with the rotation of NO � groups about the C-N bond axes.Interestingly, at the harmonic level we find a total of eighty-nine real frequen-cies and seven zero-frequency modes. While six of the zero-frequency modescorrespond to the usual rotational and translational modes, the seventh zero-frequency harmonic mode requires a more in-depth discussion. For reasonsthat will become clear below, we refer to this mode as the quartic concertedtorsional mode (QCTM) throughout the remainder of the discussion.
We start by noting that the harmonic analysis shows that this mode is en-tirely associated with torsional rotations of pairs of oxygen atoms about theirrespective C-N bonds. Finally, we note that we have performed frozen vibroncalculations for both the energy and the force as a function of the displacementof that mode and the resulting potential energy curve is shown in Fig. 2.7. Adetailed analysis of both the energy and forces as a function of the QCTM dis-placement confirms that the second derivative and all odd derivatives of thismode vanish identically.
In addition to the classical potential observed by the torsional mode, we
28

2.3. VIBRATIONAL PROPERTIES
−0.5 −0.25 0 0.25 0.5Vibrational Displacement (Angstroms)
0
20
40
60
80
100
120
140
160
Ene
rgy
(cm
−1)
Figure 2.7: Potential as a function of vibrational displacement observed by theQCTM. Also included are the squares of the lowest eigenmodes of this predom-inantly quartic potential. The energy intercepts of the eigenmodes are shiftedby their respective energies which shows a zero point energy of 16 cm Ç � and alowest excitation energy of 42 cm Ç � .have determined the anharmonic vibrational wavefunctions and energies asso-ciated with this mode and present the results in Fig. 2.7. Because of the quarticnature of the potentials, the anharmonic wavefunctions are flatter than whatwould be expected from a harmonic oscillator potential. The zero point energyassociated with this mode is found to be 16.4 cm Ç � and the first excited state isfound to be 58.5 cm Ç � , suggesting that the lowest observable excitation wouldbe observed at 42 cm Ç � . Because this mode is anharmonic, it might be detectedby looking for second-harmonic generation in the Raman spectra which, ac-cording to our calculations, should occur at 102.1 cm Ç � . Unfortunately, thereare other strong Raman active modes which appear at both of these energies.
Since the potential associated with the QCTM is convex and since all otherharmonic modes exhibit real frequencies, the symmetry of the molecule studiedhere corresponds to a locally stable geometry for the free molecule. To addressthe question of global stability we have performed calculations on two otherreasonable symmetries of the molecule and have found that these symmetrieslead to higher energies.
29
CHAPTER 2. APPLICATIONS
1.2571.329
1.385
1.339
1.308
1.354
1.311
1.183
168.7
103.7
109.6
109.5103.7
113.5
111.7120.2
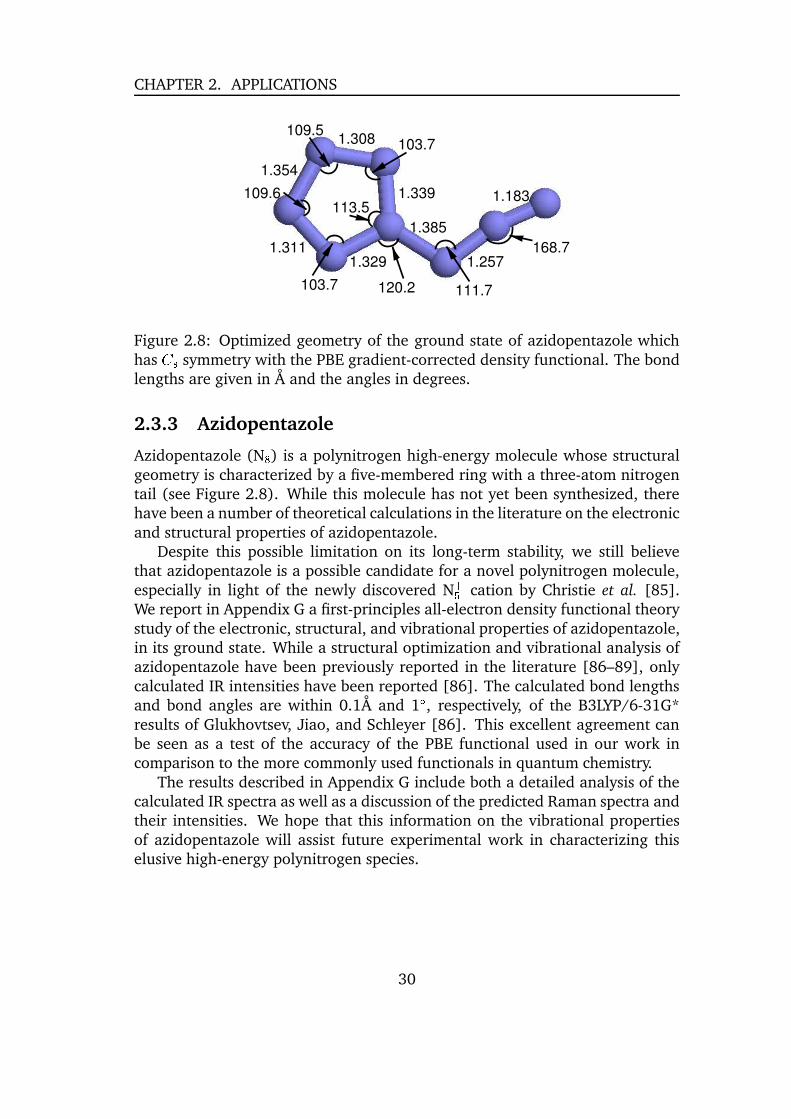
Figure 2.8: Optimized geometry of the ground state of azidopentazole whichhas ÆFÈ symmetry with the PBE gradient-corrected density functional. The bondlengths are given in A and the angles in degrees.
2.3.3 Azidopentazole
Azidopentazole (N � ) is a polynitrogen high-energy molecule whose structuralgeometry is characterized by a five-membered ring with a three-atom nitrogentail (see Figure 2.8). While this molecule has not yet been synthesized, therehave been a number of theoretical calculations in the literature on the electronicand structural properties of azidopentazole.
Despite this possible limitation on its long-term stability, we still believethat azidopentazole is a possible candidate for a novel polynitrogen molecule,especially in light of the newly discovered N
�� cation by Christie et al. [85].We report in Appendix G a first-principles all-electron density functional theorystudy of the electronic, structural, and vibrational properties of azidopentazole,in its ground state. While a structural optimization and vibrational analysis ofazidopentazole have been previously reported in the literature [86–89], onlycalculated IR intensities have been reported [86]. The calculated bond lengthsand bond angles are within 0.1A and 1 É , respectively, of the B3LYP/6-31G*results of Glukhovtsev, Jiao, and Schleyer [86]. This excellent agreement canbe seen as a test of the accuracy of the PBE functional used in our work incomparison to the more commonly used functionals in quantum chemistry.
The results described in Appendix G include both a detailed analysis of thecalculated IR spectra as well as a discussion of the predicted Raman spectra andtheir intensities. We hope that this information on the vibrational propertiesof azidopentazole will assist future experimental work in characterizing thiselusive high-energy polynitrogen species.
30
2.4. MAGNETIC ORDERING
2.4 Magnetic ordering
This section starts the discussion of magnetic properties of molecules and clus-ters, one of the main research interests of the author. In this section the authorwill focus on systems which are not single molecule magnets, which will be dis-cussed more extensively in the last part of the present work. The first examplediscusses an exhaustive investigation of magnetic order and vibrational prop-erties of an iron oxide cluster, which has been found recently in the gas phase.The second one is more concerned with the influence of alloying Fe and Co onthe magnetic properties.
2.4.1 Magnetic and vibrational properties of the Fe Ê�Ë O Ì clus-
ter
Recently, Wang et al. [90] synthesized a new iron oxide cluster by reactive laservaporization. From time of flight mass spectra and first-principles calculations[90, 91] they respectively concluded that this iron oxide cluster consists of 13iron and 8 oxygen atoms with ÍÀ¬PÎ symmetry. Wang and coworkers [90] haveemphasized the need for understanding the Fe-O interactions because of therole that such interactions play in corrosion, biological processes and oxide filmformation.
Because of the coupling of the magnetic and structural degrees of freedom,consideration of ferro- ferri- and antiferromagnet ordering is an important issuefrom the standpoint of determining the ground state of a magnetic molecule. Assuch, the investigation of different possible spin orderings as well as total mo-ments were the primary aims of the work in Appendix H. For the energeticallymost stable structure obtained we calculated the vibrational spectra which clar-ified some questions raised by the reported values of Sun and coworkers [91].
A way to determine whether a magnetic state is at least meta-stable is to ex-amine the highest occupied molecular orbital (HOMO) and lowest unoccupiedmolecular orbital (LUMO) levels of the majority and minority spin. The spingaps, defined as � � ; � �Ï
maj
HOMO
� Ïmin
LUMO
$(2.5)� � ; � �Ï
min
HOMO
� Ïmaj
LUMO
$ 6 (2.6)
correspond to the energy required to transfer an infinitesimal amount of chargefrom the HOMO of one spin to the LUMO of the other one. The system can onlybe magnetically stable if both spin gaps are positive. Further, if the spin gapsare not both positive they determine whether an increase or decrease of totalmoment will stabilize the system.
Within the constraint of the ÍÀ¬PÎ symmetry we performed a rather exhaus-tive search of the possible ferromagnetic states. First, using ÍЬPÎ symmetry we
31

CHAPTER 2. APPLICATIONS
0 100 200 300 400 500 600 700Frequency (cm−1)
0
1
2
3
4
5
VD
OS
Ram
anIR
Figure 2.9: The upper panel displays the calculated vibrational density of states(VDOS), the middle the IR spectra and the lower panel the Raman spectra ofthe most stable ferromagnetic iron oxide Fe ��� O � cluster with ÍÀ¬PÎ symmetry. Thelowest frequency is 29.7 cm Ç � . The IR and Raman intensities are in arbitraryunits, a constant line width of 6 cm Ç � was assumed.
optimized the geometry of the cluster with a ferromagnetic state correspondingto a total moment of 20
q B . Both spin gaps,� � ;Ä= 8ÅÑ [ÓÒ eV and
� � ;Ä= 8 = [ � eV,are positive, which show that this state is at least meta-stable. However,
� �is small, indicating that another ferromagnetic state obtained by transferringcharge from the minority spins to the majority ones could also lead to a meta-stable state. Starting from this geometry we carried out 16 different calcula-tions with fixed total moments of the cluster ranging between 20
q B and 52q B . Using the above defined criteria of positive spin gaps for both spins wedetermined the magnetically meta-stable configurations for which we furtheroptimized the geometry within the constraint of this given moment. In somecases one of the spin gaps became negative during the geometry optimization.In theses cases we changed the moment accordingly and relaxed the geometryfurther. This approach resulted in the identification of four meta-stable ferro-magnetic states with total moments of 20
q B , 26q B , 32
q B and 34q B . The
32
2.4. MAGNETIC ORDERING
magnetic states with 32q B and 34
q B were found to be the most stable ones.These states are energetically nearly degenerate with the 34
q B state only 3meV higher in energy. The most stable structure found, was the state with 32q B .
If orbitals are spatially orthogonal and occupy the same region in space,parallel alignment of the spins leads to a larger exchange interaction energy andferromagnetic coupling is subsequently favored. Antiferromagnetic couplingoccurs in cases where the orbitals are spatially separated but nonorthogonal.In such cases anti-parallel alignment of the spins bypasses the need for spatialorthogonality and provides for a reduction in the kinetic energy.
Using the same approach as in the ferromagnetic case we started with 12different fixed total moments between 0
q B and 20q B . We find antiferromag-
netic and several ferrimagnetic states with total moments 4, 8, 10, 12, 13, 14and 15
q B to be meta-stable magnetic states for the iron oxide cluster. The fer-rimagnetic states with 12, 13, 14 and 15
q B have two-fold states at the Fermilevel, which are not fully occupied suggesting that Jahn-Teller distortions wouldlead to a reduction in symmetry.
All these states are close in energy and show similar behavior. The mag-netic state with 14
q B is the lowest energy state exhibiting antiferromagneticcoupling between the Fe atoms. However, this state is 86 meV higher in energythan the ferromagnetic state with 32
q B .
In Figure 2.9 we show the vibrational spectra including IR and Raman in-tensities calculated from density-functional theory. We find that the ferromag-netic state with a moment of 32
q B per cluster is locally stable. Our frequenciesrange from 29.7 cm Ç � as the lowest to 660 cm Ç � as the highest frequency. Thesevalues differ by an order of magnitude from the frequencies given by Sun andcoworkers. [91] A good test for the numerical accuracy of our calculations is thevalue of the trivial frequencies of the three translational and rotational modeswhich should be zero, which we also obtain from diagonalizing the dynamicalmatrix. The largest absolute value for one of these six modes is 0.000012 cm Ç � .2.4.2 Magnetic moment and anisotropy in Fe Ô Co Õ clusters
Appendix I presents electronic structure calculations on Fe � Co � (n+m=5 and13) clusters in order to examine the effect of alloying on the magnetic momentand magnetic anisotropies.
In Fig. 2.10 we show the configurations studied in this work. The 5- and 13-atom clusters are chosen because they allow for uniaxial structures. For eachof the pure uniaxial configurations it is possible to further enhance the uniaxialcharacter via substitution of different transition metal atoms along the axis ofsymmetry. This procedure allows for iron-rich uniaxial clusters with composi-tions Fe � Co � , and Fe ��� Co � . Similar cobalt-rich uniaxial clusters with opposite
33
CHAPTER 2. APPLICATIONS
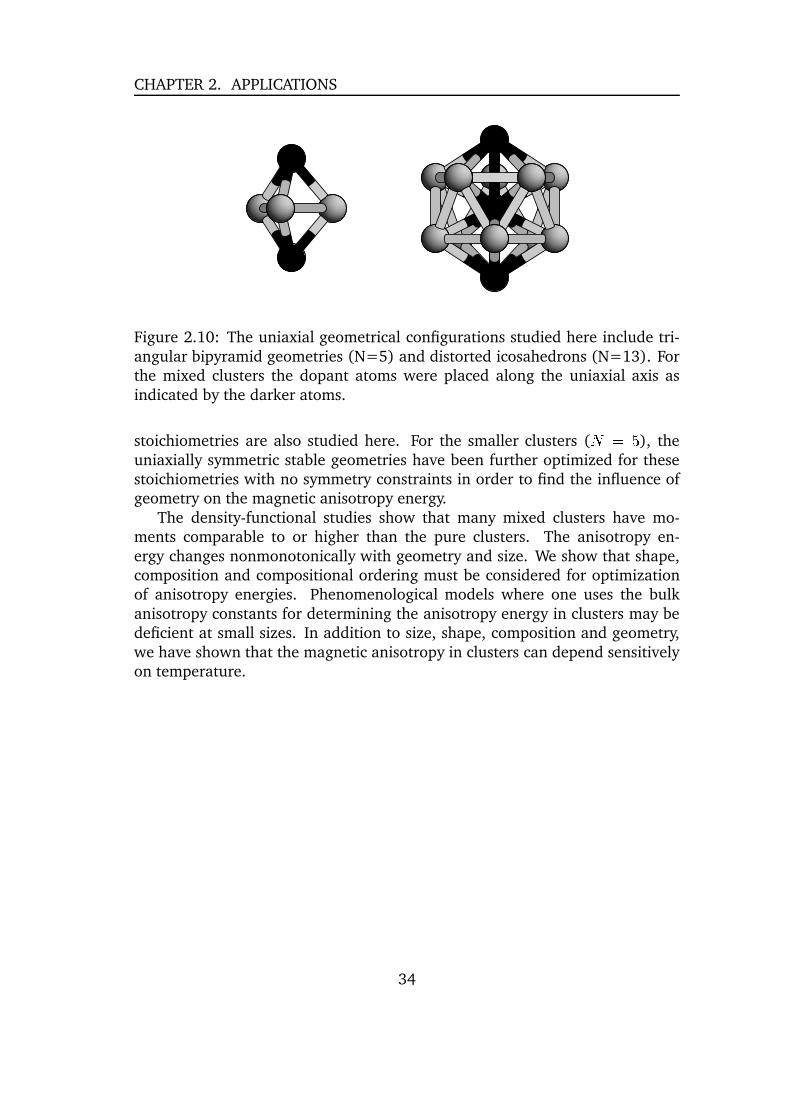
Figure 2.10: The uniaxial geometrical configurations studied here include tri-angular bipyramid geometries (N=5) and distorted icosahedrons (N=13). Forthe mixed clusters the dopant atoms were placed along the uniaxial axis asindicated by the darker atoms.
stoichiometries are also studied here. For the smaller clusters ( ; Ñ ), the
uniaxially symmetric stable geometries have been further optimized for thesestoichiometries with no symmetry constraints in order to find the influence ofgeometry on the magnetic anisotropy energy.
The density-functional studies show that many mixed clusters have mo-ments comparable to or higher than the pure clusters. The anisotropy en-ergy changes nonmonotonically with geometry and size. We show that shape,composition and compositional ordering must be considered for optimizationof anisotropy energies. Phenomenological models where one uses the bulkanisotropy constants for determining the anisotropy energy in clusters may bedeficient at small sizes. In addition to size, shape, composition and geometry,we have shown that the magnetic anisotropy in clusters can depend sensitivelyon temperature.
34

2.5. MOLECULAR MAGNETS
2.5 Molecular magnets
Magnetic materials play a very important role in todays information technology.In order to increase the capacity for information storage, the system size of thestorage devices must be decreased and this eventually suggests the need fortransitioning from bulk matter to nanoscale molecules and clusters.
The magnetic molecules of current interest are typically composed of one ormore transition metal atoms which are locked at their lattice sites by a carefullyarranged host consisting of organic molecules and ligands. The molecules inthe solid phase may be characterized by very weak interactions between themolecular entities, so that the magnetic behavior probed by experiments willbe determined by that of a single molecule.
In this size regime the temperature at which a magnetic device will retain itsmagnetic orientation is determined by the magnetic anisotropy energy (MAE)which is due to directional dependencies of the spin-orbit-coupling operator.Further, quantum physics becomes important as evidenced by the phenomenonof quantum tunneling of magnetization (QTM) [92]. In QTM, the hysteresisloops in the macroscopic samples of molecular magnets containing the clus-ters show discrete steps related to the quantum jump of the magnetization indifferent directions. Magnetic molecular clusters such as the manganese-oxocluster with acetate ligands (Mn � � -ac) [93,94] or the octanuclear iron(III) oxo-hydroxo cluster (Fe � ) [92, 95] are probably the most widely studied materialsfor which QTM has been observed [96–99]. Another very interesting cluster isthe V ��� spin system [100]. Besides the fundamental interest in understandingquantum effects in these nanomagnets they might be also relevant for imple-mentations of quantum computers.
In general the properties of a nanoscale system of coupled spins dependdirectly on the strength of the exchange-parameters and on the strength ofthe spin-orbit coupling. When the exchange interactions are large enough, thelowest energy magnetic excitations in a many spin system are in fact due to thecollective changes in spin-orbit coupling energy and this energy scale is knownas the magnetic anisotropy energy [101]. The ability to accurately predict andmodify the MAE is a key to understanding QTM and the temperature range atwhich a system will retain its magnetic orientation.
As pointed out early by van Vleck, [101] the magnetic anisotropy Hamilto-nian, which ultimately controls the above tunneling resonances, arises becauseof spin-orbit coupling and other relativistic terms. For over a decade it hasbeen recognized that the calculation of magnetic anisotropies are in principlepossible within density-functional theory [102] and many researchers have per-formed such calculations on solids and films [103]. Problems associated withthe accurate density-functional-based determination of MAE in the solid statehave been identified and the role of incomplete orbital polarization has beenshown to be one issue related to inaccuracies in the solid.
35

CHAPTER 2. APPLICATIONS
Calculations on such correlated systems present a challenge to mean-fieldframeworks such as density-functional theory because it is important to accountfor the strong ligand-metal interactions and to determine whether the behav-ior of a given spin system is mainly mediated by the anisotropy, by spin-spincoupling or by a combination of the two.
After some theoretical details on the calculation of the spin-orbit couplingand magnetic anisotropy energy the author will discuss several magnetic clus-ters with respect to their electronic structure, magnetic anisotropy and the V ���spin system, which is governed by spin-spin interactions.
2.5.1 Spin-orbit coupling and magnetic anisotropy energy
Recently, Pederson and Khanna have developed a method for accounting forsecond-order anisotropy energies [104, 105]. This method relies on a simplealbeit exact method for spin-orbit coupling and a second-order perturbativetreatment of the spin Hamiltonian to determine the dependence of the totalenergy on spin projection. In this method, a cartesian representation of thespin-orbit term is used which is exact and also is more adaptable for multi-center systems. According to this method, the spin-orbit coupling termÖ �" 6�×¢6%Ø $�; � [� ~ � Ø � ×1ÙÛÚ�Ü �" $ (2.7)
can be incorporated as given below. Using single-particle wavefunctions ex-pressed in terms of a basis set` � È �" $<; �N�¼h a Æ � È�¼a { � �" $ | a 6 (2.8)
where the { � #" $ are the spatial functions and | are spin functions, the matrixelements can be expressed asÖ �¼h a7h Ý%h aXÞß; à { � | a . Ö #" 6�×á67Ø $ .+{ Ý | a7Þãâ (2.9)
; �Tä à { � . Z V .+{ Ý9â9à | a .§å V .M| a7Þãâ (2.10)
where the operator
Z Vis defined asà { � . Z V .+{ Ý9â¢; [� ~ �áæ�ç ªC{ �ª�u ���� 4 ���� ª¥{
ݪ}èÛé � ç ªC{
�ª}è ���� 4 ���� ª¥{
ݪ�upéÂê 8 (2.11)
In the above,
4 #" $is the Coulomb potential. Thus this treatment uses matrix
elements of the Coulomb potential with partial derivatives of the basis func-tions, thereby avoiding the time consuming task of calculating the gradient ofthe Coulomb potential directly.
36
2.5. MOLECULAR MAGNETS�£ëMìAr Kr
NRLMOL Dirac NRLMOL Dirac2p 0.0796 0.0817 1.8731 1.96353p 0.0063 0.0066 0.2775 0.28973d — — 0.0471 0.0479
Table 2.3: Spin-orbit splittings of energy levels (��ëMì
in Hartree) for Ar andKr calculated with NRLMOL compared to results of a full relativistic numericalsolution of the Dirac equation [106].
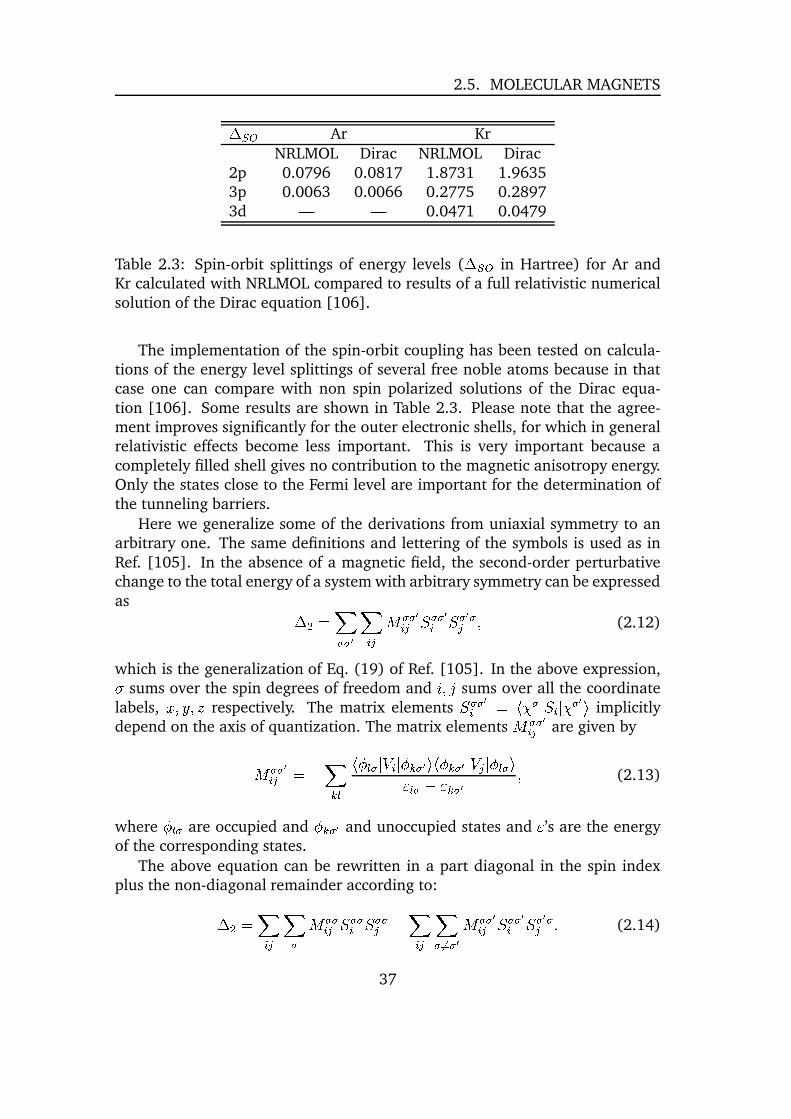
The implementation of the spin-orbit coupling has been tested on calcula-tions of the energy level splittings of several free noble atoms because in thatcase one can compare with non spin polarized solutions of the Dirac equa-tion [106]. Some results are shown in Table 2.3. Please note that the agree-ment improves significantly for the outer electronic shells, for which in generalrelativistic effects become less important. This is very important because acompletely filled shell gives no contribution to the magnetic anisotropy energy.Only the states close to the Fermi level are important for the determination ofthe tunneling barriers.
Here we generalize some of the derivations from uniaxial symmetry to anarbitrary one. The same definitions and lettering of the symbols is used as inRef. [105]. In the absence of a magnetic field, the second-order perturbativechange to the total energy of a system with arbitrary symmetry can be expressedas � � ; � a7a Þ �7�N�îí a%a Þ�N� å a7a Þ� å a Þ a� 6 (2.12)
which is the generalization of Eq. (19) of Ref. [105]. In the above expression,t sums over the spin degrees of freedom and
ä 6Yï sums over all the coordinatelabels, ð¦6�èx6'u respectively. The matrix elements å a7a Þ� ; à | a .Nå � . | a Þ â implicitlydepend on the axis of quantization. The matrix elements
í a%a Þ�N�are given byí a7a Þ�N� ; � � Ý�ñ à { ñòa . Z � .N{ Ýja Þ â9à { Ý�a Þ . Z � .U{ ñóa+â, ñóa � , Ý�a Þ 6 (2.13)
where { ñóa are occupied and { Ý�a Þ and unoccupied states and,’s are the energy
of the corresponding states.
The above equation can be rewritten in a part diagonal in the spin indexplus the non-diagonal remainder according to:� � ; �X�N�ô� a í a7a�U� å a7a� å a7a� � �X�U�õ�a+ö� a Þ í a7a Þ�U� å a%a Þ� å a Þ a� 8 (2.14)
37
CHAPTER 2. APPLICATIONS
Using the following relation for the expectation value of a spin operator fora closed shell molecule with
� excess majority spin electronsà [ .Nå � . [ â<; � à � .Uå � . � â<; à å �#â� 6 (2.15)
the first term of Eq. (2.14) can be expressed as�7�N�� Ií �Y��U� � í �Y��U� $ à å �#â:à å �7â � $ � 8 (2.16)
With the help ofà [ .Uå � . � â9à � .Uå � . [ â÷; à [ .Nå � å � . [ â � à [ .Nå � . [ â9à [ .Nå � . [ â; à [ .Nå � å � . [ â � à å ��â9à å �7â � $ � 6 (2.17)
and similar relation for
à � .Nå � . [ â9à [ .Uå � . � â , and a bit of algebra the second term ofEq. (2.14) becomes�'�N� � Ií � ��U� � í � ��U� $ à å �#â9à å �%â � $ � � [) ���øí � ��z� � í � ��z� 8 (2.18)
Therefore, the total second order shift� � together from Eq.(2.16) and Eq.(2.18)
becomes � � ; [) �k� í � ��z� � í � ��z� ��7�N�� Ií �Y��U� � í �Y��U� � í � ��N� � í � ��N� $ à å ��â9à å �7â � $ � 8 (2.19)
As can be easily verified, the last equation gives the same result for uniaxialsymmetry as Eq. (21) of Ref. [105], where the Cartesian off-diagonal
í �N�ma-
trices vanish andí a7a ÞV'V ; í a%a Þ���
. For the derivation of the above expression of� �
we did not assume any particular symmetry, therefore the resulting expressionis general.
A few relevant points about this method are that for electronic structurecalculations which employ an analytical basis set such as Gaussians, it is easierto take the derivative of the basis functions rather than that of the Coulombpotential. The treatment uses the Cartesian formulation as given above which isexact and therfore accounts for all contributions from the nuclear and electronicpotential which is a major part of the spin-other orbit effects. Further, althoughthe spin-orbit coupling is not incorporated into the self-consistent cycle, theresults are still quite accurate due to the fact that the first order perturbation
38
2.5. MOLECULAR MAGNETS
to density due to the operator
��ä�ù � Ø vanishes. This follows from the fact thatthe first order corrections to orbitals are purely imaginary.
Our calculations include all single-determinental two-electron interactionswhich have a classical origin due to the interaction of a moving spin 1/2 elec-tron in a field of charge protons and electrons. It does not include any effectswhich are related to multi-determinental overlap. These effects may be smallin the case that the metal-ion overlap is small as is the case for most singlemolecule magnets.
For gapless systems, direct diagonalization of the Hamiltonian including thespin-orbit operator can be used instead of second-order perturbation theory.The anisotropy hamiltonian is then determined by accounting for changes in thetrace as a function of the axis of quantization or magnetization direction. Be-cause of the small gaps in this problem we have used both exact diagonalizationand second-order perturbation theory for the results presented here. Howeverwe find that the results do not strongly depend on the numerical treatment eventhough the gaps near the Fermi level are small. Typical differences between theperturbative and exact diagonalization treatment are approximately 2-4 per-cent. We believe the reason for the accuracy of the perturbative treatment isthat the numerator in a second-order expansion vanishes as the square of thespatial overlap between states so that nearly degenerate pairs of occupied andunoccupied states which are spatially disparate will not contribute to the MAE.
2.5.2 Electronic structure of the Fe Ì magnet
Appendix J discusses the electronic structure of one of the most widely inves-tigated single molecule magnet. The octanuclear iron(III) Fe � -cluster has thechemical formula LNú�û9�'ü � üþý $ � � #ÿ������ $ � O � � , with tacn = 1,4,7-trizacyclononane(� ��� �Xýþ��� ).
The structure of the Fe � -cluster is shown in Figure 2.11. The approximateÍ � symmetry observed in the molecule [95], is formally broken by the presenceof halide atoms and water of crystallization.
The central iron atoms are connected by oxo-hydroxo bridges to the fourouter iron ions. The large spheres show the iron atoms, which are Fe(III) ionswith a ª � electron configuration. The ferrimagnetic coupling of spins betweenthe eight Fe atoms results in an å ; [ =
spin ground state [107] and is illus-trated by arrows inside the spheres. The organic tacn-rings are very importantfor stabilizing the magnetic core of the molecule because the three pairs of ni-trogen dangling bonds complete a quasi six-fold environment for the Fe atoms.Further, the tacn-rings separate the Fe � -clusters in the crystal, resulting in negli-gible intermolecular dipole fields which are typically of the order of 0.05T [99].The resulting formal charge states are nominally Fe
� �, (OH) Ç � O Ç � , and tacn
�leading to a molecule with an overall formal charge state of +8 which may then
39
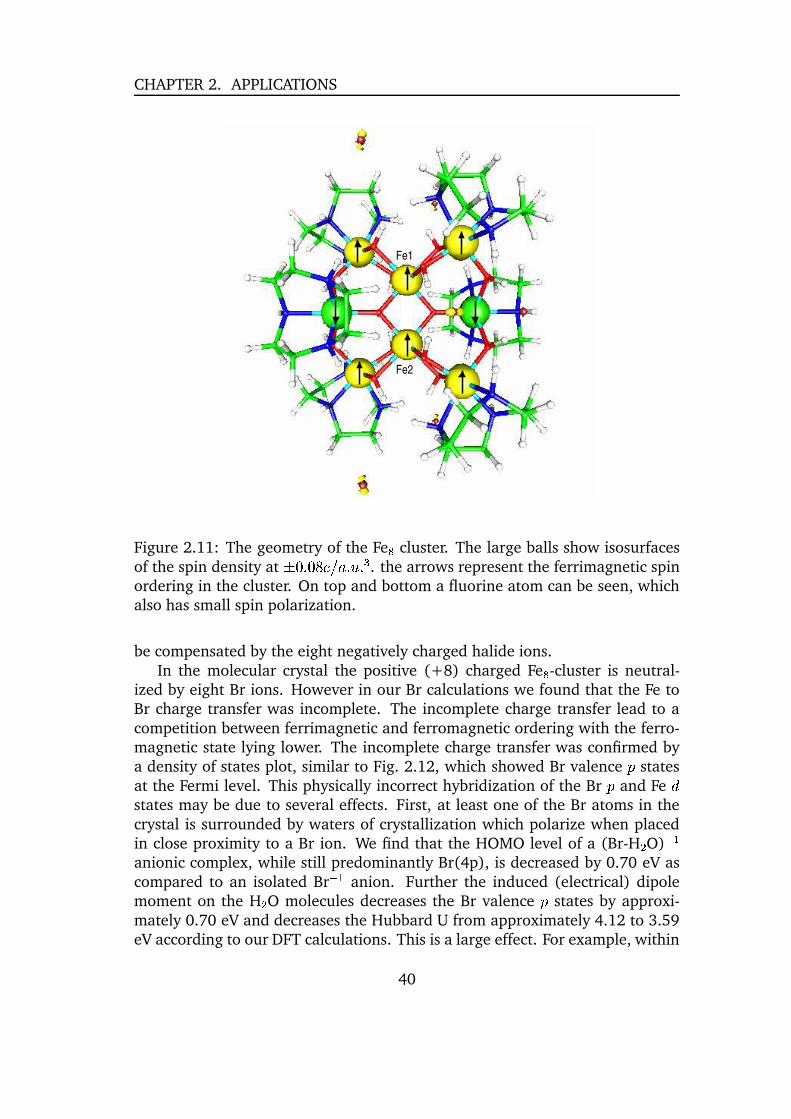
CHAPTER 2. APPLICATIONS
�����
Fe2
Fe1
Figure 2.11: The geometry of the Fe � cluster. The large balls show isosurfacesof the spin density at �
= 8 = ( � A�8ò¿¦8 � . the arrows represent the ferrimagnetic spinordering in the cluster. On top and bottom a fluorine atom can be seen, whichalso has small spin polarization.
be compensated by the eight negatively charged halide ions.In the molecular crystal the positive (+8) charged Fe � -cluster is neutral-
ized by eight Br ions. However in our Br calculations we found that the Fe toBr charge transfer was incomplete. The incomplete charge transfer lead to acompetition between ferrimagnetic and ferromagnetic ordering with the ferro-magnetic state lying lower. The incomplete charge transfer was confirmed bya density of states plot, similar to Fig. 2.12, which showed Br valence � statesat the Fermi level. This physically incorrect hybridization of the Br � and Fe ªstates may be due to several effects. First, at least one of the Br atoms in thecrystal is surrounded by waters of crystallization which polarize when placedin close proximity to a Br ion. We find that the HOMO level of a (Br-H � O) Ç �anionic complex, while still predominantly Br(4p), is decreased by 0.70 eV ascompared to an isolated Br Ç � anion. Further the induced (electrical) dipolemoment on the H � O molecules decreases the Br valence � states by approxi-mately 0.70 eV and decreases the Hubbard U from approximately 4.12 to 3.59eV according to our DFT calculations. This is a large effect. For example, within
40
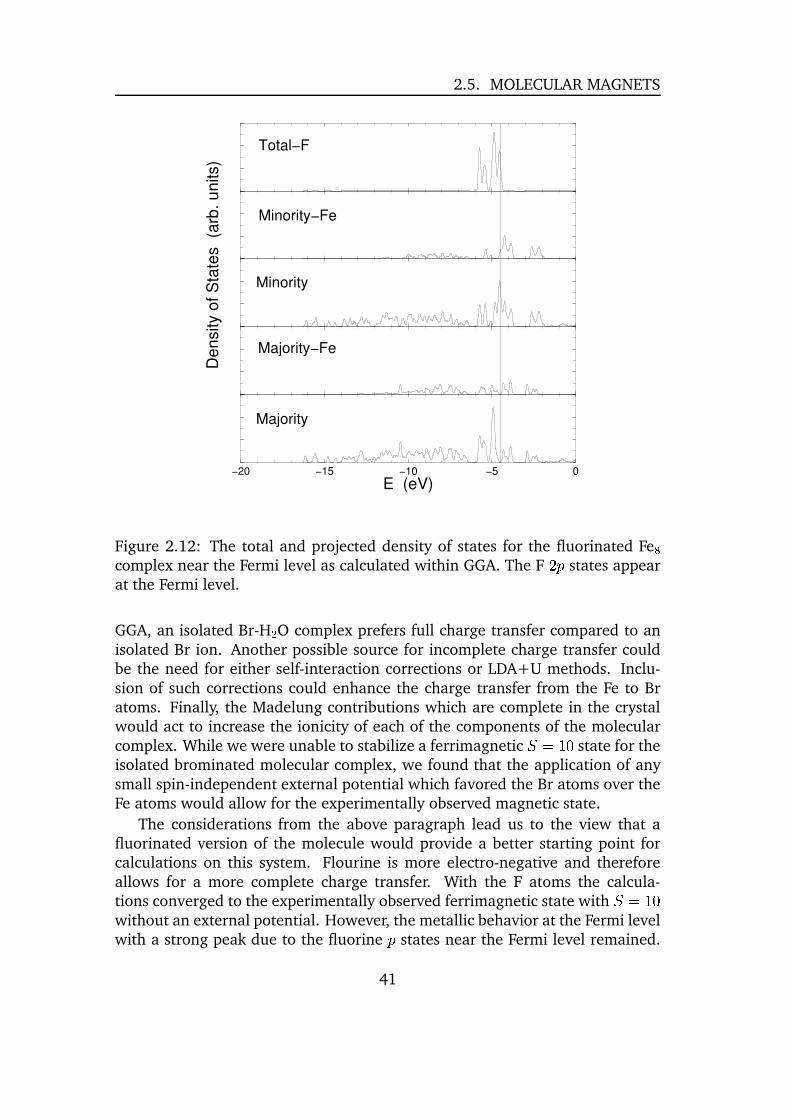
2.5. MOLECULAR MAGNETS
−20 −15 −10 −5 0E (eV)
Majority
Majority−Fe
Minority
Minority−Fe
Total−F
Den
sity
of S
tate
s (a
rb. u
nits
)
Figure 2.12: The total and projected density of states for the fluorinated Fe �complex near the Fermi level as calculated within GGA. The F
� � states appearat the Fermi level.
GGA, an isolated Br-H � O complex prefers full charge transfer compared to anisolated Br ion. Another possible source for incomplete charge transfer couldbe the need for either self-interaction corrections or LDA+U methods. Inclu-sion of such corrections could enhance the charge transfer from the Fe to Bratoms. Finally, the Madelung contributions which are complete in the crystalwould act to increase the ionicity of each of the components of the molecularcomplex. While we were unable to stabilize a ferrimagnetic å ; [ =
state for theisolated brominated molecular complex, we found that the application of anysmall spin-independent external potential which favored the Br atoms over theFe atoms would allow for the experimentally observed magnetic state.
The considerations from the above paragraph lead us to the view that afluorinated version of the molecule would provide a better starting point forcalculations on this system. Flourine is more electro-negative and thereforeallows for a more complete charge transfer. With the F atoms the calcula-tions converged to the experimentally observed ferrimagnetic state with å ; [ =without an external potential. However, the metallic behavior at the Fermi levelwith a strong peak due to the fluorine � states near the Fermi level remained.
41

CHAPTER 2. APPLICATIONS
Molecule S D(K) E(K) type ReferencesTheory Expt. Theory Expt. Theory Expt.
Mn � � 10 -0.56 -0.56 0 0 uniaxial [108] [109]Mn ��� 13 -0.06 -0.05 0 0 uniaxial [110] [111]Fe ¬ 5 -0.56 -0.57 0.06 0.05 triaxial [112]Cr � 3/2 -2.49 -2.66 0 0 uniaxial [113]
Table 2.4: Comparison of the calculated and experimental magnetic anisotropyparameters for the single molecule magnets discussed in the text.
This is shown in Fig. 2.12. We have used a Fermi-function with an electronictemperature of 0.001 a.u. for the occupation of states near the Fermi level.
2.5.3 Magnetic anisotropy in single molecule magnets
Up to second order, the spin Hamiltonian can in general be expressed as
�; �#�rh ��� �N� å � å � 6 (2.20)
where
ä 6Yï sum over ð¦6�èx6'u . Diagonalizing this particular anisotropy Hamiltoniandefines the set of principal axes and in the most general case identifies the easy,medium and hard axes. Using the eigenvalues one can rewrite (2.20) in themore often used standard form which differs from (2.20) by an insignificantadditional constant �
; Í�å �� � 0 å �V � å �� $ 6 (2.21)
where Í and
0are known as axial and transverse anisotropy parameters.
In Table 2.4 we present the calculated Í and
0parameters for a few single
molecule magnets and compare with the available experimental values. Werefer to these molecules in the text by their transition metal core since it isthese atoms which are responsible for their magnetic behavior. In all the casespresented here the spin ordering is in agreement with experiment. In all casesexcept Fe ¬ , the geometries were optimized till the forces on the atoms becamenegligible. The geometry optimizations were carried out at the all-electron leveland to reduce computational costs, the symmetry of the molecule was exploitedwhenever possible.
The calculated Í and
0parameters for Mn � � , Mn ��� , the ferric star Fe ¬ and
Cr-amide molecular magnets are in excellent agreement with experimental val-ues. The single molecule magnets are in general characterized by a high spinground-state. However, as can be seen from Table 2.4, a high spin state doesnot necessarily correlate with a high anisotropy barrier.
Some detailed discussion of these results will be given below.
42
2.5. MOLECULAR MAGNETS
Mn � � -acetate
The Mn � � molecule has S ¬ symmetry and therefore the calculations were carriedout using only 25 inequivalent atoms. Moreover, in Mn � � , the acetate unitswere replaced by formate groups (OOCH) so as to reduce the computationalefforts while keeping the core of the molecule the same. This molecule hasferrimagnetic spin ordering with an inner core of Mn ¬ O ¬ of minority spin atomsand an outer ring of Mn � O � majority spin atoms. The inner-core Mn atoms havespin magnetic moment of
� µ q B whereas the outer ones have 4q B thus leading
to a net magnetic moment of 20q B .
The HOMO and the LUMO belong to the majority spin channel and the gapis quite small 0.45 eV [105]. The density of states near the Fermi level aredominated by the Mn 3d states and has also some contribution from oxygen2p states. Although the states near the Fermi level belong to the majority spinchannel, it is actually the majority occupied and minority unoccupied stateswhich contribute nearly 65% of the anisotropy barrier. For more informationsee [104,105,108,114,115].
Mn ��� cluster
The [Mn ��� O ¬ (2,2’-biphenoxide) ¬ Br � � ] ¬ Ç functional unit is compensated by clus-ter with a single Mn center [Mn(CH � CN) ¬ (H � O) � ]. Experimental results suggestthat the magnetic anisotropy is due to the localized valence electrons of the tenMn atoms and our calculations on the [(CH � CH � ) � NH] � [Mn(CH � CN) ¬ (H � O) � ]confirm that this unit behaves as a charge compensating paramagnetic spec-tator. High-field EPR measurements have determined that the molecule in itsground state has spin å ; [ �
. However, our calculations have shown that thisspin state would not be magnetically stable since there would be no commonFermi level in the majority and minority channels. As a result we obtained aå ; [ µ spin state. This is consistent with experiment since it is difficult todifferentiate between the two possibilities experimentally [116].
The majority gap is also in the case of Mn ��� much smaller than the mi-nority one [110]. In Mn ��� , all matrix elements from the occupied majorityelectrons prefer an easy-axis system whereas the matrix elements from the oc-cupied minority spin channel would result in an easy-plane system. There isa competition between these possibilities and due to the larger contributionfrom the occupied majority spin channel the system ends up as an easy-axissystem. Therefore, in spite of the fact that Mn ��� possesses a high-spin state, theanisotropy barrier in this system is small. The calculated barrier height of 9.5Kcompares reasonably well with the experimental value of 7.7K [111]. We foundthat the removal of subsets of the Br ions will change the magnetic anisotropydrastically by changing the electronic structure. However, neutralizing the elec-tric field due to Br ions by an external potential in the calculations changed the
43
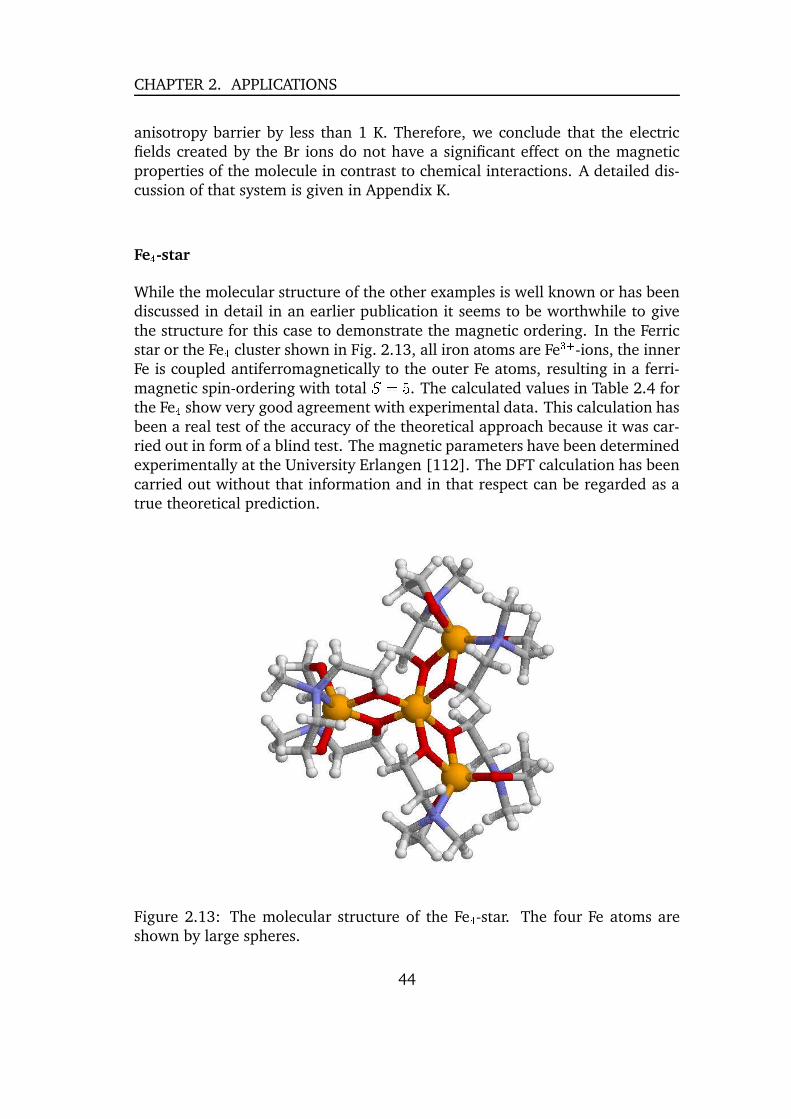
CHAPTER 2. APPLICATIONS
anisotropy barrier by less than 1 K. Therefore, we conclude that the electricfields created by the Br ions do not have a significant effect on the magneticproperties of the molecule in contrast to chemical interactions. A detailed dis-cussion of that system is given in Appendix K.
Fe ¬ -star
While the molecular structure of the other examples is well known or has beendiscussed in detail in an earlier publication it seems to be worthwhile to givethe structure for this case to demonstrate the magnetic ordering. In the Ferricstar or the Fe ¬ cluster shown in Fig. 2.13, all iron atoms are Fe
� �-ions, the inner
Fe is coupled antiferromagnetically to the outer Fe atoms, resulting in a ferri-magnetic spin-ordering with total å ; Ñ . The calculated values in Table 2.4 forthe Fe ¬ show very good agreement with experimental data. This calculation hasbeen a real test of the accuracy of the theoretical approach because it was car-ried out in form of a blind test. The magnetic parameters have been determinedexperimentally at the University Erlangen [112]. The DFT calculation has beencarried out without that information and in that respect can be regarded as atrue theoretical prediction.
Figure 2.13: The molecular structure of the Fe ¬ -star. The four Fe atoms areshown by large spheres.
44
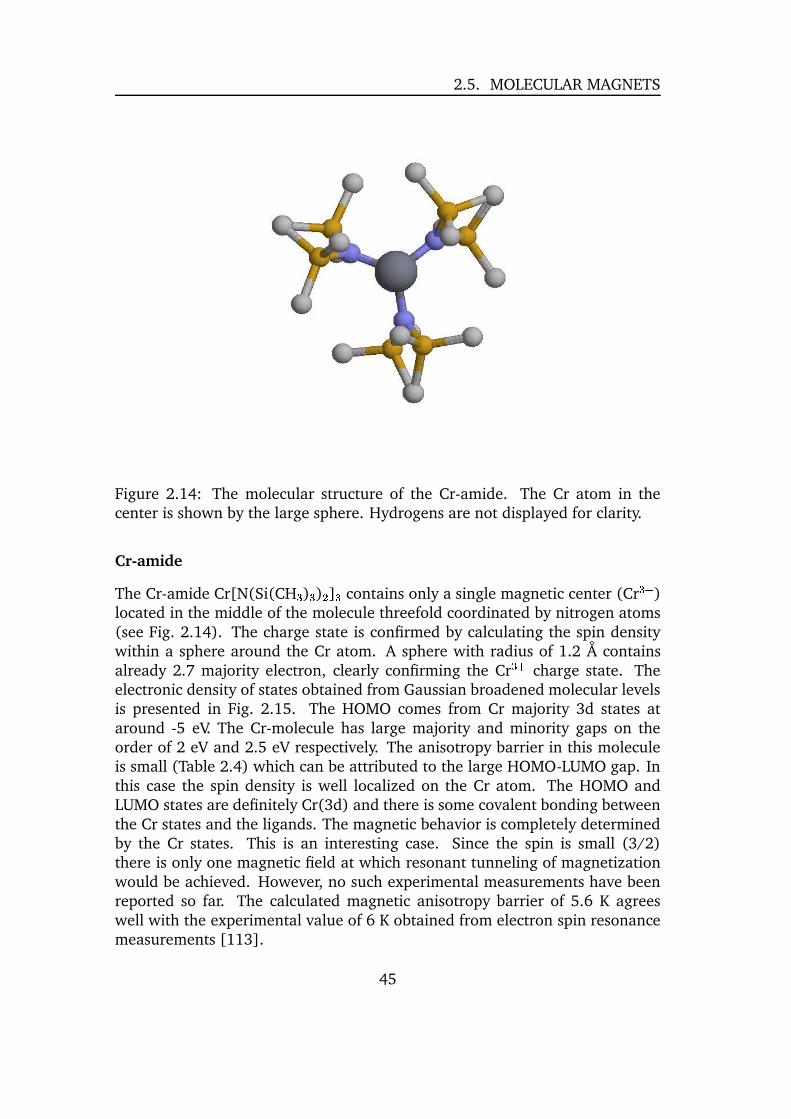
2.5. MOLECULAR MAGNETS
Figure 2.14: The molecular structure of the Cr-amide. The Cr atom in thecenter is shown by the large sphere. Hydrogens are not displayed for clarity.
Cr-amide
The Cr-amide Cr[N(Si(CH � ) � ) � ] � contains only a single magnetic center (Cr� �
)located in the middle of the molecule threefold coordinated by nitrogen atoms(see Fig. 2.14). The charge state is confirmed by calculating the spin densitywithin a sphere around the Cr atom. A sphere with radius of 1.2 A containsalready 2.7 majority electron, clearly confirming the Cr
� �charge state. The
electronic density of states obtained from Gaussian broadened molecular levelsis presented in Fig. 2.15. The HOMO comes from Cr majority 3d states ataround -5 eV. The Cr-molecule has large majority and minority gaps on theorder of 2 eV and 2.5 eV respectively. The anisotropy barrier in this moleculeis small (Table 2.4) which can be attributed to the large HOMO-LUMO gap. Inthis case the spin density is well localized on the Cr atom. The HOMO andLUMO states are definitely Cr(3d) and there is some covalent bonding betweenthe Cr states and the ligands. The magnetic behavior is completely determinedby the Cr states. This is an interesting case. Since the spin is small (3/2)there is only one magnetic field at which resonant tunneling of magnetizationwould be achieved. However, no such experimental measurements have beenreported so far. The calculated magnetic anisotropy barrier of 5.6 K agreeswell with the experimental value of 6 K obtained from electron spin resonancemeasurements [113].
45

CHAPTER 2. APPLICATIONS
-15 -10 -5 0Energy (eV)
MIN
OR
ITY
DO
SM
AJO
RIT
Y D
OS
Chrom 3d
Total
Chrom 3d
Total
Figure 2.15: The electronic density of states of the Cr-amide. The HOMO isderived from Cr majority 3d spin states at -5 eV. The molecular levels have beenbroadened by a Gaussian.
2.5.4 The V �� spin system
The � � L��g������� � ü�¬ � ý � ü $YO ý � ü molecular crystal, first synthesized by Mullerand Doring [100], represents a transition-metal spin system in the same sizeregime as the Mn � � and Fe � molecular crystals. In contrast to Mn � � and Fe �molecules, the V ��� molecule is thought to behave as a weakly anisotropic mag-net composed of 15 spin � =1/2 particles which couple together to form amolecule with a total spin å =1/2 ground state. Calculations on such corre-lated systems present a challenge to mean-field frameworks such as density-functional theory because it is often not possible to construct a single collinearreference state which preserves the inherent symmetry of the system and hasthe correct spin quantum numbers. Appendix J presents some results on theelectronic structure calculations of this system.
The work in Appendix L utilizes an efficient coupled multilevel analysiswhich relies on fitting density-functional energies to mean-field Heisenberg orIsing energies in order to determine the exchange parameters. The approxi-mate exchange parameters gleaned from the first
Ising configurations were
used to find the next lowest energy Ising configuration and subsequently toimprove the parameterization of the exchange parameters. “Self Consistency”of this approach is determined when the predicted Ising levels are unchanged
46
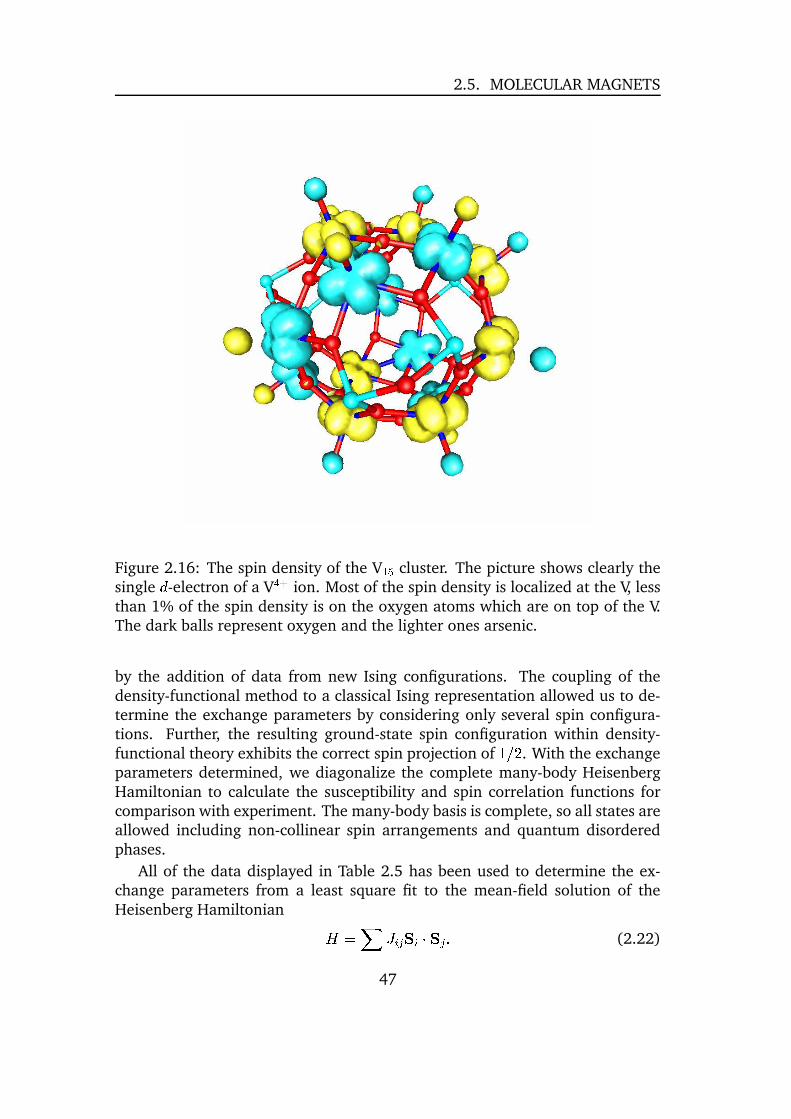
2.5. MOLECULAR MAGNETS
Figure 2.16: The spin density of the V ��� cluster. The picture shows clearly thesingle ª -electron of a V
¬ �ion. Most of the spin density is localized at the V, less
than 1% of the spin density is on the oxygen atoms which are on top of the V.The dark balls represent oxygen and the lighter ones arsenic.
by the addition of data from new Ising configurations. The coupling of thedensity-functional method to a classical Ising representation allowed us to de-termine the exchange parameters by considering only several spin configura-tions. Further, the resulting ground-state spin configuration within density-functional theory exhibits the correct spin projection of
[_� �. With the exchange
parameters determined, we diagonalize the complete many-body HeisenbergHamiltonian to calculate the susceptibility and spin correlation functions forcomparison with experiment. The many-body basis is complete, so all states areallowed including non-collinear spin arrangements and quantum disorderedphases.
All of the data displayed in Table 2.5 has been used to determine the ex-change parameters from a least square fit to the mean-field solution of theHeisenberg Hamiltonian �
; � � �U� Ø � � Ø � 8 (2.22)
47
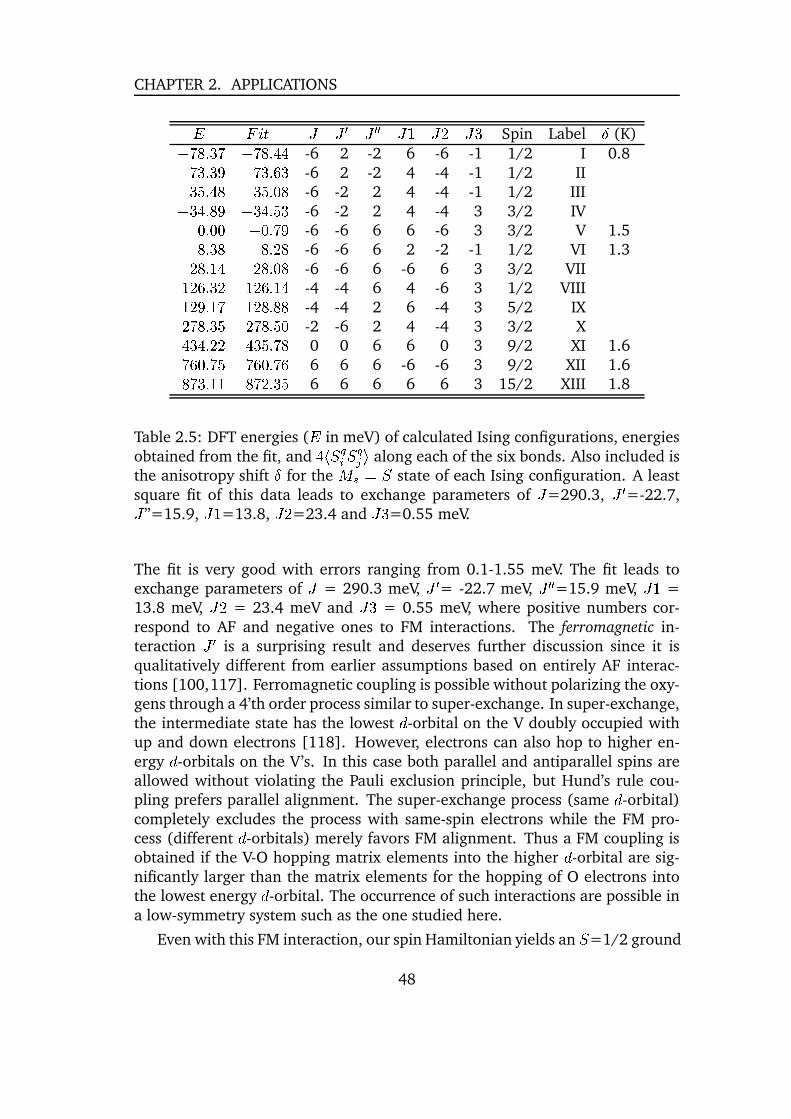
CHAPTER 2. APPLICATIONS0 � ä � � � ^ � ^ ^ � [ � � � µ Spin Label
l(K)
� à 8ŵ}à � à 8 )+) -6 2 -2 6 -6 -1 1/2 I 0.8� Ãsµ�8ŵ�� � Ãsµ 8 Ò µ -6 2 -2 4 -4 -1 1/2 II� µ§Ñ 8 ) � µ§ÑC8 = -6 -2 2 4 -4 -1 1/2 III� µ ) 8 � � µ ) 8zÑsµ -6 -2 2 4 -4 3 3/2 IV= 8 =§= � = 8zÃ�� -6 -6 6 6 -6 3 3/2 V 1.5 8ŵ 8 �� -6 -6 6 2 -2 -1 1/2 VI 1.3�� 8 [ ) �� 8 = -6 -6 6 -6 6 3 3/2 VII[ � Ò 8ŵ � [ � Ò 8 [ ) -4 -4 6 4 -6 3 1/2 VIII[ � �C8 [ à [ �� 8 � -4 -4 2 6 -4 3 5/2 IX� à 8ŵ}Ñ � à 8zÑ = -2 -6 2 4 -4 3 3/2 X) µ ) 8 �§� ) µ}Ñ�8zà 0 0 6 6 0 3 9/2 XI 1.6Ã Ò = 8zÃ§Ñ Ã Ò = 8zÃ Ò 6 6 6 -6 -6 3 9/2 XII 1.6 Ã+µC8 [§[ à � 8ŵ§Ñ 6 6 6 6 6 3 15/2 XIII 1.8
Table 2.5: DFT energies (
0in meV) of calculated Ising configurations, energies
obtained from the fit, and) à å��� å �� â along each of the six bonds. Also included is
the anisotropy shift
lfor the
í È ; å state of each Ising configuration. A leastsquare fit of this data leads to exchange parameters of
�=290.3,
� ^=-22.7,�
”=15.9,� [
=13.8,� �
=23.4 and� µ =0.55 meV.
The fit is very good with errors ranging from 0.1-1.55 meV. The fit leads toexchange parameters of
�= 290.3 meV,
� ^= -22.7 meV,
� ^ ^=15.9 meV,
� [=
13.8 meV,� �
= 23.4 meV and� µ = 0.55 meV, where positive numbers cor-
respond to AF and negative ones to FM interactions. The ferromagnetic in-teraction
� ^is a surprising result and deserves further discussion since it is
qualitatively different from earlier assumptions based on entirely AF interac-tions [100,117]. Ferromagnetic coupling is possible without polarizing the oxy-gens through a 4’th order process similar to super-exchange. In super-exchange,the intermediate state has the lowest ª -orbital on the V doubly occupied withup and down electrons [118]. However, electrons can also hop to higher en-ergy ª -orbitals on the V’s. In this case both parallel and antiparallel spins areallowed without violating the Pauli exclusion principle, but Hund’s rule cou-pling prefers parallel alignment. The super-exchange process (same ª -orbital)completely excludes the process with same-spin electrons while the FM pro-cess (different ª -orbitals) merely favors FM alignment. Thus a FM coupling isobtained if the V-O hopping matrix elements into the higher ª -orbital are sig-nificantly larger than the matrix elements for the hopping of O electrons intothe lowest energy ª -orbital. The occurrence of such interactions are possible ina low-symmetry system such as the one studied here.
Even with this FM interaction, our spin Hamiltonian yields an å =1/2 ground
48

2.5. MOLECULAR MAGNETS
J
J
J1
J1
J2
J2
J’
J’
J’’
J’’
J3
J3
Figure 2.17: The 15 magnetic vanadium atoms of the � � L��g������� � ü ¬ � ý � ü $POmolecule. They form two hexagonal layers and an inner triangular layer ofvanadium atoms sandwiched within. The arrows show the lowest energy spinconfiguration found from DFT calculations. The six exchange parameters usedin the Heisenberg Hamiltonian are shown as lines. Schematically displayed areenergy levels of the Kramer doublet ( å =1/2) ground state and the low lyingquadruplet ( å =3/2) separated by
�.
state composed largely of Ising configurations similar to the one depicted inFig. 2.17. This Ising configuration was predicted from the
�’s from earlier fits
to DFT energies and corresponds to the ground state DFT configuration (I).
Comparing our calculated susceptibility with experiment [117], we find thelow-temperature behavior indicates our doublet-quadruplet gap
�"! [ =K to be
significantly larger than the experimental value of�#! µ 8ÅÃ K, while the high-
temperature behavior shows our calculated value of�
is too large. Both ofthese discrepancies can be explained almost entirely by a
�that is too large
within the density-functional-based treatment. We note that only the V-V bondlength corresponding to
�obtained from our DFT optimized geometry (GGA)
is too short compared with experiment [119]. The large value of�
can beattributed to both exchange processes through the oxygens and to direct ex-change between the V. If direct exchange is important, the value of
�will be
49

CHAPTER 2. APPLICATIONS
influenced greatly by the overlap between the V atoms. Similarly, the hightemperature behavior will be greatly influenced by changes in geometry, effec-tively making
�temperature dependent. At higher temperatures more high
spin configurations get populated, which will have a different geometry thanthe low temperature å ; µ � � configuration used for geometry optimization.Geometry relaxation will influence the ferromagnetic configuration (XII) most,which is also responsible for the large
�, making
�significantly smaller. Sim-
ilarly, self-interaction-corrections (SIC) will decrease�
because it will localizethe vanadium ª -orbitals more, decreasing the overlap of the wavefunctions.
In order to determine if our enhanced�
may be due to spurious on-site re-pulsions associated with the DFT, we have approximately accounted for the ef-fects of self-interaction-corrections (SIC) in model calculations on V dimers (V �and V � O ��� ) with electronic structure constrained to match that of the dimers inthe V ��� cluster. The results, while preliminary, show that SIC induced changesin the wavefunctions could decrease the direct contributions to
�by a factor of
3 which supports the reduction of�
to yield better agreement between experi-ment and theory.
50

Chapter 3
Summary
This work presented selected publications of the author in the field of elec-tronic structure calculations. The author carried out all density functional the-ory calculation for the systems discussed in the Appendices by himself and isresponsible for a major part of the theoretical interpretations.
After a short introduction to DFT the author discussed the NRLMOL pro-gram package which has been used in most of the cases discussed later in thework. The author contributed actively to the development of NRLMOL by im-plementing several new features as calculations of hyperfine fields, electric fieldgradients, simple thermodynamic properties, local charges and spin densitiesand arbitrary external potentials. Further, he was involved to a great extentin the parallelization of the code and testing and implementation of the spin-orbit capability. The last two achievements have been the basic prerequisite forinvestigations of single molecule magnets.
The discussion in Section 2.1 focuses on the electronic structure as a mea-sureable quantity itself. There are now several experimental techniques avail-able to probe the electronic structure directly. Basically all these standard meth-ods have been used for the superconductor MgB � . While any single methodalways leaves some doubts, the overall excellent agreement of the from DFTtheoretically predicted electronic structure with all the experimental methodsgives us great confidence in the calculations. This is very important, becausemost of the theories trying to explain the superconductivity or optical and trans-port properties rely on this electronic structure.
Electric field gradients do not probe the band structure directly but ratherthe quality of the obtained charge density. Obviously, these two quantities areclosely connected as evident by the Kohn-Sham equation. Modern DFT imple-mentations give very accurate values of the EFG, so that theoretical calculationsare often an integral part for the interpretation of experimental data. Similarly,vibrational properties offer a deep insight in materials as shown in Section 2.3.The calculation of vibrational frequencies and IR and Raman intensities fromDFT is well established by now. Therefore first-principles calculations become
51
CHAPTER 3. SUMMARY
also here a very important tool in understanding experiments. The exampleshave been selected to show how this kind of calculation can be used for ex-plaining experimental results, but also that there is enough confidence in themethod to make predictions. Certainly, the author hopes that chemists will beable to synthesize azidopentazole and can confirm the predicted properties.
Magnetic materials play a very important role in many areas of technology.In Section 2.4 and 2.5 the author presents results of his work in that field.Most of the work is directed towards the calculation and understanding of themagnetic anisotropy energy. The ability to quantitatively determine which elec-trons are important for forming the anisotropy energy allows to investigate howchemical and physical modification of assembled arrays of molecular magnetswill effect thermal reorientation barriers and spin-tunneling fields. The under-standing of the magnetic properties from fundamental research does not onlyprovide information to chemists in order to design novel materials, but canalso help to suggest new solutions in other technologically interesting areas.The study of the quantum effects and the dynamics of the magnetization mightalso help to understand the transition from pure magnetic quantum systems tomacroscopic magnetism.
New and interesting physics nearly always arises if different phenomena ap-pear at the same time. The coupling of the vibrational degrees of freedom, thephonons, to the electronic degrees of freedom, the electrons, gives rise to su-perconductivity, which can be also understood from DFT. Superconductivity inMgB
�, driven by the electron-phonon coupling, has been a major research area
of the author [44, 45, 69–76], only publications directly concerned with elec-tronic structure properties have been discussed here. The magnetic orderingis sensitive to the vibrations. The coupling of vibrational degrees of freedomto the magnetic ones giving rise to fourth-order magnetic anisotropy has alsobeen part of the authors research [120].
What have all these examples in common? The used methods cover finitesystems, molecules and clusters, as well as infinite systems, solids with peri-odic crystal structure. The author wanted to show that the DFT can be appliedsuccessfully in very different areas. The good agreement of first-principles cal-culations with experimental results without using any experimental data as in-put allows for real predictions. Predictions of new materials with customizedproperties made on a computer. The progress in this field gives us enough con-fidence to use the term computer experiments as a fertile option for the future.Besides the classical division of physics in experimental and theoretical physics,physics on the computer may be a third column on which physics rests.
52

Bibliography
[1] C. Kittel Introduction to Solid State Physics, John Wiley and Sons, (NewYork, 1963).
[2] P. Hohenberg and W. Kohn, Phys. Rev. 136, B864 (1964).
[3] W. Kohn and L. J. Sham, Phys. Rev. 140, A1133 (1965).
[4] R. O. Jones and O. Gunnarsson, Rev. Mod. Phys. 61, 689 (1989).
[5] O. K. Andersen, Band structure of transition metals, Mont Tremblant in-ternational summer school 1973; O. K. Andersen Electronic structure of
metals Lecture Notes 1977/78; (The yellow LMTO bibels).
[6] Lecture Notes in Physics, Ed. D. Joubert, Density functionals, Springer(Heidelberg) 1998.
[7] R. M. Dreizler and E. K. U. Gross, Density functional Theory, Springer(Berlin) 1990.
[8] H. Eschrig, The Fundamentals of Density Functional Theory, Teubner(Stuttgart, Leipzig) 1996.
[9] O. Gunnarsson and B. I. Lundqvist, Phys. Rev. B 13, 4274 (1976).
[10] D. M. Ceperley and B. J. Alder, Phys. Rev. Lett. 45, 566 (1980).
[11] W. M. C. Foulkes, L. Mitas, R. J. Needs and G. Rajagopal, Rev. Mod. Phys.73, 33 (2001)
[12] U. von Barth and L. Hedin, J. Phys. C 5, 2064 (1972).
[13] S. H. Vosko, L. Wilk, and M. Nusair, Can. J. Phys. 58, 1200 (1980).
[14] J. P. Perdew and A. Zunger, Phys. Rev. B 23, 5048 (1981).
[15] J. P. Perdew, K. Burke and M. Ernzerhof, Phys. Rev. Lett. 77, 3865 (1996).
[16] J. P. Perdew, J. A. Chevary, S. H. Vosko, K. A. Jackson, M. R. Pederson, D.Singh and C. Fiolhais, Phys. Rev. B 45, 6671 (1992).
53
[17] A. Becke, Phys. Rev. A 38, 3098 (1988);A. D. Becke, J. Chem. Phys. 98(1993) 13
[18] C. Lee, W. Yang, and R. G. Parr, Phys. Rev. B 37, 785-789 (1988).
[19] B.Delley, J.Chem.Phys.92 508 (1990); ibid. 94 7245 (1991); ibid 113
7756 (2000): B. Delley, J. Phys. Chem. 100 6107 (1996).
[20] E. Wimmer, H. Krakauer, M. Weinert and J. Freeman, Phys. Rev. B 24,864 (1981).
[21] O. K. Andersen, Phys. Rev. B 12, 3060 (1975).
[22] J. A. Pople et al, GAUSSIAN94 (Gaussian, Inc., Pittsburgh PA, 1994).
[23] E. E. Lafon and C. C. Lin, Phys. Rev. 152, 579 (1966).
[24] G. S. Paynter and F. W. Averill, Phys. Rev. B 26, 1781 (1982).
[25] B. I. Dunlap, J. W. Connolly, and J. R. Sabin, J. Chem. Phys. 71, 3396(1979).
[26] J. Andzelm, E. Radzio and D. R. Salahub, J. Comput. Chem. 6, 520(1985).
[27] R. Jones and A. Sayyash, J. PHys. C 19, L653 (1986).
[28] W. J. Hehre, L. Radom, P. V. R. Schleyer, and J. A. Pople, Ab-Initio Molec-
ular Orbital Theory, John Wiley and Sons Inc, New York (1986).
[29] M. R. Pederson and C. C. Lin, Phys. Rev. B 35, 2273 (1987).
[30] M. R. Pederson and K. A. Jackson, Phys. Rev. B 41, 7453 (1990).
[31] K. A. Jackson and M. R. Pederson, Phys. Rev. B 42, 3276 (1990).
[32] M. R. Pederson and K. A. Jackson, Phys. Rev. B 43, 7312 (1991).
[33] A. A. Quong, M. R. Pederson and J. L. Feldman, Sol. Stat. Comm. 87,535 (1993).
[34] M. R. Pederson, J. Q. Broughton and B. M. Klein, Phys. Rev. B 38, 3825(1988).
[35] D. V. Porezag and M. R. Pederson, Phys. Rev. B 54, 7830 (1996).
[36] A. Briley, M. R. Pederson, K. A. Jackson, D. C. Patton, and D. V. Porezag,Phys. Rev. B 58, 1786 (1998).
54

[37] D. Porezag and M. R. Pederson, Phys. Rev. A 60, 2480, (1999).
[38] M. R. Pederson, D. V. Porezag, J. Kortus and D. C. Patton, phys. stat. sol.(b) 217, 197 (2000).
[39] See D.D. Johnson, Phys. Rev. B 38, 12807 (1988) and references therein.
[40] H. Hellmann, Einfuhrung in die Quantentheorie, Deuticke, Leipzig,(1937); R. P. Feynman, Phys. Rev. 56, 340 (1939); P. Pulay, Mol. Phys.17, 197 1969).
[41] J. Nagamatsu, N. Nakagawa, T. Muranaka, Y. Zenitani and J. Akimitsu,Nature (London) 410, 63 (2001).
[42] M. L. Kulic, Phys. Rep. 338, 1-264 (2000)
[43] E. G. Maksimov, Uspek. Fiz. Nauk 170, 1033-1061 (2000).
[44] J. Kortus, I.I. Mazin, K.D. Belashchenko, V.P. Antropov, and L.L. Boyer,Phys. Rev. Lett. 86, 4656 (2001).
[45] A. Y. Liu, I. I. Mazin and J. Kortus, Phys. Rev. Lett. 87, 087005 (2001).
[46] Y. Kong, O.V. Dolgov, O. Jepsen, and O.K. Andersen, Phys. Rev. B 64,20501 (2001).
[47] E. A. Yelland, J. R. Cooper, A. Carrington, N. E. Hussey, P. J. Meeson, S.Lee, A. Yamamoto, S. Tajima, Phys. Rev. Lett. 88, 217002 (2002).
[48] H. Uchiyama, K.M. Shen, S. Lee, A. Damascelli, D.H. Lu, D.L. Feng, Z.-X.Shen, and S.Tajima, Phys. Rev. Lett. 88, 157002 (2002).
[49] J.M. An and W.E. Pickett, Phys. Rev. Lett. 86, 4366 (2001).
[50] Electrons at the Fermi surface, Ed. M. Springford, Cambridge UniversityPress 1980.
[51] H. Rosner, J. M. An, W. E. Pickett, S.-L. Drechsler, Phys. Rev. B 66,024521 (2002).
[52] R. Courths, S. Hufner, Phys. Rep. 112, 53 (1984).
[53] S. Hufner, Photoelectron Spectroscopy, Springer (Berlin) 1995.
[54] V. D. P. Servedio, S.-L. Drechsler, and T. Mishonov, Phys. Rev. B 66,140502 (R) (2002).
[55] A. Alexandrov, cond-mat/0104413
55
[56] E. Cappellutti, S. Ciuchi, C. Grimaldi, L. Pietronero, and S. Strassler,Phys. Rev. Lett. 88, 117003 (2002).
[57] P. Blaha, K. Schwarz, and J. Luitz, WIEN97, A FLAPW package for cal-culating crystal properties (Vienna Austria, ISBN 3-9501031-0-4) 1999;Vienna University of Technology, 1997. Improved and updated versionof the original copyrighted WIEN code, which was published by P. Blaha,K. Schwarz, P. Sorantin, and S. B. Trickey, Comput. Phys. Commun. 59,399 (1990).
[58] U. von Barth and G. Grossmann, Solid State Commun. 32, 645 (1979);U. von Barth and G. Grossmann, Phys. Rev. B 25, 5150 (1982).
[59] H. Suhl, B. T. Matthias, and L. R. Walker Phys. Rev. Lett. 3, 552-554(1959).
[60] S. V. Shulga, S.-L. Drechsler, H. Eschrig, H. Rosner, and W.E. Pickett,cond-mat/0103154.
[61] F. Giubileo, D. Roditchev, W. Sacks, R. Lamy, D.X. Thanh, J. Klein, S.Miraglia, D. Fruchart, J. Marcus, and Ph. Monod, Phys. Rev. Lett. 87,177008 (2001); F. Giubileo, D. Roditchev, W. Sacks, R. Lamy, J. Klein,cond-mat/0105146.
[62] Y. Bugoslavsky, Y. Miyoshi, G.K. Perkins, A.V. Berenov, Z. Lockman,J.L. MacManus-Driscoll, L.F. Cohen, A.D. Caplin, H.Y. Zhai, M.P. Paran-thaman, H.M. Christen, and M. Blamire, cond-mat/0110296.
[63] P. Szabo, P. Samuely, J. Kacmarcık, T. Klein, J. Marcus, D. Fruchart, S.Miraglia, C. Marcenat, and A.G.M. Jansen, Phys. Rev. Lett. 87, 137005(2001).
[64] S. Tsuda, T. Yokoya, T. Kiss, Y. Takano, K. Togano, H. Kito, H. Ihara, andS. Shin, Phys. Rev. Lett. 87, 177006 (2001).
[65] X.K. Chen, M.J. Konstantinovic, J.C. Irwin, D.D. Lawrie, and J.P. Franck,Phys. Rev. Lett. 87, 157002 (2001).
[66] Y. Wang, T. Plackowski, and A. Junod, Physica C 355, 179 (2001); F.Bouquet, R.A. Fisher, N.E. Phillips, D.G. Hinks, and J.D. Jorgensen, Phys.Rev. Lett. 87, 047001 (2001); H.D. Yang, J.-Y. Lin, H.H. Li, F.H. Hsu, C.J.Liu, S.-C. Li, R.-C. Yu, and C.-Q. Jin , Phys. Rev. Lett. 87, 167003 (2001).
[67] Ch. Niedermayer, C. Bernhard, T. Holden, R.K. Kremer, K. Ahn, Phys.Rev. B 65, 094512 (2002).
[68] C. Buzea and T. Yamashita, Supercond. Sci. Technol. 14, R115(2001).
56

[69] A. A. Golubov, J. Kortus, O. V. Dolgov, O. Jepsen, Y. Kong, O. K. Andersen,B. J. Gibson, K. Ahn, R. K. Kremer, J. Phys.: Cond. Mat. 14, 1353 (2002).
[70] E. Z. Kurmaev, I. I. Lyakhovskaya, J. Kortus, A. Moewes, N. Miyata, M.Demeter, M. Neumann, M. Yanagihara, M. Watanabe, T. Muranaka, andJ. Akimitsu, Phys. Rev. B 65, 134509 (2002).
[71] I. I. Mazin and J. Kortus, Phys. Rev. B 65, 180510 (R) (2002).
[72] A. B. Kuz’menko, F. P. Mena, H. J. A. Molegraaf, D. van der Marel, B.Gorshunov, M. Dressel, I. I. Mazin, J. Kortus, O. V. Dolgov, T. Muranaka,and J. Akimitsu, Solid State Commun. 121, 479 (2002).
[73] A. Brinkman, A. A. Golubov, H. Rogalla, O. V. Dolgov, J. Kortus, Y. Kong,O. Jepsen, and O. K. Andersen, Phys. Rev. B 65, 180517 (R) (2002).
[74] A. A. Golubov, A. Brinkman, O. V. Dolgov, J. Kortus, and O. Jepsen, Phys.Rev. B 66, 054524 (2002)
[75] I. I. Mazin, O. K. Andersen, O. Jepsen, O. V. Dolgov, J. Kortus, A. A.Golubov, A. B. Kuz’menko, and D. van der Marel, Phys. Rev. Lett. 89,107002 (2002).
[76] E. G. Maksimov, J. Kortus, O. V. Dolgov, and I. I. Mazin, Phys. Rev. Lett.89, 129703 (2002).
[77] K. A. Jackson, S. Srinivas, J. Kortus, and M. R. Pederson, Phys. Rev. B65, 214201 (2002)
[78] D. M. Bishop and S. M. Cybulski, J. Chem. Phys. 100, 6628 (1994).
[79] S. Unterricker and F. Schneider, Hyperfine Interactions 39, 39 (1988).
[80] B. Kamb, Science 148, 232 (1965).
[81] P.E. Eaton and T.W. Cole, Jr., J. Am. Chem. Soc. 86 (1964) 3158.
[82] P.C. Hariharan, J.J. Kaufman, A.H. Lowrey, and R.S. Miller, Int. J. Quan-tum Chem. 28 (1985) 39.
[83] D.A. Chapman, J.J. Kaufman, and R.J. Buenker, Int. J. Quantum Chem.1 (1991) 389.
[84] M-X. Zhang, P.E. Eaton, and R. Gilardi, Angew. Chem. Int. Ed.39 (2000)401.
[85] K.O. Christie, W.W. Wilson, J.A. Sheehy and J.A. Boatz, Angew. Chem.Int. Ed. 38 (1999) 2004.
57
[86] M.N. Glukhovtsev, H. Jiao, P.v.R. Schleyer, Inorg. Chem. 35 (1996) 7124.
[87] M.T. Nguyen and T.K. Ha, Chem. Ber. 129 (1996) 1157.
[88] G. Chung, M.W. Schmidt, and M.S. Gordon, J. Phys. Chem. 104 (2000)5647.
[89] L. Gagliardi, S. Evangelisti, A. Bernhardsson, R. Lindh, B.O. Roos, Int.J. Quantum Chem., 77 (2000) 311; L. Gagliardi, S. Evangelisti, P.-O.Widmark, B.O. Roos, Theor. Chem. Acc. 97 (1997) 136.
[90] Q. Wang, Q. Sun, M. Sakurai, J. Z. Yu, B. L. Gu, K. Sumiyama and Y.Kawazoe, Phys. Rev. B 59, 12672 (1999).
[91] Q. Sun, Q. Wang, K. Parlinski, J. Z. Yu, Y. Hashi, X. G. Gong and Y.Kawazoe, Phys. Rev. B 61, 5781 (2000); see also Erratum 62, 16176(2000).
[92] A.-L. Barra, P. Brunner, D. Gatteschi, Ch. E. Schulz, and R. Sessoli, Euro-phys. Lett. 35, 133 (1996).
[93] T. Lis, Acta Crystallogr. Soc. B36, 2042 (1980).
[94] R. Sessoli, D. Gatteschi, A. Caneschi, and M. A. Novak, Nature (London)365, 141 (1993); A. Caneschi, D. Gatteschi, C. Sangregorio, R. Sessoli,L. Sorace, A. Cornia, M. A. Novak, C. Paulsen and W. Wernsdorfer, J.Magnetism and Magnetic Mat. 200, 182 (1999).
[95] K. Wieghardt, K. Pohl, I. Jibril and G. Huttner Angew. Chem., Int. Ed.Engl.,23, (1984) 77; Cambridge Crystallographic Data Centre; Refcode:COCNAJ; http://www.ccdc.cam.ac.uk/
[96] J. Friedman, M. P. Sarachik, J. Tejeda, J. Maciejewski and R. Ziolo, Phys.Rev. Lett. 76, 3820 (1996); L. Thomas, F. Lionti, R. Ballou, D. Gatteschi,R. Sessoli and B. Barbara, Nature (London) 383, 145 (1996).
[97] C. Sangregorio, T. Ohm, C. Paulsen, R. Sessoli and D. Gatteschi, Phys.Rev. Lett. 78, 4645 (1997).
[98] W. Wernsdorfer and R. Sessoli, Science 284, 133 (1999).
[99] W. Wernsdorfer, T. Ohm, C. Sangregorio, R. Sessoli, D. Mailly and C.Paulsen, Phys. Rev. Lett. 82, 3903 (1999).
[100] D. Gatteschi, L. Pardi. A. L. Barra, A. Muller and J. Doring, Nature 354,463 (1991).
[101] J. Van Vleck, Phys. Rev. 52, 1178 (1937).
58

[102] Z.Q. Gu and W.Y. Ching, Phys. Rev. B 36, 8545 (1987).
[103] For example see: G. Schneider and H. J. F. Jansen, J. Appl. Phys. 875875 (2000) and references therein, H. J. F. Jansen, Phys. Rev. B 38,8022 (1988); A. Shick et al. J. Mag. and Mag. Mat. 177 (1216) (1998)and references therein; X.F. Zhong, W.Y. Ching and W. Lai, J. Appl. Phys.70(10), 6146 (1991).
[104] M. R. Pederson and S. N. Khanna, Phys. Rev. B 59, 693 (R) (1999).
[105] M. R. Pederson and S. N. Khanna, Phys. Rev. B 60, 9566 (1999).
[106] http://physics.nist.gov/PhysRefData/DFTdata/contents.html
[107] R. Caciuffo, G. Amoretti, A. Murani, R. Sessoli, A. Caneschi and D. Gat-teschi, Phys. Rev. Lett. 81, 4744 (1998)
[108] M. R. Pederson and S. N. Khanna, Chem. Phys. Lett. 307, 253, (1999).
[109] K. M. Mertes, Y. Suzuki, M. P. Sarachik, Y. Paltiel, H. Shtrikman, E. Zel-dov, E. Rumberger, D. N. Hendrickson, and G. Christou, Phys. Rev. Lett.87, 227205 (2001).
[110] J. Kortus, T. Baruah, N. Bernstein, and M. R. Pederson, Phys. Rev. B. 66,092403 (2002).
[111] A. L. Barra, A. Caneschi, D. Gatteschi, D. P. Goldberg, and R. Sessoli, J.Solid State Chemistry 145, 484 (1999).
[112] S. Schromm, O. Waldmann, P. Muller, University Erlangen, private com-munication.
[113] D. C. Bradley, R. G. Copperthwaite, S. A. Cotton, K. D. Sales, J. F. Gibson,J. Chem. Soc., Dalton Trans. 2 (1973) 191.
[114] M. R. Pederson, J. Kortus and S. N. Khanna, Cluster and Nanostructure
Interfaces, Eds. P. Jena, S. N. Khanna and B. K. Rao, World ScientificPublishing, Singapore 2000, 159-173, ISBN 981-02-4219-0
[115] M. R. Pederson, D. V. Porezag, J. Kortus and S. N. Khanna, J. Appl. Phys.87, 5487 (2000).
[116] R. Sessoli, private communication.
[117] I. Chiorescu, W. Wernsdorfer, A. Muller, H. Bogge and B. Barbara, Phys.Rev. Lett. 84, 3454 (2000).
59

[118] J. B. Goodenough, Magnetism and the Chemical Bond (Wiley, New York,1963).
[119] D. Gatteschi, L. Pardi. A. L. Barra and A. Muller, Mol. Engin. 3, 157(1993).
[120] M. R. Pederson, N. Bernstein and J. Kortus, Phys. Rev. Lett. 89, 097202-1/4 (2002).
60

Acknowledgment
Without the help of many friends, collaborators and colleagues I would havenot been able to come so far.
I would like to thank Prof. J. Monecke for his continued interest in my sci-entific progress. He has always been available whenever I needed his help oradvise.
Mark R. Pederson placed enough trust in me to invite me to join his groupat the Center for Computational Materials Science at the Naval Research Lab-oratory in Washington DC. During the two years there, working on and withNRLMOL he has been a great teacher and real friend. Without his support thiswork would not have been possible.
Igor Mazin taught me everything I know about superconductivity, but alsoseveral things about life. The collaboration with him has been very fruitful andsuccessful. I can only recommend to every postdoc to spent lunch time withIgor, if he offers a PRL just yell.
Working at NRL was a great experience for me, I had the pleasure to workwith many outstanding scientists and found a few friends. I would like to thankMarco Fornari for all the time we spent together and John Pask for many inter-esting discussions.
I had the luck to continue my work at another great place for electronicstructure calculations, Abteilung Andersen at MPI FKF in Stuttgart. Ole K.Andersen allowed me to continue to work on things I found interesting andshowed lots of understanding for my teaching duties in Freiberg. Many thingsI thought I do understand I had to revise after talking to Ole. I enjoyed towork with Ove Jepsen and Oleg Dolgov. In particular I thank Ove Jepsen forcritically reading the manuscript. Further, I have to thank Olle Gunnarsson formany discussions. Whatever my question was, he always gave a very enlight-ening answer.
There are many more people which I have to thank, they are just too nu-merous to be listed here by name.
Last, but not least, I thank Katrin for her support and patience with me overall the years.
61

62
Appendix A
Kortus J., Mazin I.I., BelashchenkoK.D., Antropov V.P., and Boyer L.L.
Superconductivity of metallic boron in
MgB $
Phys. Rev. Lett. 86, 4656-4659(2001)
63

64
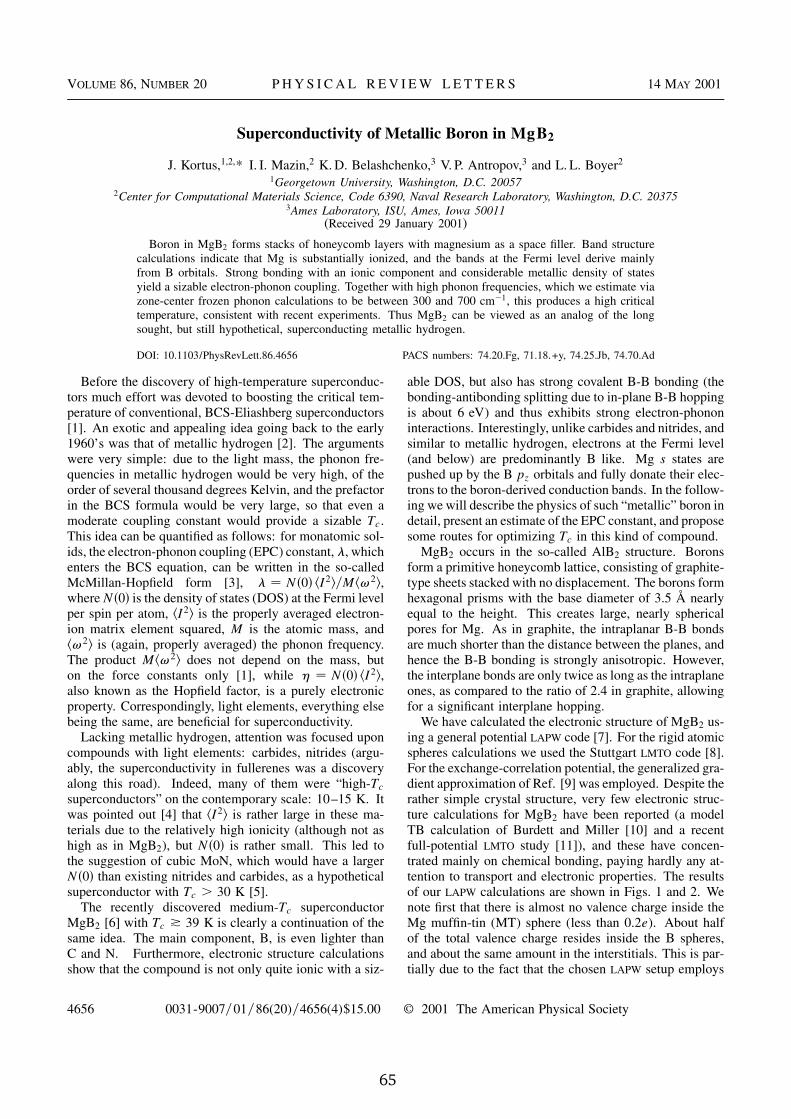
VOLUME 86, NUMBER 20 P H Y S I C A L R E V I E W L E T T E R S 14 MAY 2001
Superconductivity of Metallic Boron in MgB2
J. Kortus,1,2,* I. I. Mazin,2 K. D. Belashchenko,3 V. P. Antropov,3 and L. L. Boyer2
1Georgetown University, Washington, D.C. 200572Center for Computational Materials Science, Code 6390, Naval Research Laboratory, Washington, D.C. 20375
3Ames Laboratory, ISU, Ames, Iowa 50011(Received 29 January 2001)
Boron in MgB2 forms stacks of honeycomb layers with magnesium as a space filler. Band structurecalculations indicate that Mg is substantially ionized, and the bands at the Fermi level derive mainlyfrom B orbitals. Strong bonding with an ionic component and considerable metallic density of statesyield a sizable electron-phonon coupling. Together with high phonon frequencies, which we estimate viazone-center frozen phonon calculations to be between 300 and 700 cm21, this produces a high criticaltemperature, consistent with recent experiments. Thus MgB2 can be viewed as an analog of the longsought, but still hypothetical, superconducting metallic hydrogen.
DOI: 10.1103/PhysRevLett.86.4656 PACS numbers: 74.20.Fg, 71.18.+y, 74.25.Jb, 74.70.Ad
Before the discovery of high-temperature superconduc-tors much effort was devoted to boosting the critical tem-perature of conventional, BCS-Eliashberg superconductors[1]. An exotic and appealing idea going back to the early1960’s was that of metallic hydrogen [2]. The argumentswere very simple: due to the light mass, the phonon fre-quencies in metallic hydrogen would be very high, of theorder of several thousand degrees Kelvin, and the prefactorin the BCS formula would be very large, so that even amoderate coupling constant would provide a sizable Tc.This idea can be quantified as follows: for monatomic sol-ids, the electron-phonon coupling (EPC) constant, l, whichenters the BCS equation, can be written in the so-calledMcMillan-Hopfield form [3], l � N�0� �I2��M�v2�,where N�0� is the density of states (DOS) at the Fermi levelper spin per atom, �I2� is the properly averaged electron-ion matrix element squared, M is the atomic mass, and�v2� is (again, properly averaged) the phonon frequency.The product M�v2� does not depend on the mass, buton the force constants only [1], while h � N�0� �I2�,also known as the Hopfield factor, is a purely electronicproperty. Correspondingly, light elements, everything elsebeing the same, are beneficial for superconductivity.
Lacking metallic hydrogen, attention was focused uponcompounds with light elements: carbides, nitrides (argu-ably, the superconductivity in fullerenes was a discoveryalong this road). Indeed, many of them were “high-Tc
superconductors” on the contemporary scale: 10–15 K. Itwas pointed out [4] that �I2� is rather large in these ma-terials due to the relatively high ionicity (although not ashigh as in MgB2), but N�0� is rather small. This led tothe suggestion of cubic MoN, which would have a largerN�0� than existing nitrides and carbides, as a hypotheticalsuperconductor with Tc . 30 K [5].
The recently discovered medium-Tc superconductorMgB2 [6] with Tc * 39 K is clearly a continuation of thesame idea. The main component, B, is even lighter thanC and N. Furthermore, electronic structure calculationsshow that the compound is not only quite ionic with a siz-
able DOS, but also has strong covalent B-B bonding (thebonding-antibonding splitting due to in-plane B-B hoppingis about 6 eV) and thus exhibits strong electron-phononinteractions. Interestingly, unlike carbides and nitrides, andsimilar to metallic hydrogen, electrons at the Fermi level(and below) are predominantly B like. Mg s states arepushed up by the B pz orbitals and fully donate their elec-trons to the boron-derived conduction bands. In the follow-ing we will describe the physics of such “metallic” boron indetail, present an estimate of the EPC constant, and proposesome routes for optimizing Tc in this kind of compound.
MgB2 occurs in the so-called AlB2 structure. Boronsform a primitive honeycomb lattice, consisting of graphite-type sheets stacked with no displacement. The borons formhexagonal prisms with the base diameter of 3.5 Å nearlyequal to the height. This creates large, nearly sphericalpores for Mg. As in graphite, the intraplanar B-B bondsare much shorter than the distance between the planes, andhence the B-B bonding is strongly anisotropic. However,the interplane bonds are only twice as long as the intraplaneones, as compared to the ratio of 2.4 in graphite, allowingfor a significant interplane hopping.
We have calculated the electronic structure of MgB2 us-ing a general potential LAPW code [7]. For the rigid atomicspheres calculations we used the Stuttgart LMTO code [8].For the exchange-correlation potential, the generalized gra-dient approximation of Ref. [9] was employed. Despite therather simple crystal structure, very few electronic struc-ture calculations for MgB2 have been reported (a modelTB calculation of Burdett and Miller [10] and a recentfull-potential LMTO study [11]), and these have concen-trated mainly on chemical bonding, paying hardly any at-tention to transport and electronic properties. The resultsof our LAPW calculations are shown in Figs. 1 and 2. Wenote first that there is almost no valence charge inside theMg muffin-tin (MT) sphere (less than 0.2e). About halfof the total valence charge resides inside the B spheres,and about the same amount in the interstitials. This is par-tially due to the fact that the chosen LAPW setup employs
4656 0031-9007�01�86(20)�4656(4)$15.00 © 2001 The American Physical Society
65
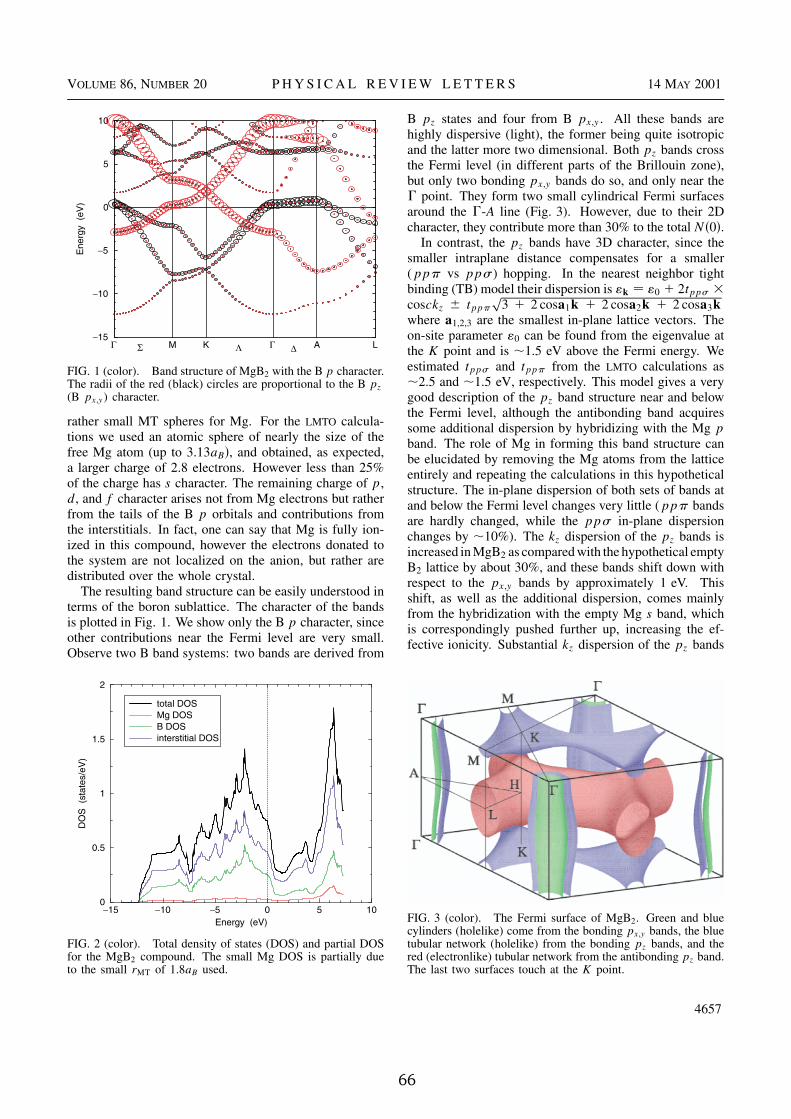
VOLUME 86, NUMBER 20 P H Y S I C A L R E V I E W L E T T E R S 14 MAY 2001
Γ M K Γ A L−15
−10
−5
0
5
10
Energ
y (e
V)
Σ Λ ∆
FIG. 1 (color). Band structure of MgB2 with the B p character.The radii of the red (black) circles are proportional to the B pz
(B px,y) character.
rather small MT spheres for Mg. For the LMTO calcula-tions we used an atomic sphere of nearly the size of thefree Mg atom (up to 3.13aB�, and obtained, as expected,a larger charge of 2.8 electrons. However less than 25%of the charge has s character. The remaining charge of p,d, and f character arises not from Mg electrons but ratherfrom the tails of the B p orbitals and contributions fromthe interstitials. In fact, one can say that Mg is fully ion-ized in this compound, however the electrons donated tothe system are not localized on the anion, but rather aredistributed over the whole crystal.
The resulting band structure can be easily understood interms of the boron sublattice. The character of the bandsis plotted in Fig. 1. We show only the B p character, sinceother contributions near the Fermi level are very small.Observe two B band systems: two bands are derived from
−15 −10 −5 0 5 10
Energy (eV)
0
0.5
1
1.5
2
DO
S (s
tate
s/e
V)
total DOS
Mg DOS
B DOS
interstitial DOS
FIG. 2 (color). Total density of states (DOS) and partial DOSfor the MgB2 compound. The small Mg DOS is partially dueto the small rMT of 1.8aB used.
B pz states and four from B px,y . All these bands arehighly dispersive (light), the former being quite isotropicand the latter more two dimensional. Both pz bands crossthe Fermi level (in different parts of the Brillouin zone),but only two bonding px,y bands do so, and only near theG point. They form two small cylindrical Fermi surfacesaround the G-A line (Fig. 3). However, due to their 2Dcharacter, they contribute more than 30% to the total N�0�.
In contrast, the pz bands have 3D character, since thesmaller intraplane distance compensates for a smaller(ppp vs pps) hopping. In the nearest neighbor tightbinding (TB) model their dispersion is ´k � ´0 1 2tpps 3cosckz 6 tppp
p
3 1 2 cosa1k 1 2 cosa2k 1 2 cosa3k
where a1,2,3 are the smallest in-plane lattice vectors. Theon-site parameter ´0 can be found from the eigenvalue atthe K point and is �1.5 eV above the Fermi energy. Weestimated tpps and tppp from the LMTO calculations as�2.5 and �1.5 eV, respectively. This model gives a verygood description of the pz band structure near and belowthe Fermi level, although the antibonding band acquiressome additional dispersion by hybridizing with the Mg p
band. The role of Mg in forming this band structure canbe elucidated by removing the Mg atoms from the latticeentirely and repeating the calculations in this hypotheticalstructure. The in-plane dispersion of both sets of bands atand below the Fermi level changes very little (ppp bandsare hardly changed, while the pps in-plane dispersionchanges by �10%). The kz dispersion of the pz bands isincreased in MgB2 as compared with the hypothetical emptyB2 lattice by about 30%, and these bands shift down withrespect to the px,y bands by approximately 1 eV. Thisshift, as well as the additional dispersion, comes mainlyfrom the hybridization with the empty Mg s band, whichis correspondingly pushed further up, increasing the ef-fective ionicity. Substantial kz dispersion of the pz bands
FIG. 3 (color). The Fermi surface of MgB2. Green and bluecylinders (holelike) come from the bonding px,y bands, the bluetubular network (holelike) from the bonding pz bands, and thered (electronlike) tubular network from the antibonding pz band.The last two surfaces touch at the K point.
4657
66

VOLUME 86, NUMBER 20 P H Y S I C A L R E V I E W L E T T E R S 14 MAY 2001
produces the Fermi surface which is approximately mirrorreflected with respect to a plane between the kz � 0 andkz � p�c planes, one pocket (electronlike) coming fromthe antibonding and the other (holelike) from the bondingpz band. The two surfaces touch at one point on the K-H
line and form a honeycomb tubular network, replicatingin reciprocal space the boron lattice in real space.
The resulting bands are fairly 3D: the average Fermivelocities are yx,y � 4.90 3 107 cm�s and yz � 4.76 3107 cm�s. The plasma frequencies are vpx,y � 7.1 eVand vpz � 6.9 eV. Correspondingly, we predict fairly iso-tropic high-temperature electrical resistivity, with the lin-ear slope dr�dT � 0.08ltr mV cm�K . The total DOS atthe Fermi level is N�0� � 0.36 states�spin f.u.
The above described band structure is typical for ansp metal. What is not typical is that this particular sp
metal is held together by covalent bonding with a sub-stantial ionic component [12], which inevitably leads to astrong electron-phonon interaction. In the following wepresent a semiquantitative estimate of the correspondingcoupling constant, and argue that the fortunate combina-tion of strong bonding, sizable N�0�, and high phonon fre-quency is responsible for the high transition temperaturein this compound.
In its most rigorous formulation the McMillan-Hopfieldformula reads [1]
l � n21X
ij
�NIiaIjb� �F21�ia,jb , (1)
where the indices i, j run over all n ions in the crystal;a, b are Cartesian indices; �NIiaIjb� is the electron-ionmatrix element averaged over the Fermi surface; andFia,jb is the standard force matrix. While this expressionis exact, a number of simplifications are needed to makeit more practical. One usually neglects the nondiagonalterms and reduces Eq. (1) to one unit cell. The standardjustification makes use of the large size of the Fermisurface; see Ref. [1]:
l �X
i
�NI2�iF21ii �
X
i
hi�Fii�21. (2)
The quantity Fii � ≠2Etot≠R2i is a local quantity, which
can be calculated from the total energy differences of frozenzone-center phonons. The Hopfield factor can be calculatedin the rigid muffin-tin (or rigid atomic sphere) approxima-tion [13] (RMTA), assuming that the change of the crystalpotential due to an ion’s displacement can be described byshifting the electronic charge distribution rigidly inside the
TABLE I. Partial LMTO DOS, N�0�, in eV21�spin and partialHopfield factors, h, in mRy�a
2B, for Mg and B (per atom).
N�0� hl s p d f sp pd df
Mg 0.018 0.043 0.078 0.019 ,1 2 3B 0.003 0.199 0.010 · · · ,1 135 · · ·
corresponding atomic sphere. Although expressions for hhave been derived for arbitrary site symmetry [14], theseare complicated and we will use here simplified formulas[13] formally correct for cubic site symmetry. Then h canbe readily calculated from the LMTO potential parametersand partial DOS’s. We show the results in Table I.
In order to get an estimate of the phonon spectrum ofthe system, we calculated all zone-center modes, using thefull-potential LAPW method. There are four distinct modes[15]: one silent mode, B1g (two borons displaced alongz in opposite directions), one doubly degenerate Ramanmode, E2g (in-plane displacements of borons), and twoinfrared-active modes, which do not involve changes ofin-plane bonds: A2u (B and Mg planes moving againsteach other), and a doubly degenerate E1u mode (B andMg planes sliding along x, y). Their frequencies are, re-spectively, 690, 515, 390, and 320 cm21, and their forceconstants are 390, 220, 70, and 44 mRy�a
2B�atom. All
calculations were carried out at the experimental latticeconstant and c�a ratio [16]. The E2g mode shows stronganharmonicity. While the harmonic frequency calculatedfrom the second derivative of the total energy with respectto the phonon coordinate yields 515 cm21, a numeric so-lution for the calculated anharmonic potential results in ananharmonic frequency of 590 cm21.
Given the physics of the electronic structure describedabove, it seems likely that the lowest mode couples littlewith the electrons and that its softness is derived from itsin-plane acoustic character. Thus, we excluded it from thecalculations of l below. Correspondingly, the average in-verse force matrix for boron is �FB�21
� M21B �v22� �
7.1a2B�Ry, corresponding to �v22�21�2 � 400 cm21.
Together with the above value for h this gives l � 0.7
and the logarithmically averaged frequency of the samethree modes is �690 3 5152 3 390�0.25
� �vlog� �500 cm21 � 700 K. We can now estimate the criticaltemperature according to the McMillan formula, Tc �
�vlog�
1.2 exp�21.02�1 1 l���l 2 m� 2 m�l�. Using for theCoulomb pseudopotential m� the commonly acceptedvalue 0.1, we obtain Tc � 22 K.
TABLE II. Comparison of the electron-phonon coupling in Al and in MgB2. The entries labeled by a question mark are obtainedby scaling the RMTA l by the ratio of lexp�lrmt in Al. qTF is the Thomas-Fermi screening parameter in a
21B . Tc was calculated by
the McMillan formula with m�� 0.1. LAPW N�0� is given in eV21�spin, h in mRy�a
2B, and �Mv2� in Ry�a
2B.
N�0� hrmt �vlog� �Mv2� lrmt Tc�lrmt� lexp Tc�lexp� Tc,exp qTF
Al 0.15 27 250 0.135 0.2 0 0.4 1.3 1.3 0.73MgB2 0.18 (per B) 135 500 0.141 0.7 22 1.4? 70? 39 0.70
4658
67
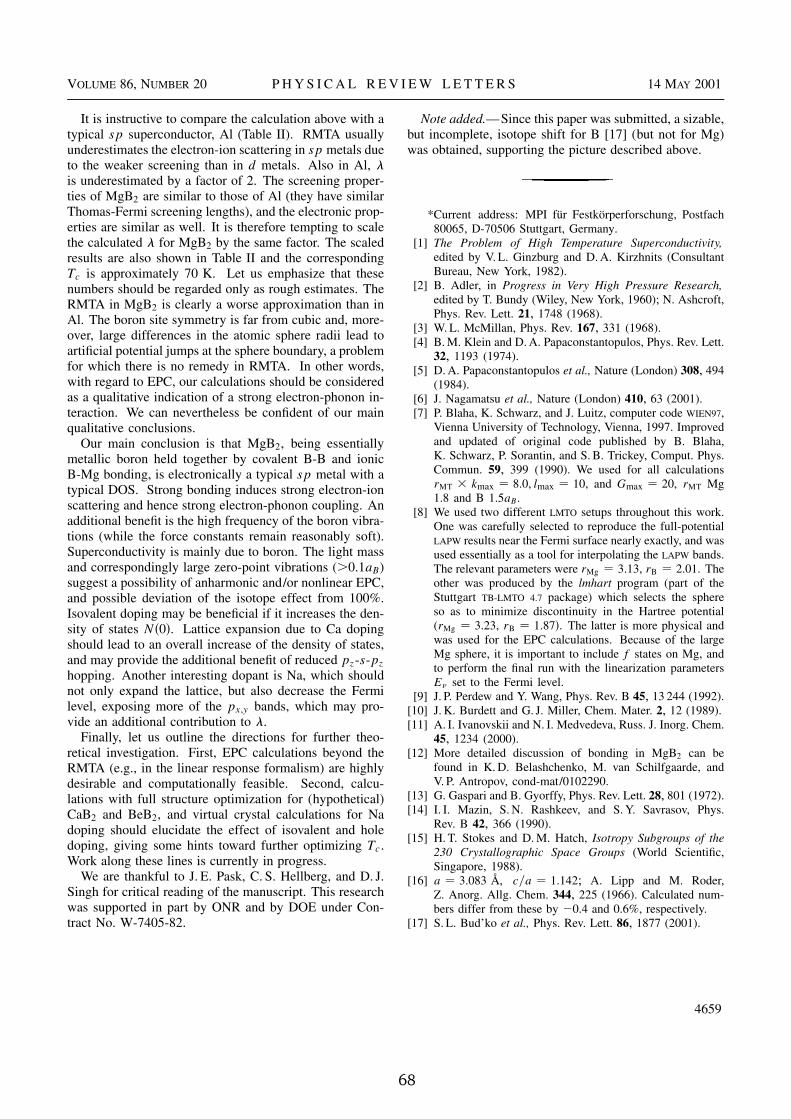
VOLUME 86, NUMBER 20 P H Y S I C A L R E V I E W L E T T E R S 14 MAY 2001
It is instructive to compare the calculation above with atypical sp superconductor, Al (Table II). RMTA usuallyunderestimates the electron-ion scattering in sp metals dueto the weaker screening than in d metals. Also in Al, lis underestimated by a factor of 2. The screening proper-ties of MgB2 are similar to those of Al (they have similarThomas-Fermi screening lengths), and the electronic prop-erties are similar as well. It is therefore tempting to scalethe calculated l for MgB2 by the same factor. The scaledresults are also shown in Table II and the correspondingTc is approximately 70 K. Let us emphasize that thesenumbers should be regarded only as rough estimates. TheRMTA in MgB2 is clearly a worse approximation than inAl. The boron site symmetry is far from cubic and, more-over, large differences in the atomic sphere radii lead toartificial potential jumps at the sphere boundary, a problemfor which there is no remedy in RMTA. In other words,with regard to EPC, our calculations should be consideredas a qualitative indication of a strong electron-phonon in-teraction. We can nevertheless be confident of our mainqualitative conclusions.
Our main conclusion is that MgB2, being essentiallymetallic boron held together by covalent B-B and ionicB-Mg bonding, is electronically a typical sp metal with atypical DOS. Strong bonding induces strong electron-ionscattering and hence strong electron-phonon coupling. Anadditional benefit is the high frequency of the boron vibra-tions (while the force constants remain reasonably soft).Superconductivity is mainly due to boron. The light massand correspondingly large zero-point vibrations (.0.1aB)suggest a possibility of anharmonic and/or nonlinear EPC,and possible deviation of the isotope effect from 100%.Isovalent doping may be beneficial if it increases the den-sity of states N�0�. Lattice expansion due to Ca dopingshould lead to an overall increase of the density of states,and may provide the additional benefit of reduced pz-s-pz
hopping. Another interesting dopant is Na, which shouldnot only expand the lattice, but also decrease the Fermilevel, exposing more of the px,y bands, which may pro-vide an additional contribution to l.
Finally, let us outline the directions for further theo-retical investigation. First, EPC calculations beyond theRMTA (e.g., in the linear response formalism) are highlydesirable and computationally feasible. Second, calcu-lations with full structure optimization for (hypothetical)CaB2 and BeB2, and virtual crystal calculations for Nadoping should elucidate the effect of isovalent and holedoping, giving some hints toward further optimizing Tc.Work along these lines is currently in progress.
We are thankful to J. E. Pask, C. S. Hellberg, and D. J.Singh for critical reading of the manuscript. This researchwas supported in part by ONR and by DOE under Con-tract No. W-7405-82.
Note added.—Since this paper was submitted, a sizable,but incomplete, isotope shift for B [17] (but not for Mg)was obtained, supporting the picture described above.
*Current address: MPI für Festkörperforschung, Postfach80065, D-70506 Stuttgart, Germany.
[1] The Problem of High Temperature Superconductivity,
edited by V. L. Ginzburg and D. A. Kirzhnits (ConsultantBureau, New York, 1982).
[2] B. Adler, in Progress in Very High Pressure Research,
edited by T. Bundy (Wiley, New York, 1960); N. Ashcroft,Phys. Rev. Lett. 21, 1748 (1968).
[3] W. L. McMillan, Phys. Rev. 167, 331 (1968).[4] B. M. Klein and D. A. Papaconstantopulos, Phys. Rev. Lett.
32, 1193 (1974).[5] D. A. Papaconstantopulos et al., Nature (London) 308, 494
(1984).[6] J. Nagamatsu et al., Nature (London) 410, 63 (2001).[7] P. Blaha, K. Schwarz, and J. Luitz, computer code WIEN97,
Vienna University of Technology, Vienna, 1997. Improvedand updated of original code published by B. Blaha,K. Schwarz, P. Sorantin, and S. B. Trickey, Comput. Phys.Commun. 59, 399 (1990). We used for all calculationsrMT 3 kmax � 8.0, lmax � 10, and Gmax � 20, rMT Mg1.8 and B 1.5aB.
[8] We used two different LMTO setups throughout this work.One was carefully selected to reproduce the full-potentialLAPW results near the Fermi surface nearly exactly, and wasused essentially as a tool for interpolating the LAPW bands.The relevant parameters were rMg � 3.13, rB � 2.01. Theother was produced by the lmhart program (part of theStuttgart TB-LMTO 4.7 package) which selects the sphereso as to minimize discontinuity in the Hartree potential(rMg � 3.23, rB � 1.87�. The latter is more physical andwas used for the EPC calculations. Because of the largeMg sphere, it is important to include f states on Mg, andto perform the final run with the linearization parametersEn set to the Fermi level.
[9] J. P. Perdew and Y. Wang, Phys. Rev. B 45, 13 244 (1992).[10] J. K. Burdett and G. J. Miller, Chem. Mater. 2, 12 (1989).[11] A. I. Ivanovskii and N. I. Medvedeva, Russ. J. Inorg. Chem.
45, 1234 (2000).[12] More detailed discussion of bonding in MgB2 can be
found in K. D. Belashchenko, M. van Schilfgaarde, andV. P. Antropov, cond-mat/0102290.
[13] G. Gaspari and B. Gyorffy, Phys. Rev. Lett. 28, 801 (1972).[14] I. I. Mazin, S. N. Rashkeev, and S. Y. Savrasov, Phys.
Rev. B 42, 366 (1990).[15] H. T. Stokes and D. M. Hatch, Isotropy Subgroups of the
230 Crystallographic Space Groups (World Scientific,Singapore, 1988).
[16] a � 3.083 Å, c�a � 1.142; A. Lipp and M. Roder,Z. Anorg. Allg. Chem. 344, 225 (1966). Calculated num-bers differ from these by 20.4 and 0.6%, respectively.
[17] S. L. Bud’ko et al., Phys. Rev. Lett. 86, 1877 (2001).
4659
68

Appendix B
Mazin I.I. and Kortus J.
Interpretation of the de Haas - van
Alphen experiments in MgB $
Phys. Rev. B 65, 180510-1/4 (R)(2002)
69

70
Interpretation of the de Haas–van Alphen experiments in MgB2
I. I. Mazin*Code 6391, Naval Research Laboratory, Washington, DC 20375-5000
Jens Kortus†
Max-Planck-Institut fur Festkorperforschung, Heisenbergstrasse 1, D-70569 Stuttgart, Germany~Received 15 January 2002; published 30 April 2002!
Recent reports on quantum oscillations in MgB2 provide valuable information on three important aspects ofthis material: ~i! electronic structure near the Fermi level, ~ii! disparity of the electron-phonon interactionbetween the two systems of bands, and ~iii! renormalization of spin susceptibility. However, extraction of mostof this information requires highly accurate band-structure calculations of the relevant quantities. In this paperwe provide such calculations and use them to analyze the experimental data.
DOI: 10.1103/PhysRevB.65.180510 PACS number~s!: 74.25.2q, 71.18.1y, 74.70.2b
MgB2, a superconductor with Tc'40 K, has attractedenormous attention in the last year. The most popular model,suggested by Liu et al.1 and Shulga et al.,2 and elaboratedupon by Choi et al.,3 is the two-gap model, which, based onthe very large interband disparity of the electron-phonon in-teraction ~first noted in Ref. 4!, predicts two different gapsfor the two different band systems. The calculations1,3 yieldan effective ~including an enhancement due to gap variation!electron-phonon coupling constant of the order of 1. On theother hand, the two-gap theory has a serious conceptualproblem: Two distinctive gaps may exist only if the interbandimpurity scattering is very weak. That seems to be in contrastto the experimental observation that even poor quality, high-resistivity samples have very good superconducting proper-ties. It has been argued5,6 that the specificity of the electronicand crystal structures of MgB2 results in a peculiar relationamong the three relevant relaxation rates, namely that theimpurity scattering inside the so-called p band is muchstronger than inside the s band, and the latter, in turn, ismuch stronger than the interband scattering. However, therehas been no direct experimental confirmation of this claim.
On the other hand, some authors7 argue that the calculatedband structure is strongly renormalized by electron-electroninteractions not accounted for in the local-density calcula-tions, so that the plasma frequency is a factor of 5 smallerthan the calculated one. This would imply an electron-phonon coupling constant less than 0.2. There are claims thatinfrared spectroscopy supports this point of view,8,9 althoughother researchers in the field5 dispute the interpretation ac-cepted in Refs. 8 and 9. In any case, the fact that all opticalexperiments until now have been performed on polycrystal-line samples undermines their value as a decisive test for theelectronic structure calculations.
Single-crystal angular-resolved photoemission spectros-copy10 ~ARPES! measurements agree very well with thecalculations.11 However, some calculated bands were not ob-served, and, furthermore, ARPES probes only a very thinsurface layer and is therefore often not representative of thebulk electronic structure.
Historically, the most reliable probe of the bulk electronicstructure has been the de Haas–van Alphen effect ~dHvA!.Recent observation of this effect in MgB2 single crystals12
provides key information to assess the validity of the stan-dard band-structure calculation. Given the fact that most the-oretical papers rely on this band structure, the importance ofa proper analysis of these data can hardly be overestimated.It must be emphasized that such an analysis requires highlyaccurate band-structure calculations, i.e., the use of a muchfiner k-point mesh in the Brillouin zone and a much moreaccurate integration than is customary in other applicationsof the band theory. In this paper we present such calculationsand show that both Fermiology and effective masses ~andhence the Fermi velocities and plasma frequencies! producedby conventional band-structure calculations are in excellentagreement with the experiment, thus giving a strong founda-tion for the widespread use of this band structure. Further-more, we show that the calculational predictions of a strongdisparity of the electron-phonon interaction in the two-bandsystems in MgB2 are supported by the de Haas–van Alphenexperiment, and that the scattering rates inside the s bandand between s and p bands are probably much smaller thaninside the p bands.
The Fermi surface of MgB2 consists of four sheets.13 Twosheets come primarily from the boron px and py states, andform slightly ~nearly sinusoidally! warped cylinders, s~bonding! and s* ~antibonding!,14 and two tubular networks,the bonding one, p, in the G (kz50) plane, and the antibond-ing one, p*, in the A (kz5p/c) plane. There are six ex-tremal cross sections for the field parallel to kz ~along the GAline!. These are ~1! s in the G plane, ~2! s* in the G plane,~3! p in the G plane ~‘‘holes’’ between the tubes!, ~4! s in theA plane, ~5! s* in the A plane, and ~6! p* in the G plane. Fora field parallel to ky ~perpendicular to the GAM plane! thereare two extremal cross sections ~tubes’ necks!, for the psurface ~7! and for the p* surface ~8!.
We performed highly accurate and well-converged fullpotential linear augmented plane-wave ~LAPW! calculations,using the WIEN-97 package,15 including local orbitals16 to re-lax the linearization errors. We used the generalized gradientapproximation of Perdew-Wang17 for the exchange-correlation potential. By comparing the results with linearmuffin-tin orbitals calculations, we found that for a properdescription of the s orbits it is essential to use a full potentialmethod. It is furthermore essential to use a very fine mesh in
RAPID COMMUNICATIONS
PHYSICAL REVIEW B, VOLUME 65, 180510~R!
0163-1829/2002/65~18!/180510~4!/$20.00 ©2002 The American Physical Society65 180510-1
71

k space; we employed a 38338327 mesh, corresponding to1995 inequivalent k points. To achieve sufficient accuracyfor the small areas of the orbits 1, 2, 4, 5, 7, and 8, we usedan integration engine built in the SURFER program,18 whichinternally interpolates the integrand with splines.
The bare ~band! masses in the third column of Table Iwere then calculated by varying the Fermi energy and usingthe standard formula,
mdHvA5
\2
2p
dAdE
. ~1!
Here and below we use the notation A for the areas of theorbits in standard units and F for those in Tesla units. Inorder to obtain the energy derivatives we fitted the calculatedA(E) by quadratic polynomials in the ranges of about 0.03Ry around the Fermi energy. The experimentally observed‘‘thermal masses’’ differ from the ‘‘band’’ masses by a renor-malization factor of ~11l!, where l is the coupling constantfor the interaction of electrons with phonons or other low-energy excitations. For Table I we used the values of l com-puted in the following way ~see, e.g., Ref. 19!: we assumedthat the matrix elements of the electron-phonon interactionare constant within each of the four bands ~a good approxi-mation, see Ref. 3!, but different among the bands and fordifferent interband transitions. If the matrix of the electron-phonon interaction is U i j , where i , j are the band indices,then the mass renormalization in the band i is
l i5(j
U i jN j , ~2!
where N j is the partial density of states per spin for the ithband. Recall that the conventional Eliashberg coupling con-stant is l5( i jU i jN iN j /( iN i . The matrix U and the vectorN calculated in Ref. 1 were used to compute the fifth columnin Table I.
The agreement between the calculated and measured ther-mal masses can be characterized as excellent. Very impor-tantly, this agreement is so good only because the calculatedelectron-phonon coupling differs by a factor of 3 between thes and p bands. This is a direct demonstration of this impor-tant effect. The agreement between the calculated areas F
and the experiment is also very good. Although F1 , F2, andF3 are overestimated by 35%, 15%, and 8%, respectively,the absolute values of these errors are only 0.5% ~or less! ofthe total area of the corresponding Brillouin-zone cross sec-tions. Even better appreciation of the significance of theseerrors can be gained from the observation that shifting the sband by 6.3 mRy down, and the p* band by 5.5 mRy upbrings the calculated areas to full agreement with the experi-ment. It is not at all clear whether or not such a small dis-crepancy with the experiment is meaningful. It is interesting,nevertheless, that after such an adjustment of the band posi-tions the calculated masses agree with the experiment evenbetter: for the three orbits in question the electron-phononcoupling constants deduced from the experiment by takingthe ratio of the measured masses to the calculated massesare, respectively, 1.15, 1.12, and 0.43. After the Fermi-leveladjustment, they are 1.22, 1.18, and 0.45. It is also worthnoting that, for instance, a change in the c/a ratio of 1.5%shifts the s and p bands with respect to each other by '12mRy, or that a shift of the Fermi level by 6 mRy correspondsto a 0.05 e change in the number of electrons. This showshow sensitive the de Haas–van Alphen results are to thecrystallography and stoichiometry.
Another important observation reported in Ref. 12 is theso-called ‘‘spin zero.’’ This is a suppression of the de Haas–van Alphen amplitude when the difference in the areas ~inTesla units! of the spin-split ~by the external field H) crosssections is exactly H/2. This effect has been observed fororbit ~8! in the field H517 T, when the field was tilted withrespect to the crystallographic axis by f515218°. Thismeans that (F8
↑2 F8
↓)/cos(f)58.5 T, or DF85F8↑2F8
↓
'8.1 T ~note that the angle itself does not depend on thefield in which the measurements are performed, but only onthe Fermi-surface geometry and Stoner renormalization!. Itis easy to estimate this splitting in the first approximation,using the data from Table I and the Stoner renormalization of33%, calculated in Ref. 21: DA852pmDExc , where DExc52mBH(11S) is the induced spin splitting of the bandsnear the Fermi level, enhanced by a Stoner factor (11S).This formula gives DF8'7.1 T. A caveat here is that theinduced spin splitting need not be the same for all bands, inother words, while the average S is 0.33, individual S’s may
TABLE I. Calculated de Haas–van Alphen parameters from present work (Fcalc) compared to the experimental data (Fexp) of Ref. 12.The masses are given in free-electron mass units.
Orbit Fcalc ~T! mcalc dmcalc/dE (Ry21) la u(11l)mub Fexp ~T! u(11l)muexp
~1! s G plane 730 20.251 1.1 1.25 0.56 540 0.54~2! s* G plane 1589 20.543 2.7 1.16 1.17~3! p G plane 34630 1.96 23 0.43 2.80~4! s A plane 1756 20.312 1.2 1.25 0.70 1530 0.66~5! s* A plane 3393 20.618 2.3 1.16 1.33~6! p* G plane 31130 21.00 4.1 0.47 1.47~7! p GAM plane 458 20.246 1.5 0.43 0.35~8! p* GAM plane 2889 0.315 0.8 0.47 0.46 2685 0.45
aComputed from Tables 1 and 2 of Ref. 1.bComputed from the preceding columns.
RAPID COMMUNICATIONS
I. I. MAZIN AND JENS KORTUS PHYSICAL REVIEW B 65 180510~R!
180510-2
72

vary from orbit to orbit. To avoid this problem, we per-formed self-consistent LAPW calculations in an externalfield of 1.8 kT ~still well within the linear-response regime!and measured dDA8 /dH explicitly. Using these results, wefound that for the actual field of 17 T, DF856.7 T, close to,but slightly smaller than the above estimate of 7.1 T. In otherwords, the calculated Stoner factor for this orbit is S850.26, smaller than the average over all bands, which is0.33. Note that the experimental number of 8.1 T can bereconciled with the calculated mass, if S8 were '0.5, fairlyclose to the electron-phonon coupling constant for the sameband, 0.47. We, however, believe that the coincidence is ac-cidental, although we do not have any plausible explanationfor the noticeable underestimation of the Stoner factor forthis orbit. No ‘‘spin-zero’’ effect has been observed for theorbit ~4!, which has essentially the same mass as orbit ~8!.Our calculations for this orbit give DF456.9 T; that is, thecalculated Stoner factor for this orbit is S450.31. At thesame time, the actual Stoner factor must be either larger than0.60 or smaller than 0.18, for this orbit not to exhibit the‘‘spin-zero’’ effect @this is neglecting deviations from a cy-lindrical shape, which are noticeably stronger expressed forthis orbit than for the orbit ~8!#. Further experimental studieson better samples should give more insight into this problem.
Finally, we would like to discuss the problem of the‘‘missing orbits.’’ The amplitude of the de Haas–van Alphensignal is proportional to22
H21/2X
sinh Xexp
2c\ApAeHl
cospDF
HX
5p2mc~11l !kBT/\eH ,
where l is the mean free path for the orbit in question. Thus,it is not surprising that the large orbits ~3! and ~6! are notobserved; the Dingle exponent c\ApA/eHl is at least tentimes larger than for the other orbits. However, the questionremains for the orbits ~2!, ~5!, and ~7!. Let us start with thefirst two. We observe that, compared to the orbits ~1! and ~3!,both the Dingle factor and the thermal factor are reduced.The latter is smaller because the effective mass m(11l) istwice larger, which reduces the maximal temperature atwhich these orbits can be observed by a factor of 2. Theformer is reduced because both the orbit size, AA , is larger,and the mean free path, l}vF , ~assuming the relaxation timeis the same for both s and s* bands!, is smaller @from Table1 of Ref. 21, vF(s)/vF(s*)'1.4#. The total reduction of theDingle exponent compared to orbit ~4! is by a factor of 2 fororbit ~5!, and of 1.4 for orbit ~2!.
The absence of a signal from the orbit ~7! seems puzzling.Its area and its thermal mass are the smallest of all orbits,and the average velocity for this band is the highest ~50%
higher than for the s band!. A very plausible explanation isthat, as conjectured in Ref. 5 and elaborated upon in Ref. 6,the impurity scattering rates differ drastically between thebands. If the dominant defects reside in the Mg plane ~e.g.,Mg vacancies!, then such defects are very weak scatterers forthe s bands for the simple reason that those bands have verylittle weight at the Mg atoms. However, this simple picturedoes not explain why orbit ~8!, originating from the p* band,apparently has a small relaxation time and therefore is seenin experiment. Its velocity is close to ~in fact, 15% smallerthan! that of the p band and its linear size is more than twicelarger than that of orbit ~7!, so the scattering rate has to be atleast five times larger. We do not have a plausible answer asto why the impurity scattering appears to be so suppressedfor this orbit. Possibly, this is related to its parity ~while thep band is even with respect to the z→2z reflection, the p*band is odd!.
To conclude, we presented highly accurate calculations ofthe de Haas–van Alphen parameters for MgB2. Comparisonwith the experiment reveals ~i! absence of any mass ~veloc-ity! renormalization apart from that due to phonons; ~ii! agood agreement of the calculated cross-section areas with theexperiment; ~iii! excellent agreement of the calculatedelectron-phonon coupling with the dHvA mass renormaliza-tion, including very large disparity between the coupling ofthe s and p bands, which clearly confirms the basic assump-tion of the two-gap model for superconductivity in MgB2;~iv! some underestimation, despite a good qualitative agree-ment, of the calculated and measured Stoner factors for the pbands, ~v! indirect evidence of substantially different impu-rity scattering rates in the s and p bands, and ~vi! a problemthat remains to be understood, the total suppression of theneck orbit, associated with the bonding p band, given a clearobservation of the much larger orbit from the electronicallysimilar p* band.
After this work was finished, we learned about similarworks by Rosner et al.20 and Harima.23 Their results, particu-larly those of Ref. 20, are quite close to ours. Both papersemploy similar methods and take full care of the k-meshconvergence. The remaining difference is a good gauge ofhow reliable such calculations are, in a technical sense.
We are grateful to A. Carrington and J. R. Cooper fornumerous extremely enlightening discussions regarding theirpaper,12 as well as to O. K. Andersen, O. Jepsen, and O. V.Dolgov for many discussions of the electronic structure andtransport properties of MgB2. We also thank R. Hayn, H.Rosner, and S.-L. Drechsler for their useful comments. J.K.would like to thank the Schloeßmann Foundation for finan-cial support. The work was partially supported by the Officeof Naval Research.
*Electronic address: [email protected]†Electronic address: [email protected] A.Y. Liu, I.I. Mazin, and J. Kortus, Phys. Rev. Lett. 87, 087005
~2001!.2 S.V. Shulga, S.-L. Drechsler, H. Eschrig, H. Rosner, and W.
Pickett, cond-mat/0103154 ~unpublished!.3 H.J. Choi, D. Roundy, H. Sun, M.L. Cohen, and S.G. Louie,
cond-mat/0111182 ~unpublished!; cond-mat/0111183 ~unpub-lished!.
4 J.M. An and W.E. Pickett, Phys. Rev. Lett. 86, 4366 ~2001!; Y.
RAPID COMMUNICATIONS
INTERPRETATION OF THE DE HAAS–VAN ALPHEN . . . PHYSICAL REVIEW B 65 180510~R!
180510-3
73
Kong, O.V. Dolgov, O. Jepsen, and O.K. Andersen, Phys. Rev. B64, 020501 ~2001!; K.-P. Bohnen, R. Heid, and B. Renker, Phys.Rev. Lett. 86, 5771 ~2001!.
5 A.B. Kuz’menko, F.P. Mena, H.J.A. Molegraaf, D. van der Marel,B. Gorshunov, M. Dressel, I.I. Mazin, J. Kortus, O.V. Dolgov, T.Muranaka, and J. Akimitsu, Solid State Commun. 121, 479~2002!.
6 I. I. Mazin, O. K. Andersen, O. Jepsen, O. V. Dolgov, J. Kortus,A. A. Golubov, A. B. Kuzmenko, and D. van der Marel,cond-mat/0204013 ~unpublished!.
7 F. Marsiglio, Phys. Rev. Lett. 87, 247001 ~2001!.8 R.A. Kaindl, M.A. Carnahan, J. Orenstein, D.S. Chemla, H.M.
Christen, H.Y. Zhai, M. Paranthaman, and D.H. Lowndes, Phys.Rev. Lett. 88, 027003 ~2001!.
9 J.J. Tu, G.L. Carr, V. Perebeinos, C.C. Homes, M. Strongin, P.B.Allen, W.N. Kang, E.-M. Choi, H.-J. Kim, and S.-I. Lee, Phys.Rev. Lett. 87, 277001 ~2001!.
10 H. Uchiyama, K.M. Shen, S. Lee, A. Damascelli, D.H. Lu, D.L.Feng, Z.-X. Shen, and S. Tajima, Phys. Rev. Lett. 88, 157002~2002!.
11 V.D.P. Servedio, S.-L. Drechsler, and T. Mishonov,cond-mat/0111434 ~unpublished!.
12 E.A. Yelland, J.R. Cooper, A. Carrington, N.E. Hussey, P.J. Mee-son, S. Lee, A. Yamamoto, and S. Tajima, cond-mat/0112392~unpublished!.
13 J. Kortus, I.I. Mazin, K.D. Belashchenko, V.P. Antropov, and L.L.Boyer, Phys. Rev. Lett. 86, 4656 ~2001!.
14 Formally speaking, there are four s bands, of which two arebonding in the sense of covalent bonds, and two are antibonding.Of the two bonding bands, one is more bonding than the other~except at the G point! due to a favorable combination of px andpy orbitals. In this paper, we call this band s, and the other px ,y
band, crossing the Fermi level, s*.15 P. Blaha, K. Schwarz, and J. Luitz, Computer code WEIN-97
~Vienna University of Technology, 1997!, improved and updatedversion of the code published by P. Blaha, K. Schwarz, and P.Sorantin, Comput. Phys. Commun. 59, 399 ~1990!.
16 D. Singh, Phys. Rev. B 43, 6388 ~1991!.17 J.P. Perdew and Y. Wang, Phys. Rev. B 45, 13 244 ~1992!.18 http://www. goldensoftware.com/products/surfer/surfer. shtml19 I.I. Mazin, A.I. Liechtenstein, C.O. Rodriguez, O. Jepsen, and
O.K. Andersen, Physica C 209, 125 ~1993!.20 H. Rosner, J.M. An, W.E. Pickett, and S.-L. Drechsler,
cond-mat/0203030 ~unpublished!; S. Elgazzar, P.M. Oppeneer,S.-L. Drechsler, R. Hayn, and H. Rosner, cond-mat/0201230~unpublished!.
21 E. Pavarini and I.I. Mazin, Phys. Rev. B 64, 140504 ~2001!.22 A. Wasserman and M.S. Springford, Adv. Phys. 45, 471 ~1996!.23 H. Harima, cond-mat/0201452 ~unpublished!.
RAPID COMMUNICATIONS
I. I. MAZIN AND JENS KORTUS PHYSICAL REVIEW B 65 180510~R!
180510-4
74
Appendix C
Kurmaev E.Z., Lyakhovskaya I.I.,Kortus J., Moewes A., Miyata N.,Demeter M., Neumann M.,Yanagihara M., Watanabe M.,Muranaka T. and Akimitsu J.
Electronic structure of MgB $ : X-ray
emission and absorption studies
Phys. Rev. B 65 134509-1/4 (2002)
75

76

Electronic structure of MgB2: X-ray emission and absorption studies
E. Z. Kurmaev,1 I. I. Lyakhovskaya,2 J. Kortus,3 A. Moewes,4 N. Miyata,5 M. Demeter,6 M. Neumann,6 M. Yanagihara,5
M. Watanabe,5 T. Muranaka,7 and J. Akimitsu7
1Institute of Metal Physics, Russian Academy of Sciences-Ural Division, 620219 Yekaterinburg, Russia2Institute of Physics, St. Petersburg State University, 198504 St. Petersburg, Russia
3Max-Planck-Institut fur Festkorperforschung, D-70569 Stuttgart, Germany4Department of Physics and Engineering Physics, University of Saskatchewan, 116 Science Place,
Saskatoon, Saskatchewan, Canada S7N5E25Research Institute for Scientific Measurements, Tohoku University, Sendai 980-8577, Japan
6University of Osnabruck, Sektion of Physik, D-49069 Osnabruck, Germany7Department of Physics, Aoyama-Gakuin University, Tokyo 157-8572, Japan
~Received 28 August 2001; published 19 March 2002!
Measurements of x-ray emission and absorption spectra of the constituents of MgB2 are presented. Theresults obtained are in good agreement with calculated x-ray spectra, with dipole matrix elements taken intoaccount. The comparison of x-ray emission spectra of graphite, AlB2, and MgB2 in the binding energy scalesupports the idea of charge transfer from s to p bands, which creates holes at the top of the bonding s bandsand drives the high-Tc superconductivity in MgB2.
DOI: 10.1103/PhysRevB.65.134509 PACS number~s!: 74.70.Ad, 74.25.Jb, 78.70.Dm, 78.70.En
I. INTRODUCTION
The recent discovery of superconductivity in MgB2 with aTc close to 40 K ~Ref. 1! was an unexpected experimentalachievement. Up to now, it is the highest Tc value reportedfor any binary compound.2 This value of Tc is much higherthan previously expected within the context of BCS theory.3
Not surprisingly, its discovery has given rise to much experi-mental and theoretical activity, having raised the possibilityof a whole new class of superconductors.
The experimentally observed B isotope shift of Tc ~Ref.4! and other experimental data5 suggest conventional BCSs-wave electron-phonon coupling. However, careful analysisof the temperature and magnetic field dependence of the spe-cific heat6 suggests anisotropic or multiple gaps. The re-ported values of 2D/kBTc51.224 from tunnelingmeasurements7 also raise the possibility of multiple gaps,although the values below the BCS weak coupling limit of3.5 have been attributed to surface effects. Even though thereis growing evidence for conventional BCS s-wave electron-phonon coupling, the experimental picture is not yet entirelyclear. In addition to theoretical explanations based on BCStheory,8–10 an alternative explanation based on hole super-conductivity has been proposed.11 Both theories are based onthe results of band structure calculations of MgB2.
X-ray emission and absorption spectroscopies are power-ful probes of the electronic structure of solids. Photon emis-sion and absorption involve a transition between electronicstates. In the soft x-ray regime, one of the states is a local-ized, dispersionless core level. This allows for the interpre-tion of the measured spectra in terms of unoccupied states forabsorption and occupied states for emission. Since dipoleselection rules govern the transitions to or from the corelevel, it is actually the angular-momentum-resolved densityof states ~DOS! that is measured. Furthermore, since the corelevel is associated with a specific element in the compound,x-ray absorption and emission are also element specific. Fi-
nally, they have the advantage of being relatively insensitiveto the quality of the sample surface, unlike x-ray photoelec-tron spectroscopy ~XPS! or ultraviolet photoemission, wherein order to measure the bulk electronic structure it is neces-sary to prepare atomically clean, stoichiometric, and orderedsurfaces, which are impossible to realize for sintered samplessuch as MgB2.
Recently, a high-resolution photoemission study of a sin-tered powder sample of MgB2 was carried out,12 however,the behavior of the spectral function was analyzed only inthe vicinity of the Fermi level. In the present paper, the x-rayemission and absorption spectra ~XES and XAS! of the con-stituents have been studied in MgB2 and related compounds~graphite and AlB2). The results obtained are compared withthe partial density of states and first-principles calculationsof the intensities of x-ray spectra which take dipole matrixelements and selection rules into account.
II. EXPERIMENTAL DETAILS
Both pressed powder and sintered polycrystalline MgB2samples were used for measurements of the XES. The sin-tered polycrystalline sample was prepared as described inRef. 1. X-ray diffraction measurements show that the sampleis single phased and electrical resistivity and dc magnetiza-tion measurements confirm the onset of a sharp supercon-ducting transition at 39.5 K. The B K emission and absorp-tion spectra were studied on Beamline 8.0.1 at the advancedlight source ~ALS! at Lawrence Berkeley National Labora-tory employing the soft x-ray fluorescence endstation.13
Emitted radiation was measured using a Rowland circle typespectrometer with spherical gratings and a multichannel two-dimensional detector. The measurements of the MgL-emission spectra were performed using an ultrasoft x-raygrating spectrometer ~R51 m,n5600 l/mm! with electronexcitation.14 The B Ka and Mg L2,3 XES were measuredwith excitation energies far from the B 1s and Mg 2p thresh-
PHYSICAL REVIEW B, VOLUME 65, 134509
0163-1829/2002/65~13!/134509~4!/$20.00 ©2002 The American Physical Society65 134509-1
77

olds ~nonresonant spectra!, with an energy resolution of 0.3eV.
The Mg 2p absorption spectra were measured at thebeamline BL-12A at the Photon Factory in KEK using pho-tons from a synchrotron source. The energy resolution nearthe Mg 2p threshold ~50 eV! is 0.5 eV, using a 0.1 mmmonochromator slit width. For Mg 2p measurements, weused a Si filter despite the Si 2p absorption threshold atabout 100 eV because at this beamline non-negligible secondorder light is included in this energy region. The absorptionspectra were taken by recording the total electron yield~TEY! sample drain current. To remove surface contamina-tion before the measurements, the sample was scraped withsandpaper and then striped off with vinyl tape repeatedlyuntil the mark left on the tape was uniform. The vacuum wasbelow 1.031026 Torr and the measurements were carriedout at room temperature.
In order to determine the position of the Fermi level andconvert x-ray spectra to the binding energy scale of XPS~difference of measured XES energies and a selected XPScore level energy!, B 1s and Mg 2p core levels were mea-sured. As mentioned above, XPS for valence band states isvery sensitive to surface contamination, nevertheless thebinding energies of core levels can be determined after
cleaning the surface. The XPS measurements have been car-ried out with an ESCA spectrometer manufactured by Physi-cal Electronics ~PHI 5600 ci!. The monochromatized Al Karadiation had a full width at half maximum ~FWHM! of 0.3eV and combined with the energy resolution of the analyzer~1.5% of the pass energy! results in an estimated energy reso-lution of somewhat less than 0.35 eV. XPS measurements ofa MgB2 sample fractured in high vacuum have shown lessoxygen content on the surface than those of sintered mate-rial. Further reduction of the oxygen content was achievedby ion etching. After cleaning the surface, we obtained thefollowing values for the binding energies associated with thecore levels: B 1s ~185.5 eV! and Mg 2p ~49.5 eV!. Theseresults agree well with recent XPS studies of MgB2 ~the Mg2p core level energy agrees within 0.2 eV!15 which showsthat the XPS core levels are not significantly influenced byoxidized surfaces, as shown in this study by comparing as-grown and etched surfaces in which the oxidized layer iseffectively removed. This supports the use of these values inFig. 3 to convert XES spectra to the binding energy scale.
III. RESULTS AND DISCUSSION
The states at the Fermi level derive primarily from B andso the resulting band structure can be understood in terms ofthe boron sublattice. Mg can be described as ionized (Mg21)
FIG. 1. Calculated ~a,c! and experimental ~b,d! B K emissionand absorption spectra of MgB2. The emission spectrum was ob-tained from electron excitation far from resonance and is an accu-mulation of several scans. The absorption spectrum was recordedfrom the total electron yield ~TEY! sample drain current using pho-tons from a synchrotron source.
FIG. 2. Calculated ~a,c! and experimental ~b,d! Mg L emissionand absorption spectra of MgB2. The density of states is signifi-cantly changed by the dipole matrix elements, which are necessaryin order to recover the experimental XES shape.
E. Z. KURMAEV et al. PHYSICAL REVIEW B 65 134509
134509-2
78
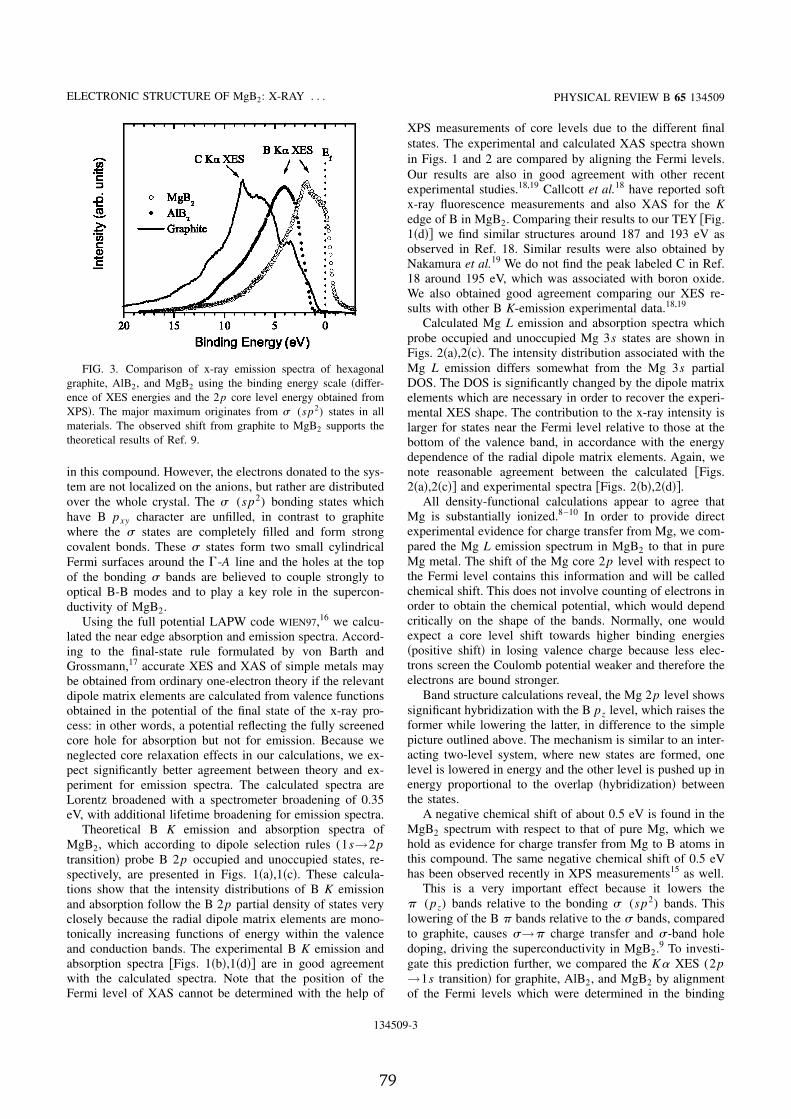
in this compound. However, the electrons donated to the sys-tem are not localized on the anions, but rather are distributedover the whole crystal. The s (sp2) bonding states whichhave B pxy character are unfilled, in contrast to graphitewhere the s states are completely filled and form strongcovalent bonds. These s states form two small cylindricalFermi surfaces around the G-A line and the holes at the topof the bonding s bands are believed to couple strongly tooptical B-B modes and to play a key role in the supercon-ductivity of MgB2.
Using the full potential LAPW code WIEN97,16 we calcu-lated the near edge absorption and emission spectra. Accord-ing to the final-state rule formulated by von Barth andGrossmann,17 accurate XES and XAS of simple metals maybe obtained from ordinary one-electron theory if the relevantdipole matrix elements are calculated from valence functionsobtained in the potential of the final state of the x-ray pro-cess: in other words, a potential reflecting the fully screenedcore hole for absorption but not for emission. Because weneglected core relaxation effects in our calculations, we ex-pect significantly better agreement between theory and ex-periment for emission spectra. The calculated spectra areLorentz broadened with a spectrometer broadening of 0.35eV, with additional lifetime broadening for emission spectra.
Theoretical B K emission and absorption spectra ofMgB2, which according to dipole selection rules (1s→2ptransition! probe B 2p occupied and unoccupied states, re-spectively, are presented in Figs. 1~a!,1~c!. These calcula-tions show that the intensity distributions of B K emissionand absorption follow the B 2p partial density of states veryclosely because the radial dipole matrix elements are mono-tonically increasing functions of energy within the valenceand conduction bands. The experimental B K emission andabsorption spectra @Figs. 1~b!,1~d!# are in good agreementwith the calculated spectra. Note that the position of theFermi level of XAS cannot be determined with the help of
XPS measurements of core levels due to the different finalstates. The experimental and calculated XAS spectra shownin Figs. 1 and 2 are compared by aligning the Fermi levels.Our results are also in good agreement with other recentexperimental studies.18,19 Callcott et al.18 have reported softx-ray fluorescence measurements and also XAS for the Kedge of B in MgB2. Comparing their results to our TEY @Fig.1~d!# we find similar structures around 187 and 193 eV asobserved in Ref. 18. Similar results were also obtained byNakamura et al.19 We do not find the peak labeled C in Ref.18 around 195 eV, which was associated with boron oxide.We also obtained good agreement comparing our XES re-sults with other B K-emission experimental data.18,19
Calculated Mg L emission and absorption spectra whichprobe occupied and unoccupied Mg 3s states are shown inFigs. 2~a!,2~c!. The intensity distribution associated with theMg L emission differs somewhat from the Mg 3s partialDOS. The DOS is significantly changed by the dipole matrixelements which are necessary in order to recover the experi-mental XES shape. The contribution to the x-ray intensity islarger for states near the Fermi level relative to those at thebottom of the valence band, in accordance with the energydependence of the radial dipole matrix elements. Again, wenote reasonable agreement between the calculated @Figs.2~a!,2~c!# and experimental spectra @Figs. 2~b!,2~d!#.
All density-functional calculations appear to agree thatMg is substantially ionized.8–10 In order to provide directexperimental evidence for charge transfer from Mg, we com-pared the Mg L emission spectrum in MgB2 to that in pureMg metal. The shift of the Mg core 2p level with respect tothe Fermi level contains this information and will be calledchemical shift. This does not involve counting of electrons inorder to obtain the chemical potential, which would dependcritically on the shape of the bands. Normally, one wouldexpect a core level shift towards higher binding energies~positive shift! in losing valence charge because less elec-trons screen the Coulomb potential weaker and therefore theelectrons are bound stronger.
Band structure calculations reveal, the Mg 2p level showssignificant hybridization with the B pz level, which raises theformer while lowering the latter, in difference to the simplepicture outlined above. The mechanism is similar to an inter-acting two-level system, where new states are formed, onelevel is lowered in energy and the other level is pushed up inenergy proportional to the overlap ~hybridization! betweenthe states.
A negative chemical shift of about 0.5 eV is found in theMgB2 spectrum with respect to that of pure Mg, which wehold as evidence for charge transfer from Mg to B atoms inthis compound. The same negative chemical shift of 0.5 eVhas been observed recently in XPS measurements15 as well.
This is a very important effect because it lowers thep (pz) bands relative to the bonding s (sp2) bands. Thislowering of the B p bands relative to the s bands, comparedto graphite, causes s→p charge transfer and s-band holedoping, driving the superconductivity in MgB2.9 To investi-gate this prediction further, we compared the Ka XES (2p→1s transition! for graphite, AlB2, and MgB2 by alignmentof the Fermi levels which were determined in the binding
FIG. 3. Comparison of x-ray emission spectra of hexagonalgraphite, AlB2, and MgB2 using the binding energy scale ~differ-ence of XES energies and the 2p core level energy obtained fromXPS!. The major maximum originates from s (sp2) states in allmaterials. The observed shift from graphite to MgB2 supports thetheoretical results of Ref. 9.
ELECTRONIC STRUCTURE OF MgB2: X-RAY . . . PHYSICAL REVIEW B 65 134509
134509-3
79

energy scale using XPS measurements of core levels. B1s (MgB2)5185.5 eV, B 1s (AlB2)5188.5 eV,20 and C1s ~graphite!5284.5 eV ~Ref. 20! ~Fig. 3!. As the figureshows, the major maximum originating from s states isshifted in MgB2 towards the Fermi level with respect to thatof graphite. AlB2 occupies an intermediate position due tothe higher electron concentration compared to MgB2 whichresults in filling of the s bands, decreasing N(E f) and finallydestroying superconductivity.
IV. CONCLUSION
In conclusion, we have measured x-ray emission and ab-sorption spectra of the constituents of the new supercon-ductor MgB2 and found good agreement with results of bandstructure calculations and in particular calculations of inten-sities of x-ray spectra taking the necessary matrix elementsinto account. Further, according to our findings magnesiumis positively charged in this compound, which supports theresults of electronic structure calculations. The comparisonof x-ray emission spectra of graphite, AlB2, and MgB2 sup-
ports the idea of superconductivity driven by hole doping ofthe covalent s bands. While the experimental results of ourstudy cannot give direct insight into the mechanism of thesuperconductivity, they do support and lend credence to thestandard band structure methods used in the theoreticalanalysis of this new and exciting material. This informationcould prove important in understanding and answering thequestions which still exist.
ACKNOWLEDGMENTS
We thank I. I. Mazin and O. Gunnarson for helpful dis-cussions and comments and J. E. Pask for a critical readingof the manuscript. The Russian State Program on Supercon-ductivity, Russian Foundation for Basic Research ~ProjectNo. 00-15-96575! and NATO Collaborative Linkage Grantsupported this work. J.K. would like to thank the Schloeß-mann Foundation for financial support. Funding by the Presi-dent’s NSERC fund of the University of Saskatchewan isgratefully acknowledged.
1 J. Nagamatsu, N. Nakagawa, T. Muronaka, Y. Zenitani, and J.Akimitsu, Nature ~London! 410, 63 ~2001!.
2 S.V. Vonsovsky, Yu.A. Izyumov, and E.Z. Kurmaev, Supercon-ductivity of Transitional Metals, Their Alloys and Compounds~Springer, Berlin, 1982!.
3 W.L. McMillan, Phys. Rev. 167, 331 ~1968!.4 S.L. Bud’ko, G. Lapertot, C. Petrovic, C.E. Cunningham, N.
Anderson, and P.C. Canfield, Phys. Rev. Lett. 86, 1877 ~2001!.5 D. K. Finnemore, J. E. Ostenson, S. L. Bud’ko, G. Lapertot, and
P. C. Canfield, Phys. Rev. Lett. 86, 2420 ~2001!; B. Lorenz, R.L. Meng, and C. W. Chu, Phys. Rev. B 64, 012507 ~2001!; P. C.Canfield, D. K. Finnemore, S. L. Bud’ko, J. E. Ostenson, G.Lapertot, C. E. Cunningham, and C. Petrovic, Phys. Rev. Lett.86, 2423 ~2001!.
6 R.K. Kremer, B.J. Gibson, and K. Ahn, cond-mat/0102432 ~un-published!; Y. Wang, T. Plackowski, and A. Junod, Physica C355, 179 ~2001!; F. Bouquet, R. A. Fisher, N. E. Phillips, D. G.Hinks, and J. D. Jorgensen, Phys. Rev. Lett. 87, 047001 ~2001!.
7 G. Karapetrov, M. Iavarone, W. K. Kwok, G. W. Crabtree, and D.G. Hinks, Phys. Rev. Lett. 86, 4374 ~2001!; G. Rubio-Bollinger,H. Suderow, and S. Vieira, ibid. 86, 5582 ~2001!; H. Schmidt, J.F. Zasadzinski, K. E. Gray, and D. G. Hinks, Phys. Rev. B 63,220504~R! ~2001!; A. Sharoni, I. Felner, and O. Millo, ibid. 63,220508~R! ~2001!.
8 J. Kortus, I.I. Mazin, K.D. Belashenko, V.P. Antropov, and L.L.Boyer, Phys. Rev. Lett. 86, 4656 ~2001!; A.Y. Liu, I.I. Mazin,and J. Kortus, Phys. Rev. Lett. 87, 087005 ~2001!.
9 J.M. An and W.E. Pickett, Phys. Rev. Lett. 86, 4366 ~2001!.10 Y. Kong, O.V. Dolgov, O. Jepsen, and O.K. Andersen, Phys. Rev.
B 64, 020501~R! ~2001!.11 J.E. Hirsch, Phys. Lett. A 282, 392 ~2001!.12 T. Takahashi, T. Sato, S. Souma, T. Muranaka, and J. Akimitsu,
Phys. Rev. Lett. 86, 4915 ~2001!.13 J. J. Jia, T. A. Callcott, J. Yurkas, A. W. Ellis, F. J. Himpsel, M. G.
Samant, J. Stohr, D. L. Ederer, J. A. Carlisle, E. A. Hudson, L. J.Terminello, D. K. Shuh, and R. C. C. Perera, Rev. Sci. Instrum.66, 1394 ~1995!.
14 A.P. Lukirsky, Izv. Akad. Nauk SSSR, Ser. Fiz. 25, 913 ~1961!.15 R. P. Vasquez, C. U. Jung, M.-S. Park, H.-J. Kim, J. Y. Kim, and
S.-I. Lee, Phys. Rev. B 64, 052510 ~2001!.16 P. Blaha, K. Schwarz, and J. Luitz, WIEN97, a FLAPW package for
calculating crystal properties, Vienna, Austria, 1999.17 U. von Barth and G. Grossmann, Solid State Commun. 32, 645
~1979!; U. von Barth and G. Grossmann, Phys. Rev. B 25, 5150~1982!.
18 T. A. Callcott, L. Lin, G. T. Woods, G. P. Zhang, J. R. Thompson,M. Paranthaman, and D. L. Ederer, Phys. Rev. B 64, 132504~2001!.
19 J. Nakamura, N. Yamada, K. Kuroki, T. A. Callcott, D. L. Ederer,J. D. Denlinger, and R. C. C. Perera, Phys. Rev. B 64, 174504~2001!.
20 J.F. Moulder, W.F. Stickle, P.E. Sobol, and K.D. Bomben, Hand-book of X-ray Photoelectron Spectroscopy ~Perkin-Elmer, EdenPrairie, MN, 1992!.
E. Z. KURMAEV et al. PHYSICAL REVIEW B 65 134509
134509-4
80

Appendix D
Dietrich M., Kortus J., Cordts W. andUnterricker S.
Electric Field Gradients in Wurtzite -
Type Semiconductors
phys. stat. sol. (b) 207, 13-17 (1998)
81
phys. stat. sol. (b) 207, 13 (1998)
Subject classification: 71.15.±m; 76.20.+q; S7; S8; S10
Electric Field Gradients in Wurtzite-Type Semiconductors
M. Dietrich (a), J. Kortus (b), W. Cordts (b), and S. Unterricker (a)
(a) Institut fuÈ r Angewandte Physik and (b) Institut fuÈ r Theoretische Physik,
Technische UniversitaÈt Bergakademie Freiberg, Bernhard-von-Cotta-Str. 4,D-09596 Freiberg, Germanyphone: +49-3731-392593; Fax: +49-3731-394004; e-mail: [email protected]
(Received December 18, 1997)
Electric field gradients (efg) in binary wurtzite-type semiconductors have been calculated self-con-sistently by application of the program WIEN 95 which is based on the LAPW method. The re-sults were compared with measured efg at the A- and B-sites. All efg are small and they arelargely influenced by the parameter u, which describes the displacement of the anion and cationsublattices and which has a low experimental accuracy. From the minimum of the total energy thereliable u parameters can be determined for substances where no experimental values exist. Theseu parameters show a linear dependence on the axis ratio c/a.
1. Introduction
By the nuclear quadrupole interaction the microscopic environment of suitable probenuclei in noncubic solids especially semiconductors can be investigated. Thereby thequadrupole frequencies depend on the electric field gradient (efg) Vzz at the probe siteand on the nuclear quadrupole moment Q. Methods like nuclear magnetic resonance(NMR), double resonance (ENDOR), MoÈ ssbauer effect and perturbed angular correla-tions (PAC) can be used. One of the aims of these investigations is the study of defects insemiconductors [1]. On the other side the efg at the position of a nuclear probe can beused to test very sensitively the quality of a calculated electronic charge distribution. Thisholds for nuclear probes which can be both impurities and host atoms in the semiconduc-tors investigated. Thereby the calculation of the host atom case is much simpler and it is aprerequisite for realistic calculations of impurity configurations.
There is a group of binary semiconductors of types AIIIBV, AIIBVI and AIBVII whichcrystallize in the noncubic wurtzite structure. Quadrupole coupling constants nQ = eQVzz/hare known for many of the cations and anions in such semiconductors. The theoreticalinterpretation of the measured efg was carried out in the past by simple point chargeestimations or more realistically with regard to the polarization of the ions [2 to 4].Today it is possible to calculate by first principle methods the electronic structure andthe efg in such compounds considering all electrons. Thereby computations with suita-ble clusters [5] or with periodic lattices are performed. We used the WIEN 95-code ofBlaha and Schwarz [6,7] which is based on the LAPW-method (full potential linearizedaugmented plane waves).
The wurtzite structure consists of two hexagonal close packed sublattices which aredisplaced in c-direction by uc. The structure parameters of the wurtzite compounds arethe lattice constant a, the axis ratio c/a and the parameter u. For most of the com-
M. Dietrich et al.: Electric Field Gradients in Wurtzite-Type Semiconductors 13
82

pounds the c/a ratio differs more or less from the ideal value��������
8=3p
� 1:633, and alsothe parameter u deviates from its ideal value 3/8 = 0.375. This means that the tetrahe-dra of next neighbours are slightly distorted. Only the lattice constant a and the c/aratio can be determined from the positions of the X-ray reflections with high accuracy.For the evaluation of the parameter u a structure refinement is necessary. Thereby theintensities of the reflections must be determined accurately and the correspondingstructure amplitudes have to be fitted to those of the real wurtzite structure with adefined u parameter. Such a procedure has a limited accuracy. Therefore, the u param-eter has a larger uncertainty than the lattice parameters a and c/a. Beside this all latticeparameters are slightly influenced by the growth conditions and the defect concentra-tion of the specimens.
2. Calculation of Charge Distributions and Electric Field Gradients
The electric field gradient (efg) at the position of a probe nucleus is a traceless sym-metric tensor which is determined by the anisotropy of the charge distribution aroundthe probe. It is defined by the second derivative of the electric potential leading to theprincipal component of the tensor Vzz and the asymmetry parameter h = (Vxx ±± Vyy)/Vzz.In the wurtzite lattice we have a threefold axis and therefore h = 0. The quadrupolefrequencies depend only on Vzz.
Today it is possible to calculate the charge distribution r(r) in a crystal self-consis-tently considering the full electronic structure. Electric field gradients at the positions oflattice points can be calculated in an adequate manner. In the WIEN 95-code [7] thefull potential is determined from the self-consistent charge density distribution. In theLAPW method a scalar relativistic version without spin±orbit coupling was used.
Well converged solutions were found for RcutKmax � 8, where Kmax is the plane wavecut-off and Rcut is the smallest of all atomic sphere radii. Partial waves up to l = 12inside atomic spheres and 24 k-points in the irreducible wedge of the Brillouin zone
14 M. Dietrich, J. Kortus, W. Cordts, and S. Unterricker
Fig. 1. The total energy in dependence on the parameter u for CdS. The minimum (arrow) is near-by the experimental value u = 0.3775 [18]. The relative depth of the minimum is very small. Thetotal binding energy of all electrons of the two Cd- and the two S-atoms in the elementary cell isabout 325943 eV
83
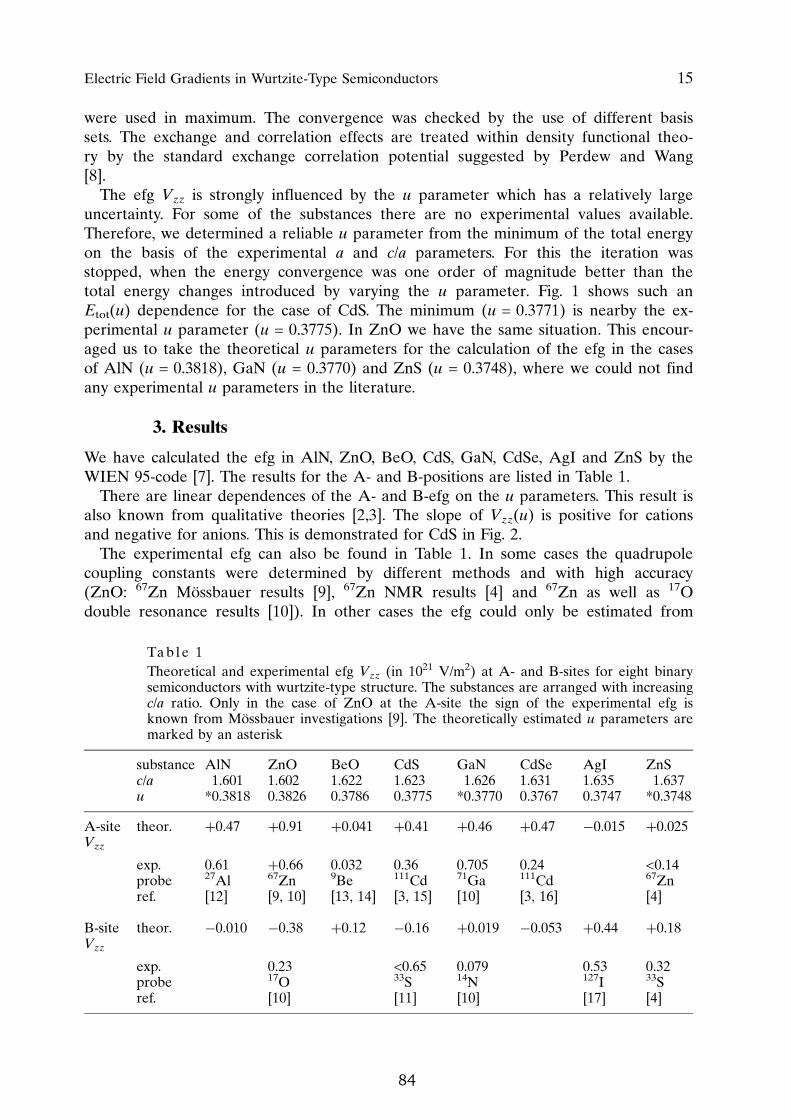
were used in maximum. The convergence was checked by the use of different basissets. The exchange and correlation effects are treated within density functional theo-ry by the standard exchange correlation potential suggested by Perdew and Wang[8].
The efg Vzz is strongly influenced by the u parameter which has a relatively largeuncertainty. For some of the substances there are no experimental values available.Therefore, we determined a reliable u parameter from the minimum of the total energyon the basis of the experimental a and c/a parameters. For this the iteration wasstopped, when the energy convergence was one order of magnitude better than thetotal energy changes introduced by varying the u parameter. Fig. 1 shows such anEtot(u) dependence for the case of CdS. The minimum (u = 0.3771) is nearby the ex-perimental u parameter (u = 0.3775). In ZnO we have the same situation. This encour-aged us to take the theoretical u parameters for the calculation of the efg in the casesof AlN (u = 0.3818), GaN (u = 0.3770) and ZnS (u = 0.3748), where we could not findany experimental u parameters in the literature.
3. Results
We have calculated the efg in AlN, ZnO, BeO, CdS, GaN, CdSe, AgI and ZnS by theWIEN 95-code [7]. The results for the A- and B-positions are listed in Table 1.
There are linear dependences of the A- and B-efg on the u parameters. This result isalso known from qualitative theories [2,3]. The slope of Vzz(u) is positive for cationsand negative for anions. This is demonstrated for CdS in Fig. 2.
The experimental efg can also be found in Table 1. In some cases the quadrupolecoupling constants were determined by different methods and with high accuracy(ZnO: 67Zn MoÈ ssbauer results [9], 67Zn NMR results [4] and 67Zn as well as 17Odouble resonance results [10]). In other cases the efg could only be estimated from
Electric Field Gradients in Wurtzite-Type Semiconductors 15
Ta b l e 1Theoretical and experimental efg Vzz (in 1021 V/m2) at A- and B-sites for eight binarysemiconductors with wurtzite-type structure. The substances are arranged with increasingc/a ratio. Only in the case of ZnO at the A-site the sign of the experimental efg isknown from MoÈ ssbauer investigations [9]. The theoretically estimated u parameters aremarked by an asterisk
substance AlN ZnO BeO CdS GaN CdSe AgI ZnSc/a 1.601 1.602 1.622 1.623 1.626 1.631 1.635 1.637u *0.3818 0.3826 0.3786 0.3775 *0.3770 0.3767 0.3747 *0.3748
A-siteVzz
theor. �0.47 �0.91 �0.041 �0.41 �0.46 �0.47 ÿ0.015 �0.025
exp.proberef.
0.6127Al[12]
�0.6667Zn[9, 10]
0.0329Be[13, 14]
0.36111Cd[3, 15]
0.70571Ga[10]
0.24111Cd[3, 16]
<0.1467Zn[4]
B-siteVzz
theor. ÿ0.010 ÿ0.38 �0.12 ÿ0.16 �0.019 ÿ0.053 �0.44 �0.18
exp.proberef.
0.2317O[10]
<0.6533S[11]
0.07914N[10]
0.53127I[17]
0.3233S[4]
84
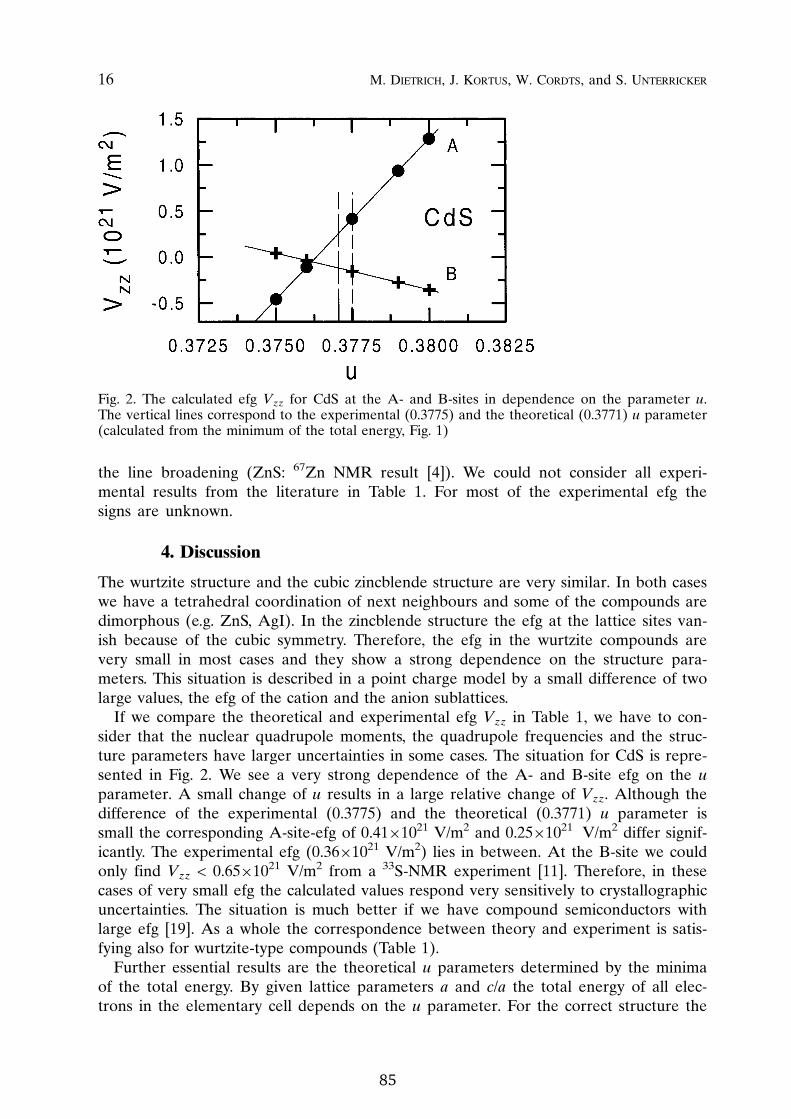
the line broadening (ZnS: 67Zn NMR result [4]). We could not consider all experi-mental results from the literature in Table 1. For most of the experimental efg thesigns are unknown.
4. Discussion
The wurtzite structure and the cubic zincblende structure are very similar. In both caseswe have a tetrahedral coordination of next neighbours and some of the compounds aredimorphous (e.g. ZnS, AgI). In the zincblende structure the efg at the lattice sites van-ish because of the cubic symmetry. Therefore, the efg in the wurtzite compounds arevery small in most cases and they show a strong dependence on the structure para-meters. This situation is described in a point charge model by a small difference of twolarge values, the efg of the cation and the anion sublattices.
If we compare the theoretical and experimental efg Vzz in Table 1, we have to con-sider that the nuclear quadrupole moments, the quadrupole frequencies and the struc-ture parameters have larger uncertainties in some cases. The situation for CdS is repre-sented in Fig. 2. We see a very strong dependence of the A- and B-site efg on the uparameter. A small change of u results in a large relative change of Vzz. Although thedifference of the experimental (0.3775) and the theoretical (0.3771) u parameter issmall the corresponding A-site-efg of 0.41�1021 V/m2 and 0.25�1021 V/m2 differ signif-icantly. The experimental efg (0.36�1021 V/m2) lies in between. At the B-site we couldonly find Vzz < 0.65�1021 V/m2 from a 33S-NMR experiment [11]. Therefore, in thesecases of very small efg the calculated values respond very sensitively to crystallographicuncertainties. The situation is much better if we have compound semiconductors withlarge efg [19]. As a whole the correspondence between theory and experiment is satis-fying also for wurtzite-type compounds (Table 1).
Further essential results are the theoretical u parameters determined by the minimaof the total energy. By given lattice parameters a and c/a the total energy of all elec-trons in the elementary cell depends on the u parameter. For the correct structure the
16 M. Dietrich, J. Kortus, W. Cordts, and S. Unterricker
Fig. 2. The calculated efg Vzz for CdS at the A- and B-sites in dependence on the parameter u.The vertical lines correspond to the experimental (0.3775) and the theoretical (0.3771) u parameter(calculated from the minimum of the total energy, Fig. 1)
85

Etot(u) dependence must have a minimum. This minimum is very flat if we compare itsdepth with the total energy. Nevertheless the minimum has the correct position forsubstances where experimental u parameters exist. Theoretical u parameters were de-termined for the substances AlN, ZnO, CdS, GaN and ZnS. These u parameters show alinear dependence on the axis ratio c/a whereby the experimental u parameters ofother substances are consistent with this linear dependence (Fig. 3). Such a linear de-pendence between u and c/a was assumed in [3] too.
References
[1] G. Langouche (Ed.), Hyperfine Interaction of Defects in Semiconductors, Elsevier Publ. Co.,Amsterdam 1992.
[2] T. T. Taylor and T. P. Das, Phys. Rev. 133, A1327 (1964).[3] S. Unterricker and F. Schneider, Hyperfine Interactions 39, 39 (1988).[4] T. J. Bastow and S. N. Stuart, phys. stat. sol. (b) 145, 719 (1988).[5] D. W. Mitchell, S. B. Sulaiman, N. Sahoo, T. P. Das, W. Potzel, and G. M. Kalvius, Phys.
Rev. B 44, 6728 (1991).[6] K. Schwarz and P. Blaha, Z. Naturf. 47a, 197 (1992).[7] P. Blaha, K. Schwarz, P. Dufek, andR.Augustyn,WIEN 95, Technical University of Vienna, 1995.[8] J. P. Perdew and Y. Wang, Phys. Rev. B 45, 1324 (1992).[9] C. SchaÈfer, W. Potzel, W. Adlassnig, P. PoÈtting, E. Ikonen, and G. M. Kalvius, Phys. Rev.
B 37, 7247 (1988).[10] G. Denninger and D. Reiser, Phys. Rev. B 55, 5073 (1997).[11] T. Kushida and A. H. Silver, Phys. Rev. 137, A1591 (1965).[12] Oc Hee Han, H. K. C. Timken, and E. Oldfield, J. Chem. Phys. 89, 6046 (1988).[13] G. J. Troup and J. A. Walter, J. Nuclear Mater. 14, 272 (1964).[14] J. F. Hon, Phys. Rev. 124, 1368 (1961).[15] E. Berthold, M. Frank, F. Gubitz, W. Kreische, C. Ott, B. Roseler, F. Schwab, K. Stammler,
and G. Weeske, Appl. Phys. Lett. 58, 461 (1991).[16] H. Barfuss, G. BoÈhnlein, H. Hohenstein, W. Kreische, H. Niedrig, H. Appel, R. Heidinger,
J. Randies, G. Then, and W. G. Thies, Z. Phys. B 47, 99 (1982).[17] S. L. Segel, J. A. Walter, and G. J. Troup, phys. stat. sol. 31, K43 (1969).[18] S. L. Mair and Z. Barnea, Acta Cryst. A31, 201 (1975).[19] J. Kortus, W. Cordts, M. Dietrich, S. Unterricker, A. Burchard, M. Deicher, and R. Ma-
gerle, Annu. Rep. 1996, University of Konstanz, Nukleare FestkoÈ rperphysik (p. 56).
Electric Field Gradients in Wurtzite-Type Semiconductors 17
Fig. 3. Correlation between u and the axis ratio c/a. Full circles: theoretical u parameters for AlN,ZnO, CdS, GaN and ZnS, crosses: experimental u values
86
Appendix E
Kortus J., Irmer G., Monecke J. andPederson M.R.
Influence of cage structures on the
vibrational modes and Raman activity
of methane
Modelling Simul. Mater. Sci. Eng. 8,403-411 (2000)
87

88

Modelling Simul. Mater. Sci. Eng. 8 (2000) 403–411. Printed in the UK PII: S0965-0393(00)12934-1
Influence of cage structures on the vibrational modes and
Raman activity of methane
J Kortus†§, G Irmer†, J Monecke† and Mark R Pederson‡† Institute of Theoretical Physics, Freiberg University of Mining and Technology,B.-v.-Cotta-Strasse 4, 09596 Freiberg, Germany‡ Center for Computational Materials Science—6392, Naval Research Laboratory,Washington DC 20375-5000, USA
Received 24 January 2000, in final form 20 March 2000
Abstract. Melanophlogite is a naturally occurring SiO2-based clathrate structure which has thesame structure of type I gas hydrates. Two types of voids are found in melanophlogite. Furthermore,as in the case of the gas hydrates, melanophlogite traps gas molecules within the voids. In this workwe present a joint theoretical and experimental investigation of the CH4 Raman spectra associatedwith the enclathrated CH4 molecules. We find that the Raman intensities of the totally symmetrichydrogen stretch modes are significantly perturbed by the presence of the clathrate cage and showthat the calculated Raman spectra may be used to determine the concentration and location of theenclathrated gas molecules. Relative to the gas-phase structure we identify two effects which areresponsible for the change in intensity of the enclathrated molecules relative to the gas phase. Thepolarizibility of the surrounding cage acts to increase the Raman spectra of the stretch mode inthe pentagondodecahedra cage. However, in the lower-symmetry tetrakaidecahedra cage, mixingbetween the hydrogen stretch mode and other optically silent molecular vibrations counteractsthis effect and accounts for the different Raman intensities observed for the two types of voids.We suggest that similar calculations and experiments on the gas hydrates may provide an in situ
diagnostic tool for determining the amount of natural gas contained within the gas hydrates on thesea floor.
(Some figures in this article are in colour only in the electronic version; see www.iop.org)
1. Introduction
Structures containing large voids of free space have been the subject of great scientific interestdue to their large-scale application in the chemical industry and the possibility for studyingbasic interactions between the host structure and the guests which fill the voids. Examplesof these cage structures are fullerenes [1, 2], clathrate structures such as gas hydrates [3] orzeolites.
Zeolites are of interest because they serve as shape and size selective catalysts andmolecular sieves. However, the possibility of using these materials as hosts for the synthesis ofsmall clusters has only recently been explored [4, 5]. Similar to the well known semiconductorsuperlattices, zeolite frameworks provide a method for creating new three-dimensional periodicarrays of guest molecules enclosed in the zeolite voids.
The experimental effort in this area, driven partially by potential applications to nonlinearoptical devices and solar elements has resulted in several zeolite-based materials, which include
§ Present address: Center for Computational Materials Science—6392, Naval Research Laboratory, Washington DC20375-5000, USA.
0965-0393/00/030403+09$30.00 © 2000 IOP Publishing Ltd 403
89

404 J Kortus et al
small semiconductor clusters. Some specific examples are CdS [6], GaP [7] and Se [8]clusters. More information about other systems can be found elsewhere in review articles[4, 5] and references therein. In addition to experimental efforts there have also been theoreticalstudies, which have investigated the structural and electronic properties of zeolites [9, 10] orthe simulation of small silicon clusters in sodalite [11]. Some of the most interesting questionsabout these systems pertain to the guest–guest and guest–host interactions. The guest–hostinteraction seems to be dominant, because in typical zeolites guests are separated by more thanten angstroms. The experimentally observed blue shift of the optical absorption threshold [8]compared with free clusters suggest similar quantum confinement effects that occur in layeredsemiconductor superlattices, due to changes of electronic states in the system by guest–hostinteractions.
The present paper will discuss a similar clathrate structure known as melanophlogite.Melanophlogite is a naturally occurring, low-density form of silica, which is always foundto contain some organic matter. The SiO4 tetraeders of the host form a three-dimensionalframework consisting of two different kinds of cages. One of these cages is the naturallyoccurring silica equivalent of a C20 fullerene. In fact, melanophlogite was the first knownexample of a silicate framework structure with the pentagonal dodecahedron as a frameworkelement [12].
The main goal of the present work is to investigate the interesting guest–host interactionsof the host framework and the methane included in this material. Raman spectroscopy providesa non-destructive method for obtaining information about the kind of guests by observing theirvibrational fingerprints. Furthermore, if the the Raman activity of the guest molecules isknown, the density of the guests may be determined. Since, density-functional calculationsprovide a cost-effective ab initio means for determining the Raman activity of molecules thetwo methods combined give us a powerful tool for analysing and characterizing the above-mentioned structures.
From a technological standpoint, the secondary goal of this work is to demonstrate, by wayof example, that techniques similar to those used here may be helpful for obtaining informationabout the concentration and type of natural gas contained within the gas hydrates. One of theclathrate structures of the gas hydrates is, in fact, identical to the structure of melanophlogite.The work discussed in the following shows that in situ Raman measurements of gas hydratesin conjunction with theoretically determined Raman spectra could be used to determine thelocation, type and concentration of such molecules
In the following sections we provide more information about this not so well knownmaterial and give experimental and theoretical details. In section 3 we discuss the experimentaland theoretical details. In section 4 we present and discuss our results and conclusions aregiven in the last section.
2. Melanophlogite
Melanophlogite is a white and colourless mineral, which is found only at a few localities(Sicily [13], Fortullino [14], Chvaletice [15], Mount Hamilton [16] and Tsekur-Koyash [17]).Although melanophlogite is quite rare in nature it has been synthesized at 443 K from anaqueous solution of silica acids under a high pressure of different gases [18].
This silica polymorph usually contains several guest molecules (e.g. CH4, N2 and CO2)in varying amounts. Kamb [12] first suggested that this low-density cubic form† of silica,which may also incorporate long, straight-chain hydrocarbons, is isostructural to the cubic gas
† The reported tetragonal forms, with a doubled unit cell in one direction, will not be discussed here.
90

Vibrational modes and Raman activity of methane 405
hydrates [3] of type I. The SiO4 tetraeders form a three-dimensional framework by sharingcorners. This framework contains two types of cages: two pentagondodecahedra (cage I) andsix tetrakaidecahedra (cage II) per unit cell. Figure 1 displays a schematic diagram of thecrystal structure of three by three unit cells parallel to the [100] direction. The highlightedpart presents four cages of type I on the corners and two cages of type II in the middle. Thestructure of the smaller cage I shown in figure 2 is well known from recent interest in carbonfullerenes. It is the natural occurring silica equivalent of a C20 fullerene. However, due to thetetrahedral coordination preferred by Si atoms the cages share faces to satisfy the sp3 bonding.The corners are occupied by silicon atoms, whereas the oxygen atoms are located on the middleof the edges. The free space within cage I can be approximately described by a sphere-likevoid with diameter d ∼ 5.7 Å and a volume V ∼ 97 Å3.
Figure 1. View of three by three unit cells of melanophlogite in the [100] direction. The cornersof the emphasized section displays four cages of type I and two cages of type II in the middle. Thelighter atoms are silicon atoms which are connected by oxygen atoms (dark circles). There are noguest molecules displayed.
The structure of cage type II is presented in figure 3. The top and bottom faces arehexagons and the remaining faces are pentagons. The free space within can be approximatedby an ellipsoid with d1 ∼ d2 ∼ 5.8 Å, d3 ∼ 7.7 Å and a volume of 136 Å3. An interestingfeature of cage II is that the stacking of cages lead to nanotube-like structures, which maycontain long chain-like molecules. The open circular objects seen in figure 1 represent a topview of the stacked cages of type II. The entire crystal structure may also be described as athree-dimensional array of stacked cages of type II.
3. Experimental and theoretical details
3.1. Raman measurements
Small crystallites of melanophlogite from Furtullino without visible fluid inclusions werecarefully selected under an optical microscope from Olympus. The measurements were
91
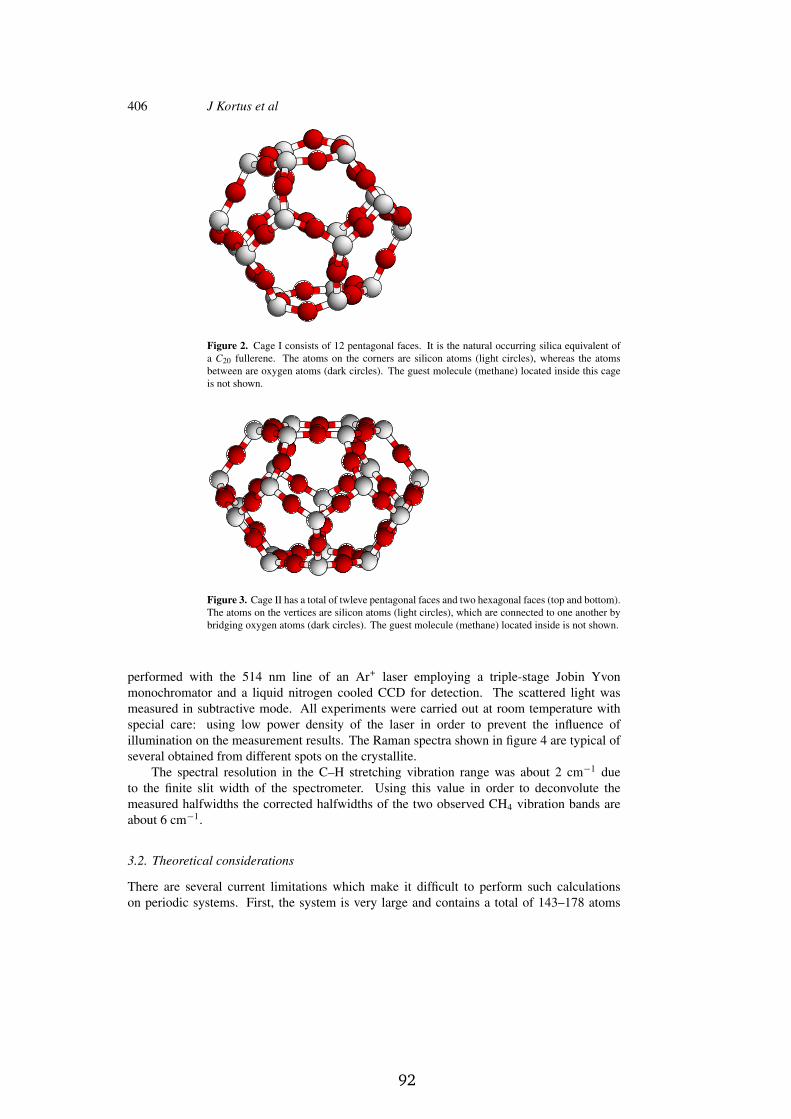
406 J Kortus et al
Figure 2. Cage I consists of 12 pentagonal faces. It is the natural occurring silica equivalent ofa C20 fullerene. The atoms on the corners are silicon atoms (light circles), whereas the atomsbetween are oxygen atoms (dark circles). The guest molecule (methane) located inside this cageis not shown.
Figure 3. Cage II has a total of twleve pentagonal faces and two hexagonal faces (top and bottom).The atoms on the vertices are silicon atoms (light circles), which are connected to one another bybridging oxygen atoms (dark circles). The guest molecule (methane) located inside is not shown.
performed with the 514 nm line of an Ar+ laser employing a triple-stage Jobin Yvonmonochromator and a liquid nitrogen cooled CCD for detection. The scattered light wasmeasured in subtractive mode. All experiments were carried out at room temperature withspecial care: using low power density of the laser in order to prevent the influence ofillumination on the measurement results. The Raman spectra shown in figure 4 are typical ofseveral obtained from different spots on the crystallite.
The spectral resolution in the C–H stretching vibration range was about 2 cm−1 dueto the finite slit width of the spectrometer. Using this value in order to deconvolute themeasured halfwidths the corrected halfwidths of the two observed CH4 vibration bands areabout 6 cm−1.
3.2. Theoretical considerations
There are several current limitations which make it difficult to perform such calculationson periodic systems. First, the system is very large and contains a total of 143–178 atoms
92
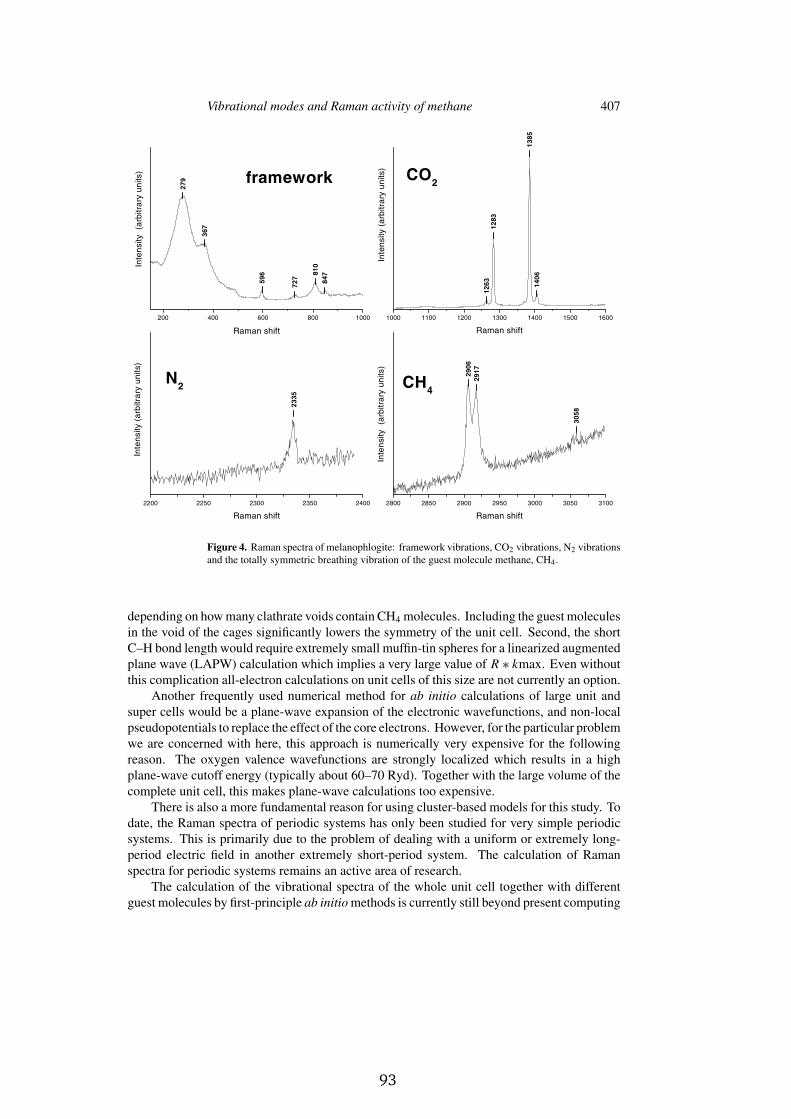
Vibrational modes and Raman activity of methane 407
200 400 600 800 1000
27
9
36
7
59
6
72
7
81
0
84
7
framework
Inte
nsity
(arb
itra
ry u
nits)
Raman shift
12
63
12
83
13
85
14
06
1000 1100 1200 1300 1400 1500 1600
CO2
Raman shift
Inte
nsity (
arb
itra
ry u
nits)
23
35
2200 2250 2300 2350 2400
N2
Raman shift
Inte
nsity (
arb
itra
ry u
nits)
29
17
29
06
30
58
2800 2850 2900 2950 3000 3050 3100
CH4
Raman shift
Inte
nsity
(arb
itra
ry u
nits)
Figure 4. Raman spectra of melanophlogite: framework vibrations, CO2 vibrations, N2 vibrationsand the totally symmetric breathing vibration of the guest molecule methane, CH4.
depending on how many clathrate voids contain CH4 molecules. Including the guest moleculesin the void of the cages significantly lowers the symmetry of the unit cell. Second, the shortC–H bond length would require extremely small muffin-tin spheres for a linearized augmentedplane wave (LAPW) calculation which implies a very large value of R ∗ kmax. Even withoutthis complication all-electron calculations on unit cells of this size are not currently an option.
Another frequently used numerical method for ab initio calculations of large unit andsuper cells would be a plane-wave expansion of the electronic wavefunctions, and non-localpseudopotentials to replace the effect of the core electrons. However, for the particular problemwe are concerned with here, this approach is numerically very expensive for the followingreason. The oxygen valence wavefunctions are strongly localized which results in a highplane-wave cutoff energy (typically about 60–70 Ryd). Together with the large volume of thecomplete unit cell, this makes plane-wave calculations too expensive.
There is also a more fundamental reason for using cluster-based models for this study. Todate, the Raman spectra of periodic systems has only been studied for very simple periodicsystems. This is primarily due to the problem of dealing with a uniform or extremely long-period electric field in another extremely short-period system. The calculation of Ramanspectra for periodic systems remains an active area of research.
The calculation of the vibrational spectra of the whole unit cell together with differentguest molecules by first-principle ab initio methods is currently still beyond present computing
93
408 J Kortus et al
possibilities. Therefore, in order to calculate the Raman frequencies and intensities of interest,we used some approximations based on experimental observations. The basic assumptionis that no mixing of the vibrational modes of the framework and of guest molecules occur.This assumption is supported by experiment, because the framework vibrations are more than2000 cm−1 lower than the investigated totally symmetric 1A1 mode of methane. Furtherpossible changes of the molecule geometry due to charge transfer between guests andframework is neglected, although we allow for full relaxation of all electronic degrees offreedom and we account for breathing of the methane molecule. Using these assumptionsthe influence of the different cages can be considered as a small perturbation of a nearly freevibrating molecule.
Based on x-ray data [12] we generated the unit cell of melanophlogite and removed thetwo different cage types. The dangling bonds were then resaturated with hydrogen atoms.Holding the cage atoms fixed we allowed the methane to vibrate. This does not introduce alarge error because, as already mentioned, the framework vibrations are slow compared to thetotally symmetric 1A1 mode of methane.
The orientation of methane inside the cage has not been experimentally determined. Dueto the space available there is no a priori reason for excluding the possibility that the methanecan rotate within the cage at room temperature. For our calculations we restricted ourselves toan orientation of the methane molecule, which was adapted to the symmetry of cage I. There isno orientation of the Td methane molecule which is compatible with the symmetry of cage II,therefore we have choosen the same orientation as for cage I. That means that all methanemolecules would have the same orientation in the entire crystal framework of melanophlogite.This special choice certainly is not satisfactionary and could be avoided by using, for example,molecular dynamic techniques including the relaxation of the entire unit cell together with theincluded guest molecules. To address this point we carried out some preliminary tight-bindingcalculations allowing for full relaxation of the unit cell and the included methane. The initialplacement of methane is not a special case for which the forces acting on the molecule vanishby symmetry. With the initial placement of methane described above we did not observe arotation of methane during these simulations. The results of these tight-binding calculationswill not be discussed here, although they agree well with the ab initio results. The use of thecomputationally more demanding ab initio methods was required, because the tight-bindingmethod did not allow for the calculation of Raman intensities.
To determine the changes in the Raman frequencies and intensities, we displaced thehydrogen atoms of methane by a small distance (0.05 au) according to the positive and negativedirection of the normal vibration of the methane A1 mode and calculated the total energy andthe forces of the corresponding geometry for both cages. Using the information of the forcesacting on the relaxed free methane placed in both cages allowed for the calculation of the newequilibrium geometry of methane in the cages. In order to calculate the Raman intensities weapplied an external electric field of 0.005 au to our cage structures with the methane as anincluded guest. The total energy for the frequency calculations was converged to 10−6 Hartreeand for intensities to 10−8 Hartree.
The calculations were performed using the all-electron, full potential Gaussian-orbitalcluster code NRLMOL [19]. The potential is calculated analytically on a variational integrationmesh which allows for the determination of the electronic structure, total energies and Pulay-corrected Hellmann–Feynman forces with any desired numerical precision. We used thePerdew–Zunger parameterization of the standard Ceperly–Alder [20] functional within localdensity approximation (LDA). A more detailed description of the technique used and ofcomputational problems associated with calculation of Raman scattering activities withindensity functional theory can be found elsewhere [21].
94

Vibrational modes and Raman activity of methane 409
4. Results and discussion
4.1. Raman measurements
Figure 4 presents the results of Raman measurements of melanophlogite. The vibrationalspectra shown in figure 4(a) was identified as the framework vibrations of melanophlogite.The higher peaks at 727, 810 and 847 cm−1 are not due to melanophlogite but probably dueto dolomite, which was present in the investigated samples. This observation was supportedby an absence of these peaks in samples from a different origin. Figures 4(b) and 4(c) areassociated with the vibrations of CO2 and N2, respectively. Due to the larger halfwidthsof these peaks than that of free molecules in air, we concluded that these molecules are anintegral part of melanophlogite. The most interesting results used for further discussion of theRaman measurements are displayed in figure (d). The peak found at 2917 cm−1 is locatedat the same position as the totally symmetric A1 mode of methane. Further support that theobserved vibration is connected with methane comes from the higher peak found at about3058 cm−1, which is assigned to be asymmetric stretching T2 mode of methane. The lowerpeak at 2906 cm−1 ( = 11 cm−1) is somewhat unexpected, since the total symmetric modeof methane is non-degenerate.
4.2. Theoretical calculation
As described above, we calculated the frequencies and Raman activities of the modes ofmethane in both cages. Due to the symmetry compatible orientation of methane in cage I theforce constant matrix is diagonal for the investigated totally symmetric mode of methane. Thisfurther supports our chosen orientation, because within our numerical accuracy we found notorque components acting to rotate the methane molecule. The case of methane in cage II ismore complicated, because the normal vibration of the totally symmetric mode of free methaneis broken in cage II. Therefore our force constant matrix is no longer diagonal, which resultsin a mixing of other modes with the totally symmetric A1 mode. After diagonalization of theforce constant matrix we found a mixing of the totally symmetric mode with the threefolddegenerate T2 mode above 3000 cm−1. This mode splits in a single vibrational mode and atwofold degenerated mode separated by 9 cm−1. Eventually this could be found in experimentas a broad structure, because the unsplit threefold degenerate mode of the methane in cage Iis found between the split modes of cage II. However, the current available experimental datado not allow for reliable investigation of this effect.
The results including only harmonic effects compared with the calculation of the freemethane molecule using the same numerical approximations are summarized in table 1.Compared with the experimental results all calculated frequencies are slightly too high, which isa well known behaviour of LDA calculations. Using the free methane vibrations as a referencethe A1 mode in both cages is shifted downwards, but by different amounts. The perturbationof methane in the smaller cage I is larger, which results in the observed splitting of the totallysymmetric mode of methane. The calculated splitting of only 3 cm−1 is too small comparedwith the experimentally measured value of 11 cm−1. The previously mentioned tight-bindingcalculations of an entire unit cell of melanophlogite resulted in a splitting of 4.5 cm−1.
In order to improve the theoretical results we included anharmonic effects in ourcalculations. Using all available energies and forces we fitted the data to a third-orderpolynomial of the total energy as a function of the displacement of the totally symmetric mode.Because we are still confined to the subspace of only one normal mode this problem reducesto a one-dimensional quantum mechanical problem of a particle in the resulting potential,which we solved numerically. This gives an additional splitting of 2 cm−1 due to anharmonic
95
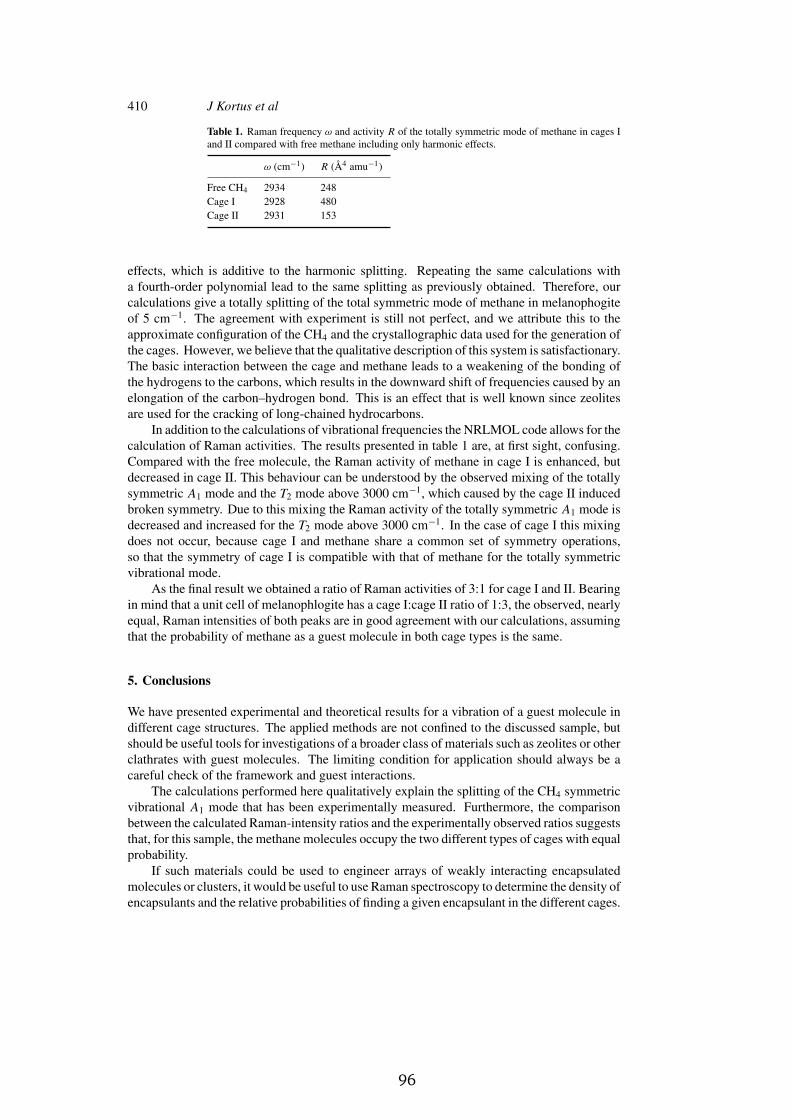
410 J Kortus et al
Table 1. Raman frequency ω and activity R of the totally symmetric mode of methane in cages Iand II compared with free methane including only harmonic effects.
ω (cm−1) R (Å4 amu−1)
Free CH4 2934 248Cage I 2928 480Cage II 2931 153
effects, which is additive to the harmonic splitting. Repeating the same calculations witha fourth-order polynomial lead to the same splitting as previously obtained. Therefore, ourcalculations give a totally splitting of the total symmetric mode of methane in melanophogiteof 5 cm−1. The agreement with experiment is still not perfect, and we attribute this to theapproximate configuration of the CH4 and the crystallographic data used for the generation ofthe cages. However, we believe that the qualitative description of this system is satisfactionary.The basic interaction between the cage and methane leads to a weakening of the bonding ofthe hydrogens to the carbons, which results in the downward shift of frequencies caused by anelongation of the carbon–hydrogen bond. This is an effect that is well known since zeolitesare used for the cracking of long-chained hydrocarbons.
In addition to the calculations of vibrational frequencies the NRLMOL code allows for thecalculation of Raman activities. The results presented in table 1 are, at first sight, confusing.Compared with the free molecule, the Raman activity of methane in cage I is enhanced, butdecreased in cage II. This behaviour can be understood by the observed mixing of the totallysymmetric A1 mode and the T2 mode above 3000 cm−1, which caused by the cage II inducedbroken symmetry. Due to this mixing the Raman activity of the totally symmetric A1 mode isdecreased and increased for the T2 mode above 3000 cm−1. In the case of cage I this mixingdoes not occur, because cage I and methane share a common set of symmetry operations,so that the symmetry of cage I is compatible with that of methane for the totally symmetricvibrational mode.
As the final result we obtained a ratio of Raman activities of 3:1 for cage I and II. Bearingin mind that a unit cell of melanophlogite has a cage I:cage II ratio of 1:3, the observed, nearlyequal, Raman intensities of both peaks are in good agreement with our calculations, assumingthat the probability of methane as a guest molecule in both cage types is the same.
5. Conclusions
We have presented experimental and theoretical results for a vibration of a guest molecule indifferent cage structures. The applied methods are not confined to the discussed sample, butshould be useful tools for investigations of a broader class of materials such as zeolites or otherclathrates with guest molecules. The limiting condition for application should always be acareful check of the framework and guest interactions.
The calculations performed here qualitatively explain the splitting of the CH4 symmetricvibrational A1 mode that has been experimentally measured. Furthermore, the comparisonbetween the calculated Raman-intensity ratios and the experimentally observed ratios suggeststhat, for this sample, the methane molecules occupy the two different types of cages with equalprobability.
If such materials could be used to engineer arrays of weakly interacting encapsulatedmolecules or clusters, it would be useful to use Raman spectroscopy to determine the density ofencapsulants and the relative probabilities of finding a given encapsulant in the different cages.
96
Vibrational modes and Raman activity of methane 411
We have shown that the Raman intensities of the encapsulated molecule differ significantlyfrom that of the gas-phase molecule and exhibit a sensitive dependence on the cage structure.This means that a quantitative determination of the relative populations cannot be achievedby borrowing gas-phase intensities. However, density-functional calculations provide a cost-effective means for determining how the encapsulant Raman intensities depend on the cageand could provide a mean for characterizing future samples.
Indeed melanophlogite samples from another location lead to experimentally observedratios that are different from those discussed here. It would be interesting if an alternativeexperimental means could be used to confirm that the two samples do indeed have differentratios of cage I:cage II methane densities.
We hope this work will encourage some research on melanophlogite as an interestingmaterial for basic studies of guest–host interactions and, possibly, as a means for developingarrays of weakly interacting particles.
Acknowledgments
We gratefully acknowledge S Kohler for making available and preparing the investigatedmelanophlogite samples. One of us (JK) would like to thank the DeutscheForschungsgemeinschaft and the Michael-Jurgen-Leisler-Kiep Stiftung for financial support.MRP was supported, in part, by the ONR Molecular Design Institute N0001498WX20709.
References
[1] Kroto H W, Heath J R, O’Brien S C and Smalley R E 1985 Nature 318 162[2] Kratschmar W, Lamb L D, Fostiropoulos K and Huffman D R 1990 Nature 347 254[3] von Stackelberg M and Muller H R 1954 Z. Elektrochem. 58 25[4] Stucky G D and MacDougall J E 1990 Science 247 669[5] Ozin G A, Kuperman A and Stein A 1989 Angew. Chem. 28 359[6] Wang Y and Herron N 1988 J. Phys. Chem. 92 4988[7] MacDougall J E, Eckert H, Stucky G D, Herron N, Wang Y, Moller K, Bein T and Cox D 1989 J. Am. Chem.
Soc. 111 8006[8] Bogomolov V N, Kholodkevich S V, Romanov S G and Agroskin L S 1981 Solid State Commun. 47 181[9] Ursenbach C U, Madden P A, Stich I and Payne M C 1995 J. Phys. Chem. 99 6697
[10] Sun Q, Ye L and Xie X 1998 Phys. Status Solidi b 207 357[11] Demkov A A and Sankey O F 1997 Phys. Rev. B 56 10 497[12] Kamb B 1965 Science 148 232[13] von Lasaulx A 1876 N. Jb. Mineral. 250
Skinner B J and Appleman D E 1963 Am. Mineral. 48 854[14] Grasselini Troysi M and Orlandi P 1972 Atti Soc. Tosc. Sci. Nat., Mem., Serie A 79 245[15] Zak L 1967 Am. Mineral. 57 779[16] Cooper J F Jr and Dunning G E 1972 Am. Mineral. 57 1494[17] Kropatsheva S K and Markov J J 1975 Dokl. Akad. Nauk 224 905[18] Giess H, Gerke H and Liebau F 1982 N. Jb. Mineral. Mh. 3 119[19] Jackson K A and Pederson M R 1990 Phys. Rev. B 42 3276
Pederson M R and Jackson K A 1991 Phys. Rev. B 43 7312Pederson M R and Jackson K A 1991 Density Functional Methods in Chemistry ed J K Labanowski and
J W Andzelm (Berlin: Springer)[20] Perdew J P and Zunger A 1981 Phys. Rev. B 23 5048[21] Porezag D and Pederson M R 1996 Phys. Rev. B 54 7830
97

98
Appendix F
Kortus J., Pederson M. R. andRichardson S. L.
Density functional based prediction of
the electronic, structural and
vibrational properties of the energetic
molecule: Octanitrocubane
Chem. Phys. Lett. 322, 224-230(2000)
99
19 May 2000
Ž .Chemical Physics Letters 322 2000 224–230www.elsevier.nlrlocatercplett
Density functional-based prediction of the electronic, structural,and vibrational properties of the energetic molecule:
octanitrocubane
Jens Kortus a, Mark R. Pederson a,), Steven L. Richardson b
a Center for Computational Materials Science, Code 6390, NaÕal Research Laboratory, Washington, DC 20375, USAb Department of Electrical Engineering and Materials Science Research Center, Howard UniÕersity, Washington, DC 20059, USA
Received 23 February 2000; in final form 30 March 2000
Abstract
We have performed density functional calculations on the recently discovered energetic molecule, octanitrocubaneŽ .C NO . We predict a strongly exothermic dissociation energy and calculate the ionization potentials, electron affinities8 2 8
and vibrational spectra. We predict that the isolated molecule exhibits a symmetry which is higher than that found in thesolid. The vibrational density of states shows strong Raman activity at low frequencies and strong IR intensities at highfrequencies. We identify a low-energy anharmonic mode which is consistent with the experimentally assumed free torsionalrotations of the NO groups about their respective C–N axes. q 2000 Elsevier Science B.V. All rights reserved.2
1. Introduction
High-energy molecules are important not only fortheir obvious technological applications as explo-sives and propellants, but also for their inherentlyinteresting molecular properties. One such example
Ž .is the well-known molecule cubane C H , which8 8w xwas first synthesized by Eaton and Cole 1 . Cubane
w xhas been extensively studied 2,3 because of theenormous strain energy due to the distortion of itsC–C–C bond angle to 908.
It has been suggested that cubane can be mademore energetic by replacing its H atoms with nitroŽ . w x w xNO groups 4,5 . In fact, Zhang et al. 6 have2
) Corresponding author. Fax: q1-202-404-7546; e-mail:[email protected]
Ž .recently synthesized octanitrocubane cf. Fig. 1where all the hydrogen atoms have been replaced bynitro groups. Octanitrocubane has been speculated tobe even more energetic than the N-nitro compoundHMX, which is one of the most energetic substancesknown.
In this Letter, we present an ab initio calculationof the optimized geometry of octanitrocubane, itsmolecular orbital energies and vibrational spectra.We show that the molecule, while stable, allows forlarge torsional displacements of the nitro groups andwould release large amounts of energy upon dissoci-ation into molecular N and CO . Because octani-2 2trocubane is significantly more electronegative thancubane, there is the possibility of cation inducedstabilization of the crystal through selective doping.The infrared and Raman spectra calculated hereshould be useful in determining the presence of
0009-2614r00r$ - see front matter q 2000 Elsevier Science B.V. All rights reserved.Ž .PII: S0009-2614 00 00425-5
100
( )J. Kortus et al.rChemical Physics Letters 322 2000 224–230 225
Fig. 1. Optimized molecular structure of octanitrocubane. Thecarbon atoms form a cube to which the nitro groups are connectedat the corners. The dark balls are the oxygen atoms. The arrowspoint in the direction of the quartic concerted torsional mode thatis discussed in this Letter.
octanitrocubane and in confirming the symmetrylowering which apparently occurs in the solid struc-ture. Further, one of the very soft torsional modesexhibits strong anharmonicity and is fundamentallyinteresting.
2. Calculational details
w xOur density functional-based calculations 7,8were performed with the all-electron Gaussian-
w xorbital-based NRLMOL program 9,10 , using theŽ .Perdew–Burke–Ernzerhof PBE generalized-gradi-
ent approximation for the exchange and correlationw xfunctional 11 . For each oxygen, nitrogen and car-
bon atom, we use nine s-type contracted functions,four p-type contracted Gaussians and 3 d-type con-tracted Gaussians. For carbon the contracted basis setis constructed from a total of 12 bare Gaussians,while for oxygen and nitrogen the contracted basissets were constructed from a total of 13 bare Gauss-ians. The decay constants were optimized for den-sity-functional applications and range between 2.22=104 and 0.0772 for carbon, 5.18=104 and 0.0941for nitrogen, and 6.12=104 and 0.1049 for oxygen.
The contraction coefficients and decay constants areavailable electronically upon request and a discus-sion of the method used for determining these quan-
w xtities appears in Ref. 12 . To determine the opti-mized geometries, we first solve the all-electronSchrodinger wave equation to find the self-consistent¨Kohn–Sham orbitals. Once these are obtained theHellmann–Feynman–Pulay forces are determinedand used in conjunction with the conjugate-gradient
walgorithm to optimize the molecular geometry 13–x15 . This process is iterated until the forces on each
˚atom are smaller than 0.01 eVrA. Given the equilib-rium geometry, we determine the vibrational fre-quencies, infrared spectrum and Raman spectra using
w xthe method discussed in Ref. 16 . Since we gener-ally use symmetry to optimize our molecular geome-tries, the determination of the harmonic vibrationalfrequencies tells us if we are at a local minimum. Ifimaginary frequencies are found, the symmetry isreduced and we repeat the calculation until we aresatisfied that we have found a symmetry that islocally stable.
A point of special interest to this molecule is theextremely soft concerted torsional vibrations associ-ated with the NO groups about the C–N bond axes.2For these degrees of freedom it is necessary to gobeyond a harmonic approximation to fully under-stand their dynamics. We will discuss this furtherwhen we come to the problem.
To place our calculated vibrational spectra ofoctanitrocubane in the proper context, we note that
Ž .there have been several Hartree–Fock HF basedand density functional-based calculations on the vi-
w xbrational spectra of cubane 17–20 . Here we brieflycompare the structural properties and IR spectra ofcubane, as calculated with NRLMOL and the PBEdensity functional, to the DFT-based results of Mi-
w xaskiewicz and Smith 20 .The PBE density functional should perform simi-
larly as the BLYP density functional, which also is agradient corrected density functional, but does notinclude a HF part as in the case of the hybridB3LYP.
˚The C–C bond length of 1.5714 A obtained fromour geometry optimization of cubane with O sym-h
˚Ž .metry falls between the BLYP 1.5833 A and˚Ž .B3LYP 1.5701 A results, and compares favorably
with the experimental C–C bond lengths of 1.5708–
101

( )J. Kortus et al.rChemical Physics Letters 322 2000 224–230226
Table 1Calculated frequencies and IR intensities of the three IR active modes of cubane. All frequencies given are unscaled. The results from thiswork are given under PBE.
y1Ž . Ž .IR frequency cm IR intensity kmrmol
Exp. BLYP PBE BLYP B3LYP PBE
852 839 849 4.7 6.1 9.31235 1239 1223 1.1 1.9 5.92990 3034 3033 165 140 137.5
w x w xThe experimental values are given in Ref. 24 . The BLYP and B3LYP results are from Ref. 20 .
˚ w x1.571 A obtained from microwave spectroscopy 21w xand electron diffraction experiments 22 respec-˚tively. The C–H bond length of 1.0954 A agrees also
˚Ž . Ž .˚well with BLYP 1.0995 A , B3LYP 1.0914 A and˚ ˚w xthe experimental values of 1.098 A 22 or 1.097 A
w x w x21 . Miaskiewicz and Smith 20 have also calcu-lated IR intensities for cubane. In Table 1 we com-pare our results for the frequencies and IR intensitiesfor the three IR active modes with the previous DFTcalculations on cubane.
The agreement among the various DFT and exper-imentally determined IR spectra is similar to what
w xwould be expected from previous DFT results 23 .Especially for the purpose of predicting experimentalIR signatures of the cubane molecule the agreementamong the PBE, BLYP and B3LYP is quite satisfac-tory. The qualitative strengths of the three modesshow the same orderings for all three calculations.For a detailed discussion of basis-set and exchange-correlation dependencies in experimentally well un-
w xderstood molecules the reader is referred to Ref. 16 .w xBased on their calculations, Cole et al. 24 propose a
semi-quantitative description of the IR bands at 852and 1235 cmy1 as strong, and describe the IR modeat 2990 cmy1 as very strong. This description isreproduced by all of the calculations. The overallgood agreement among our PBE density-functionalresults, other DFT calculations, and experimentalresults for cubane gives one confidence that themethod will provide similar accuracy for describingoctanitrocubane.
3. Results and discussions
Pictured in Fig. 1 is the equilibrium structure ofthe octanitrocubane molecule. The structure has two
inequivalent carbon atoms, two inequivalent nitrogenatoms and three inequivalent oxygen atoms. Theoverall symmetry of the molecule is determined by agroup of order 8 that is generated from the symmetry
Ž . Ž . Ž . Žoperations X,Y,Z % Y, X,Z , X,Y,Z % yX,y. Ž . Ž .Y,Z and X,Y,Z % yX,Y,yZ . With respect to 4
N molecules and 8 CO molecules we find that this2 2molecule is bound by 798 kcal moly1 which is ingood agreement with the MINDOr3 calculations of
w x y1Owens 25 of 761 kcal mol . We find that thismolecule has an electron affinity of 3.43 eV and anionization energy of 10.54 eV.
To address the question of local stability of thismolecule we have performed a vibrational analysisof this cluster using the methodology discussed in
w xRefs. 16,26 . Interestingly, at the harmonic level wefind a total of eighty-nine real frequencies and seÕenzero-frequency modes. While six of the zero-frequency modes correspond to the usual rotationaland translational modes, the seventh zero-frequencyharmonic mode requires a more in-depth discussion.We start by noting that the harmonic analysis showsthat this mode is entirely associated with torsionalrotations of pairs of oxygen atoms about their respec-tive C–N bonds. For reasons that will become clearshortly, we refer to this mode as the quartic con-
Ž .certed torsional mode QCTM throughout the re-mainder of the discussion.
Pictured in Fig. 1 are arrows on each of the 16oxygen atoms which designate the displacement ofthe QCTM. For the equilibrium geometry, the nitrogroups on opposite corners of the cube arrange them-selves in a staggered configuration and the QCTMmode acts to preserve this staggered structure. There-fore we expect steric interactions between opposingnitro groups to remain unchanged by a QCTM dis-placement. Since the primary interactions between
102
( )J. Kortus et al.rChemical Physics Letters 322 2000 224–230 227
oxygen atoms are mediated by pair repulsions, it isworthwhile to determine how the second-order en-ergy changes if only pair interactions between theoxygen atoms are assumed. For this case we find thatthe second-order energy change is exactly zero forany pair potential for the QCTM, shown in Fig. 1.Finally, we note that we have performed frozenvibron calculations for both the energy and the forceas a function of the QCTM displacement and theresulting potential energy curve is shown in Fig. 2. Adetailed analysis of both the energy and forces as afunction of the QCTM displacement confirms thatthat the second derivative and all odd derivatives ofthis mode vanish identically.
In addition to the classical potential observed bythe torsional mode, we have determined the anhar-monic vibrational wavefunctions and energies asso-ciated with this mode and present the results in Fig.2. Because of the quartic nature of the potentials, theanharmonic wavefunctions are flatter than whatwould be expected from a harmonic oscillator poten-tial. The zero point energy associated with this modeis found to be 16.4 cmy1 and the first excited state isfound to be 58.5 cmy1, suggesting that the lowestobservable excitation would be observed at 42 cmy1.As discussed below, our calculations show that thisstate exhibits weak Raman coupling. Because this
Fig. 2. Potential as a function of vibrational displacement ob-served by the QCTM. Also included are the squares of the lowesteigenmodes of this predominantly quartic potential. The energyintercepts of the eigenmodes are shifted by their respective ener-gies which shows a zero point energy of 16 cmy1 and a lowestexcitation energy of 42 cmy1 .
Fig. 3. The upper panel shows the calculated vibrational density ofŽ .states VDOS of octanitrocubane. The middle and lower panels
display the calculated IR and Raman spectra which are shown inarbitrary units.
mode is anharmonic, it might be detected by lookingfor second-harmonic generation in the Raman spec-tra which, according to our calculations, should oc-cur at 102.1 cmy1. Unfortunately, as discussed be-low, there are other strong Raman active modeswhich appear at both of these energies. The effectivemass of this state is 15.99534 amu which againconfirms that this state is associated entirely with themotion of oxygen atoms.
Since the potential associated with the QCTM isconvex and since all other harmonic modes exhibitreal frequencies, the symmetry of the molecule stud-ied here corresponds to a locally stable geometry forthe free molecule. To address the question of globalstability we have performed calculations on twoother reasonable symmetries of the molecule andhave found that these symmetries lead to higher
w xenergies. In the solid phase, Zhang et al. 6 havedetermined the structure from X-ray measurements.The unit cell consists of four molecules which arerelated to one another by inversion and translations
1 1Ž .by , ,0 lattice vectors. As an isolated molecule,2 2
each octanitrocubane molecule has a two-fold sym-metry which means it has a lower symmetry than ourequilibrium structure shown in Fig. 1. We havedetermined, that the experimental structure of theisolated molecule is higher in energy than our calcu-lated structure. Furthermore, the molecule relaxes
103

( )J. Kortus et al.rChemical Physics Letters 322 2000 224–230228
without encountering a barrier to our equilibriumstructure. This result strongly suggests that the ge-ometry shown in Fig. 1 is the ground state geometryfor the isolated molecule and that symmetry lower-ing in the crystal is due to intermolecular interac-tions.
We now discuss the harmonic modes that havespectroscopically interesting features. The calculatedvibrational density of states is shown in the upperpanel of Fig. 3. The middle and lower panels show acalculated overview of the IR spectra and Ramanspectra. The IR and Raman spectra are given inarbitrary units.
3.1. Raman spectra
Because O, N and C have similar masses andform similar bonds the vibrational spectrum is gener-ally associated with complicated coupled movementsof all atoms in the molecule. However at very low
Ž y1 .energies below 131 cm the vibrations are associ-ated primarily with oxygen motion and in the 970–1157 cmy1 energy range the motion is associatedprimarily with carbon atoms. Also at very high
Ž y1 .energies 1283 cm and higher the carbon atomsare essentially stationary and the vibrational dis-placements are associated entirely with N and Omotions. From the vibrational density of states wedetermine the zero point energy of the molecule tobe 3.84 eV. At approximately 41 cmy1 there is adoubly degenerate Raman active mode that is associ-ated primarily with torsional oxygen vibrations. Be-cause this mode is two-fold degenerate and becauseit is nearly degenerate with the one-fold QCTMsome interesting changes in the peak positions areexpected to occur in this region as a function oftemperature, symmetry lowering, and changes incharge state. At 258 cmy1 there is a two-fold statethat leads to a reasonably strong Raman peak whichis just below a very strong one-fold Raman activestate at 276 cmy1. These modes are primarily associ-ated with C–N and C–C stretching. Since the molec-ular polarizability is roughly proportional to the vol-ume, the strong Raman activity of these states isunderstood by noting that as the C–N and C–Cstretches occur the size of the molecule and effectivepolarizability change during the vibration. Indeed,the Raman mode at 276 cmy1 is a breathing mode of
octanitrocubane. At 815 cmy1 a one-fold mode leadsto strong Raman activity. This Raman mode is asso-ciated with a collective breathing of the C and Natoms together with a O–N–O bending of the oxy-gens. At 1327 cmy1 there is another strong Ramanpeak, which is associated with breathing of the Natoms. In this case the C atoms are predominantlystationary and the oxygen atoms beat against thenitrogen atoms, as the nitrogen breaths outward.Finally, at 1583 and 1589 cmy1 there is strongRaman activity associated with two modes. In eachcase only 4 nitrogen atoms take part, with the Natoms wagging in the plane defined by the nearestneighbor carbon and oxygen atoms. The N atomsbeat against the oxygen atoms and the carbons arefixed.
If one of the 14 N atoms is replaced by a 15N atomthe Raman active peaks shift only by a small amountŽ y1 .from 1 to 5 cm , but replacing all nitrogens bytheir heavier isotope the modes at 815, 1327 and1589 cmy1 shift by approximately 7.5, 19 and 36cmy1, respectively.
3.2. Infrared spectra
The IR spectrum shows four main peaks each ofwhich is composed of a doubly degenerate mode anda singly degenerate mode. This is similar to thesplitting of the threefold degenerate T IR active1umodes in cubane.
At 832 cmy1 there is a doubly degenerate IRmode which is nearly degenerate with a one-fold at835 cmy1. These modes are primarily associatedwith a C–N stretching motion of the NO groups2and some bending of the oxygens. At 1143 and 1152cmy1 there are IR active two-fold and one-foldvibrational states which correspond to C–C stretchmodes and stationary nitro groups.
Because the NO groups are not rigid spheres2other very strong IR active modes also appear. At1299 and 1300 cmy1 there are one-fold and two-foldvery strong IR active modes, which correspond to aC–N stretch due to N atom motion, with the oxygenatoms beating against the N atoms. The highestfrequency IR active mode is a two-fold degeneratestate at 1576 cmy1 and a one-fold state at 1591cmy1. This mode is associated with a wagging mo-
104
( )J. Kortus et al.rChemical Physics Letters 322 2000 224–230 229
Fig. 4. Isodensity surface of the highest occupied molecularŽ .orbital HOMO for octanitrocubane. The energy of the HOMO
level is y8.60 eV.
tion of the N atoms beating against the oxygen atomsand stationary C atoms.
3.3. Electronic structure
Pictured in Fig. 4 is the square of the wavefunc-tion for the HOMO level. Both the HOMO andLUMO levels are two-fold degenerate, suggestingthat small changes in charge state could lead tominor Jahn–Teller distortions followed by symmetryreduction that would be primarily mediated bymovements of the oxygen atoms. From Fig. 4 it isalso apparent that the HOMO level participates inC–C covalent bonding and that removal of an elec-tron from this state could weaken the skeletal frame-
Ž .work. Examination of the LUMO level y5.35 eVshows that the addition of an electron to the moleculeintroduces antibonding states which may also act toreduce the C–C covalent bonding. The electron
Ž .affinity of octanitrocubane 3.43 eV is very largeŽ .compared to cubane 1.5 eV and is even larger than
Žthat of the C molecule 2.74 eV GGA and experi-60.ment . In analogy to the fullerene in the alkali-doped
fullerene crystals, the octanitrocubane molecule willact as an electron acceptor and Madelung inducedstabilization of a solid phase of octanitrocubane could
be accomplished by doping the solid phase withalkali atoms or other electron donors. However, theHOMO and LUMO levels show that such a stabiliza-tion would only be accomplished at the cost ofdestabilizing the octanitrocubane framework and thiscould lead an overly reactive solid.
Acknowledgements
J.K. and M.R.P. were supported in part by ONRGrant N0001498WX20709. S.L.R. acknowledgessupport from the US Navy–American Society for
Ž .Engineering Education ASEE Faculty SabbaticalLeave and Summer Research Programs. We wouldlike to thank Dr. Gilardi for critically reading theoriginal manuscript.
References
w x Ž .1 P.E. Eaton, T.W. Cole Jr., J. Am. Chem. Soc. 86 19643158.
w x2 T. Yildirim, P.M. Gehring, D.A. Neuman, P.E. Eaton, T.Ž .Emrick, Phys. Rev. Lett. 78 1997 4938.
w x Ž .3 S.L. Richardson, J.L. Martins, Phys. Rev. B 58 199815307.
w x4 P.C. Hariharan, J.J. Kaufman, A.H. Lowrey, R.S. Miller, Int.Ž .J. Quantum Chem. 28 1985 39.
w x5 D.A. Chapman, J.J. Kaufman, R.J. Buenker, Int. J. QuantumŽ .Chem. 1 1991 389.
w x6 M.-X. Zhang, P.E. Eaton, R. Gilardi, Angew. Chem. Int. Ed.Ž .39 2000 401.
w x Ž .7 P. Hohenberg, W. Kohn, Phys. Rev. 136 1964 B864.w x Ž .8 W. Kohn, L.J. Sham, Phys. Rev. 140 1965 A1133.w x Ž .9 M.R. Pederson, K.A. Jackson, Phys. Rev. B 41 1990 7453.w x Ž .10 K.A. Jackson, M.R. Pederson, Phys. Rev. B 42 1990 3276.w x11 J.P. Perdew, K. Burke, M. Ernzerhof, Phys. Rev. Lett. 77
Ž .1996 3865.w x Ž .12 D. Porezag, M.R. Pederson, Phys. Rev. A 60 1999 2840.w x13 H. Hellmann, Einfuhrung in die Quantentheorie, Deuticke,¨
Leipzig 1937.w x Ž .14 R.P. Feynman, Phys. Rev. 56 1939 340.w x Ž .15 P. Pulay, Mol. Phys. 17 1969 197.w x Ž .16 D.V. Porezag, M.R. Pederson, Phys. Rev. B 54 1996 7830.w x Ž .17 J. Almlof, T. Jonvik, Chem. Phys. Lett. 92 1982 267.¨w x18 C.P. Vlahacos, H.F. Hameka, J.O. Jensen, Chem. Phys. Lett.
Ž .259 1996 283.w x Ž .19 B.S. Jursic, J. Mol. Struct. 394 1997 15.w x Ž .20 K. Miaskiewicz, D.A. Smith, Chem. Phys. Lett. 270 1997
376.
105
( )J. Kortus et al.rChemical Physics Letters 322 2000 224–230230
w x21 E. Hirota, Y. Endo, M. Fujitake, E.W. Della, P.E. Pigou, J.S.Ž .Chickos, J. Mol. Struct. 190 1988 235.
w x22 L. Hedberg, K. Hedberg, P.E. Eaton, N. Nodari, A.G. Robi-Ž .ette, J. Am. Chem. Soc. 113 1991 1514.
w x23 D.C. Patton, D.V. Porezag, M.R. Pederson, Phys. Rev. B 55Ž .1997 7454.
w x24 T.W. Cole, J. Perkins, S. Putnam, P.W. Pakes, H.L. Strauss,Ž .J. Phys. Chem. 85 1981 2185.
w x Ž .25 F.J. Owens, J. Mol. Struct. 460 1999 137.w x26 A.A. Quong, M.R. Pederson, J.L. Feldman, Solid State Com-
Ž .mun. 87 1993 535.
106

Appendix G
Kortus J., Richardson S. L. andPederson M. R.
First-Principles DFT study of the
structural, electronic and vibrational
properties of azidopentazole
Chem. Phys. Lett. 340, 565-570(2001)
107
�������������� �� ����� �� ��� ��������� ������� ���
���������� ���������� �� �������������
���� ������ ���� ���� �� ������� ��!� "����� #� ���������
� ���������� �� ����� �������� ��������� � ���������� �� ������ ���� ������ � ���������� !������ � �������� �"� #$%�� &��� '������� (�)���� � ���������� �� ��$��� ���
���������� * ������� *���������� ��" !������ � ������� '������� ������� +���" ��������� � ���������� �� ����%� ���
������� $% ������� $&&�' �� (�� ���) * +��� $&&�
��������
,� ���� #����� -� ������ � ������� �������� �������� ������� �� ��� �������� ��� ������� ���������� �� ���
��������.�� ��.������.� )����� ������������� �/0�� 1� ���� ��� ������)�� � ���������� ������� �� �����)���
��� ,� ��� ��)�� ������� 2�� ������ .��)����� ���������� ��� ���������� ���3������ ��� �� .��� �.���)���
-��� �������� �� ������ ��� ������� �������� ��������� �� -����� ,� )���� ���- � ��4����� ������� �������. ����
��������� ��������� 1� ��� ������ ������ ��)�� ����������� ��� �������������� � $&&� 5������ "���� 6�7� +
��.��� ���������
� ���� ������
+������������ �/0� �� � ��������.�� ��.��
����.� )���� -���� �������� .��)���� ��
����������� �� � (���)�)����� ���. -��� �
���������) �����.�� ��� 8�� ��.� �9� 1��� ����
)���� ��� ��� ��� ���� ������������ ����� ����
���� � ��)��� �� ��������� �������� �� ���
��������� �� ��� ������� ��� �������� �������
���� �� �������������� ,� ��������� :���������
�� �� ;�< ���� ������)�� ��.� ��� �� ������ )��
���� ������ ��� ������� �������� ������
8�� 9 ������� �� � ��)��� �� ���)��� �� /0 ���
���� �����)���� ���� ������������� -��� =�
��))���� �� ��� )��� ����� /0 ���)��� /.����
��� >� ;$< ���� �������� �� ������ )����� ���
���� ������ �������� �� ��� 3������� ��(.��
������ ���������� ;?=,"�8 9@%�A�:8�9< ���
����������� ;8=="�8 9@�B 9< ���� �� ������
��� ���� ��� ������ ���� ������������� �� ���
)��� ����� �� ��� /0 ���)����
+ ��)��� �� -������ ������.� =���. �� ��
;A<� :�.����� �� �� ;C�*<� ��� ������ �� �� ;%< ����
������� ��.��� ����� �����.� ������������� ��
)�� �-�� �� ����.� ���� ��� ��� ���)�� /0 ;D�0<
������������� )�.�� ��� �� ���� ����� �� � ��.��
����.� ��������.�� )���� ������ �� ��� �-
���)�������� ������� �� )����� �����.���
������� ���� ������� �)������� �� ��� ��.����)
��������� -� ��� ������ ���� ������������� �� �
������� �������� ��� � ���� ��������.�� )���
��� ������� �� �.�� �� ��� ��-� ��������� /�*
����� �� =������� �� �� ;E<� 1� ������ �� ���� #�����
� (������������ �������� ������� ��������
0 ���� $&&�
=��)�� ����� #������ AC& 8$&&�9 *%*F*D&
---����������@����@����
!=�����������. ������� ��GH I��$&$�C&C�D*C%�
*,��� �""������- ��������J�������������)� 8���� ��
������9� ��J�)������)�����-������� 8"�#� ���������9�� ������ �������H � , ���� ������������������.� ������
0&&%%*� ��D&*&% "����.���� :��)����
&&&E�$%�C@&�@K � ��� ����� )����� � $&&� 5������ "���� 6�7� + ��.��� ���������
,,H " & & & E � $ % � C 8 & � 9 & & C � C � %
108
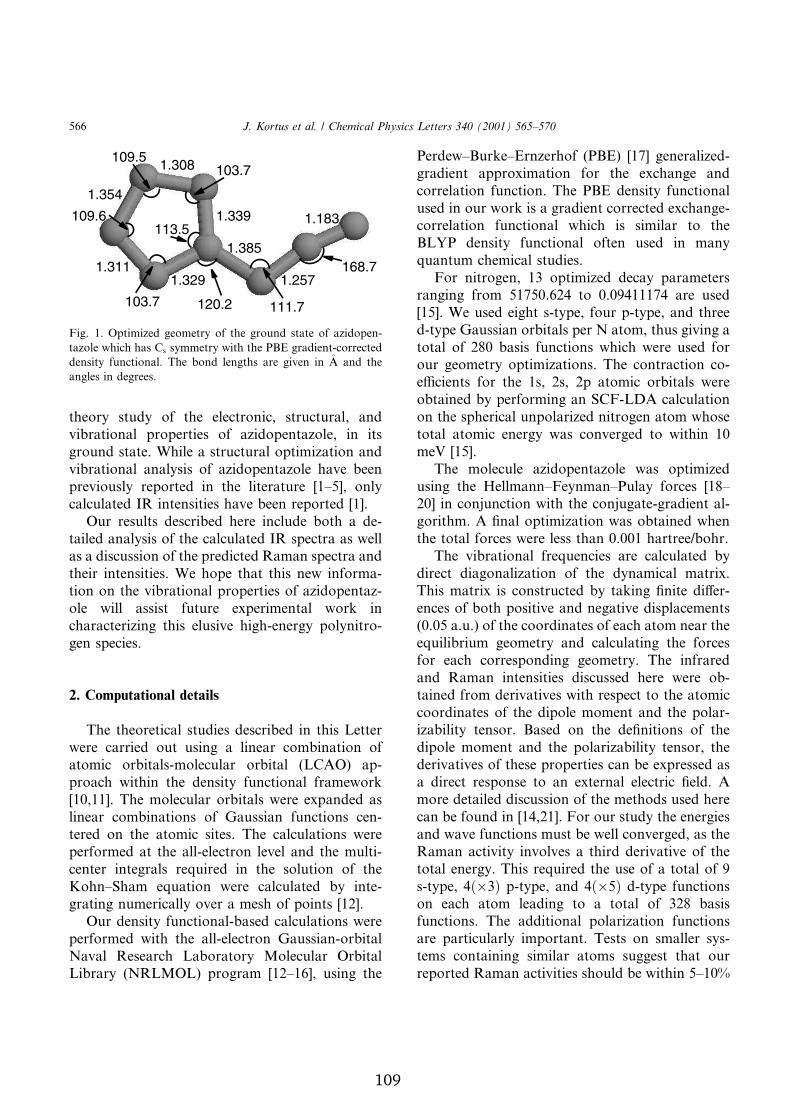
������ ����� �� ��� �������� ��������� ���
���������� ���������� �� �������������� �� ���
.����� ������ 1��� � �������� ����)������� ���
���������� ������� �� ������������� ���� ����
��������� �������� �� ��� ��������� ;�F*<� ���
������ ,� ����������� ���� ���� �������� ;�<�
2�� ������ �������� ���� ����� ���� � ���
����� ������� �� ��� ������ ,� ������ �� -�
�� � ��������� �� ��� �������� ��)�� ������ ���
����� ������������ 1� ���� ���� ���� ��- �����)��
���� �� ��� ���������� ���������� �� ������������
�� -� ������ ������ �G����)���� -��� ��
�����������. ���� ������ ��.������.� ���������
.�� �������
� ������������� ������
�� ��������� ������� �������� �� ���� #�����
-��� ������ ��� ����. � ����� �)�������� ��
���)� ��������)����� ������ 8#=+29 ���
����� -����� ��� ������� �������� ���)�-���
;�&���<� �� )����� ������� -��� �G������ ��
����� �)��������� �� :������� �������� ���
����� �� ��� ���)� ������ �� �������� -���
������)�� �� ��� �������� ��� ��� ��� )����
����� ����.��� ��3����� �� ��� ������� �� ���
����F"��) �3������ -��� ������ �� �����
.�����. ��)����� ���� � )��� �� ������ ;�$<�
2�� ������� �������������� �������� -���
������)�� -��� ��� �������� :��������������
/��� ������� #��������� ������ 2�����
#������ 8/�#�2#9 ���.��) ;�$F�%<� ����. ���
����-F6����F5�������� 8 659 ;�D< .����������
.������� �����G�)����� ��� ��� �G���.� ���
��������� �������� �� 65 ������� ��������
���� �� ��� -��� �� � .������� ������� �G���.��
��������� �������� -��� �� ��)��� �� ���
6#L ������� �������� ����� ���� �� )���
3�����) ��)�� ��������
��� �����.��� �A ����)���� ���� ����)�����
���.��. ���) *�D*&�%$C �� &�&EC���DC ��� ����
;�*<� 1� ���� ��.�� ������� ���� ������� ��� �����
������ :������� ������� ��� / ���)� ���� .����. �
���� �� $0& ����� �������� -��� -��� ���� ���
��� .��)���� ����)��������� �� ��������� ��
�M����� ��� ��� ��� $�� $� ���)� ������� -���
�������� �� ������)��. �� "=��#�+ �������
�� ��� ������� ���������� �����.�� ���) -����
���� ���)� ����.� -�� �����.�� �� -����� �&
)�7 ;�*<�
�� )���� ������������� -�� ����)����
����. ��� >�)���F����)��F ��� ����� ;�0F
$&< �� ��N������ -��� ��� ��N�.����.������� ��
.�����)� + (�� ����)������� -�� �������� -���
��� ���� ����� -��� ��� ���� &�&&� �������@�����
�� ���������� ���3������ ��� ������ ��
����� ���.���������� �� ��� ����)�� )����G�
��� )����G �� ��������� �� �����. (���� ��4���
���� �� ���� �������� ��� ��.����� ������)����
8&�&* ����9 �� ��� ���������� �� ��� ���) ���� ���
�3�������) .��)���� ��� ������. ��� �����
��� ��� �����������. .��)����� �� ��������
��� ��)�� ����������� �������� ���� -��� ���
������ ���) ����������� -��� ������ �� ��� ���)�
���������� �� ��� ����� )�)��� ��� ��� �����
�������� ������� 6���� �� ��� ��(������� �� ���
����� )�)��� ��� ��� ������������ ������� ���
����������� �� ����� ���������� �� �� �G������� ��
� ����� �������� �� �� �G����� ����� (��� +
)��� ������� ��������� �� ��� )������ ���� ����
�� �� ����� �� ;�C�$�<� ��� ��� ����� ��� ����.���
��� -��� �������� )��� �� -� �����.��� �� ���
��)�� ������� ������� � ����� ���������� �� ���
���� ����.�� ��� ��3����� ��� ��� �� � ���� �� E
������� C��A� ������� ��� C��*� ������ ���������� ��� ���) �����. �� � ���� �� A$0 �����
��������� �� ��������� ����������� ��������
��� ��������� �)�������� ���� �� �)��� ����
��)� ��������. ��)��� ���)� ��..��� ���� ���
�������� ��)�� ��������� ����� �� -����� *F�&O
��.� �� 2���)���� .��)���� �� ��� .����� ����� �� ���������
����� -��� ��� =� ��))���� -��� ��� 65 .���������������
������� ��������� �� ���� ��.��� ��� .���� �� �+ ��� ���
��.�� �� ��.�����
*%% ./ 0���� �� � / 1 ������� �� ���� (������ $2� 3���45 �#�6���
109
�� ��� ������ �������� �4������ ����. ��� ���.�
:��������� ;�C< �� ��� �� )��� ���.� :��������
�� � ���)� ��-� ��� �� �� ���� ������� )�)�
��� �4�� �� �G���� ����� �������� -��� ��.���
��.��� )�)����)�
� ������� �� ���������
$/4/ ������ �����7����
1� ���� ��))������ �� ��.� � ��� ������ �� ���
.��)���� ����)������� -����� ��� .�����������
����� 65 ���������������� ��������� 2��
������ ���� ��.��� ��� ���� ��.�� ���
-����� &�� �+ ��� ��� ����������� �� ��� 6A#L @
%�A�:� ������ �� :��������� �� �� ��� �G����
�.���)��� �� �� ���� �� � ������� ���� �� ��� ��
���� �� ��� 65 �������� ���� �� ��� -��� ��
�)������� �� ��� )��� �))��� ���� ����
������ �� 3�����) ��)������
$/�/ * ������� ���������
,� ���- �� ������� ���������� ��� ��.������.�
)������� ���� ����.� �������� ������ �����
�����)������ ��� � �)����� ��� ���� ����.� ��
������������� �� ��� ���.� ������ 2����))����
/0������ ����������� ��� ��� �$�F��))����
��������������� �������� -� ������ �� ��� �
��� ���� ����� ������� ���� ����.��� ��&� ���
������ ���) ��� ���������� ���3������ �� ���
���)��� �����G�)������
�� ���.�������� ������������ �� ������
����� ����.�� �� ��� ��.�� �������� ��������
��� ����� �=0>0� ;$A<� �� ���� ��.� �� ����.�� ,���� ��� ��) �� ��� ���� ����.��� �� ��� ���� ����
/�A ��� /�
* � -��� ���� ���� ���� �G����)�����
�������� ;E< ��� ��� �� ���� �� ��������� ���
���������� �� �-�� ���� ���� �� ������������
-��� )���� � ��������� ���) ����� ���� �������
2�������������� ��������. �� �-� (���)�)�
����� ���.� ����� ��.����� 8��� ��.� $9� -�� �����
�� �� ��� �-��� ����.� �������� �� � ����� �� ���
/0 ���)��� �� :�.����� �� �� ;$$<' ��-����� ����
���������� -�� ��� ������ �� ���� ������ ,�
�.���)��� -��� ����� ��������� ���������� ;��$<
-� (�� ���� ������������� �� �-�� �� ����.� ����
��������������� 6��� �� ����� ���)��� ��� ��.�
��(���� �-�� �� ����.� ���� ��� ��) �� ��� ����
����� -��� ��� ����� ���� ��� � ������� ����
�������
+������ ����������. ����.� ��� �� ��� ����.�
��� ���)�������� �� )����� �����.��� ������
� �� ����� ���)��� -� )��� ���� ���)���� ����
��� )�� )��� ����� )����� �����.��� ,�
���� -��� �������� -��� ;�< -� (�� ���� ���
������� ����.� 8���� ����� �������9 ��� ���)�
�������� �� ������������� �� ���� /$ )����� ��
�D$ ��@)� ��� ��� 65 ������� ���������
��.� A ���-� ��� �3���� �� ��� -��� ������� ���
��� ��.���� ������ )����� ������ 8>2�29 ��
������������� -��� ��� �� ����.� �� �D�% �7� ,�
�� �������� ���� ��� >2�2 ����������� �� ���
������ /F/ ������.� ��������� ��)����. ��
������ ���) ���� ��� -� -����� ��� ������.�
�� ������ ���������� �������� �� �&�E �7� "�)��
���� ��.� C ���-� ��� �3���� �� ��� -��� �������
��� ��� �-��� �������� )����� ������
8#P�29 ��� ������������� -��� ��� �� ����.�
�� �C��A% �7� +� �G������ ������� -� �� ��
����� �� ��� ���� ��� �� ��� )����� �� ��
����� ������ �M���� �� ��� &�%A �7 �� ������
�)�� ��� )���� ������� �����. -��� ���� ���
�)�� �� ����.� �� ��� ���������� �������
������� ��M�� ��� � ������������ �� � ����
��� �
��� .����� ����� ����.��� * ��� ���� ����� ������� ����.��� �& �� ���)� ����� 8����9 ��� ������ /0 ���)��� ������ �� ����� -���
* �& ���& �C/$�
/�A ��%C��CC0* ��%C��A*0%
/�* �$DA��AD$D �$DA���D*%
2���������� �2�� �CAD�$�&�C �CAD��D0�A AEA�$
2������������� ��$�� �CAD�*CD0& �CAD�*��0$ �0A�0
+������������ �=�� �CAD�*%**& �CAD�*A&DD �D��E
���& �� ��� ���� ����� ����.� ������� ������� ����.� �� C/$ )����� �� ��@)��
./ 0���� �� � / 1 ������� �� ���� (������ $2� 3���45 �#�6��� *%D
110
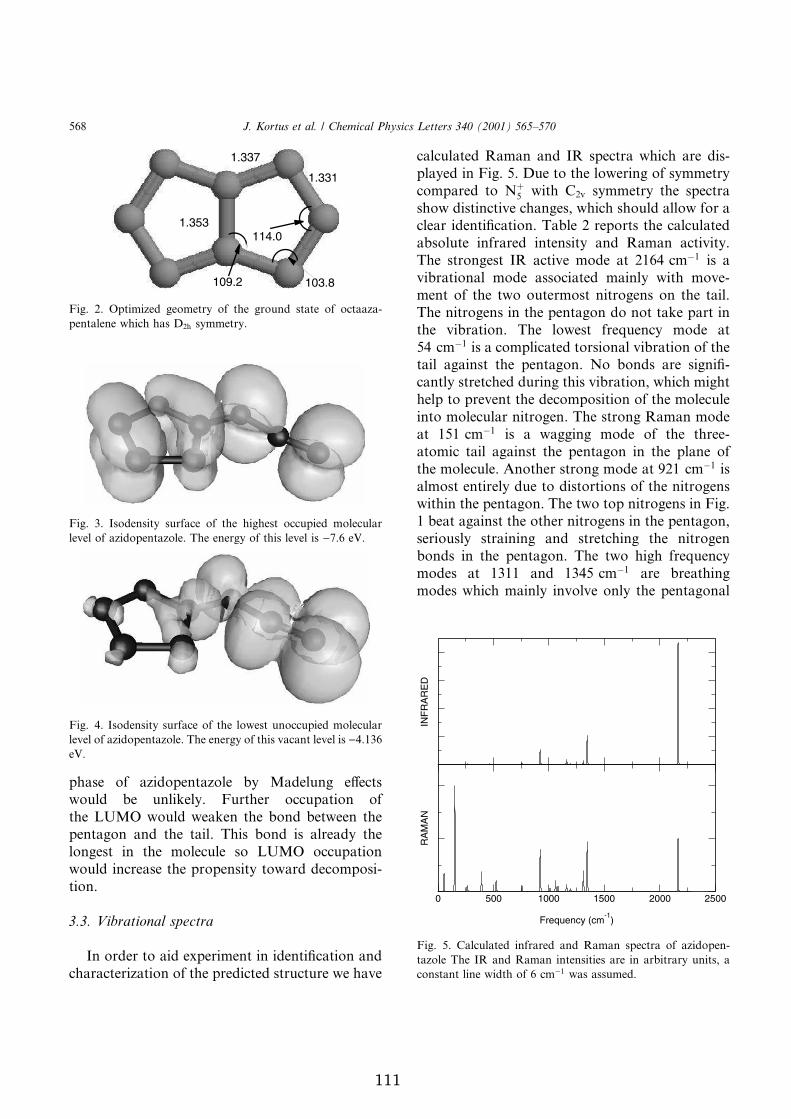
����� �� ������������� �� ������. �4���
-��� �� ������� ������� �������� ��
��� #P�2 -��� -����� ��� ���� ���-��� ���
�����.�� ��� ��� ���� ��� ���� �� ������ ���
��.��� �� ��� )���� �� #P�2 ��������
-��� ������� ��� ���������� ��-��� ���)�����
�����
$/$/ 8�)������ �������
,� ����� �� ��� �G����)��� �� ������(����� ���
�������������� �� ��� �������� �������� -� ����
������ ��)�� ��� ,� ������ -��� ��� ����
����� �� ��.� *� ��� �� ��� �-����. �� ��))����
�)����� �� /�* -��� =$� ��))���� ��� ������
���- ���������� ���.��� -��� ����� ��- ��� �
��� ������(������ ��� $ ������� ��� ������
������� �������� ��������� ��� ��)�� ��������
�� �����.��� ,� ����� )��� �� $�%C )�� �� �
���������� )��� ��������� )���� -��� )����
)��� �� ��� �-� �����)��� �����.��� �� ��� ����
�� �����.��� �� ��� �����.�� �� ��� ���� ���� ��
��� ���������� �� �-��� ���3���� )��� ��
*C )�� �� � �)������ �������� ��������� �� ���
��� �.����� ��� �����.��� /� ����� ��� ��.��(�
���� �������� �����. ���� ���������� -��� )�.��
��� �� ������� ��� ���)�������� �� ��� )����
���� )����� �����.��� �� �����. ��)�� )���
�� �*� )�� �� � -�..��. )��� �� ��� ������
���)� ��� �.����� ��� �����.�� �� ��� ���� ��
��� )����� +������ �����. )��� �� E$� )�� ��
�)��� ������� ��� �� ����������� �� ��� �����.���
-����� ��� �����.��� �� �-� ��� �����.��� �� ��.�
� ���� �.����� ��� ����� �����.��� �� ��� �����.���
�������� ��������. ��� ��������. ��� �����.��
����� �� ��� �����.��� �� �-� ��.� ���3����
)���� �� �A�� ��� �AC* )�� ��� ��������.
)���� -��� )���� ������ ��� ��� �����.���
��.� *� =������ �������� ��� ��)�� ������ �� ���������
����� �� ,� ��� ��)�� ����������� ��� �� ��������� ������ �
������� ��� -���� �� % )�� -�� ����)���
��.� C� ,��������� ������ �� ��� �-��� �������� )�����
��� �� �������������� �� ����.� �� ���� ����� ��� �� �C��A%
�7�
��.� $� 2���)���� .��)���� �� ��� .����� ����� �� �������
�������� -��� ��� �$� ��))�����
��.� A� ,��������� ������ �� ��� ��.���� ������ )�����
��� �� �������������� �� ����.� �� ���� ��� �� �D�% �7�
*%0 ./ 0���� �� � / 1 ������� �� ���� (������ $2� 3���45 �#�6���
111

�����.���� �� �����. ��)�� ������� �� �����
)���� �� �� 3���������� ���������� �� �����.
���� ��� ���� �� )���� ���.�� ��� ����� ������
������ "��� ��� )����� ������������ �� ���.��
����������� �� ��� ���)�� ��� �4����� �������
������ ���.�� ��� ��������� ��� )���� ��� ���
)�� ������ ")� )����� ���������. ���
)���)��� �� ��� �����.�� ���)� ������. �� ���
���������� )���� ��� ������� ���) ��� �������
���� ��3�����
2�� ������ ���������� ���3������ ��� ��
.��� �.���)��� -��� ������ ���) :���������
�� �� ;�< -�� ���� ������ ��� ���)���
���������� ���3������ ��� �������� ����������� ��
��� 6A#L @%�A�:� ��� �� ������� ���� ����
3������ ���.� ���-��� C� ��� $$%D )��� 6���
�������� (�� ��� ��.���� )��� �� �� ���
�����.��� ,� ����� )���� �� ,� ��������� ��
A0C �)@)� .���� �� ���� -��� ;�< �.���� -�
-��� ��� ���� �� A%E�* �)@)�� �� �������
�������. �� ��� �����.�� �� ��� ,� ����� )����
�.���� ��� ��� ��G �����.��� ,� ����� )�����
��-����� ��� ��)���� �.���)��� .��� -����� ,�
�������� ��� ������� ��� ��.��� �����.��� )���
��� ������� ��4������ �� ��� �-� ���������
/���������� ��� �.���)��� �� ��� ��G �����.���
)���� �� ���� �������� ����� .��� ��(�
���� �� ��� ��������� �� ����� ��������� ����
�������� -������ ��� ��������� �� ��� -��� ,�
����� )���� �� ������� ��Q����� �� �����
����� ���� ��� ��)���� �������
� �����������
P���. (������������ �������� ������������
����� �������� -� ���� ������� ��� �����
����� ������� ��� ���������� ���������� �� ���
��� �G����)����� ������ /0 ���)�� ���������
������ ,� �.���)��� -��� ������ -��� -� ����
����� ������������� �� �� ��� )��� ����� /0
���)�� �������� �� ���� �����.� �� ���� ���� �
�- ������� ��� ���)�������� �� )�����
�����.���
+����.� ������������� ��� ��� ��� ���� �G�
����)����� ��������� ����� ���� ���� � ��)���
�� ��.�� ����.��� )����� -��� -��� ���
������� ��� �� �G��� 8��.� =0>0 8�����9 ;$A<�
=0/02�% 8�������������9 ;$C< ��� ��� ����� /�*
;0<9 ��� -��� �������� ������������
2�� ������ ,� ��� ��)�� ������ ������
����� �����)������ -��� -��� �� ������ ��
�������� ������������� �� � ������� ��������� ��
������ ,� �������� �� ��� ���3������ -� ������
,� ��� ��)�� ������������ �� �����.��� ,� )����
��� �� .��� �.���)��� -��� ������ �������� � ���
���� �� ��� ���-��.� �� ��)�� ����������� ����
���� ��������� ��������� "������ �����������
�� ��� ������������� ��)�� )���� -��� �G�
����)����� ��(�) ��� ������� �� ��� )����
��� ��..��� ��������� ���������
1� ���� ���� ���� -��� �������� ��� ����� ���
��� ����������. ��� ��� ������ ������ ���������
������
�������� �������
���� ��� ���� � -��� ��������� �� ���� ��
2/� .���� /&&&�CE01R$&D&E� "�#��� ����-�
��.�� ������� ���) ��� P" /���F+)����� "��
���� ��� 5�.�������. 5������� 8+"559 �����
"������� #���� ��� "�))�� �������
��.��)��
��� $
=������ ���3������� ,� ����������� ��� ��� ���� ��)��
��������. ������� �� �������������
���3������ ,� ��)��
�)��� 8�)@)�9 8�+C@�)�9
*C &�� &�$
�*� &�* D�0
$%C $�% ���
AE$ ��D %��
C%A $�* &��
*$* &�C *�$
%%D &�% &�&
D$D &�& &�&
D** C�% C��
E$� C%�D A%�$
�&&E ��� $�A
�&%& ��D �&�%
�&0$ &�� C�E
��*E �C�* 0�&
��EC *�$ A�$
�A�� ���0 $*�C
�AC* 0E�C %A�A
$�%C A%E�* �&0�D
./ 0���� �� � / 1 ������� �� ���� (������ $2� 3���45 �#�6��� *%E
112
����������
;�< ��/� :���������� >� ����� ����� "������ ,���.� =��)�
A* 8�EE%9 D�$C�
;$< �� � /.����� ��� >�� =��)� 6��� �$E 8�EE%9 ��*D�
;A< :� =���.� ��1� "�)���� ��"� :������ �� ���� =��)�
�&C 8$&&&9 *%CD�
;C< #� :�.������ "� 5���.������ +� 6������������ �� #�����
6�2� ����� ,��� �� ?�����) =��)� DD 8$&&&9 A���
;*< #� :�.������ "� 5���.������ ��2� 1��)���� 6�2� �����
����� =��)� +� ED 8�EED9 �A%�
;%< �� ������� ���� �������� "�#� ���������� ���)����� ���
����������
;D< �5� 5����� +�.�-� =��)� A� 8�EE$9 �C$��
;0< ��+� ���� ��"� 6������ �� "��.��� ,��� �� ?�����) =��)�
"�& 8�ED%9 ��
;E< ��2� =�������� 1�1� 1����� ��+� "������ ��+� 6�����
+�.�-� =��)� ,��� 5�� A0 8�EEE9 $&&C�
;�&< � >�������.� 1� ����� ���� ���� �A% 8�E%C9 60%C�
;��< 1� ����� #��� "��)� ���� ���� �C& 8�E%*9 +��AA�
;�$< ���� �������� ��+� ������� ���� ���� 6 C� 8�EE&9
DC*A�
;�A< ��+� ������� ���� �������� ���� ���� 6 C$ 8�EE&9
A$D%�
;�C< ��7� �����.� ���� �������� ���� ���� 6 *C 8�EE%9
D0A&�
;�*< ��7� �����.� ���� �������� ���� ���� + %& 8�EEE9
E*%%�
;�%< ���� �������� ��7� �����.� �� ������� ��=� ������
���� "���� "�� 8�9 $�D 8$&&&9 �ED�
;�D< �� � ����-� �� 6����� �� 5��������� ���� ���� #���� DD
8�EE%9 A0%*�
;�0< >� >�)���� ��H 5���������. �� ��� ?��������������
�������� #�����.� �EAD�
;�E< �� � ����)��� ���� ���� *% 8�EAE9 AC&�
;$&< � ���� ��� ���� �D 8�E%E9 �ED�
;$�< ���� �������� +�+� ?���.� ��?� 6���.����� ��#� ����
)��� =�)���� ������ "�� $ 8�EEC9 *A%�
;$$< #� :�.������ "� 5���.������ 6�2� ����� ��2� 1��)����
�� ��� "����� 8 �����)�9 C$0 8�EE09 ��
;$A< �5� 5����� �1� =�� ���� �� +)� =��)� "�� 0% 8�E%C9
E%$�
;$C< ���R� B���.� �5� 5������ �� :������ +�.�-� =��)� ,���
5�� AE 8$&&&9 C&��
*D& ./ 0���� �� � / 1 ������� �� ���� (������ $2� 3���45 �#�6���
113

114

Appendix H
Kortus J. and Pederson M. R.
Magnetic and vibrational properties of
the uniaxial Fe &(' O ) cluster
Phys. Rev. B 62, 5755-5759 (2000)
115

116

Magnetic and vibrational properties of the uniaxial Fe13O8 cluster
Jens Kortus and Mark R. PedersonCenter for Computational Materials Science, Code 6390, Naval Research Laboratory, Washington, DC 20375
~Received 29 March 2000!
We have performed all-electron density-functional-based calculations on the recently synthesized iron oxideFe13O8 cluster. The Fe13O8 cluster shows a complicated magnetic structure, with several magnetically stableferro-, ferri-, and antiferromagnetic states. The most stable state is a ferromagnetic state with a total moment of32mB per cluster. We report a systematic investigation of the electronic and magnetic structure of differentmagnetic states. For the most stable ferromagnetic state we calculate the magnetic anisotropy barrier and thecomplete vibrational spectra including IR and Raman intensities from density functional theory.
I. INTRODUCTION
Due to their very interesting magnetic properties, whichare analogous to magnetic metallic nanoparticles, severalmagnetic molecules have received significant experimentalinterest recently. Such molecules include Mn12-acetate andthe octanuclear Fe~III! clusters,1 which have high total spinsand large anisotropy energies, and the layered V15 cluster,2
which has a small net spin. These clusters have been studiedas prototypical systems which exhibit magnetism at thenanoscale. As shown in a series of experiments, theMn12-acetate cluster1 exhibits a magnetic hysteresis andquantum tunneling of the magnetic orientation. Upon appli-cation of well-defined magnetic fields, discontinuities in thehysteresis loops appear, indicating a switching of momentorientation. In 1937 Van Vleck explained that the moment-reorientation temperature is determined by the magnetic an-isotropy energy, which itself is due to relativistic interactionssuch as spin-orbit coupling.3
Understanding and influencing the magnetic anisotropyenergy is one of the challenges in the field of nanoscalemagnets since the magnetic anisotropy energy ultimatelygoverns the potential use of a nanomagnet in informationstorage devices. A short introduction to the technologicalimportance of magnetic nanocrystals for data storage can befound in Ref. 4.
Recently, Wang et al.5 synthesized a new iron oxide clus-ter by reactive laser vaporization. From time of flight massspectra and first-principles calculations5,6 they respectivelyconcluded that this iron oxide cluster consists of 13 iron and8 oxygen atoms with D4h symmetry. Comparing the stabilityof this cluster with other possible structures showed that theFe13O8 with D4h symmetry is the most stable cluster. Wangand co-workers5 have discussed the need for understandingthe Fe-O interactions because of the role that such interac-tions play in corrosion, biological processes, and oxide filmformation. Further, their reported moments of approximately2mB per iron atom5 suggest potential applications of thiscluster as a nanomagnet. Therefore additional investigationson the electronic and vibrational structure, spin-ordering,magnetic states, and the magnetic anisotropy barrier of thiscluster are indeed vital.
Sun and co-workers6 have reported the calculation of thevibrational modes of Fe13O8, finding local stability of this
iron oxide cluster, because all calculated vibrational frequen-cies are real. However, the frequencies given in Table II ofthat work6 range between 3.9 cm21 to 22.16 cm21 whichare unusually low. Results presented in this work suggestthat there may be a conversion error in their calculations.
In this paper we present results from all-electron density-functional-based studies of the Fe13O8 cluster as a functionof magnetic state and spin ordering and provide density-functional-based infrared and Raman spectra. For other tran-sition metal oxides such as Mn12O12 ~Refs. 7–9! and theoctanuclear iron~III! cluster1 antiferromagnetic couplings areknown to be important and antiferromagnetic or ferrimag-netic ground states are observed in these systems. Because ofthe coupling of the magnetic and structural degrees of free-dom, consideration of ferro-, ferri-, and antiferromagnet or-dering is an important issue from the standpoint of determin-ing the ground state of a magnetic molecule. As such, theinvestigation of different possible spin orderings as well astotal moments is one of the primary aims of this paper. Forthe most stable structure obtained we calculate the vibra-tional spectra in order to clarify some questions raised withthe reported values by Sun and co-workers.6 In Sec. II weprovide details on the computational methods employed andthe basis sets used. A short discussion of the calculation ofthe magnetic anisotropy energy is also given there. In Sec.III we discuss the results for the different magnetic couplingsand the vibrational spectra for the most stable geometryfound. We conclude by summarizing our results in Sec. IV.
II. COMPUTATIONAL DETAILS
The density-functional-theory ~DFT! calculations wereperformed with the all-electron Gaussian-orbital-basedNRLMOL program.10 NRLMOL is specifically designed forstudies of molecules and clusters and does not use periodicboundary conditions. All calculations discussed here use thePerdew-Burke-Ernzerhof ~PBE! generalized-gradient ap-proximation ~GGA! for the density functional.11 NRLMOLcombines large Gaussian-orbital basis sets, numerically pre-cise variational integration, and an analytic solution of Pois-son’s equation in order to accurately determine the self-consistent potentials, secular matrix, total energies, andHellmann-Feynman-Pulay forces. In conjunction with theconjugate-gradient algorithm, the Hellmann-Feynman-Pulay
PHYSICAL REVIEW B 1 SEPTEMBER 2000-IVOLUME 62, NUMBER 9
PRB 620163-1829/2000/62~9!/5755~5!/$15.00 5755 ©2000 The American Physical Society
117
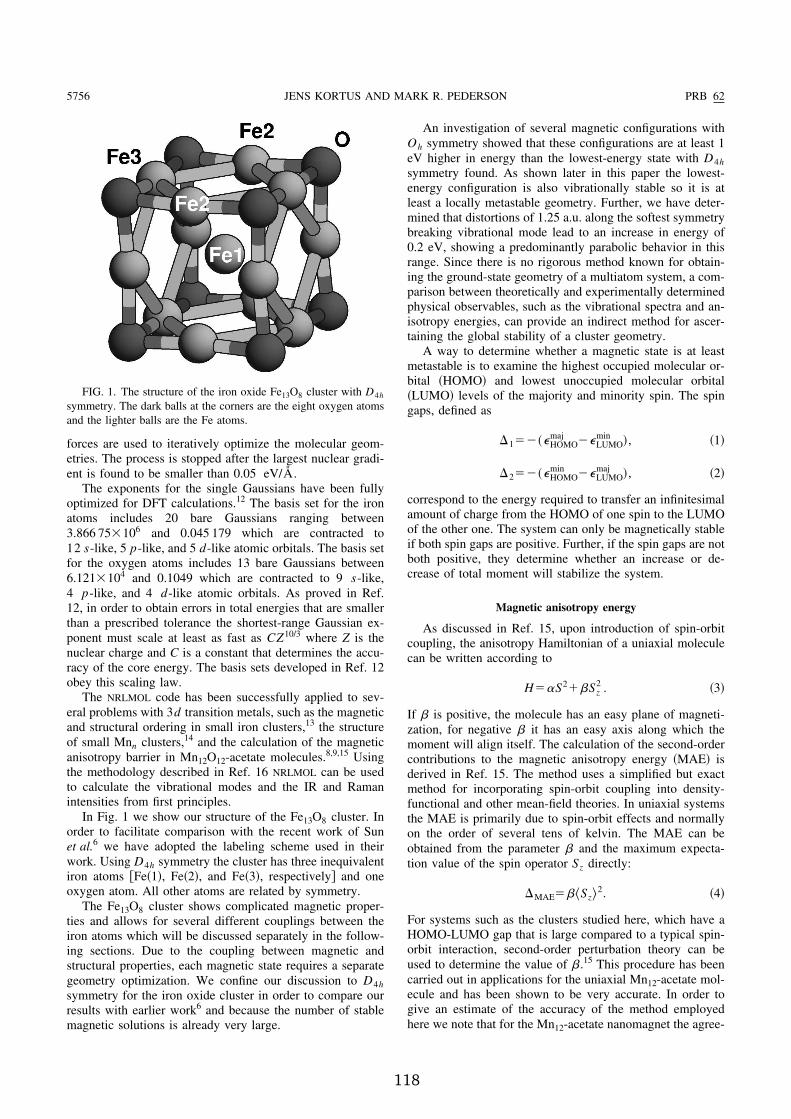
forces are used to iteratively optimize the molecular geom-etries. The process is stopped after the largest nuclear gradi-ent is found to be smaller than 0.05 eV/Å.
The exponents for the single Gaussians have been fullyoptimized for DFT calculations.12 The basis set for the ironatoms includes 20 bare Gaussians ranging between3.866 753106 and 0.045 179 which are contracted to12 s-like, 5 p-like, and 5 d-like atomic orbitals. The basis setfor the oxygen atoms includes 13 bare Gaussians between6.1213104 and 0.1049 which are contracted to 9 s-like,4 p-like, and 4 d-like atomic orbitals. As proved in Ref.12, in order to obtain errors in total energies that are smallerthan a prescribed tolerance the shortest-range Gaussian ex-ponent must scale at least as fast as CZ10/3 where Z is thenuclear charge and C is a constant that determines the accu-racy of the core energy. The basis sets developed in Ref. 12obey this scaling law.
The NRLMOL code has been successfully applied to sev-eral problems with 3d transition metals, such as the magneticand structural ordering in small iron clusters,13 the structureof small Mnn clusters,14 and the calculation of the magneticanisotropy barrier in Mn12O12-acetate molecules.8,9,15 Usingthe methodology described in Ref. 16 NRLMOL can be usedto calculate the vibrational modes and the IR and Ramanintensities from first principles.
In Fig. 1 we show our structure of the Fe13O8 cluster. Inorder to facilitate comparison with the recent work of Sunet al.6 we have adopted the labeling scheme used in theirwork. Using D4h symmetry the cluster has three inequivalentiron atoms @Fe~1!, Fe~2!, and Fe~3!, respectively# and oneoxygen atom. All other atoms are related by symmetry.
The Fe13O8 cluster shows complicated magnetic proper-ties and allows for several different couplings between theiron atoms which will be discussed separately in the follow-ing sections. Due to the coupling between magnetic andstructural properties, each magnetic state requires a separategeometry optimization. We confine our discussion to D4hsymmetry for the iron oxide cluster in order to compare ourresults with earlier work6 and because the number of stablemagnetic solutions is already very large.
An investigation of several magnetic configurations withOh symmetry showed that these configurations are at least 1eV higher in energy than the lowest-energy state with D4hsymmetry found. As shown later in this paper the lowest-energy configuration is also vibrationally stable so it is atleast a locally metastable geometry. Further, we have deter-mined that distortions of 1.25 a.u. along the softest symmetrybreaking vibrational mode lead to an increase in energy of0.2 eV, showing a predominantly parabolic behavior in thisrange. Since there is no rigorous method known for obtain-ing the ground-state geometry of a multiatom system, a com-parison between theoretically and experimentally determinedphysical observables, such as the vibrational spectra and an-isotropy energies, can provide an indirect method for ascer-taining the global stability of a cluster geometry.
A way to determine whether a magnetic state is at leastmetastable is to examine the highest occupied molecular or-bital ~HOMO! and lowest unoccupied molecular orbital~LUMO! levels of the majority and minority spin. The spingaps, defined as
D152~eHOMOmaj
2eLUMOmin !, ~1!
D252~eHOMOmin
2eLUMOmaj !, ~2!
correspond to the energy required to transfer an infinitesimalamount of charge from the HOMO of one spin to the LUMOof the other one. The system can only be magnetically stableif both spin gaps are positive. Further, if the spin gaps are notboth positive, they determine whether an increase or de-crease of total moment will stabilize the system.
Magnetic anisotropy energy
As discussed in Ref. 15, upon introduction of spin-orbitcoupling, the anisotropy Hamiltonian of a uniaxial moleculecan be written according to
H5aS21bSz
2 . ~3!
If b is positive, the molecule has an easy plane of magneti-zation, for negative b it has an easy axis along which themoment will align itself. The calculation of the second-ordercontributions to the magnetic anisotropy energy ~MAE! isderived in Ref. 15. The method uses a simplified but exactmethod for incorporating spin-orbit coupling into density-functional and other mean-field theories. In uniaxial systemsthe MAE is primarily due to spin-orbit effects and normallyon the order of several tens of kelvin. The MAE can beobtained from the parameter b and the maximum expecta-tion value of the spin operator Sz directly:
DMAE5b^Sz&2. ~4!
For systems such as the clusters studied here, which have aHOMO-LUMO gap that is large compared to a typical spin-orbit interaction, second-order perturbation theory can beused to determine the value of b .15 This procedure has beencarried out in applications for the uniaxial Mn12-acetate mol-ecule and has been shown to be very accurate. In order togive an estimate of the accuracy of the method employedhere we note that for the Mn12-acetate nanomagnet the agree-
FIG. 1. The structure of the iron oxide Fe13O8 cluster with D4hsymmetry. The dark balls at the corners are the eight oxygen atomsand the lighter balls are the Fe atoms.
5756 PRB 62JENS KORTUS AND MARK R. PEDERSON
118
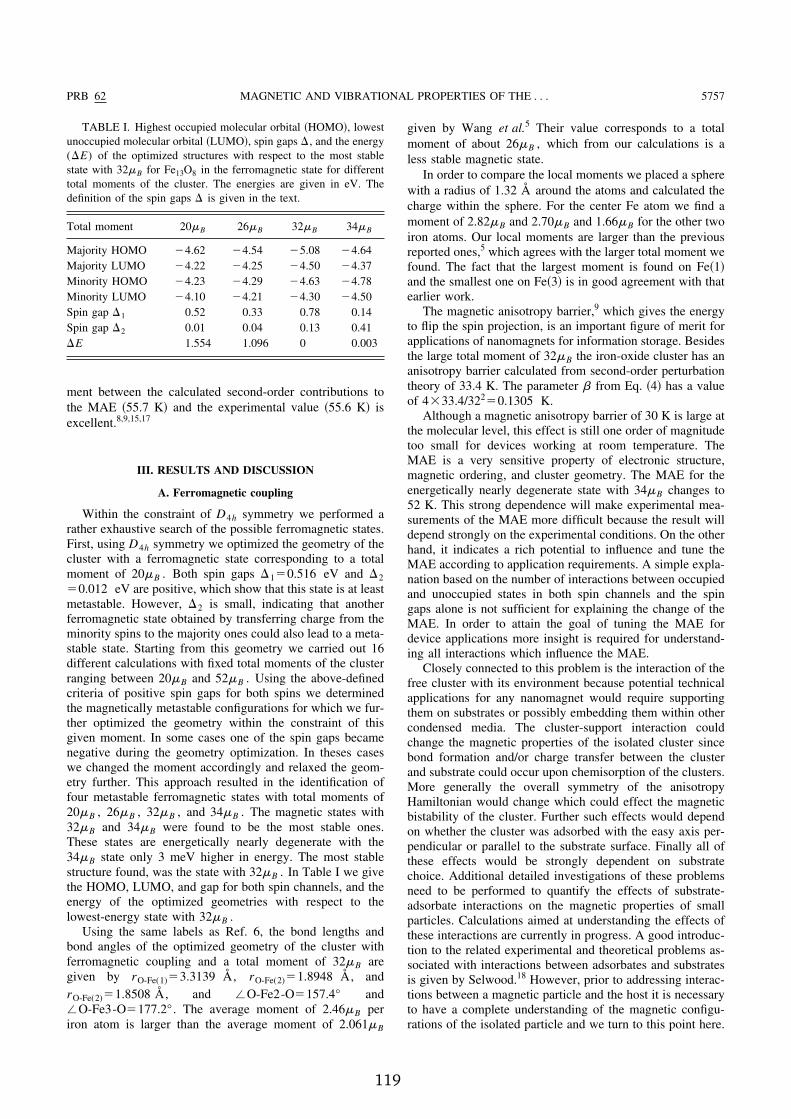
ment between the calculated second-order contributions tothe MAE ~55.7 K! and the experimental value ~55.6 K! isexcellent.8,9,15,17
III. RESULTS AND DISCUSSION
A. Ferromagnetic coupling
Within the constraint of D4h symmetry we performed arather exhaustive search of the possible ferromagnetic states.First, using D4h symmetry we optimized the geometry of thecluster with a ferromagnetic state corresponding to a totalmoment of 20mB . Both spin gaps D150.516 eV and D250.012 eV are positive, which show that this state is at leastmetastable. However, D2 is small, indicating that anotherferromagnetic state obtained by transferring charge from theminority spins to the majority ones could also lead to a meta-stable state. Starting from this geometry we carried out 16different calculations with fixed total moments of the clusterranging between 20mB and 52mB . Using the above-definedcriteria of positive spin gaps for both spins we determinedthe magnetically metastable configurations for which we fur-ther optimized the geometry within the constraint of thisgiven moment. In some cases one of the spin gaps becamenegative during the geometry optimization. In theses caseswe changed the moment accordingly and relaxed the geom-etry further. This approach resulted in the identification offour metastable ferromagnetic states with total moments of20mB , 26mB , 32mB , and 34mB . The magnetic states with32mB and 34mB were found to be the most stable ones.These states are energetically nearly degenerate with the34mB state only 3 meV higher in energy. The most stablestructure found, was the state with 32mB . In Table I we givethe HOMO, LUMO, and gap for both spin channels, and theenergy of the optimized geometries with respect to thelowest-energy state with 32mB .
Using the same labels as Ref. 6, the bond lengths andbond angles of the optimized geometry of the cluster withferromagnetic coupling and a total moment of 32mB aregiven by rO-Fe(1)53.3139 Å, rO-Fe(2)51.8948 Å, andrO-Fe(2)51.8508 Å, and /O-Fe2-O5157.4° and/O-Fe3-O5177.2°. The average moment of 2.46mB periron atom is larger than the average moment of 2.061mB
given by Wang et al.5 Their value corresponds to a totalmoment of about 26mB , which from our calculations is aless stable magnetic state.
In order to compare the local moments we placed a spherewith a radius of 1.32 Å around the atoms and calculated thecharge within the sphere. For the center Fe atom we find amoment of 2.82mB and 2.70mB and 1.66mB for the other twoiron atoms. Our local moments are larger than the previousreported ones,5 which agrees with the larger total moment wefound. The fact that the largest moment is found on Fe~1!and the smallest one on Fe~3! is in good agreement with thatearlier work.
The magnetic anisotropy barrier,9 which gives the energyto flip the spin projection, is an important figure of merit forapplications of nanomagnets for information storage. Besidesthe large total moment of 32mB the iron-oxide cluster has ananisotropy barrier calculated from second-order perturbationtheory of 33.4 K. The parameter b from Eq. ~4! has a valueof 4333.4/322
50.1305 K.Although a magnetic anisotropy barrier of 30 K is large at
the molecular level, this effect is still one order of magnitudetoo small for devices working at room temperature. TheMAE is a very sensitive property of electronic structure,magnetic ordering, and cluster geometry. The MAE for theenergetically nearly degenerate state with 34mB changes to52 K. This strong dependence will make experimental mea-surements of the MAE more difficult because the result willdepend strongly on the experimental conditions. On the otherhand, it indicates a rich potential to influence and tune theMAE according to application requirements. A simple expla-nation based on the number of interactions between occupiedand unoccupied states in both spin channels and the spingaps alone is not sufficient for explaining the change of theMAE. In order to attain the goal of tuning the MAE fordevice applications more insight is required for understand-ing all interactions which influence the MAE.
Closely connected to this problem is the interaction of thefree cluster with its environment because potential technicalapplications for any nanomagnet would require supportingthem on substrates or possibly embedding them within othercondensed media. The cluster-support interaction couldchange the magnetic properties of the isolated cluster sincebond formation and/or charge transfer between the clusterand substrate could occur upon chemisorption of the clusters.More generally the overall symmetry of the anisotropyHamiltonian would change which could effect the magneticbistability of the cluster. Further such effects would dependon whether the cluster was adsorbed with the easy axis per-pendicular or parallel to the substrate surface. Finally all ofthese effects would be strongly dependent on substratechoice. Additional detailed investigations of these problemsneed to be performed to quantify the effects of substrate-adsorbate interactions on the magnetic properties of smallparticles. Calculations aimed at understanding the effects ofthese interactions are currently in progress. A good introduc-tion to the related experimental and theoretical problems as-sociated with interactions between adsorbates and substratesis given by Selwood.18 However, prior to addressing interac-tions between a magnetic particle and the host it is necessaryto have a complete understanding of the magnetic configu-rations of the isolated particle and we turn to this point here.
TABLE I. Highest occupied molecular orbital ~HOMO!, lowestunoccupied molecular orbital ~LUMO!, spin gaps D , and the energy(DE) of the optimized structures with respect to the most stablestate with 32mB for Fe13O8 in the ferromagnetic state for differenttotal moments of the cluster. The energies are given in eV. Thedefinition of the spin gaps D is given in the text.
Total moment 20mB 26mB 32mB 34mB
Majority HOMO 24.62 24.54 25.08 24.64Majority LUMO 24.22 24.25 24.50 24.37Minority HOMO 24.23 24.29 24.63 24.78Minority LUMO 24.10 24.21 24.30 24.50Spin gap D1 0.52 0.33 0.78 0.14Spin gap D2 0.01 0.04 0.13 0.41DE 1.554 1.096 0 0.003
PRB 62 5757MAGNETIC AND VIBRATIONAL PROPERTIES OF THE . . .
119

B. Ferrimagnetic coupling
If orbitals are spatially orthogonal and occupy the sameregion in space, parallel alignment of the spins leads to alarger exchange interaction energy and ferromagnetic cou-pling is subsequently favored. Antiferromagnetic couplingoccurs in cases where the orbitals are spatially separated butnonorthogonal. In such cases antiparallel alignment of thespins bypasses the need for spatial orthogonality and pro-vides for a reduction in the kinetic energy. An example ofantiferromagnetic interactions in clusters is the Mn12O12tower structure observed by Ziemann and Castleman.7,9 Inthis structure the net moment is zero. Antiferromagnetic cou-pling is experimentally observed in the octanuclear iron~III!cluster @Fe8O2(OH)12(tacn)6#81, which shows antiferro-magnetic coupling between neighboring irons. However, thelocal moments do not entirely compensate one another, lead-ing to an nonvanishing total moment of the cluster and fer-rimagnetic order.1,8,9 The magnetic spinel Fe3S4 also shows aferrimagnetic spin arrangement.19
From these experiences we expect that antiferromagneticinteractions could also play an important role for the ironoxide clusters and a complete investigation of spin orderingin this system is required.
Using the same approach as in the ferromagnetic case westarted with 12 different fixed total moments between 0mBand 20mB . In order to obtain antiferromagnetic solutions weused a starting potential which favored antiferromagneticcoupling between the Fe~2! and Fe~3! atoms. During the self-consistency cycle no constraints on the electronic degrees offreedom were applied and the coupling between the Fe~1!atom and the other two atoms was determined self-consistently. By calculating the self-consistent local mo-ments for each atom we determined whether the solution hadconverged to a state with antiferromagnetic coupling. Thegeometries of all states with positive spin gaps were furtheroptimized.
We find antiferromagnetic and several ferrimagneticstates with total moments 4mB , 8mB , 10mB , 12mB , 13mB ,14mB , and 15mB to be metastable magnetic states for theiron oxide cluster. The ferrimagnetic states with 12mB ,13mB , 14mB , and 15mB have twofold states at the Fermilevel, which are not fully occupied, suggesting that Jahn-Teller distortions would lead to a reduction in symmetry.
All these states are close in energy and show similar be-havior. The magnetic state with 14mB is the lowest-energystate exhibiting antiferromagnetic coupling between the Featoms. However, this state is 86 meV higher in energy thanthe ferromagnetic state with 32mB . Results for the HOMO,LUMO, and spin gaps for some of the more interesting mag-netic states are given in Table II. The energy DE is theenergy with respect to the ferromagnetic state with 32mB ,which was the most stable state found for all magnetic con-figuration.
The bond lengths of the most stable ferrimagnetic statewith a total moment of 14mB are rO-Fe(1)53.232 18 Å,rO-Fe(2)51.8878 Å, and rO-Fe(2)51.8393 Å; the bondangles did not change much: /O-Fe2-O5169.8° and/O-Fe3-O5174.7°. The local moments within a sphere areFe~1!, 2.7320mB ; Fe~2!, 22.7349mB ; and Fe~3!, 2.6794mB .
C. Vibrational spectra
In order to find the vibrational spectra of the Fe13O8 clus-ter within the harmonic approximation we need to calculatethe dynamical or Hessian matrix. For the calculation of allmatrix elements of the dynamical matrix we need only 14different geometries due to the D4h symmetry of the cluster.Diagonalizing the dynamical matrix gives directly the vibra-tional frequencies and eigenmodes. As explained in detail inRef. 16, 12 additional self-consistent field calculations arenecessary for the determination of the polarizability tensorand the dipole moment, which are the required ingredientsfor calculating IR and Raman intensities.
In Fig. 2 we show the vibrational spectra including IR andRaman intensities calculated from density-functional theory.We find that the ferromagnetic state with a moment of 32mBper cluster is locally stable. Our frequencies range from29.7 cm21 as the lowest to 660 cm21 as the highest fre-quency. These values differ by an order of magnitude fromthe frequencies given by Sun and co-workers.6 A good testfor the numerical accuracy of our calculations is the value ofthe trivial frequencies of the three translational and rotational
TABLE II. HOMO, LUMO, and spin gaps D for Fe13O8 withantiferromagnetic coupling for states with different total moment.DE gives the energy with respect to the ferromagnetic state withwith 32mB , which was the most stable state found. The energies aregiven in eV.
Moment 0mB 4mB 8mB 10mB 12mB 14mB
Majority HOMO 24.58 24.47 24.61 24.56 24.60 24.42Majority LUMO 24.22 24.25 24.37 24.34 24.28 24.42Minority HOMO 24.48 24.47 24.52 24.55 24.30 24.51Minority LUMO 24.04 24.11 24.12 24.18 24.30 24.31D1 0.53 0.36 0.49 0.38 0.30 0.11D2 0.26 0.22 0.15 0.21 0.02 0.09DE 0.70 0.75 0.31 0.20 0.12 0.09
FIG. 2. The upper panel displays the calculated vibrational den-sity of states ~VDOS!, the middle panel the IR spectra, and thelower panel the Raman spectra of the most stable ferromagneticiron oxide Fe13O8 cluster with D4h symmetry. The lowest fre-quency is 29.7 cm21. The IR and Raman intensities are in arbitraryunits; a constant line width of 6 cm21 was assumed.
5758 PRB 62JENS KORTUS AND MARK R. PEDERSON
120

modes which should be zero, which we also obtain fromdiagonalizing the dynamical matrix. The largest absolutevalue for one of these six modes is 0.000 012 cm21.
Our results are closer in magnitude to those of the Fedimer, where different levels of theory give values between350 cm21 and 500 cm21 with an experimental value20 of300 cm21. The value obtained by NRLMOL within the stan-dard local spin density approximation was reported earlier as418 cm21 in Ref. 13 which changes to 406 cm21 for thePBE-GGA exchange-correlation functional. Since theNRLMOL code has been successfully applied to the calcula-tion of vibrational spectra21–25 with very good agreement toexperiment, we are confident in the results reported here. Thecalculated IR and Raman intensities could be useful for ex-periments investigating the iron oxide cluster.
IV. SUMMARY
In this paper we have investigated the magnetic couplingbetween iron atoms in the interesting Fe13O8 iron oxide clus-ter using first-principles density-functional calculations withthe PBE-GGA functional for the exchange-correlation func-tional. Several metastable ferro- and ferrimagnetic stateswith different total moments per cluster have been found.The antiferromagnetic state is also magnetically metastable.The state with the lowest energy is a ferromagnetic state with32mB per molecule, which is nearly energetically degeneratewith a ferromagnetic state with 34mB being only 3 meVlower in energy. Several ferrimagnetic states are also close inenergy. The observed ground state for the iron oxide cluster
differs from a previous reported ferromagnetic state (26mB)by Wang and co-workers.5
The calculation of the vibrational spectra shows, in agree-ment with reports of Sun et al.,6 that the cluster is vibra-tionally stable within D4h symmetry, although our calculatedfrequencies differ significantly from earlier reported ones.Besides the frequencies we calculated the IR and Ramanspectra which could be helpful for vibrational spectroscopystudies. Several magnetic configurations with Oh symmetryhave been studied and are found to be at least 1 eV higher inenergy than the lowest-energy state with D4h symmetryfound.
The high magnetic moment of 32mB and a magnetic an-isotropy energy of 33.4 K suggest that this cluster may be aninteresting nanomagnet if collection and assembly of reason-ably large quantities of these clusters is possible. The clustershould show similar interesting behavior of magnetic hyster-esis and tunneling of the magnetic orientation as found inother nanomagnets.1
From a practical point of view additional systematic stud-ies of the influence of passivation and chemisorption on themagnetic properties of these and other clusters is of currentinterest. These interactions are important for understandingexperiments and may enable one to design materials withgiven magnetic properties. Work in this direction is currentlybeing carried out.
ACKNOWLEDGMENTS
This work was supported in part by ONR ~Grant Nos.N0001400WX2011 and N0001498WX20709!.
1 A. Caneschi, D. Gatteschi, C. Sangregorio, R. Sessoli, L. Sorace,A. Cornia, M.A. Noval, C. Paulsen, and W. Wernsdorfer, J.Magn. Magn. Mater. 200, 182 ~1999!, and references therein.
2 D. Gatteschi, L. Pardi, A.L. Barra, A. Muller, and J. Doring,Nature ~London! 354, 463 ~1991!.
3 J. Van Vleck, Phys. Rev. 52, 1178 ~1937!.4 R.F. Service, Science 287, 1902 ~2000!; S. Sun, C.B. Murray, D.
Weller, L. Folks, and A. Moser, ibid. 287, 1989 ~2000!.5 Q. Wang, Q. Sun, M. Sakurai, J.Z. Yu, B.L. Gu, K. Sumiyama,
and Y. Kawazoe, Phys. Rev. B 59, 12 672 ~1999!.6 Q. Sun, Q. Wang, K. Parlinski, J.Z. Yu, Y. Hashi, X.G. Gong,
and Y. Kawazoe, Phys. Rev. B 61, 5781 ~2000!.7 P.J. Ziemann and A.W. Castleman, Jr., Phys. Rev. B 46, 13 480
~1992!.8 M.R. Pederson and S.N. Khanna, Chem. Phys. Lett. 307, 253
~1999!.9 M.R. Pederson and S.N. Khanna, Phys. Rev. B 59, R693 ~1999!.
10 M.R. Pederson and K.A. Jackson, Phys. Rev. B 41, 7453 ~1990!;K.A. Jackson and M.R. Pederson, ibid. 42, 3276 ~1990!.
11 J.P. Perdew, K. Burke, and M. Ernzerhof, Phys. Rev. Lett. 77,3865 ~1996!.
12 D. Porezag and M.R. Pederson, Phys. Rev. A 60, 2840 ~1999!.13 J.L. Chen, C.S. Wang, K.A. Jackson, and M.R. Pederson, Phys.
Rev. B 44, 6558 ~1991!.14 M.R. Pederson, F. Reuse, and S.N. Khanna, Phys. Rev. B 58,
5632 ~1998!.15 M.R. Pederson and S.N. Khanna, Phys. Rev. B 60, 9566 ~1999!.16 D.V. Porezag and M.R. Pederson, Phys. Rev. B 54, 7830 ~1996!.17 A.L. Barra, D. Gatteschi, and R. Sessoli, Phys. Rev. B 56, 8192
~1997!.18 P.W. Selwood, Chemisorption and Magnetization ~Academic
Press, New York, 1975!.19 M.R. Spender, J.M.D. Coey, and A.H. Morrish, Can. J. Phys. 50,
2313 ~1971!.20 E.G. Moroni, G. Kresse, J. Hafner, and J. Furthmuller, Phys. Rev.
B 56, 15 629 ~1997!, and references therein.21 A. Briley, M.R. Pederson, K.A. Jackson, D.C. Patton, and D.V.
Porezag, Phys. Rev. B 58, 1786 ~1998!.22 K.A. Jackson, A. Briley, S. Grossman, D.V. Porezag, and M.R.
Pederson, Phys. Rev. B 60, R14 985 ~1999!.23 D.C. Patton, D.V. Porezag, and M.R Pederson, Phys. Rev. B 55,
7454 ~1997!.24 M.R. Pederson, K. Jackson, D.V. Porezag, Z. Hajnal, and Th.
Frauenheim, Phys. Rev. B 54, 2863 ~1996!; A. Sieck, D.Porezag, Th. Frauenheim, M.R. Pederson, and K.A. Jackson,Phys. Rev. A 56, 4890 ~1997!; K.A. Jackson, M.R. Pederson,D.V. Porezag, Z. Hajnal, and Th. Frauenheim, Phys. Rev. B 55,2549 ~1997!.
25 A.A. Quong, M.R. Pederson, and J.L. Feldman, Solid State Com-mun. 87, 535 ~1993!.
PRB 62 5759MAGNETIC AND VIBRATIONAL PROPERTIES OF THE . . .
121

122

Appendix I
Kortus J., Baruah T., Pederson M. R.,Khanna S. N. and C. Ashman
Magnetic moment and anisotropy in
Fe * Co + Clusters
Appl. Phys. Lett. 80, 4193-4195(2002)
123

124

Magnetic moment and anisotropy in FenCom clustersJ. Kortus,a) T. Baruah,a) and M. R. PedersonCenter for Computational Materials Science, Code 6390-Naval Research Laboratory, Washington, DC
C. Ashman and S. N. Khannab)
Physics Department, Virginia Commonwealth University, Richmond, Virginia 23284-2000
~Received 10 December 2001; accepted for publication 5 April 2002!
Electronic structure calculations of FenCom ~n1m55 and 13! are used to examine the effects ofalloying on the magnetic moment and magnetic anisotropies. Our density-functional studies showthat many mixed clusters have moments comparable to or higher than the pure clusters. The mixedclusters, however, have very low anisotropies and could be ideal as soft magnetic materials. It isshown that shape, composition, and compositional ordering must be considered for optimization ofanisotropy energies. © 2002 American Institute of Physics. @DOI: 10.1063/1.1482793#
Extensive research over the past decade has shown thatsmall clusters offer a class of magnetic properties. Clustersof itinerant ferromagnetic solids Fe, Co, and Ni have highermagnetic moments per atom than the corresponding bulk;1
clusters of nonmagnetic solids like Rh are spin polarized;1,2
and atomic moments in clusters of Mn, which exhibits com-plex magnetic order in the bulk, are ferromagneticallyaligned.3,4 The reduction in particle size also leads to newdynamical behaviors. For a particle with a size smaller thanthe typical magnetic domain size, the atomic moments areexchange coupled and the particles behave as a single mag-net with a combined moment from the individual atoms.However, the anisotropy energy ~AE! that determines theminimum energy required to reorient this combined mag-netic moment decreases with size and typically becomescomparable to thermal energies in particles of about 10 nm.These particles then undergo superparamagnetic ~SP!relaxation.5–8 A fundamental understanding of the magneticanisotropy energy ~MAE!, which controls the onset of SPbehavior is therefore requisite to the design of molecularscale magnets.
While there has been considerable effort in the past tounderstand the evolution of the magnetic moment, the fewtheoretical attempts to understand the MAE in clusters havebeen limited to semiempirical approaches.10 Recently Zhouet al.11 have shown that the MAE in clusters and low-dimensional systems can be affected by the orbital-correlation terms. However in the absence of a precise recipefor derivation of the orbital-polarization or correlation cor-rection within density-functional theory, the conclusions ofthese papers can best be regarded as informative albeit quali-tative.
The purpose of this letter is to examine the magneticmoment and the magnetic anisotropy in small FenCom clus-ters. Bulk FeCo alloys exhibit the highest saturation magne-tization and the limiting value, occurring around 35% Co,known as the Slater–Pauling limit, has long been regarded asthe highest possible magnetization. Can this limit be over-
come in clusters and, as a related issue, do the FenCom clus-ters exhibit higher magnetization than pure Fe or Co clus-ters? The bulk alloys are used as soft magnetic materials dueto their small magnetic anisotropy. The magnetic anisotropyof clusters is not known and the factors that control the mag-netic anisotropy in these reduced sizes are not well under-stood. This line of inquiry is motivated by the possibility thatthe small anisotropy of the solid alloys may be enhanced bya chemical ordering of atoms in specialized geometries. Toaddress these issues, we have carried out studies on severalFenCom clusters. Here, we present results on five and 13atom clusters.
Our studies employed a linear combination of atomic-orbitals approach Naval Research Laboratory Molecular Or-bital Library ~NRLMOL!12 within the generalized-gradientapproximation ~GGA!13 to the density-functional theory. Thebasis sets used contained 20 bare Gaussians with exponentsvarying from 0.0452 to 3.866 7483106 for Fe and 0.048 28to 4.208 473106 for Co contracted to 11 s-like, 5 p-like and4 d-like orbitals resulting in 46 basis functions for each atom.This large basis set shows great stability and gives reliablegeometries. Detailed information on the construction of theGaussian basis sets can be found in Ref. 14.
One focus of the present work is the calculation of theMAE. The main contribution to this quantity comes from thespin–orbit coupling and except for the cases where thesecond-order term is zero ~due to symmetry!, the most sig-nificant contribution comes from this term. For intrinsicallyuniaxial or lower-symmetry systems such as those discussedhere the second-order contribution to the MAE is given bythe change in the second-order spin–orbit energy (D2) as theangle ~u! between the axis of symmetry and the quantizationaxis varies between 0 and p/2. For lower-symmetry systems,the second-order MAE depends on two angles. We have justproposed an implementation of the spin–orbit couplingthat uses the exact representation given by U(r,p,S)521/2c2S•p3¹F(r). In addition to including some non-spherical contributions that would be absent in a standardL•S representation, the numerical implementation is particu-larly well suited to local-orbital methods such asNRLMOL.15 Please note, while the scalar relativistic correc-tions ~mass velocity and Darwin terms! have a 1/c2 contri-
a!Also at: Department of Physics-Georgetown University, Washington,DC 20057.
b!Electronic mail: [email protected]
APPLIED PHYSICS LETTERS VOLUME 80, NUMBER 22 3 JUNE 2002
41930003-6951/2002/80(22)/4193/3/$19.00 © 2002 American Institute of Physics
125
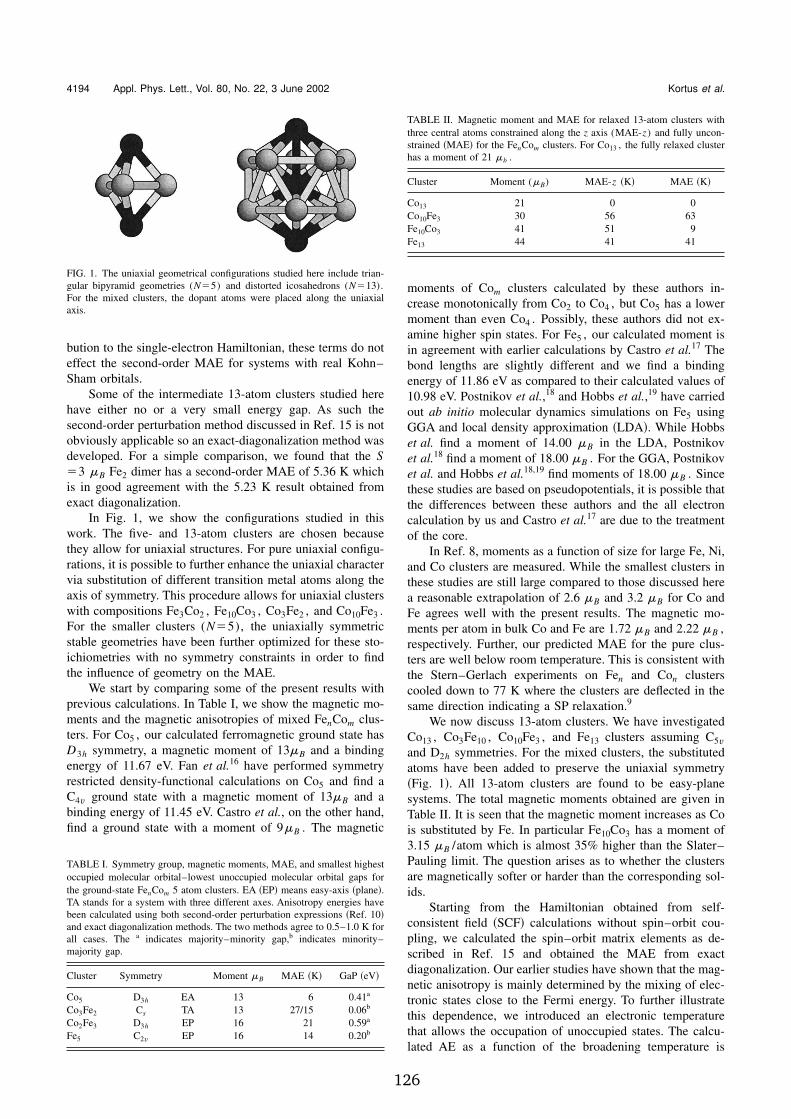
bution to the single-electron Hamiltonian, these terms do noteffect the second-order MAE for systems with real Kohn–Sham orbitals.
Some of the intermediate 13-atom clusters studied herehave either no or a very small energy gap. As such thesecond-order perturbation method discussed in Ref. 15 is notobviously applicable so an exact-diagonalization method wasdeveloped. For a simple comparison, we found that the S53 mB Fe2 dimer has a second-order MAE of 5.36 K whichis in good agreement with the 5.23 K result obtained fromexact diagonalization.
In Fig. 1, we show the configurations studied in thiswork. The five- and 13-atom clusters are chosen becausethey allow for uniaxial structures. For pure uniaxial configu-rations, it is possible to further enhance the uniaxial charactervia substitution of different transition metal atoms along theaxis of symmetry. This procedure allows for uniaxial clusterswith compositions Fe3Co2 , Fe10Co3 , Co3Fe2 , and Co10Fe3 .For the smaller clusters (N55), the uniaxially symmetricstable geometries have been further optimized for these sto-ichiometries with no symmetry constraints in order to findthe influence of geometry on the MAE.
We start by comparing some of the present results withprevious calculations. In Table I, we show the magnetic mo-ments and the magnetic anisotropies of mixed FenCom clus-ters. For Co5 , our calculated ferromagnetic ground state hasD3h symmetry, a magnetic moment of 13mB and a bindingenergy of 11.67 eV. Fan et al.16 have performed symmetryrestricted density-functional calculations on Co5 and find aC4v
ground state with a magnetic moment of 13mB and abinding energy of 11.45 eV. Castro et al., on the other hand,find a ground state with a moment of 9mB . The magnetic
moments of Com clusters calculated by these authors in-crease monotonically from Co2 to Co4 , but Co5 has a lowermoment than even Co4 . Possibly, these authors did not ex-amine higher spin states. For Fe5 , our calculated moment isin agreement with earlier calculations by Castro et al.17 Thebond lengths are slightly different and we find a bindingenergy of 11.86 eV as compared to their calculated values of10.98 eV. Postnikov et al.,18 and Hobbs et al.,19 have carriedout ab initio molecular dynamics simulations on Fe5 usingGGA and local density approximation ~LDA!. While Hobbset al. find a moment of 14.00 mB in the LDA, Postnikovet al.18 find a moment of 18.00 mB . For the GGA, Postnikovet al. and Hobbs et al.18,19 find moments of 18.00 mB . Sincethese studies are based on pseudopotentials, it is possible thatthe differences between these authors and the all electroncalculation by us and Castro et al.17 are due to the treatmentof the core.
In Ref. 8, moments as a function of size for large Fe, Ni,and Co clusters are measured. While the smallest clusters inthese studies are still large compared to those discussed herea reasonable extrapolation of 2.6 mB and 3.2 mB for Co andFe agrees well with the present results. The magnetic mo-ments per atom in bulk Co and Fe are 1.72 mB and 2.22 mB ,respectively. Further, our predicted MAE for the pure clus-ters are well below room temperature. This is consistent withthe Stern–Gerlach experiments on Fen and Con clusterscooled down to 77 K where the clusters are deflected in thesame direction indicating a SP relaxation.9
We now discuss 13-atom clusters. We have investigatedCo13 , Co3Fe10 , Co10Fe3 , and Fe13 clusters assuming C5v
and D2h symmetries. For the mixed clusters, the substitutedatoms have been added to preserve the uniaxial symmetry~Fig. 1!. All 13-atom clusters are found to be easy-planesystems. The total magnetic moments obtained are given inTable II. It is seen that the magnetic moment increases as Cois substituted by Fe. In particular Fe10Co3 has a moment of3.15 mB /atom which is almost 35% higher than the Slater–Pauling limit. The question arises as to whether the clustersare magnetically softer or harder than the corresponding sol-ids.
Starting from the Hamiltonian obtained from self-consistent field ~SCF! calculations without spin–orbit cou-pling, we calculated the spin–orbit matrix elements as de-scribed in Ref. 15 and obtained the MAE from exactdiagonalization. Our earlier studies have shown that the mag-netic anisotropy is mainly determined by the mixing of elec-tronic states close to the Fermi energy. To further illustratethis dependence, we introduced an electronic temperaturethat allows the occupation of unoccupied states. The calcu-lated AE as a function of the broadening temperature is
FIG. 1. The uniaxial geometrical configurations studied here include trian-gular bipyramid geometries (N55) and distorted icosahedrons (N513).For the mixed clusters, the dopant atoms were placed along the uniaxialaxis.
TABLE I. Symmetry group, magnetic moments, MAE, and smallest highestoccupied molecular orbital–lowest unoccupied molecular orbital gaps forthe ground-state FenCom 5 atom clusters. EA ~EP! means easy-axis ~plane!.TA stands for a system with three different axes. Anisotropy energies havebeen calculated using both second-order perturbation expressions ~Ref. 10!and exact diagonalization methods. The two methods agree to 0.5–1.0 K forall cases. The a indicates majority–minority gap,b indicates minority–majority gap.
Cluster Symmetry Moment mB MAE ~K! GaP ~eV!
Co5 D3h EA 13 6 0.41a
Co3Fe2 Cs TA 13 27/15 0.06b
Co2Fe3 D3h EP 16 21 0.59a
Fe5 C2vEP 16 14 0.20b
TABLE II. Magnetic moment and MAE for relaxed 13-atom clusters withthree central atoms constrained along the z axis (MAE-z) and fully uncon-strained ~MAE! for the FenCom clusters. For Co13 , the fully relaxed clusterhas a moment of 21 mb .
Cluster Moment (mB) MAE-z ~K! MAE ~K!
Co13 21 0 0Co10Fe3 30 56 63Fe10Co3 41 51 9Fe13 44 41 41
4194 Appl. Phys. Lett., Vol. 80, No. 22, 3 June 2002 Kortus et al.
126
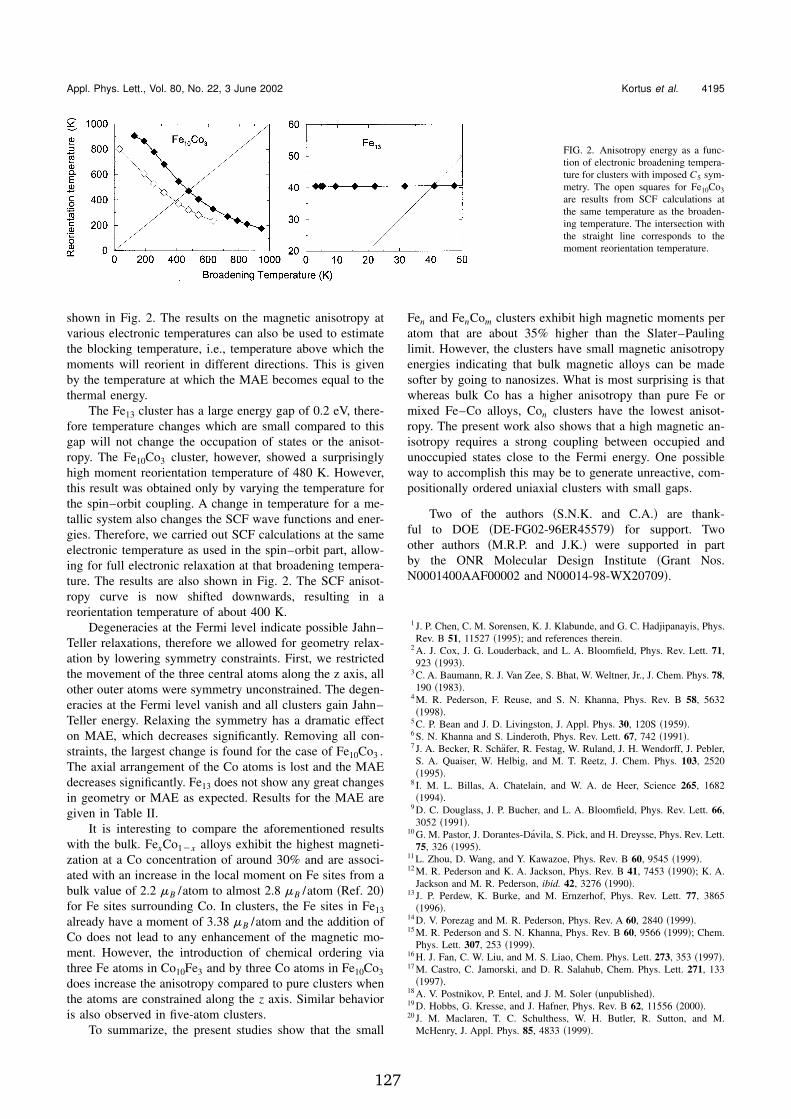
shown in Fig. 2. The results on the magnetic anisotropy atvarious electronic temperatures can also be used to estimatethe blocking temperature, i.e., temperature above which themoments will reorient in different directions. This is givenby the temperature at which the MAE becomes equal to thethermal energy.
The Fe13 cluster has a large energy gap of 0.2 eV, there-fore temperature changes which are small compared to thisgap will not change the occupation of states or the anisot-ropy. The Fe10Co3 cluster, however, showed a surprisinglyhigh moment reorientation temperature of 480 K. However,this result was obtained only by varying the temperature forthe spin–orbit coupling. A change in temperature for a me-tallic system also changes the SCF wave functions and ener-gies. Therefore, we carried out SCF calculations at the sameelectronic temperature as used in the spin–orbit part, allow-ing for full electronic relaxation at that broadening tempera-ture. The results are also shown in Fig. 2. The SCF anisot-ropy curve is now shifted downwards, resulting in areorientation temperature of about 400 K.
Degeneracies at the Fermi level indicate possible Jahn–Teller relaxations, therefore we allowed for geometry relax-ation by lowering symmetry constraints. First, we restrictedthe movement of the three central atoms along the z axis, allother outer atoms were symmetry unconstrained. The degen-eracies at the Fermi level vanish and all clusters gain Jahn–Teller energy. Relaxing the symmetry has a dramatic effecton MAE, which decreases significantly. Removing all con-straints, the largest change is found for the case of Fe10Co3 .The axial arrangement of the Co atoms is lost and the MAEdecreases significantly. Fe13 does not show any great changesin geometry or MAE as expected. Results for the MAE aregiven in Table II.
It is interesting to compare the aforementioned resultswith the bulk. FexCo12x alloys exhibit the highest magneti-zation at a Co concentration of around 30% and are associ-ated with an increase in the local moment on Fe sites from abulk value of 2.2 mB /atom to almost 2.8 mB /atom ~Ref. 20!for Fe sites surrounding Co. In clusters, the Fe sites in Fe13already have a moment of 3.38 mB /atom and the addition ofCo does not lead to any enhancement of the magnetic mo-ment. However, the introduction of chemical ordering viathree Fe atoms in Co10Fe3 and by three Co atoms in Fe10Co3does increase the anisotropy compared to pure clusters whenthe atoms are constrained along the z axis. Similar behavioris also observed in five-atom clusters.
To summarize, the present studies show that the small
Fen and FenCom clusters exhibit high magnetic moments peratom that are about 35% higher than the Slater–Paulinglimit. However, the clusters have small magnetic anisotropyenergies indicating that bulk magnetic alloys can be madesofter by going to nanosizes. What is most surprising is thatwhereas bulk Co has a higher anisotropy than pure Fe ormixed Fe–Co alloys, Con clusters have the lowest anisot-ropy. The present work also shows that a high magnetic an-isotropy requires a strong coupling between occupied andunoccupied states close to the Fermi energy. One possibleway to accomplish this may be to generate unreactive, com-positionally ordered uniaxial clusters with small gaps.
Two of the authors ~S.N.K. and C.A.! are thank-ful to DOE ~DE-FG02-96ER45579! for support. Twoother authors ~M.R.P. and J.K.! were supported in partby the ONR Molecular Design Institute ~Grant Nos.N0001400AAF00002 and N00014-98-WX20709!.
1 J. P. Chen, C. M. Sorensen, K. J. Klabunde, and G. C. Hadjipanayis, Phys.Rev. B 51, 11527 ~1995!; and references therein.
2 A. J. Cox, J. G. Louderback, and L. A. Bloomfield, Phys. Rev. Lett. 71,923 ~1993!.
3 C. A. Baumann, R. J. Van Zee, S. Bhat, W. Weltner, Jr., J. Chem. Phys. 78,190 ~1983!.
4 M. R. Pederson, F. Reuse, and S. N. Khanna, Phys. Rev. B 58, 5632~1998!.
5 C. P. Bean and J. D. Livingston, J. Appl. Phys. 30, 120S ~1959!.6 S. N. Khanna and S. Linderoth, Phys. Rev. Lett. 67, 742 ~1991!.7 J. A. Becker, R. Schafer, R. Festag, W. Ruland, J. H. Wendorff, J. Pebler,S. A. Quaiser, W. Helbig, and M. T. Reetz, J. Chem. Phys. 103, 2520~1995!.
8 I. M. L. Billas, A. Chatelain, and W. A. de Heer, Science 265, 1682~1994!.
9 D. C. Douglass, J. P. Bucher, and L. A. Bloomfield, Phys. Rev. Lett. 66,3052 ~1991!.
10 G. M. Pastor, J. Dorantes-Davila, S. Pick, and H. Dreysse, Phys. Rev. Lett.75, 326 ~1995!.
11 L. Zhou, D. Wang, and Y. Kawazoe, Phys. Rev. B 60, 9545 ~1999!.12 M. R. Pederson and K. A. Jackson, Phys. Rev. B 41, 7453 ~1990!; K. A.
Jackson and M. R. Pederson, ibid. 42, 3276 ~1990!.13 J. P. Perdew, K. Burke, and M. Ernzerhof, Phys. Rev. Lett. 77, 3865
~1996!.14 D. V. Porezag and M. R. Pederson, Phys. Rev. A 60, 2840 ~1999!.15 M. R. Pederson and S. N. Khanna, Phys. Rev. B 60, 9566 ~1999!; Chem.
Phys. Lett. 307, 253 ~1999!.16 H. J. Fan, C. W. Liu, and M. S. Liao, Chem. Phys. Lett. 273, 353 ~1997!.17 M. Castro, C. Jamorski, and D. R. Salahub, Chem. Phys. Lett. 271, 133
~1997!.18 A. V. Postnikov, P. Entel, and J. M. Soler ~unpublished!.19 D. Hobbs, G. Kresse, and J. Hafner, Phys. Rev. B 62, 11556 ~2000!.20 J. M. Maclaren, T. C. Schulthess, W. H. Butler, R. Sutton, and M.
McHenry, J. Appl. Phys. 85, 4833 ~1999!.
FIG. 2. Anisotropy energy as a func-tion of electronic broadening tempera-ture for clusters with imposed C5 sym-metry. The open squares for Fe10Co3are results from SCF calculations atthe same temperature as the broaden-ing temperature. The intersection withthe straight line corresponds to themoment reorientation temperature.
4195Appl. Phys. Lett., Vol. 80, No. 22, 3 June 2002 Kortus et al.
127

128

Appendix J
Kortus J., Hellberg C. S., Pederson M.R. and Khanna S. N.
DFT studies of the molecular
nanomagnet Fe ) and the V &-, spin
system
Eur. Phys. J. D 16, 177-180 (2001)
129

130
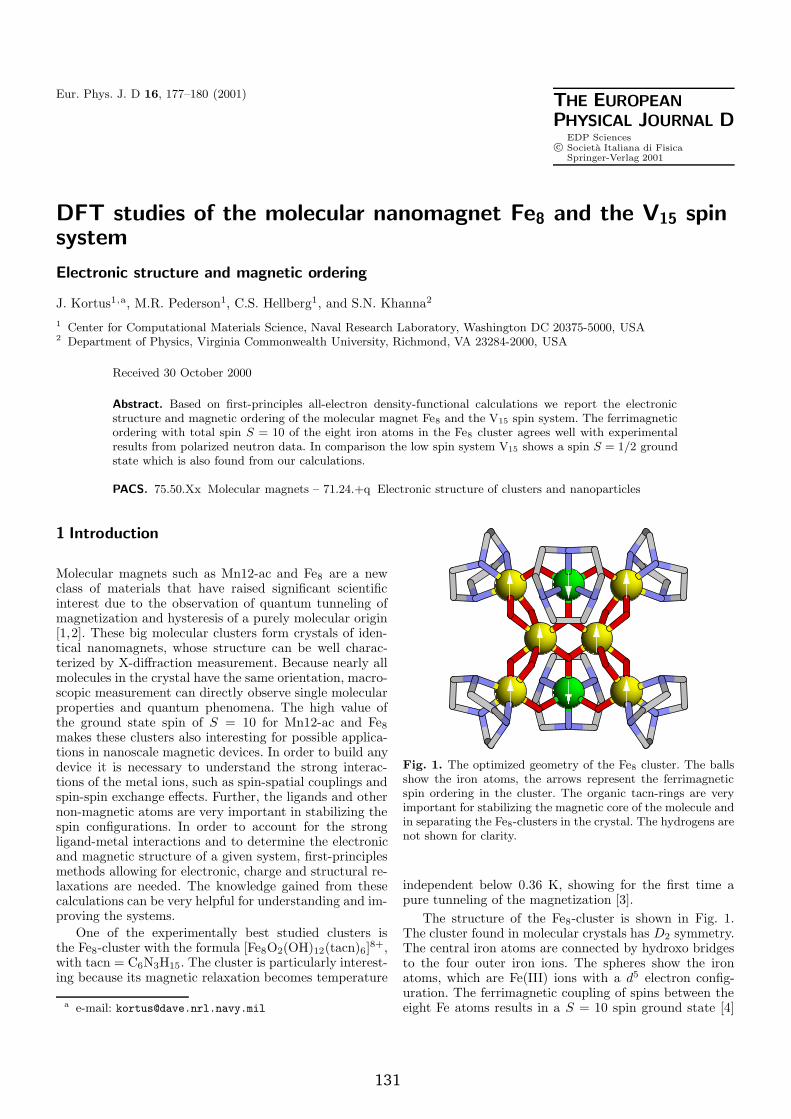
Eur. Phys. J. D 16, 177–180 (2001) THE EUROPEAN
PHYSICAL JOURNAL D
c©EDP SciencesSocieta Italiana di FisicaSpringer-Verlag 2001
DFT studies of the molecular nanomagnet Fe8 and the V15 spinsystem
Electronic structure and magnetic ordering
J. Kortus1,a, M.R. Pederson1, C.S. Hellberg1, and S.N. Khanna2
1 Center for Computational Materials Science, Naval Research Laboratory, Washington DC 20375-5000, USA2 Department of Physics, Virginia Commonwealth University, Richmond, VA 23284-2000, USA
Received 30 October 2000
Abstract. Based on first-principles all-electron density-functional calculations we report the electronicstructure and magnetic ordering of the molecular magnet Fe8 and the V15 spin system. The ferrimagneticordering with total spin S = 10 of the eight iron atoms in the Fe8 cluster agrees well with experimentalresults from polarized neutron data. In comparison the low spin system V15 shows a spin S = 1/2 groundstate which is also found from our calculations.
PACS. 75.50.Xx Molecular magnets – 71.24.+q Electronic structure of clusters and nanoparticles
1 Introduction
Molecular magnets such as Mn12-ac and Fe8 are a newclass of materials that have raised significant scientificinterest due to the observation of quantum tunneling ofmagnetization and hysteresis of a purely molecular origin[1,2]. These big molecular clusters form crystals of iden-tical nanomagnets, whose structure can be well charac-terized by X-diffraction measurement. Because nearly allmolecules in the crystal have the same orientation, macro-scopic measurement can directly observe single molecularproperties and quantum phenomena. The high value ofthe ground state spin of S = 10 for Mn12-ac and Fe8
makes these clusters also interesting for possible applica-tions in nanoscale magnetic devices. In order to build anydevice it is necessary to understand the strong interac-tions of the metal ions, such as spin-spatial couplings andspin-spin exchange effects. Further, the ligands and othernon-magnetic atoms are very important in stabilizing thespin configurations. In order to account for the strongligand-metal interactions and to determine the electronicand magnetic structure of a given system, first-principlesmethods allowing for electronic, charge and structural re-laxations are needed. The knowledge gained from thesecalculations can be very helpful for understanding and im-proving the systems.
One of the experimentally best studied clusters isthe Fe8-cluster with the formula [Fe8O2(OH)12(tacn)6]
8+,with tacn = C6N3H15. The cluster is particularly interest-ing because its magnetic relaxation becomes temperature
a e-mail: [email protected]
Fig. 1. The optimized geometry of the Fe8 cluster. The ballsshow the iron atoms, the arrows represent the ferrimagneticspin ordering in the cluster. The organic tacn-rings are veryimportant for stabilizing the magnetic core of the molecule andin separating the Fe8-clusters in the crystal. The hydrogens arenot shown for clarity.
independent below 0.36 K, showing for the first time apure tunneling of the magnetization [3].
The structure of the Fe8-cluster is shown in Fig. 1.The cluster found in molecular crystals has D2 symmetry.The central iron atoms are connected by hydroxo bridgesto the four outer iron ions. The spheres show the ironatoms, which are Fe(III) ions with a d5 electron config-uration. The ferrimagnetic coupling of spins between theeight Fe atoms results in a S = 10 spin ground state [4]
131
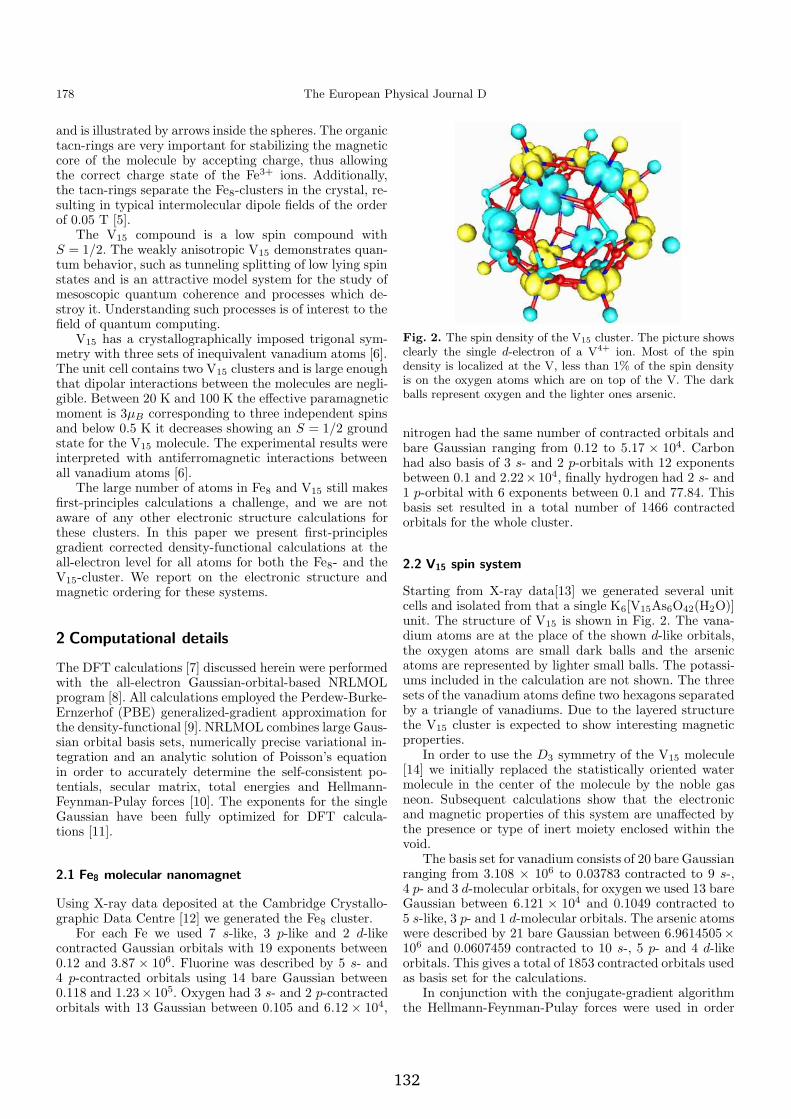
178 The European Physical Journal D
and is illustrated by arrows inside the spheres. The organictacn-rings are very important for stabilizing the magneticcore of the molecule by accepting charge, thus allowingthe correct charge state of the Fe3+ ions. Additionally,the tacn-rings separate the Fe8-clusters in the crystal, re-sulting in typical intermolecular dipole fields of the orderof 0.05 T [5].
The V15 compound is a low spin compound withS = 1/2. The weakly anisotropic V15 demonstrates quan-tum behavior, such as tunneling splitting of low lying spinstates and is an attractive model system for the study ofmesoscopic quantum coherence and processes which de-stroy it. Understanding such processes is of interest to thefield of quantum computing.
V15 has a crystallographically imposed trigonal sym-metry with three sets of inequivalent vanadium atoms [6].The unit cell contains two V15 clusters and is large enoughthat dipolar interactions between the molecules are negli-gible. Between 20 K and 100 K the effective paramagneticmoment is 3µB corresponding to three independent spinsand below 0.5 K it decreases showing an S = 1/2 groundstate for the V15 molecule. The experimental results wereinterpreted with antiferromagnetic interactions betweenall vanadium atoms [6].
The large number of atoms in Fe8 and V15 still makesfirst-principles calculations a challenge, and we are notaware of any other electronic structure calculations forthese clusters. In this paper we present first-principlesgradient corrected density-functional calculations at theall-electron level for all atoms for both the Fe8- and theV15-cluster. We report on the electronic structure andmagnetic ordering for these systems.
2 Computational details
The DFT calculations [7] discussed herein were performedwith the all-electron Gaussian-orbital-based NRLMOLprogram [8]. All calculations employed the Perdew-Burke-Ernzerhof (PBE) generalized-gradient approximation forthe density-functional [9]. NRLMOL combines large Gaus-sian orbital basis sets, numerically precise variational in-tegration and an analytic solution of Poisson’s equationin order to accurately determine the self-consistent po-tentials, secular matrix, total energies and Hellmann-Feynman-Pulay forces [10]. The exponents for the singleGaussian have been fully optimized for DFT calcula-tions [11].
2.1 Fe8 molecular nanomagnet
Using X-ray data deposited at the Cambridge Crystallo-graphic Data Centre [12] we generated the Fe8 cluster.
For each Fe we used 7 s-like, 3 p-like and 2 d-likecontracted Gaussian orbitals with 19 exponents between0.12 and 3.87 × 10⁶. Fluorine was described by 5 s- and4 p-contracted orbitals using 14 bare Gaussian between0.118 and 1.23× 10⁵. Oxygen had 3 s- and 2 p-contractedorbitals with 13 Gaussian between 0.105 and 6.12 × 10⁴,
Fig. 2. The spin density of the V15 cluster. The picture showsclearly the single d-electron of a V4+ ion. Most of the spindensity is localized at the V, less than 1% of the spin densityis on the oxygen atoms which are on top of the V. The darkballs represent oxygen and the lighter ones arsenic.
nitrogen had the same number of contracted orbitals andbare Gaussian ranging from 0.12 to 5.17 × 10⁴. Carbonhad also basis of 3 s- and 2 p-orbitals with 12 exponentsbetween 0.1 and 2.22× 10⁴, finally hydrogen had 2 s- and1 p-orbital with 6 exponents between 0.1 and 77.84. Thisbasis set resulted in a total number of 1466 contractedorbitals for the whole cluster.
2.2 V15 spin system
Starting from X-ray data[13] we generated several unitcells and isolated from that a single K6[V15As6O42(H2O)]unit. The structure of V15 is shown in Fig. 2. The vana-dium atoms are at the place of the shown d-like orbitals,the oxygen atoms are small dark balls and the arsenicatoms are represented by lighter small balls. The potassi-ums included in the calculation are not shown. The threesets of the vanadium atoms define two hexagons separatedby a triangle of vanadiums. Due to the layered structurethe V15 cluster is expected to show interesting magneticproperties.
In order to use the D3 symmetry of the V15 molecule[14] we initially replaced the statistically oriented watermolecule in the center of the molecule by the noble gasneon. Subsequent calculations show that the electronicand magnetic properties of this system are unaffected bythe presence or type of inert moiety enclosed within thevoid.
The basis set for vanadium consists of 20 bare Gaussianranging from 3.108 × 10⁶ to 0.03783 contracted to 9 s-,4 p- and 3 d-molecular orbitals, for oxygen we used 13 bareGaussian between 6.121 × 10⁴ and 0.1049 contracted to5 s-like, 3 p- and 1 d-molecular orbitals. The arsenic atomswere described by 21 bare Gaussian between 6.9614505×10⁶ and 0.0607459 contracted to 10 s-, 5 p- and 4 d-likeorbitals. This gives a total of 1853 contracted orbitals usedas basis set for the calculations.
In conjunction with the conjugate-gradient algorithmthe Hellmann-Feynman-Pulay forces were used in order
132

J. Kortus et al.: DFT studies of the molecular nanomagnet Fe8 and the V15 spin system 179
to optimize the molecular geometry. The process wasstopped after the largest nuclear gradient was smaller than0.2 eV/A. The total force was 0.28 eV/A.
3 Results and discussion
3.1 Fe8 molecular nanomagnet
In the molecular crystal [12] the positive charged Fe8-cluster is neutralized with Br atoms. We started the cal-culations with Br atoms but run in problems with an in-complete charge transfer to the Br. A density of statesplot revealed a strong peak of Br p-states at the Fermilevel. This unchemical hybridization of the Br with theFe8-cluster due to energetically to high lying Br p-statescan be attributed to problems with density-functional the-ory itself, requiring self-interaction corrections or LDA+Umethods in order to account for. Another source of theproblem could be the neglected water molecules in ourcalculations, which are present in the crystal. Calculationson a single Br-ion surrounded by water molecules showeda lowering of the Br p-states, therefore allowing for bet-ter charge transfer. The incomplete charge transfer resultsin a metallic density of states at the Fermi-level, whichcomplicates the self-consistent calculations and geometryoptimization of the cluster.
Even more problematic is a competition between theexperimental seen ferrimagnetic state with an energeti-cally close ferromagnetic state with also S = 10. UsingBr atoms we could stabilize the ferrimagnetic state onlyby applying a small external potential on the Fe atomsfavoring the ferrimagnetic state.
Due to these reasons we replaced the Br with F atoms,which are more electro-negative allowing for better chargetransfer. With the F atoms the calculations converged tothe experimental found ferrimagnetic state with S = 10[4] without an external potential.
More recent experiments by Pontillon et al. [15] con-firm the ferrimagnetic ordering and find smaller local mo-ments at the two iron atoms with the minority spins thanon the iron atoms with majority spins.
In order to calculate the local moments, we placed asphere of 1.32 A around each iron and calculated the spindensity inside the sphere. Some charge will not be includedin the sphere, and this approximation will give only a lowerestimate for the local moments and charge states.
For the two iron atoms with minority spins we ob-tain a moment of −3.6µB, whereas the majority spin ironshave moments 3.8µB and 3.9µB. These local moments aresmaller than expected for Fe(III) which can be attributedto spin density outside the sphere. A plot of the spin den-sity confirms the right spin-polarization of the irons byshowing a spherical spin density around the Fe as expectedfor a closed shell d5 electron configuration.
3.2 V15 spin system
The plot of the spin density in Fig. 2 clearly shows the lo-calization of moment on the vanadium atoms. Even more,
−10 −7.5 −5 −2.5 0ENERGY (eV)
MIN
OR
ITY
DO
SM
AJO
RIT
Y D
OS
Total
All V 3d
Inner V 3d
Oxygen 2p
Total
All V 3d
Inner V 3d
Oxygen 2p
Fig. 3. Electronic density of states (DOS) broadened by0.54 eV of V15 in a spin S = 3/2 configuration. For each spinthe total DOS, the projected DOS of all V(3d), the projectedDOS of the three V(3d) forming the inner triangle and theprojected O(2p) are presented. The vertical line divides the oc-cupied and unoccupied states. Units are arbitrary, but the samescale has been used for all projected DOS plots.
it clearly displays the d-character as expected for a V4+-ion with a single d-electron, showing that our calculationreproduce the proper charge state of the vanadiums. Thespin configuration shown in Fig. 2 has a total spin S = 1/2and is also the lowest energy DFT spin configuration. Thisspin configuration was found by a coupled multilevel anal-ysis which relies on fitting density-functional energies tomean-field Heisenberg energies [16].
The quantum mechanical ground state will be a su-perposition of all S = 1/2 states, therefore the obtainedspin configuration from our DFT calculations can not becompared directly with experiment. Nevertheless, our re-sults are essentially in agreement with the experimentallyfound S = 1/2 ground state [17] of the V15 cluster.
Figure 3 displays the density of states for a spin S =3/2 configuration with ferromagnetically aligned spins inthe inner triangle and antiferromagnetically coupled spinsin top and bottom hexagons. This low-energy spin config-uration becomes important at temperatures above 20 Kand below 80 K.
For each spin the DOS is decomposed into the 3d con-tributions of all vanadium atoms (All V 3d) and the 2pcontributions of oxygen (Oxygen 2p). The vanadium DOSis further decomposed into the 3d contribution of the vana-diums (Inner V 3d) forming the inner triangle betweenthe two hexagons. The projected density of states clearlyshows that the states near the Fermi level are 3d statesfrom the vanadium atoms.
Further, by comparing the majority and minority con-tributions of the vanadiums forming the inner triangle, it
133

180 The European Physical Journal D
Table 1. Highest occupied molecular orbital (HOMO), lowestunoccupied molecular orbital (LUMO) and spin gaps ∆ for theV15 molecule in the spin S = 3/2 state. All energies are givenin eV.
HOMO LUMO ∆
Majority spin −3.369 −2.159 1.210
Minority spin −3.440 −2.412 1.082
is clear that these three vanadiums are aligned ferromag-netically since they only contribute to the majority DOS.
Further, most of the DOS in the majority DOS comesfrom these atoms. The states due to the V atoms atthe Fermi level are well localized and do not show hy-bridization with other atoms such as oxygen. This indi-cates mainly ionic bonding, which is supported by ourlocal moments for the vanadium atoms of 0.97µB, close tothe moment of a VIV ion. The DOS for the arsenic atomsis not shown, because there are no significant contribu-tions.
In Table 1 we present the highest occupied molecularorbital (HOMO) and lowest unoccupied molecular orbital(LUMO) for the majority and minority spin channel to-gether with the resulting spin gaps.
In order to estimate local moments we placed spheresaround the atoms and calculated the spin densities insidethe spheres. The only significant moments are located onthe vanadium atoms, the largest other moments are atoxygen atoms with about 0.06µB. The sphere radius forthe vanadium atoms was 1.32 A. The vanadium atomsforming the two hexagons are coupled antiferromagneti-cally with local moments of −0.88µB and 0.85µB insidethe sphere. The vanadium atoms forming the middle tri-angle are ferromagnetically ordered with a local momentof 0.97µB. This result agrees well with the measurementsabove 20 K, that the spins in the triangle are localizedspins on the vanadiums acting independently.
For the S = 1/2 spin configuration displayed in Fig. 2,the moments in the spheres do not change not signifi-cantly. They are less than 4% smaller than for the S = 3/2configuration.
4 Conclusion
We performed first-principles gradient corrected density-functional calculation at the all-electron level on theexperimentally interesting molecular nanomagnet Fe8 andthe spin system V15. The magnetic ordering obtained fromour calculations agrees well with experimental found mag-netic orderings in these clusters. The local moments foundfor the Fe8-cluster confirms recent experimental findingsfrom polarized neutron scattering. In case of V15 we are
able to describe different spin configurations. Our findingsare in good agreement with experiments.
Electronic structure calculations can give insight in themagnetic interaction and help in understanding experi-ment. The information obtained here can be used directlyfor interpretation of polarized neutron scattering exper-iments and finding the charge state of the metal ions.Much more experimental relevant information has beenobtained from our calculations as magnetic anisotropy en-ergies, orbital moments, Heisenberg exchange parameters,hyperfine fields and vibrational properties. These will bereported elsewhere.
This work was supported in part by ONR grant N00014-98WX20709 and N0001400AF00002. Computations were per-formed at the DoD Major Shared Resource Centers.
References
1. J. Friedman, M.P. Sarachik, J. Tejeda, J. Maciejewski, R.Ziolo, Phys. Rev. Lett. 76, 3820 (1996); L. Thomas, F.Lionti, R. Ballou, D. Gatteschi, R. Sessoli, B. Barbara,Nature 383, 145 (1996).
2. C. Sangregorio, T. Ohm, C. Paulsen, R. Sessoli, D.Gatteschi, Phys. Rev. Lett. 78, 4645 (1997).
3. W. Wernsdorfer, R. Sessoli, Science 284, 133 (1999).4. R. Caciuffo, G. Amoretti, A. Murani, R. Sessoli, A.
Caneschi, D. Gatteschi, Phys. Rev. Lett. 81, 4744 (1998).5. W. Wernsdorfer, T. Ohm, C. Sangregorio, R. Sessoli, D.
Mailly, C. Paulsen, Phys. Rev. Lett. 82, 3903 (1999).6. D. Gatteschi, L. Pardi, A.L. Barra, A. Muller, J.
Doring, Nature 354, 463 (1991).7. P. Hohenberg, W. Kohn, Phys. Rev. 136, B864 (1964); W.
Kohn, L.J. Sham, Phys. Rev. 140, A1133 (1965).8. M.R. Pederson, K.A. Jackson, Phys. Rev. B 41, 7453
(1990); K.A. Jackson, M.R. Pederson, Phys. Rev. B 42,3276 (1990).
9. J.P. Perdew, K. Burke, M. Ernzerhof, Phys. Rev. Lett. 77,3865 (1996).
10. H. Hellmann, Einfuhrung in die Quantentheorie (Deuticke,Leipzig, 1937); R.P. Feynman, Phys. Rev. 56, 340 (1939);P. Pulay, Mol. Phys. 17, 197 (1969).
11. D. Porezag, M.R. Pederson, Phys. Rev. A 60, 2840 (1999).12. K. Wieghardt, K. Pohl, I. Jibril, G. Huttner Angew.
Chem., Int. Ed. Engl. 23, 77 (1984); CambridgeCrystallographic Data Centre; Refcode: COCNAJ;http://www.ccdc.cam.ac.uk/
13. A. Muller, J. Doring, Z. Anorg. Allg. Chem. 595, 251(1991).
14. A. Muller, J. Doring, Angew. Chem. Int. Ed. 27, 1721(1988).
15. Y. Pontillon, A. Caneschi, D. Gatteschi, R. Sessoli, E.Ressouche, J. Schweizer, E. Lelievre-Berna, J. Am. Chem.Soc. 121, 5342 (1999).
16. J. Kortus, C.S. Hellberg, M.R. Pederson, Phys. Rev. Lett.86, 3400 (2001).
17. I. Chiorescu, W. Wernsdorfer, A. Muller, H. Bogge, B.Barbara, Phys. Rev. Lett. 84, 3454 (2000).
134
Appendix K
Kortus J., Baruah T., Bernstein N.,and Pederson M.R.
Magnetic ordering, electronic structure
and magnetic anisotropy energy in the
high-spin Mn &/. single molecule magnet
Phys. Rev. B 66, 092403-1/4 (2002)
135

136
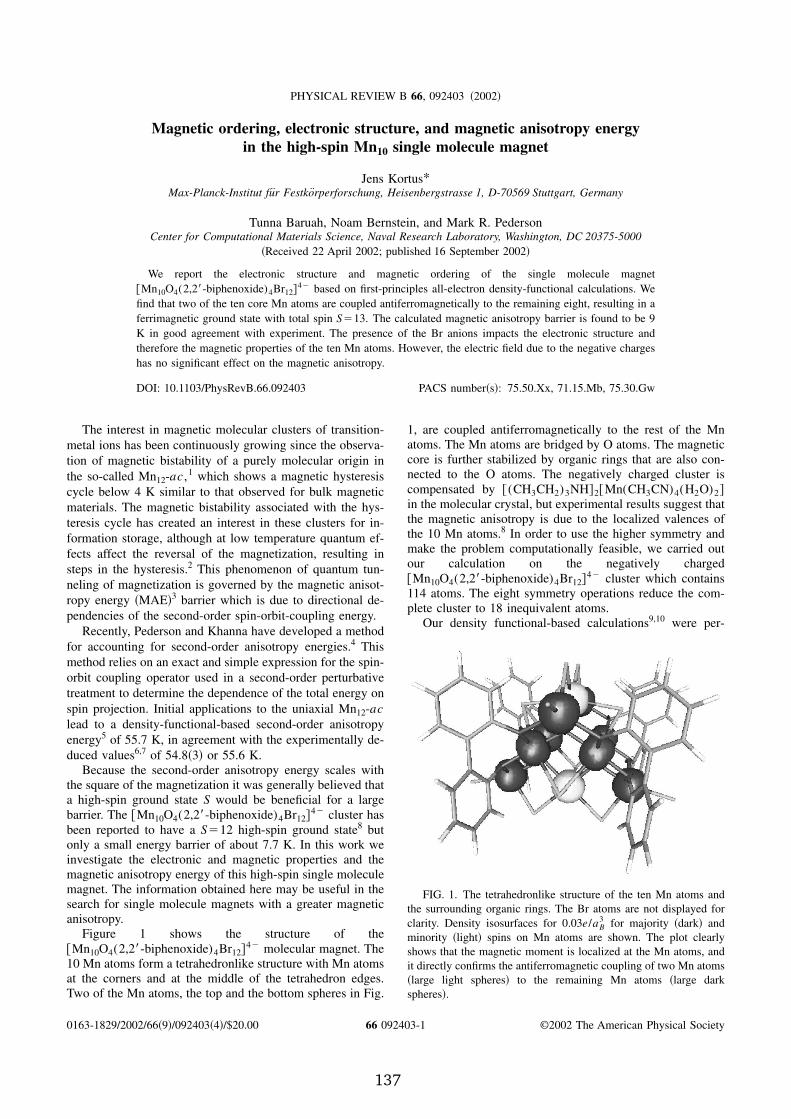
Magnetic ordering, electronic structure, and magnetic anisotropy energyin the high-spin Mn10 single molecule magnet
Jens Kortus*Max-Planck-Institut fur Festkorperforschung, Heisenbergstrasse 1, D-70569 Stuttgart, Germany
Tunna Baruah, Noam Bernstein, and Mark R. PedersonCenter for Computational Materials Science, Naval Research Laboratory, Washington, DC 20375-5000
~Received 22 April 2002; published 16 September 2002!
We report the electronic structure and magnetic ordering of the single molecule magnet@Mn10O4(2,28-biphenoxide)4Br12#
42 based on first-principles all-electron density-functional calculations. Wefind that two of the ten core Mn atoms are coupled antiferromagnetically to the remaining eight, resulting in aferrimagnetic ground state with total spin S513. The calculated magnetic anisotropy barrier is found to be 9K in good agreement with experiment. The presence of the Br anions impacts the electronic structure andtherefore the magnetic properties of the ten Mn atoms. However, the electric field due to the negative chargeshas no significant effect on the magnetic anisotropy.
DOI: 10.1103/PhysRevB.66.092403 PACS number~s!: 75.50.Xx, 71.15.Mb, 75.30.Gw
The interest in magnetic molecular clusters of transition-metal ions has been continuously growing since the observa-tion of magnetic bistability of a purely molecular origin inthe so-called Mn12-ac ,1 which shows a magnetic hysteresiscycle below 4 K similar to that observed for bulk magneticmaterials. The magnetic bistability associated with the hys-teresis cycle has created an interest in these clusters for in-formation storage, although at low temperature quantum ef-fects affect the reversal of the magnetization, resulting insteps in the hysteresis.2 This phenomenon of quantum tun-neling of magnetization is governed by the magnetic anisot-ropy energy ~MAE!3 barrier which is due to directional de-pendencies of the second-order spin-orbit-coupling energy.
Recently, Pederson and Khanna have developed a methodfor accounting for second-order anisotropy energies.4 Thismethod relies on an exact and simple expression for the spin-orbit coupling operator used in a second-order perturbativetreatment to determine the dependence of the total energy onspin projection. Initial applications to the uniaxial Mn12-aclead to a density-functional-based second-order anisotropyenergy5 of 55.7 K, in agreement with the experimentally de-duced values6,7 of 54.8~3! or 55.6 K.
Because the second-order anisotropy energy scales withthe square of the magnetization it was generally believed thata high-spin ground state S would be beneficial for a largebarrier. The @Mn10O4(2,28-biphenoxide)4Br12#
42 cluster hasbeen reported to have a S512 high-spin ground state8 butonly a small energy barrier of about 7.7 K. In this work weinvestigate the electronic and magnetic properties and themagnetic anisotropy energy of this high-spin single moleculemagnet. The information obtained here may be useful in thesearch for single molecule magnets with a greater magneticanisotropy.
Figure 1 shows the structure of the@Mn10O4(2,28-biphenoxide)4Br12#
42 molecular magnet. The10 Mn atoms form a tetrahedronlike structure with Mn atomsat the corners and at the middle of the tetrahedron edges.Two of the Mn atoms, the top and the bottom spheres in Fig.
1, are coupled antiferromagnetically to the rest of the Mnatoms. The Mn atoms are bridged by O atoms. The magneticcore is further stabilized by organic rings that are also con-nected to the O atoms. The negatively charged cluster iscompensated by @(CH3CH2)3NH#2@Mn(CH3CN)4(H2O)2#in the molecular crystal, but experimental results suggest thatthe magnetic anisotropy is due to the localized valences ofthe 10 Mn atoms.8 In order to use the higher symmetry andmake the problem computationally feasible, we carried outour calculation on the negatively charged@Mn10O4(2,28-biphenoxide)4Br12#
42 cluster which contains114 atoms. The eight symmetry operations reduce the com-plete cluster to 18 inequivalent atoms.
Our density functional-based calculations9,10 were per-
FIG. 1. The tetrahedronlike structure of the ten Mn atoms andthe surrounding organic rings. The Br atoms are not displayed forclarity. Density isosurfaces for 0.03e/aB
3 for majority ~dark! andminority ~light! spins on Mn atoms are shown. The plot clearlyshows that the magnetic moment is localized at the Mn atoms, andit directly confirms the antiferromagnetic coupling of two Mn atoms~large light spheres! to the remaining Mn atoms ~large darkspheres!.
PHYSICAL REVIEW B 66, 092403 ~2002!
0163-1829/2002/66~9!/092403~4!/$20.00 ©2002 The American Physical Society66 092403-1
137
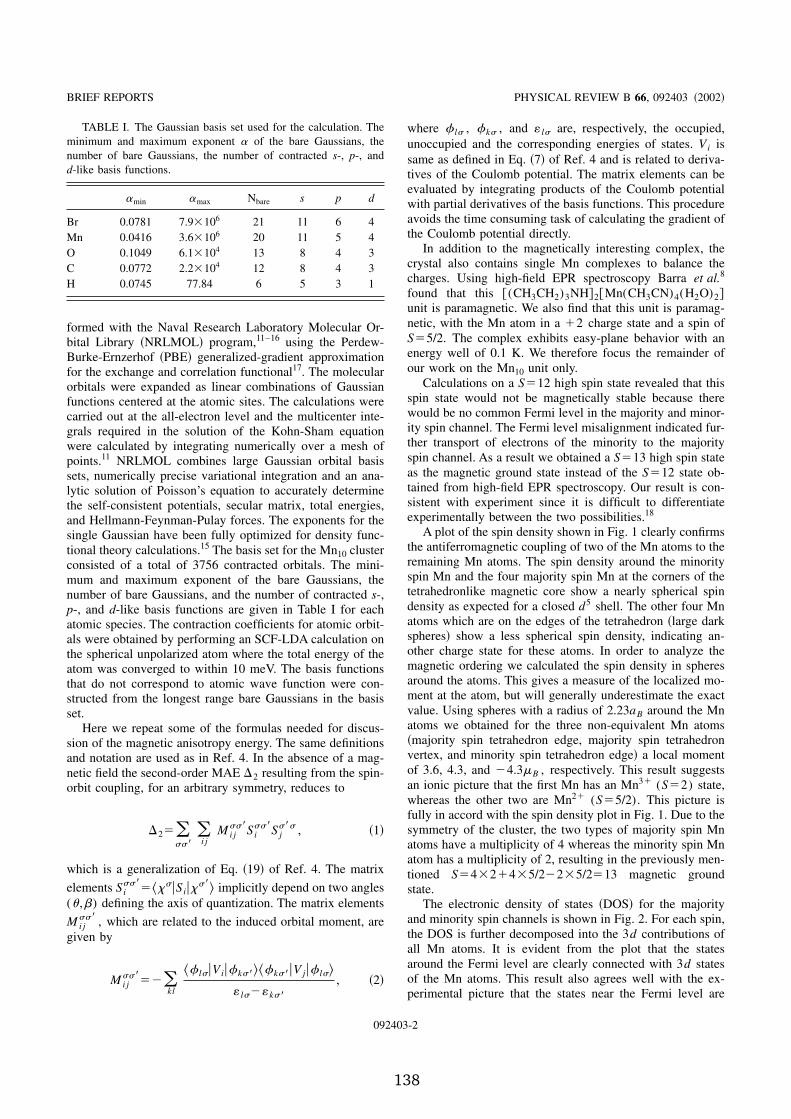
formed with the Naval Research Laboratory Molecular Or-bital Library ~NRLMOL! program,11–16 using the Perdew-Burke-Ernzerhof ~PBE! generalized-gradient approximationfor the exchange and correlation functional17. The molecularorbitals were expanded as linear combinations of Gaussianfunctions centered at the atomic sites. The calculations werecarried out at the all-electron level and the multicenter inte-grals required in the solution of the Kohn-Sham equationwere calculated by integrating numerically over a mesh ofpoints.11 NRLMOL combines large Gaussian orbital basissets, numerically precise variational integration and an ana-lytic solution of Poisson’s equation to accurately determinethe self-consistent potentials, secular matrix, total energies,and Hellmann-Feynman-Pulay forces. The exponents for thesingle Gaussian have been fully optimized for density func-tional theory calculations.15 The basis set for the Mn10 clusterconsisted of a total of 3756 contracted orbitals. The mini-mum and maximum exponent of the bare Gaussians, thenumber of bare Gaussians, and the number of contracted s-,p-, and d-like basis functions are given in Table I for eachatomic species. The contraction coefficients for atomic orbit-als were obtained by performing an SCF-LDA calculation onthe spherical unpolarized atom where the total energy of theatom was converged to within 10 meV. The basis functionsthat do not correspond to atomic wave function were con-structed from the longest range bare Gaussians in the basisset.
Here we repeat some of the formulas needed for discus-sion of the magnetic anisotropy energy. The same definitionsand notation are used as in Ref. 4. In the absence of a mag-netic field the second-order MAE D2 resulting from the spin-orbit coupling, for an arbitrary symmetry, reduces to
D25(ss8
(i j
M i jss8S i
ss8S js8s , ~1!
which is a generalization of Eq. ~19! of Ref. 4. The matrixelements S i
ss85^xsuS iux
s8& implicitly depend on two angles(u ,b) defining the axis of quantization. The matrix elementsM i j
ss8 , which are related to the induced orbital moment, aregiven by
M i jss8
52(kl
^f lsuV iufks8&^fks8uV juf ls&
« ls2«ks8
, ~2!
where f ls , fks , and « ls are, respectively, the occupied,unoccupied and the corresponding energies of states. V i issame as defined in Eq. ~7! of Ref. 4 and is related to deriva-tives of the Coulomb potential. The matrix elements can beevaluated by integrating products of the Coulomb potentialwith partial derivatives of the basis functions. This procedureavoids the time consuming task of calculating the gradient ofthe Coulomb potential directly.
In addition to the magnetically interesting complex, thecrystal also contains single Mn complexes to balance thecharges. Using high-field EPR spectroscopy Barra et al.8
found that this @(CH3CH2)3NH#2@Mn(CH3CN)4(H2O)2#unit is paramagnetic. We also find that this unit is paramag-netic, with the Mn atom in a 12 charge state and a spin ofS55/2. The complex exhibits easy-plane behavior with anenergy well of 0.1 K. We therefore focus the remainder ofour work on the Mn10 unit only.
Calculations on a S512 high spin state revealed that thisspin state would not be magnetically stable because therewould be no common Fermi level in the majority and minor-ity spin channel. The Fermi level misalignment indicated fur-ther transport of electrons of the minority to the majorityspin channel. As a result we obtained a S513 high spin stateas the magnetic ground state instead of the S512 state ob-tained from high-field EPR spectroscopy. Our result is con-sistent with experiment since it is difficult to differentiateexperimentally between the two possibilities.18
A plot of the spin density shown in Fig. 1 clearly confirmsthe antiferromagnetic coupling of two of the Mn atoms to theremaining Mn atoms. The spin density around the minorityspin Mn and the four majority spin Mn at the corners of thetetrahedronlike magnetic core show a nearly spherical spindensity as expected for a closed d5 shell. The other four Mnatoms which are on the edges of the tetrahedron ~large darkspheres! show a less spherical spin density, indicating an-other charge state for these atoms. In order to analyze themagnetic ordering we calculated the spin density in spheresaround the atoms. This gives a measure of the localized mo-ment at the atom, but will generally underestimate the exactvalue. Using spheres with a radius of 2.23aB around the Mnatoms we obtained for the three non-equivalent Mn atoms~majority spin tetrahedron edge, majority spin tetrahedronvertex, and minority spin tetrahedron edge! a local momentof 3.6, 4.3, and 24.3mB , respectively. This result suggestsan ionic picture that the first Mn has an Mn31 (S52) state,whereas the other two are Mn21 (S55/2). This picture isfully in accord with the spin density plot in Fig. 1. Due to thesymmetry of the cluster, the two types of majority spin Mnatoms have a multiplicity of 4 whereas the minority spin Mnatom has a multiplicity of 2, resulting in the previously men-tioned S54321435/22235/2513 magnetic groundstate.
The electronic density of states ~DOS! for the majorityand minority spin channels is shown in Fig. 2. For each spin,the DOS is further decomposed into the 3d contributions ofall Mn atoms. It is evident from the plot that the statesaround the Fermi level are clearly connected with 3d statesof the Mn atoms. This result also agrees well with the ex-perimental picture that the states near the Fermi level are
TABLE I. The Gaussian basis set used for the calculation. Theminimum and maximum exponent a of the bare Gaussians, thenumber of bare Gaussians, the number of contracted s-, p-, andd-like basis functions.
amin amax Nbare s p d
Br 0.0781 7.93106 21 11 6 4Mn 0.0416 3.63106 20 11 5 4O 0.1049 6.13104 13 8 4 3C 0.0772 2.23104 12 8 4 3H 0.0745 77.84 6 5 3 1
BRIEF REPORTS PHYSICAL REVIEW B 66, 092403 ~2002!
092403-2
138
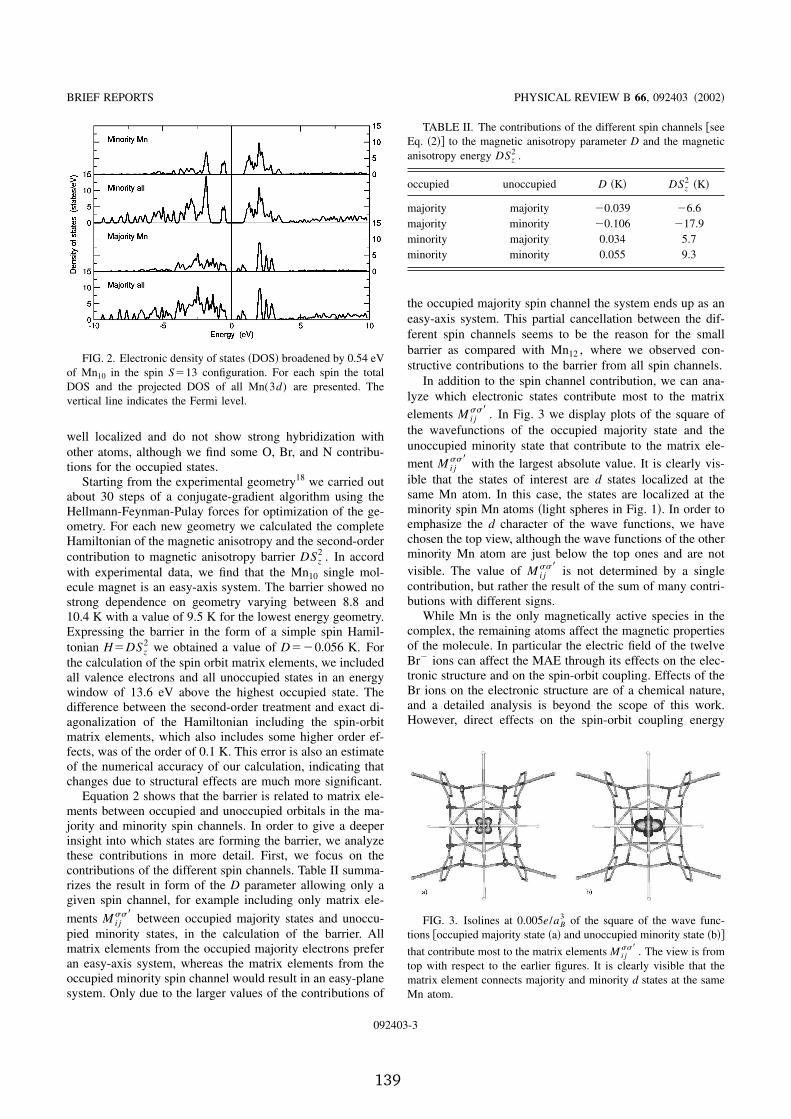
well localized and do not show strong hybridization withother atoms, although we find some O, Br, and N contribu-tions for the occupied states.
Starting from the experimental geometry18 we carried outabout 30 steps of a conjugate-gradient algorithm using theHellmann-Feynman-Pulay forces for optimization of the ge-ometry. For each new geometry we calculated the completeHamiltonian of the magnetic anisotropy and the second-ordercontribution to magnetic anisotropy barrier DSz
2 . In accordwith experimental data, we find that the Mn10 single mol-ecule magnet is an easy-axis system. The barrier showed nostrong dependence on geometry varying between 8.8 and10.4 K with a value of 9.5 K for the lowest energy geometry.Expressing the barrier in the form of a simple spin Hamil-tonian H5DSz
2 we obtained a value of D520.056 K. Forthe calculation of the spin orbit matrix elements, we includedall valence electrons and all unoccupied states in an energywindow of 13.6 eV above the highest occupied state. Thedifference between the second-order treatment and exact di-agonalization of the Hamiltonian including the spin-orbitmatrix elements, which also includes some higher order ef-fects, was of the order of 0.1 K. This error is also an estimateof the numerical accuracy of our calculation, indicating thatchanges due to structural effects are much more significant.
Equation 2 shows that the barrier is related to matrix ele-ments between occupied and unoccupied orbitals in the ma-jority and minority spin channels. In order to give a deeperinsight into which states are forming the barrier, we analyzethese contributions in more detail. First, we focus on thecontributions of the different spin channels. Table II summa-rizes the result in form of the D parameter allowing only agiven spin channel, for example including only matrix ele-ments M i j
ss8 between occupied majority states and unoccu-pied minority states, in the calculation of the barrier. Allmatrix elements from the occupied majority electrons preferan easy-axis system, whereas the matrix elements from theoccupied minority spin channel would result in an easy-planesystem. Only due to the larger values of the contributions of
the occupied majority spin channel the system ends up as aneasy-axis system. This partial cancellation between the dif-ferent spin channels seems to be the reason for the smallbarrier as compared with Mn12 , where we observed con-structive contributions to the barrier from all spin channels.
In addition to the spin channel contribution, we can ana-lyze which electronic states contribute most to the matrixelements M i j
ss8 . In Fig. 3 we display plots of the square ofthe wavefunctions of the occupied majority state and theunoccupied minority state that contribute to the matrix ele-ment M i j
ss8 with the largest absolute value. It is clearly vis-ible that the states of interest are d states localized at thesame Mn atom. In this case, the states are localized at theminority spin Mn atoms ~light spheres in Fig. 1!. In order toemphasize the d character of the wave functions, we havechosen the top view, although the wave functions of the otherminority Mn atom are just below the top ones and are notvisible. The value of M i j
ss8 is not determined by a singlecontribution, but rather the result of the sum of many contri-butions with different signs.
While Mn is the only magnetically active species in thecomplex, the remaining atoms affect the magnetic propertiesof the molecule. In particular the electric field of the twelveBr2 ions can affect the MAE through its effects on the elec-tronic structure and on the spin-orbit coupling. Effects of theBr ions on the electronic structure are of a chemical nature,and a detailed analysis is beyond the scope of this work.However, direct effects on the spin-orbit coupling energy
FIG. 2. Electronic density of states ~DOS! broadened by 0.54 eVof Mn10 in the spin S513 configuration. For each spin the totalDOS and the projected DOS of all Mn(3d) are presented. Thevertical line indicates the Fermi level.
TABLE II. The contributions of the different spin channels @seeEq. ~2!# to the magnetic anisotropy parameter D and the magneticanisotropy energy DSz
2 .
occupied unoccupied D ~K! DSz2 ~K!
majority majority 20.039 26.6majority minority 20.106 217.9minority majority 0.034 5.7minority minority 0.055 9.3
FIG. 3. Isolines at 0.005e/aB3 of the square of the wave func-
tions @occupied majority state ~a! and unoccupied minority state ~b!#
that contribute most to the matrix elements M i jss8 . The view is from
top with respect to the earlier figures. It is clearly visible that thematrix element connects majority and minority d states at the sameMn atom.
BRIEF REPORTS PHYSICAL REVIEW B 66, 092403 ~2002!
092403-3
139
could raise the possibility that even small variations in thepositions of these ions could affect the magnetic propertiesof the molecule.
To measure the effects of the Br2 ions on the electronicstructure we repeated the calculations with various subsets ofthe Br2 ions. For each removed Br we also removed an extraelectron, keeping the remaining molecule isoelectronic withthe original complex. For these systems with either zero,four, or eight Br atoms, we observed a range of behaviors. Insome cases the electronic structure near the Fermi level wassimilar to the original molecule, although it never showedtruly rigid-band-like behavior. In other cases, however, theelectronic structure changed significantly, sometimes com-pletely closing the HOMO-LUMO gap. Associated withthese electronic structure changes were large changes in theMAE, including changes in the magnitude of the anisotropybarrier, as well as instances of changes to an easy-planesystem.
To measure the direct effect of the electric field of the Brions on the spin-orbit coupling, external Coulomb potentialswhich acted to cancel the long range affects of the Br anionswere added and the spin-orbit interaction and magnetic an-isotropy were recomputed. This neutralized the electric fielddue to the Br2 ions near the Mn sites without changing theelectronic structure of the molecule. We tested the effectswith neutralizing charge distributions of various widths, andby neutralizing four, eight, or all twelve Br anions. The MAEchanged by less than 1 K in all of these calculations. We
therefore conclude that the electric fields created by the Br2
ions do not have a significant effect on the magnetic proper-ties of the molecule.
In conclusion, we present a study of the electronic andmagnetic properties of the Mn10 single molecule magnet. Weconfirm the experimentally suggested magnetic ordering, al-though we find that a state with S513 is the magneticground state in contrast to the S512 state suggested fromhigh field EPR measurements8. In agreement with experi-ment we find the Mn10 unit is an easy-axis system with asmall barrier of 9.5 K and the compensating cluster in themolecular crystal, which has one Mn atom with S55/2, is aneasy plane system with a MAE of 0.1 K, negligible com-pared with the Mn10 unit. We show that the magnetic anisot-ropy is determined by a competition between different spinchannels involved. This competition is the main reason forthe small barrier observed. The electric field caused by thenegative charges of Br anions has no significant direct effecton the spin-orbit coupling or the MAE, although their chemi-cal interactions do have significant effect on the electronicstructure and therefore on the MAE. The states most impor-tant for the magnetic anisotropy energy involve transitionsbetween occupied majority and unoccupied minority d statesat the same Mn atom.
J.K. would like to thank the Schloeßmann Foundation forfinancial support and R. Sessoli for helpful discussions. Thework was partially supported by the Office of Naval Re-search and the DOD HPCMO.
*Electronic address: [email protected] R. Sessoli, D. Gatteschi, A. Caneschi, and M.A. Novak, Nature
~London! 365, 141 ~1993!.2 J. Friedman, M.P. Sarachik, J. Tejeda, J. Maciejewski, and R.
Ziolo, Phys. Rev. Lett. 76, 3830 ~1996!; L. Thomas, F. Lionti, R.Ballou, D. Gatteschi, R. Sessoli, and B. Barbara, Nature ~Lon-don! 383, 145 ~1996!.
3 J. Van Vleck, Phys. Rev. 52, 1178 ~1937!.4 M.R. Pederson and S.N. Khanna, Phys. Rev. B 60, 9566 ~1999!.5 M.R. Pederson and S.N. Khanna, Chem. Phys. Lett. 307, 253
~1999!; M.R. Pederson and S.N. Khanna, Phys. Rev. B 59, R693~1999!.
6 K.M. Mertes, Y. Suzuki, M.P. Sarachik, Y. Paltiel, H. Shtrikman,E. Zeldov, E. Rumberger, D.N. Hendrickson, and G. Christou,Phys. Rev. Lett. 87, 227205 ~2001!.
7 A.L. Barra, D. Gatteschi, and R. Sessoli, Phys. Rev. B 56, 8192
~1997!.8 A.L. Barra, A. Caneschi, D. Gatteschi, D.P. Goldberg, and R.
Sessoli, J. Solid State Chem. 145, 484 ~1999!.9 P. Hohenberg and W. Kohn, Phys. Rev. 136, B864 ~1964!.
10 W. Kohn and L.J. Sham, Phys. Rev. 140, A1133 ~1965!.11 M.R. Pederson and K.A. Jackson, Phys. Rev. B 41, 7453 ~1990!.12 K.A. Jackson and M.R. Pederson, Phys. Rev. B 42, 3276 ~1990!.13 A. Briley, M.R. Pederson, K.A. Jackson, D.C. Patton, and D.V.
Porezag, Phys. Rev. B 58, 1786 ~1998!.14 D.V. Porezag and M.R. Pederson, Phys. Rev. B 54, 7830 ~1996!.15 D.V. Porezag and M.R. Pederson, Phys. Rev. A 60, 2840 ~1999!.16 M.R. Pederson, D.V. Porezag, J. Kortus, and D.C. Patton, Phys.
Status Solidi B 217, 197 ~2000!.17 J.P. Perdew, K. Burke, and M. Ernzerhof, Phys. Rev. Lett. 77,
3865 ~1996!.18 R. Sessoli ~private communication!.
BRIEF REPORTS PHYSICAL REVIEW B 66, 092403 ~2002!
092403-4
140

Appendix L
Kortus J., Hellberg C. S. and PedersonM. R.
Hamiltonian of the V &/, Spin System
from First-Principles
Density-Functional Calculations
Phys. Rev. Lett. 86, 3400-3403(2001)
141

142
VOLUME 86, NUMBER 15 P H Y S I C A L R E V I E W L E T T E R S 9 APRIL 2001
Hamiltonian of the V15 Spin System from First-Principles Density-Functional Calculations
Jens Kortus,* C. Stephen Hellberg, and Mark R. Pederson
Center for Computational Materials Science, Code 6390, Naval Research Laboratory, Washington, D.C. 20375(Received 11 July 2000)
We report first-principles all-electron density-functional-based studies of the electronic structure, mag-netic ordering, and anisotropy for the V15 molecular magnet. From these calculations, we determinea Heisenberg Hamiltonian with five antiferromagnetic and one ferromagnetic exchange couplings. Weperform direct diagonalization to determine the temperature dependence of the susceptibility. This Ham-iltonian reproduces the experimentally observed spin S � 1�2 ground state and low-lying S � 3�2
excited state. A small anisotropy term is necessary to account for the temperature independent part ofthe magnetization curve.
DOI: 10.1103/PhysRevLett.86.3400 PACS numbers: 75.50.Xx, 75.30.Et, 75.30.Gw, 75.45.+j
With the continued interest in the fabrication andoptimization of miniaturized magnetic devices [1], futuredesign considerations will require an understanding ofnanoscale magnetic systems. In order to transition suchmaterials into simple devices it is necessary to be ableto explain how interactions such as spin-spatial couplingand spin-spin exchange effects may couple collectivelyto create a seemingly single-spin system. Further, it isnecessary to determine the temperature range at whichsuch systems will indeed behave collectively. In generalthe properties of a nanoscale system of coupled spinsdepend directly on the strength of the exchange parame-ters and on the size and sign of the anisotropy energydue to spin-orbit coupling. While these parameters aregenerally determined by the transition metal atoms, theligands and other nonmagnetic atoms are responsible forstabilizing the array of spins. Requisite to a completecomputational understanding of such spin systems is theability to account for the strong ligand-metal interactionsand to determine whether the behavior of a given spinsystem is mainly mediated by the anisotropy, by spin-spincoupling, or by a combination of the two.
Recently, the Mn12-acetate and Fe8 molecules [2] haveattracted considerable interest because they behave as high-single-spin systems (total spin S � 10) at temperatureranges on the order of 20–60 K. Because of their largemagnetomolecular anisotropy energy these systems retaintheir moment orientation at reasonably high temperaturesand exhibit the phenomena of resonant tunneling of mag-netization at well defined magnetic fields [3,4].
The K6�V15As6O42�H2O��8H2O molecular crystal, firstsynthesized by Müller and Döring [5,6], represents atransition-metal spin system in the same size regimeas the Mn12 and Fe8 molecular crystals. In contrast toMn12 and Fe8 molecules, the V15 molecule is thoughtto behave as a weakly anisotropic magnet composed of15 spin s � 1�2 particles which couple together to form amolecule with a total spin S � 1�2 ground state. Besidesthe fundamental interest in understanding quantum effectsin these nanomagnets, they might be also relevant for im-plementations of quantum computers [7]. Calculations on
such correlated systems present a challenge to mean-fieldframeworks such as density-functional theory because it isoften not possible to construct a single collinear referencestate which preserves the inherent symmetry of the systemand has the correct spin quantum numbers.
This work utilizes an efficient coupled multilevel analy-sis which relies on fitting density-functional energies tomean-field Heisenberg or Ising energies in order to deter-mine the exchange parameters. The approximate exchangeparameters gleaned from the first N Ising configurationswere used to find the next lowest energy Ising configura-tion and subsequently to improve the parametrization ofthe exchange parameters. “Self-consistency” of this ap-proach is determined when the predicted Ising levels areunchanged by the addition of data from new Ising configu-rations. The coupling of the density-functional methodto a classical Ising representation allowed us to determinethe exchange parameters by considering only several spinconfigurations. Further, the resulting ground-state spinconfiguration within density-functional theory exhibits thecorrect spin projection of 1�2. With the exchange parame-ters determined, we diagonalize the complete many-bodyHeisenberg Hamiltonian to calculate the susceptibility andspin correlation functions for comparison with experiment.The many-body basis is complete, so all states are al-lowed including noncollinear spin arrangements and quan-tum disordered phases [8].
Starting from x-ray data [9] we generated several unitcells and isolated a single K6�V15As6O42�H2O�� unit. Inorder to optimize the geometry within the quasi- D3 sym-metry of the V15 molecule [5], we initially replaced thestatistically oriented water molecule at the center of themolecule by a neon atom and used an S � 3�2 spin con-figuration which does not break the crystallographic sym-metry. The Ising configuration of this molecule consists ofthree aligned spin- 1
2 V atoms in the triangle and equivalentupper and lower hexagons composed of a ring of antifer-romagnetically (AF) coupled spin- 1
2 V atoms.The geometry of the molecule was then optimized within
the all-electron density-functional methodology using thegeneralized-gradient approximation (GGA) [10]. The
3400 0031-9007�01�86(15)�3400(4)$15.00 © 2001 The American Physical Society
143

VOLUME 86, NUMBER 15 P H Y S I C A L R E V I E W L E T T E R S 9 APRIL 2001
calculations were performed with the Naval ResearchLaboratory Molecular Orbital Library (NRLMOL) [11].Calculations on 49 geometrical configurations were per-formed during the conjugate-gradient relaxation of themolecule. Subsequent calculations show that the geomet-rical, electronic, and magnetic properties of this systemare unaffected by the presence or type of inert moietyenclosed within the void. Using this geometry, we per-formed eleven additional calculations on different spinconfigurations (see Table I) to determine the six exchangeparameters (J 0s) of the Heisenberg Hamiltonian
H �
XJijSi ? Sj , (1)
as well as the spin configuration of the density-functionalground state [8]. The J 0s used in the above Hamiltonianare defined according to Fig. 1. As shown in Table I,we have included high-spin configurations (XI, XII,XIII), which generally have some symmetry as well aslower-spin nonsymmetric configurations. The energy forthe high-spin S � 15�2 ferromagnetic (FM) state (XIII) of873 meV is predominantly caused by a large AF exchangecoupling (J) between the most closely bonded hexagonalV atoms. However, the 113 meV splitting between theS � 9�2 and S � 15�2 states (XII and XIII) shows thatthere is a reasonably strong AF coupling, approximately18 meV on average, between the triangular and hexagonalatoms. All of the data displayed in Table I have beenused to determine the exchange parameters from a leastsquare fit to the mean-field solution of the HeisenbergHamiltonian (1). The fit is very good with errors rangingfrom 0.1–1.55 meV. The fit leads to exchange parametersof J � 290.3 meV, J 0
� 222.7 meV, J 00� 15.9 meV,
J1 � 13.8 meV, J2 � 23.4 meV, and J3 � 0.55 meV,where positive numbers correspond to AF and negativeones to FM interactions. The ferromagnetic interaction J 0
is a surprising result [12] and deserves further discussion
since it is qualitatively different from earlier assumptionsbased on entirely AF interactions [6,13]. Ferromagneticcoupling is possible without polarizing the oxygensthrough a 4th order process similar to superexchange.In superexchange, the intermediate state has the lowestd orbital on the V doubly occupied with up and downelectrons [14]. However, electrons can also hop to higherenergy d orbitals on the V’s. In this case both paralleland antiparallel spins are allowed without violating thePauli exclusion principle, but Hund’s rule coupling prefersparallel alignment. The superexchange process (same d
orbital) completely excludes the process with same-spinelectrons while the FM process (different d orbitals)merely favors FM alignment. Thus a FM coupling is ob-tained if the V-O hopping matrix elements into the higherd orbital are significantly larger than the matrix elementsfor the hopping of O electrons into the lowest energy d
orbital. The occurrence of such interactions is possible ina low-symmetry system such as the one studied here.
Even with this FM interaction, our spin Hamiltonianyields an S � 1�2 ground state composed largely of Isingconfigurations similar to the one depicted in Fig. 1. ThisIsing configuration was predicted from the J’s from earlierfits to DFT energies and corresponds to the ground-stateDFT configuration (I).
We have fully diagonalized the Heisenberg Hamilto-nian (1). Using all symmetries, the largest irreduciblemany-body subspace has dimension 2145. We find a spin-1�2 Kramer doublet as the ground state with a low-lyingspin-3�2 quadruplet as shown in Fig. 1. The rest of thespectrum is well separated from these eight states. Thelarge value of J binds the spins in the hexagons into sin-glets. The low-energy physics arises from the inner tri-angle spins interacting with each other both directly andwith an effective coupling through the hexagons, yieldingthe doublet-quadruplet spectrum [15]. There are two im-portant energy scales in the spectrum: D, the gap betweenthe doublet and quadruplet, and J , the energy at which the
TABLE I. DFT energies (E) of calculated Ising configurations, energies obtained from the fit, and 4�Sq
i Sq
j � along each of the sixbonds. Also included is the anisotropy shift d for the Ms � S state of each Ising configuration. A least square fit of this data leadsto exchange parameters of J � 290.3, J 0
� 222.7, J 00� 15.9, J1 � 13.8, J2 � 23.4, and J3 � 0.55 meV.
E (meV) Fit J J 0 J 00 J1 J2 J3 Spin Label d (K)
278.37 278.44 26 2 22 6 26 21 1�2 I 0.8273.39 273.63 26 2 22 4 24 21 1�2 II235.48 235.08 26 22 2 4 24 21 1�2 III234.89 234.53 26 22 2 4 24 3 3�2 IV
0.00 20.79 26 26 6 6 26 3 3�2 V 1.58.38 8.28 26 26 6 2 22 21 1�2 VI 1.3
28.14 28.08 26 26 6 26 6 3 3�2 VII126.32 126.14 24 24 6 4 26 3 1�2 VIII129.17 128.88 24 24 2 6 24 3 5�2 IX278.35 278.50 22 26 2 4 24 3 3�2 X434.22 435.78 0 0 6 6 0 3 9�2 XI 1.6760.75 760.76 6 6 6 26 26 3 9�2 XII 1.6873.11 872.35 6 6 6 6 6 3 15�2 XIII 1.8
3401
144
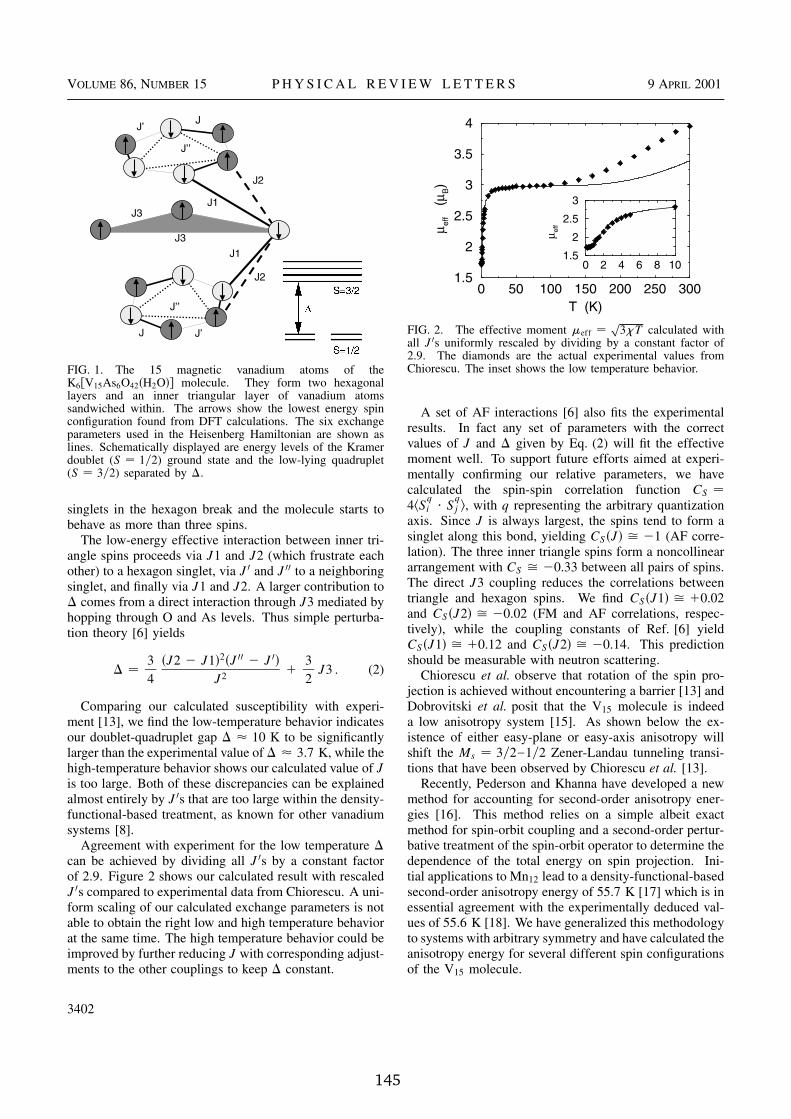
VOLUME 86, NUMBER 15 P H Y S I C A L R E V I E W L E T T E R S 9 APRIL 2001
J
J
J1
J1
J2
J2
J’
J’
J’’
J’’
J3
J3
FIG. 1. The 15 magnetic vanadium atoms of theK6�V15As6O42�H2O�� molecule. They form two hexagonallayers and an inner triangular layer of vanadium atomssandwiched within. The arrows show the lowest energy spinconfiguration found from DFT calculations. The six exchangeparameters used in the Heisenberg Hamiltonian are shown aslines. Schematically displayed are energy levels of the Kramerdoublet (S � 1�2) ground state and the low-lying quadruplet(S � 3�2) separated by D.
singlets in the hexagon break and the molecule starts tobehave as more than three spins.
The low-energy effective interaction between inner tri-angle spins proceeds via J1 and J2 (which frustrate eachother) to a hexagon singlet, via J 0 and J 00 to a neighboringsinglet, and finally via J1 and J2. A larger contribution toD comes from a direct interaction through J3 mediated byhopping through O and As levels. Thus simple perturba-tion theory [6] yields
D �
3
4
�J2 2 J1�2�J 00 2 J 0�J2
13
2J3 . (2)
Comparing our calculated susceptibility with experi-ment [13], we find the low-temperature behavior indicatesour doublet-quadruplet gap D � 10 K to be significantlylarger than the experimental value of D � 3.7 K, while thehigh-temperature behavior shows our calculated value of J
is too large. Both of these discrepancies can be explainedalmost entirely by J 0s that are too large within the density-functional-based treatment, as known for other vanadiumsystems [8].
Agreement with experiment for the low temperature Dcan be achieved by dividing all J 0s by a constant factorof 2.9. Figure 2 shows our calculated result with rescaledJ 0s compared to experimental data from Chiorescu. A uni-form scaling of our calculated exchange parameters is notable to obtain the right low and high temperature behaviorat the same time. The high temperature behavior could beimproved by further reducing J with corresponding adjust-ments to the other couplings to keep D constant.
0 2 4 6 8 101.5
2
2.5
3
µe
ff
0 50 100 150 200 250 300
T (K)
1.5
2
2.5
3
3.5
4
µeff
(µ
B)
FIG. 2. The effective moment meff �
p3xT calculated with
all J 0s uniformly rescaled by dividing by a constant factor of2.9. The diamonds are the actual experimental values fromChiorescu. The inset shows the low temperature behavior.
A set of AF interactions [6] also fits the experimentalresults. In fact any set of parameters with the correctvalues of J and D given by Eq. (2) will fit the effectivemoment well. To support future efforts aimed at experi-mentally confirming our relative parameters, we havecalculated the spin-spin correlation function CS �
4�Sqi ? S
qj �, with q representing the arbitrary quantization
axis. Since J is always largest, the spins tend to form asinglet along this bond, yielding CS�J� 21 (AF corre-lation). The three inner triangle spins form a noncollineararrangement with CS 20.33 between all pairs of spins.The direct J3 coupling reduces the correlations betweentriangle and hexagon spins. We find CS�J1� 10.02
and CS�J2� 20.02 (FM and AF correlations, respec-tively), while the coupling constants of Ref. [6] yieldCS�J1� 10.12 and CS�J2� 20.14. This predictionshould be measurable with neutron scattering.
Chiorescu et al. observe that rotation of the spin pro-jection is achieved without encountering a barrier [13] andDobrovitski et al. posit that the V15 molecule is indeeda low anisotropy system [15]. As shown below the ex-istence of either easy-plane or easy-axis anisotropy willshift the Ms � 3�2 1�2 Zener-Landau tunneling transi-tions that have been observed by Chiorescu et al. [13].
Recently, Pederson and Khanna have developed a newmethod for accounting for second-order anisotropy ener-gies [16]. This method relies on a simple albeit exactmethod for spin-orbit coupling and a second-order pertur-bative treatment of the spin-orbit operator to determine thedependence of the total energy on spin projection. Ini-tial applications to Mn12 lead to a density-functional-basedsecond-order anisotropy energy of 55.7 K [17] which is inessential agreement with the experimentally deduced val-ues of 55.6 K [18]. We have generalized this methodologyto systems with arbitrary symmetry and have calculated theanisotropy energy for several different spin configurationsof the V15 molecule.
3402
145

VOLUME 86, NUMBER 15 P H Y S I C A L R E V I E W L E T T E R S 9 APRIL 2001
We have calculated the anisotropy energy for the low-est Ising configurations with one, three, nine, and fifteenunpaired electrons, as given in Table I. In all cases wefind that the V15 possesses weak easy-plane anisotropy.This result ensures that anisotropy effects will not changethe total spin of the V15 ground state. Examination ofthe expression for the second order anisotropy energy inRef. [16], shows that such energies do not necessarily scaleas the square of the total moment. Indeed, as shown inTable I, we find that the anisotropic effects are in fact onlyweakly dependent on the total spin and that the energy ofthe Ms � S state increases by approximately d � 0.8 to1.8 K. Chiorescu et al. show that the broadening of theZener-Landau tunneling fields decreases with temperaturefor the j1�2, 1�2� to j1�2, 21�2� transitions but are inde-pendent of temperature for the j3�2, 3�2� to the j3�2, 1�2�transitions [13]. This behavior is exactly what is expectedfrom a sample containing weak easy-plane spin anisotropy.At sufficiently low temperatures, only the S � 3�2 andS � 1�2 states are relevant, and the field-dependent cross-ing of these states depends on whether the magnetic fieldis parallel or perpendicular to the easy plane. The broad-ening is proportional to the difference of the magneticanisotropy energy for the different spin configurations in-volved. Because of the small anisotropy in V15 the effectwill be small. Although it is not possible to translate theDFT obtained anisotropy energies directly to the quantummechanical many-spin ground state discussed here, we ob-tain from these energies tunnel field broadenings between0.1 to 0.48 T which envelop the experimentally observedfield broadening of about 0.2 T [13]. In powdered samples,the small easy-plane anisotropy would lead to a broaden-ing in the tunneling field and in single crystals the effectwould change the tunneling fields as a function of fieldorientations.
To summarize, we have performed accurate all-electrondensity-functional calculations on the V15 cluster as a func-tion of geometry and spin configuration. By dynamicallycoupling the mean-field density-functional approach toexact-diagonalization of a many-spin Heisenberg represen-tation, we have efficiently determined the lowest density-functional configurations and the entire Heisenberg spinexcitation spectrum. Our calculations suggest that thesmall experimentally observed orientational dependenceof the tunneling field for the Ms � 3�2 to Ms � 1�2 is asignature of configuration dependent magnetic anisotropyin this molecule. The method used here is general andallows one to characterize both systems which are poten-tially useful for magnetic storage (Mn12, Fe8) and systemswhich show quantum coherence, such as the one studiedhere.
This work was supported in part by ONR GrantsNo. N0001498WX20709 and No. N0001400AF00002.Computations were performed at the DoD Major SharedResource Centers. We thank I. Chiorescu for enlighteningdiscussions and for supplying the data used in Fig. 2.
*Present address: MPI für Festkörperforschung, Postfach80065, D-70506 Stuttgart, Germany.
[1] R. F. Service, Science 287, 1902 (2000); S. Sun, C. B.Murray, D. Weller, L. Folks, and A. Moser, Science 287,1989 (2000).
[2] A. Caneschi, D. Gatteschi, C. Sangregorio, R. Sessoli,L. Sorace, A. Cornia, M. A. Noval, C. Paulsen, andW. Wernsdorfer, J. Magn. Magn. Mater. 200, 182 (1999),and references there.
[3] J. Friedman, M. P. Sarachik, J. Tejada, and R. Ziolo, Phys.Rev. Lett. 76, 3820 (1996); L. Thomas, F. Lionti, R. Ballou,D. Gatteschi, R. Sessoli, and B. Barbara, Nature (London)383, 145 (1996).
[4] C. Sangregorio, T. Ohm, C. Paulsen, R. Sessoli, andD. Gatteschi, Phys. Rev. Lett. 78, 4645 (1997).
[5] A. Müller and J. Döring, Angew. Chem., Int. Ed. Engl. 27,1721 (1988).
[6] D. Gatteschi, L. Pardi, A. L. Barra, A. Müller, andJ. Döring, Nature (London) 354, 463 (1991).
[7] N. D. Mermin, Phys. Today 53, No. 7, 11 (2000); D. P.DiVincenzo and D. Loss, J. Magn. Magn. Mater. 200, 202(1999).
[8] C. S. Hellberg, W. E. Pickett, L. L. Boyer, H. T. Stokes, andM. J. Mehl, J. Phys. Soc. Jpn. 68, 3489 (1999).
[9] A. Müller and J. Döring, Z. Anorg. Allg. Chem. 595, 251(1991).
[10] J. P. Perdew, K. Burke, and M. Ernzerhof, Phys. Rev. Lett.77, 3865 (1996).
[11] M. R. Pederson and K. A. Jackson, Phys. Rev. B 41, 7453(1990); K. A. Jackson and M. R. Pederson, Phys. Rev. B42, 3276 (1990).
[12] M. A. Korotin, I. S. Elfimov, V. I. Anisimov, M. Troyer, andD. I. Khomskii, Phys. Rev. Lett. 83, 1387 (1999).
[13] I. Chiorescu, W. Wernsdorfer, A. Müller, H. Bögge,and B. Barbara, Phys. Rev. Lett. 84, 3454 (2000);cond-mat/9911180.
[14] J. B. Goodenough, Magnetism and the Chemical Bond
(Wiley, New York, 1963).[15] V. V. Dobrovitski, M. I. Katsnelson, and B. N. Harmon,
Phys. Rev. Lett. 84, 3458 (2000).[16] M. R. Pederson and S. N. Khanna, Phys. Rev. B 60, 9566
(1999).[17] M. R. Pederson and S. N. Khanna, Chem. Phys. Lett. 307,
253 (1999); M. R. Pederson and S. N. Khanna, Phys. Rev. B59, R693 (1999).
[18] A. L. Barra, D. Gatteschi, and R. Sessoli, Phys. Rev. B 56,8192 (1997).
3403
146