Electronic Commerce Business Impacts Project
60
Transcript of Electronic Commerce Business Impacts Project


The Case of the Canadian Optical Connectivity Equipment Value Chain
© Lefebvre et al, 2001
1
THE CASE OF THE CANADIAN OPTICAL CONNECTIVITY
EQUIPMENT VALUE CHAIN
Prepared for
In the framework of the
OECD Electronic Commerce Business Impacts Project
by
Louis-A. Lefebvre, Ph.D. Director, Centre ePoly, and Full Professor, École Polytechnique de Montréal
Pierre-Majorique Léger, M.A.Sc. Researcher, Center ePoly, and Ph.D. Candidate
Luc Cassivi, M.Eng. Researcher, Center ePoly, and Ph.D. Candidate
Raphael Lapointe Research assistant, Center ePoly
Pierre Hadaya, M.A.Sc. Researcher, Center ePoly, and Ph.D. Candidate
February 2001 Montreal, Canada

The Case of the Canadian Optical Connectivity Equipment Value Chain
© Lefebvre et al, 2001
2
TABLE OF CONTENTS
EXECUTIVE SUMMARY............................................................................................................... 5
INTRODUCTION............................................................................................................................. 7
1. BACKGROUND INFORMATION ON THE INDUSTRY .................................................. 8
1.1 DESCRIPTION OF THE CANADIAN TELECOMMUNICATION EQUIPMENT INDUSTRY ................. 8
1.2 DESCRIPTION OF OPTICAL CONNECTIVITY EQUIPMENT......................................................... 9
1.3 THE INDUSTRY IMPERATIVES ............................................................................................. 10
1.3.1 Harnessing the radical technological shift ............................................................... 11
1.3.2 Responding to the booming demand for bandwidth capacity with fibre-optics........ 11
2. VALUE CHAIN ANALYSIS ................................................................................................. 13
2.1 PRODUCT AND TRANSACTION CHARACTERISTICS ............................................................... 13
2.1.1 Dominant characteristics of the product group........................................................ 13
2.1.2 Dominant characteristics of the transaction structure ............................................. 14
2.2 VALUE CHAIN LAYERS ....................................................................................................... 14
2.2.1 Network operators..................................................................................................... 15
2.2.2 System integrators..................................................................................................... 16
2.2.3 Assemblers ................................................................................................................ 21
2.2.4 Sub-assemblers.......................................................................................................... 23
2.3 MARKETPLACES AND TRANSACTION STRUCTURE............................................................... 24
3. CASE STUDY PRESENTATIONS....................................................................................... 27
3.1 POSITION OF PROACTIVE FIRMS IN THE VALUE CHAIN......................................................... 27
3.2 PRESENTATION OF THE CASES ............................................................................................ 28
3.2.1 The case of an integrator/assembler: Nortel Networks ............................................ 28
3.2.2 The case of an assembler: Celestica ......................................................................... 31
3.2.3 The case of sub-assembler: SUB1............................................................................. 33
3.2.4 The case of sub-assembler : SUB2............................................................................ 35
3.3 TECHNOLOGY PROFILE OF THE VALUE CHAIN..................................................................... 36
3.4 THE FIRM’S MOTIVATIONS AND EXPECTATIONS REGARDING E-COMMERCE........................ 39
3.5 OBSTACLES AND ADVANTAGES FOR EXPLOITING E-COMMERCE’S POTENTIAL.................... 40

The Case of the Canadian Optical Connectivity Equipment Value Chain
© Lefebvre et al, 2001
3
3.5.1 Factors relating to the telecommunication infrastructure........................................ 41
3.5.2 Regulatory factors..................................................................................................... 41
3.5.3 Internal factors.......................................................................................................... 41
3.5.4 External factors relating to relations with other enterprises.................................... 41
3.5.5 Strategic factors relating to competitiveness ............................................................ 42
3.5.6 Government policy in general................................................................................... 42
3.6 EFFECTS ............................................................................................................................. 42
3.6.1 Nortel Optical‘s evaluation grid ............................................................................... 43
3.6.2 Celestica’s evaluation grid ....................................................................................... 46
3.6.3 Sub-assemblers’ evaluation grids ............................................................................. 48
Electronic Commerce Innovations............................................................................................ 51
4. ELECTRONIC COMMERCE IMPACT ANALYSIS AND FUTURE
DEVELOPMENTS ......................................................................................................................... 52
4.1 E-COMMERCE SUPPORTS PROCESS INNOVATIONS ............................................................... 52
4.2 PRODUCT INNOVATIONS WITH E-CONFIGURATION.............................................................. 54
4.3 RELATIONAL INNOVATIONS ............................................................................................... 54
4.4 POLICY IMPLICATIONS........................................................................................................ 55
REFERENCES................................................................................................................................ 56
PEOPLE INTERVIEWED ............................................................................................................ 58
APPENDIX A: NORTEL MILESTONES FROM 1997–2000 ................................................... 59

The Case of the Canadian Optical Connectivity Equipment Value Chain
© Lefebvre et al, 2001
4
LIST OF FIGURE
Figure 1.1 Telecommunication infrastructure .................................................................................... 9
Figure 1.2 The growth of data traffic Nortel Optical‘s evaluation grid ........................................... 11
Figure 2.1 Product and transaction characteristics .......................................................................... 13
Figure 2.2 The Optical Connectivity Equipment Value Chain ........................................................ 15
Figure 2.3 Expected revenus by market segments ........................................................................... 17
Figure 2.4 Market share in each optical segment in 2000................................................................ 18
Figure 3.1 The Optical Connectivity Equipment Value Chain ....................................................... 27
LIST OF TABLES
Table 2.1 Drivers of the transaction structure in the marketplaces................................................... 25
Table 3.1 Nortel Optical‘s evaluation grid....................................................................................... 43
Table 3.2 Celestica’s evaluation grid ............................................................................................... 46
Table 3.3 SUB1’s evaluation grids .................................................................................................. 50
Table 3.4 SUB2’s evaluation grid.................................................................................................... 51

The Case of the Canadian Optical Connectivity Equipment Value Chain
© Lefebvre et al, 2001
5
EXECUTIVE SUMMARY
This document presents an analysis of the impacts of electronic commerce on proactive firms in the
Canadian optical connectivity equipment industry. The study, which was conducted from
September 2000 to January 2001, is based on the value chain methodology proposed by the OECD
Electronic Business Impact Project (EBIP).
The optical connectivity equipment industry is currently the leading segment in the
telecommunications sector. Optical connectivity equipment is used for telecommunications and
comprises both hardware and software components used to transmit information along fibre-optic
media. Canada’s Nortel Networks is a leader in this industry segment with a worldwide market
share of 43% in optical connectivity solutions.
Driven by Nortel’s Optical Division, members of all four layers of the value chain, namely network
operators, system integrators, assemblers and sub-assemblers, have implemented leading-edge
electronic commerce tools to support supply chain strategies.
Ten electronic commerce initiatives identified in the optical connectivity value chain were analyzed
for each layer of the chain. The findings of all four case studies clearly reveal that electronic
commerce initiatives primarily influence process and relational innovations. However, due to the
complexity and high level of customization of optical equipment, the electronic configuration of
optical equipment by the final end customers is difficult and has not yet induced major product
innovations.
The impacts of business-to-business e-commerce on process innovations can be categorized by two
main trends: (i) use of visibility tools to improve transaction preparation, and (ii) implementation of
demand-driven supply chain strategies to complete transactions. The real benefits of electronic
commerce will come with end-to-end visibility in the supply chain, which is achieved by making
accurate information, such as forecasts, schedules and production capacity, accessible to all
members of the chain. Furthermore, customization and diminishing lead times are forcing the
implementation of demand-pull strategies for all levels of the optical connectivity equipment
supply chain. In order to quickly produce only what has been sold, system integrators are keeping
inventories at a minimum and now rely on efficient procurement cycles to fulfill their needs.

The Case of the Canadian Optical Connectivity Equipment Value Chain
© Lefebvre et al, 2001
6
As for relational innovations, electronic commerce in the value chain strengthens existing
relationships between business partners. The learning process required to develop efficient
electronic collaboration between the supply chain partners constitutes a significant switching cost
for the assembler. Nevertheless, the new breed of electronically based intermediaries are either
industry-led initiatives like e2open or privately owned neutral marketplaces such as Fastpart.com.
These intermediaries usually maintain large, industry-specific catalogues where assemblers and
sub-assemblers can find scarce parts and benchmark their established suppliers against a pool of
other companies from all over the world.
In the telecommunication equipment industry, electronic commerce has been and will continue to
be driven by sectorial initiatives and proprietary supply chain extranets. These electronic commerce
platforms are likely to rapidly reach critical masses of stakeholders and reshape industries by
defining new business practices. Finally, the results of our analysis clearly show that business-to-
business electronic commerce is merely a means to optimize supply chain configurations.

The Case of the Canadian Optical Connectivity Equipment Value Chain
© Lefebvre et al, 2001
7
INTRODUCTION
The objective of this document is to present an analysis of the impacts of electronic commerce on a core group of proactive firms in the Canadian optical connectivity equipment industry. This study, which was conducted from September 2000 to January 2001, is based on the value chain methodology proposed by the OECD Electronic Business Impact Project (EBIP).
Section 1 of this study presents background information about the Canadian optical connectivity equipment value chain. This section will provide the reader with a profile of the Canadian telecommunication equipment industry, technological information on optical telecommunication networks, a description of the functionalities of the selected optical product, as well as a definition of the main imperatives that shape this industry.
Section 2 describes the Canadian optical connectivity equipment value chain. We first define the product and transaction characteristics. All four layers of the value chain are then presented: network operators, system integrators, assemblers and sub-assemblers. Each of these layers is defined in terms of its competitive dynamic and the main trends that affect this industry segment. This section will conclude with a description of different marketplaces within the value chain and their associated transaction structure.
The impact of electronic commerce on a core group of four proactive firms in the optical connectivity equipment value chain is analyzed in section 3. First, case studies of these four companies, namely Nortel Networks, Celestica, and two other sub-assemblers, are provided. Next, a technology profile introduces the ten most important electronic commerce initiatives adopted by the members of the value chain. Their motivations and expectations regarding the effects of electronic commerce are then presented along with an examination of the obstacles faced in adopting e-commerce. Finally, the effects of electronic commerce on product, process and relational innovations by the four proactive firms are mapped and analyzed through the evaluation grids proposed by the EBIP methodology.
Section 4 synthesizes the actual and expected impact of electronic commerce on product, process
and relational innovations within the optical connectivity equipment value chain. Trends related to
the evolution of the transaction structure in the chain are also outlined. We conclude on a set of
policy implications induced from the findings of this study

The Case of the Canadian Optical Connectivity Equipment Value Chain
© Lefebvre et al, 2001
8
1. BACKGROUND INFORMATION ON THE INDUSTRY
This chapter presents optical connectivity equipment, which is the main focus of this study. To give
readers a broader perspective, we start by describing the Canadian telecommunication equipment
industry. Some fundamentals of telecommunications and networks are then introduced, followed by
a description of optical connectivity equipment and its underlying technology. We conclude this
chapter by pointing out the major imperatives that are currently shaping this industry segment.
1.1 DESCRIPTION OF THE CANADIAN TELECOMMUNICATION EQUIPMENT INDUSTRY
According to Statistics Canada (1999), the telecommunication equipment industry (SIC 3351)
encompasses all companies involved in the manufacturing of equipment and associated software
that are intended to fulfill the function of information processing and communication, including
transmission and display.
The telecommunication equipment industry is one of Canada’s most strategic sectors. In 1999, this
industry generated a gross domestic product (GDP) of CAN $3.2 billion, which constitutes 4.3% of
Canada’s total GDP. From 1993 to 1999, the GDP of the telecommunication equipment industry
has grown at a compounded annual growth rate (CAGR) of 10.1%, compared to 3.3% for the entire
Canadian economy. During the same period, exports of telecommunication equipment have also
grown at an impressive CAGR of 21.9%. Moreover, R&D expenditures made by
telecommunication equipment manufacturers should reach more than CAN $2.3 billion in 2000.
These investments represent 23.2% of total Canadian private sector R&D expenditures.
In 1999, fewer than 70 firms operating in this industry directly employed 19,555 workers. Among
these firms, Nortel Networks, with global revenues of US$30.2 billion in 2000 (US$21.3 billions in
1999), is a major player in the global telecommunication industry. A detailed case study of Nortel
Networks is presented in section 3.2.
Finally, many specialists consider the telecommunication equipment industry to be highly proactive
in electronic commerce (see, for example, Forrester Research, 1999). Indeed, industries related to
electronics are facing now what many other industries will encounter two or three years down the
road. In sum, the choice of the telecommunication equipment industry for the OECD’s EBIP
project is more than justified.

The Case of the Canadian Optical Connectivity Equipment Value Chain
© Lefebvre et al, 2001
Source :
1.2 DESCRIPTION OF OPTICAL CONNECTIVITY EQUIPMENT
The following section introduces the optical connectivity equipment as the main focus of this study.
We first provide a brief overview of telecommunication infrastructure technologies and fibre-optic
mediums, and then describe the optical connectivity equipment.
A telecommunication in
network, the metropolitan
also referred as the long
represents the backbone
between the transport ne
provides interoffice conn
adjacent cities. The acces
premises.
To communicate within
mediums. The one that i
principle that light in gl
Figure 1.1 Telecommunication infrastructure
Tessier, 2000
9
frastructure comprises three complementary networks: the transport
area network and the access network (figure 1.1). The transport network,
-haul network, is the heart of the telecommunication infrastructure. It
that connects metropolitan networks. Standing as an intermediate layer
twork and the access network, the metropolitan area network (MAN)
ectivity between central offices (COs), points of presence (POPs), or
s network establishes the link between the CO or POP and the customer’s
the telecommunication infrastructure, there exists numerous transmission
nterests us is optical fiber. “Fibre-optic communication is based on the
ass medium can carry information over longer distance than electrical

The Case of the Canadian Optical Connectivity Equipment Value Chain
© Lefebvre et al, 2001
10
signals can carry in a copper or coaxial medium. The glass purity of today’s fibre, combined with
improved system electronics, enables fibre to transmit digitized light signals well beyond 100 km
(60 miles) without amplification. With few transmission losses, low interference, and high
bandwidth potential, optical fibre is an almost ideal transmission medium”1.
An optical connectivity equipment is a telecommunication device, comprising both hardware and
software components used to transmit information in the form of light impulses along the fibre-
optic medium. Optical connectivity equipment is essential for all three complementary networks,
but necessitate different capacities and speed. Much more capacity and speed is required for
transport network than access network.
There are two main categories of optical connectivity equipment, each of which has specific
functionalities: SONET and DWDM (RHK, 2000). SONET (Synchronous Optical Network) is the
standard used in North America to transfer synchronous data on optical media. The international
equivalent of SONET is SDH (Synchronous Digital Hierarchy). DWDM (Dense Wavelength
Division Multiplexing) is a technology that permits the use of many wavelengths on the same
optical fibre. Each wavelength channel has the equivalent capacity of the optical fibre’s potential. It
is predicted that DWDM will offer 96 channels of 2.4 Gbps and the projected capacity in the short
term will exceed 1 Tbps thus ensuring much faster communication than the other two.
1.3 THE INDUSTRY IMPERATIVES
The telecommunication equipment industry faces two major structural imperatives that are shaping
the competitive dynamic of its national and international environments. On the one hand, players in
the industry have to harness the shift from voice to data. On the other hand, firms must constantly
develop more powerful equipment to respond to the persistently growing demand for capacity. This
section details these two imperatives.
1 Corning (2000)

The Case of the Canadian Optical Connectivity Equipment Value Chain
© Lefebvre et al, 2001
1.3.1 HARNESSING THE RADICAL TECHNOLOGICAL SHIFT
Before the mid-1990s, voice was the dominant type of traffic transmitted over telecommunication
networks. Although a few organizations used data technologies such as EDI, the data traffic was
almost negligible.
The emergence of the Internet triggered a
radical technological shift. In less than five
years, the widespread adoption of the Internet
by organizations, governments and
individuals has been so great that in 1999, for
the first time in telecommunication history,
traffic generated by data transmission
exceeded traffic generated by voice
transmission, and this trend is expected to
intensify. As shown in figure 1.2, experts
forecast data traffic to grow at a CAGR of
41% until 2006. According to Cisco Systems,
if the current growth forecast of the Internet holds t
voice network will be needed – with voice relegated
data-dominated network” (Cisco Systems, 1999).
This technological shift, defined as the transition “fro
of Nortel Networks, has forced all players in the telec
and their technical competencies to harness the new
explanation of the strategic reactions of telecommu
will be explained later in the document.
1.3.2 RESPONDING TO THE BOOMING DEMAND FOR B
Urged on by the exponential growth in adoption of th
is expected to increase by 700% by 2003 accord
Electronic Communicator, 1999). This explosion o
methods of bandwidth allocation and service delivery
Sou
Figure 1.2 The growth of data traffic
rce : Nortel Networks, 2000
11
rue, “a network 100 times the size of today’s
to a 1 percent minority share of a 99 percent
m dial tone to Web tone” by John Roth, CEO
ommunication industry to adapt their offering
opportunities. This latest challenge and an
nication manufacturers to this paradigm shift
ANDWIDTH CAPACITY WITH FIBRE-OPTICS
e Internet, the demand for bandwidth capacity
ing to the latest industry projections (The
f network use necessitates an evolution in
.

The Case of the Canadian Optical Connectivity Equipment Value Chain
© Lefebvre et al, 2001
12
Due to the scalability and flexibility of fibre-optics, optical networking, currently the leading
segment in the telecommunications industry, is seen as the answer to the booming demand for
capacity. Indeed, optical networks have started to replace the copper infrastructure that has
traditionally provided voice and data transmissions. Driven by the industry and fundamental
research, ongoing developments in fibre-optics will continue to increase the bandwidth capacity of
the medium. Butters’ law even predicts that the capacity of fibre-optics will double every nine
months.
To be successful in this industry, manufacturers must rely on their capacity to constantly develop
more efficient and more powerful telecommunication equipment and be the first to introduce them
on the market.

The Case of the Canadian Optical Connectivity Equipment Value Chain
© Lefebvre et al, 2001
2. VALUE CHAIN ANALYSIS
2.1 PRODUCT AND TRANSACTION
CHARACTERISTICS
This section will describe the selected line of
products, optical connectivity equipment, in
terms of its dominant characteristics and its
related transaction structure. It will be
demonstrated that the selected line of products
can be characterized as “material” and
“negotiated” and falls into the fourth quadrant
of figure 2.1.
2.1.1 DOMINANT CHARACTERISTICS OF THE PRODUCT
The main characteristics of the optical connectivity solu
1. The final user of the product purchases a solut
services such as network planning, integration se
2. It is a modular hardware and software solution
numerous subsystems (both hardware and
independently and later assembled to form a co
chain.
3. Each solution is designed to fit the specific ne
each product is made of a specific set of custom
Based on these characteristics, the selected product cle
side of figure 2.1.
Figure 2.1 Product and transaction
characteristics
13
GROUP (I.E. “DIGITAL” OR “MATERIAL”)
tion are the following:
ion including the product as well as related
rvices and after-sales support.
, i.e. the product is a system composed of
software) that can be manufactured
mplete system at the last stage of the supply
twork environment of particular client, i.e.
ized subsystems.
arly fits the “material” category on the right

The Case of the Canadian Optical Connectivity Equipment Value Chain
© Lefebvre et al, 2001
14
2.1.2 DOMINANT CHARACTERISTICS OF THE TRANSACTION STRUCTURE (I.E. “NEGOTIATION” OR
“ROUTINE”)
The transaction structure of the selected product line is based on “negotiations” (bottom part of the
figure 2.1) for the following reasons:
1. The need for product customization translates into a complex transaction structure between
the system integrator and the network operator; the ordering process is human-intensive
and difficult to automate.
2. The formal and informal relationship between the buyer and seller has a great influence on
the transaction process.
3. Product life cycles are shortening due to rapid technological innovation and exponential
demand for bandwidth capacity. This leads to the constant introduction on the market of
new, higher-capacity products.
However, the fact that the transaction structure of the final product is negotiated does not imply
that the transaction structure of the subsystems and components is negotiated as well. On the one
hand, the transaction structure of subsystems and components that have short life cycles due to
rapid technological evolution and/or frequent changes in design will usually be based on
negotiations. On the other hand, mature subsystems and components with longer life cycles will be
routinely supplied over blanket orders, i.e. predefined annual contracts.
2.2 VALUE CHAIN LAYERS
This section provides a comprehensive description of each of the layers making up the value chain
of the selected optical product line. First, layers are defined according to the value they add to the
value chain. Then, each layer’s competitive dynamic and the trends that shape its environment are
described. We conclude this section with a matrix relating the different transaction structures that
prevail at each stage of the value chain.
The following figure illustrates the four layers of the value chain of the optical connectivity
solution, beginning at the lower end with the network operators (i.e. the final users of the optical
products) and ending at the upper level with the sub-assemblers (i.e. the manufacturers of parts and
components).

The Case of the Canadian Optical Connectivity Equipment Value Chain
© Lefebvre et al, 20
2.2.1 NETWOR
Network operat
operate transpor
Deregulation in
are offering a b
segments that
interexchange m
market. Some ne
(e.g. Bell Canad
operating a glob
their activities to
merged with com
Figure 2.2 The Optical Connectivity Equipment Value Chain
01 15
K OPERATORS
ors are the main users of optical connectivity equipment. These firms own and
t networks, metropolitan area networks and/or access networks.
the telecommunication industry and the explosion of new services like the Internet
road range of opportunities to network operators. There are four major market
may be addressed by network operators: the local exchange market, the
arket, the Internet service provider market, and the network service provider
twork operators will choose to diversify their activities and cover several segments
a), whereas others will focus on a niche segment, e.g. Cescom, a Montreal start-up
al voice-over-IP network. Furthermore, to extend their service offering and expand
the global market, many network operators have either established partnerships or
plementary business partners. The four market segments are described below:

The Case of the Canadian Optical Connectivity Equipment Value Chain
© Lefebvre et al, 2001
16
LOCAL EXCHANGE MARKET
A local exchange carrier (LEC) provides local telecommunication access to individuals and
businesses. There are two types of LEC. An incumbent local exchange carrier (ILEC) is a
telephone company that was a monopolist provider of telecommunication service before
deregulation. Bell Canada and the Bell operating companies in the USA are examples of ILECs. On
the other hand, a competitive local exchange carrier (CLEC) is a telephone company that competes
with already established local telephone businesses by providing its own network and switching.
Examples of CLECs in the USA are Winstar and North American Telecom; Videotron is a CLEC
in Canada.
INTEREXCHANGE MARKET
An Interexchange Carrier (IXC) is a telephone company that provides connections between local
exchanges in different geographic areas. They are commonly referred to as “long-distance carriers.”
Examples of IXCs are AT&T, MCI and Sprint.
INTERNET SERVICE MARKET
An Internet Service Provider (ISP) is a company that provides access to the Internet and other
related services. An ISP has the equipment and the telecommunications line necessary to have a
POP (Point-of-Presence) on the Internet to serve a geographic area. Larger ISPs lease their own
high-speed lines to remain independent of telecommunication providers. Examples of large national
and regional ISPs in the USA are AT&T Worldnet, MCI, IBM Global Network, UUNET, and
PSINet.
NETWORK SERVICE MARKET
A Network Service Provider (NSP) is a company that provides other organizations with data
services. They rent their telecommunication infrastructure to companies that require the
transmission of data from one point to another (e.g. extranet). Teleglobe is an NSP in Canada.
2.2.2 SYSTEM INTEGRATORS
System integrators are the original equipment manufacturers (OEM) of optical connectivity
solutions. Main OEMs in this industry are very large multinational organizations such as Nortel

The Case of the Canadian Optical Connectivity Equipment Value Chain
© Lefebvre et al, 2001
Networks, NEC, Lucent, Fujitsu, Tellabs, Alcatel, Sycamore, Cisco and Ciena. Traditionally
vertically integrated, OEMs are increasingly focusing on the knowledge-based portions of their
value chains. Consequently, the primary roles of system integrators are investing in R&D to
develop new products with higher capacity, managing relationships with clients and suppliers, and
performing final integration of the solution to the clients’ requirements.
2.2.2.1 DESCRIPTION OF THE COMPETITIVE DYNAMIC
The optical connectivity solution market is structured around two major segments (SONET and
DWDM) defined in section 1.3.
Figure 2.3 charts the expected revenues
of these two segments. According to
RHK (2000), SONET is currently the
largest segment with worldwide revenues
of US $10.5 billion in 2000. However,
the DWDM segment is growing steadily
and is expected to take the lead in 2002
with more than US $16 billion in
revenues. The optical connectivity
equipment market as a whole grew 67%
in 2000 and is projected to reach a total
of $45 billion in 2004.
The optical connectivity market is characterized
product lines. In 2000, Nortel has been the main w
with leading market shares of 43%. As shown in
two major segments of the industry: 39% of SON
solutions. With such a dominant position in this i
all Internet backbone traffic in North Americ
transported over Nortel Networks equipment2. N
2 Source http://www.nortelnetworks.com/corporate/pressroo
Figure 2.3 Expected revenues by market
segments
17
by the supremacy of Nortel Networks’ optical
orldwide supplier of optical connectivity solution
figure 2.4, Nortel holds a dominant position in the
ET–SDH solutions and 53% of inter-city DWDM
ndustry, it is not surprising that more than 75% of
a and 50% of all European Internet traffic is
ortel’s global leadership is mainly attributable to
m/backgrounder/

The Case of the Canadian Optical Connectivity Equipment Value Chain
© Lefebvre et al, 2001
18
the impressive technical performance of its optical product line. A detailed case study on Nortel is
presented in section 3.2.
The rest of the optical
connectivity solution market
is very fragmented. The most
important challenger is
Lucent, ranking second in the
optical telecommunication
equipment industry with 14%
of the global market share.
Lucent’s modest performance
is mainly attributed to less
optimized technological
decisions regarding optical
networking equipment. In
1997, this former AT&T technology unit misread the demand for high-speed optical products and
decided to de-emphasize the development of a new generation of optical networking gear and
Internet routers. Both markets exploded, respectively benefiting Nortel Networks and Cisco and
Juniper.
Ciena Corp. is also a contender. With 13% of the fast-growing DWDM market, Ciena is a rising
star in the industry. In a mere six years, the Californian corporation has built a $5 billion market
capitalization. Its success is mainly due to two major technical developments in optical filtering.
2.2.2.2 TRENDS IN THE SYSTEM INTEGRATION LAYER
In reaction to the sectorial imperatives described in section 1.3, system integrators are undertaking
three strategic responses. They are racing for knowledge in optical network, building flexible
supply chains, and creating demand-driven extended enterprises.
a) Racing for knowledge in optical networks
To efficiently respond to the exponential growth in demand for bandwidth capacity and ever-
shortening product life cycles, telecommunication OEMs have always invested heavily in R&D.
Figure 2.4 Market share in each optical segment in 2000
Source : www.nortelnetworks.com/corporate/events/investorconf

The Case of the Canadian Optical Connectivity Equipment Value Chain
© Lefebvre et al, 2001
19
These investments ensure continuous product and process innovations. OEMs typically invest from
10% to 15% of their revenues in R&D expenditures each year.
However, the shift toward optical networking significantly disrupted the core competencies of
system integrators. They had to migrate from a world where electrons are transmitted over copper
to one where light goes through glass fibre. To succeed in this new environment, OEMs could not
just count on their own R&D capacity. They acquired new start-up companies specializing in
optical networking in order to be first to market in this booming new industry.
This fierce race for optical knowledge started more than two years ago. Last September, Aberdeen
Group, an IT consulting and market strategy firm, reported that acquisition spending for specialized
optical firms amounted for $37.8 billion in the last 18 months. Among the noteworthy acquisitions,
Nortel bought Bay Networks, Qtera and Xros; Lucent took over Chromatis Networks; Nokia
acquired Ipsilon; and Alcatel invested in 360network.
As for the labour force, this race for knowledge is also very intense. Electrical, computer and
industrial engineering students are being approached as early as their second year in university.
Furthermore, experienced engineers in optical telecommunications are in the sights of almost every
headhunter.
B) Building a flexible supply chain
Over the last few years, system integrators have had to cope with significant growth in the
telecommunication industry. They have had to reorganize themselves through acquisitions and
outsourcing strategies to efficiently counter fluctuations in demand. To respond to these
fluctuations, production flexibility is a key issue in developing a proficient supply chain.
To achieve this flexibility, leading OEMs recently increased the level of manufacturing activities
outsourced to specialized contract manufacturers, also called electronic manufacturing services
(EMS). These firms, being part of the assembler layer, will be described in the next section. By
outsourcing the manufacturing activities, OEMs transfer the manufacturing risks (due to growth
and fluctuation) to EMSs, which are reorganizing themselves to produce many products for many
customers in the electronics industry, and particularly in the telecommunication sector.
Outsourcing manufacturing to a network of EMSs has been intensified by the crucial role of fast
response time. Network operators are demanding quick responses, sometimes within a few hours,
The Case of the Canadian Optical Connectivity Equipment Value Chain
© Lefebvre et al, 2001
20
on the OEM’s capability to design and produce an optical connectivity solution. First-rate shop
floor agility and information exchanges are needed by either OEMs or EMSs to rapidly produce
telecommunication equipment.
This trend also forces the system integrator to manage inventory throughout the supply chain. The
objective is to reduce, and not transfer, inventory to suppliers while maintaining a high fulfillment
rate. With the sharp price erosion of components, major initiatives have been taken to control not
only internal inventory levels but levels at first-tier and second-tier suppliers’ facilities. Like many
other sectors, the final objective is the elimination of all excessive inventories.
C) Creating the demand-driven extended enterprise
Increasing outsourcing while reducing inventories is not an easy task and requires a well-oiled
supply chain. System integrators have opted for a demand-driven strategy where a virtual
integration of supply chain processes is undeniable. Managing the supply chain as one extended
enterprise is seen as the only way to survive in this fierce environment. The competition is not
coming from established rivals but from consortiums of companies linking business processes
together such that the industry will face competition between supply chains. To come up on top,
system integrators are improving demand forecasting and are willing to increase visibility
throughout the supply chain to form an integrated information supply chain with key partners and
critical suppliers. They must be able to control and manage shortages by anticipating component
scarcity.
A key impact of a demand-driven supply chain is the reduction of order fulfillment cycle times.
Evolving in a time-based competitive environment, system integrators require fast responses from
suppliers to be able to, in their turn, answer customers’ orders within reasonable timeframes.
OEMs and their business partners are all involved in optimizing these cycle times. Keeping product
development as a core activity within the company and developing virtual manufacturing
capabilities within the supply chain, especially with EMSs but also with sub-assemblers, enable
system integrators to differentiate themselves. The use of electronic media to obtain accurate
forecasts and to continuously manage orders in real time are examples of virtual manufacturing
capabilities being developed within the industry.
Supply chain management becomes an integral part of the coordination of demand capacity. Project
supervision (or project monitoring) is assisted by industry-wide collaborative tools and is slightly

The Case of the Canadian Optical Connectivity Equipment Value Chain
© Lefebvre et al, 2001
21
enhanced by the exploitation of e-commerce platforms. The second wave of ERP systems is
contributing to the development of supply chain planning with software such as SAP’s APO and I2.
2.2.3 ASSEMBLERS
The value chain layer characterized by assemblers is slowly transforming itself. As stated earlier,
OEMs are gradually outsourcing their assembly to electronic manufacturing specialists (EMS or
CM). The key factor in this shift in the electronic industry, and particularly in the
telecommunication industry, is the EMSs’ ability to produce with increased flexibility and at a
much lower cost than most traditional system integrators have been able to do in the last few years.
They usually benefit from lower labour costs and stress the importance of heavy utilization of their
manufacturing equipment while reducing set-up costs.
The EMSs’ capability to efficiently respond to highly fluctuating demands is what appeals to
system integrators. OEMs will often retain the manufacturing of key components for proprietary
reasons but will outsource the manufacturing of other components, knowing that the EMS will
transform its assembly line much faster, thus necessitating lower inventory levels. Traditional
assemblers (OEMs) have had a hard time following EMSs due to the latters constant investments in
manufacturing technology. They devote time and money on the development of the specific
components they produce, which are usually manufactured for a multitude of customers. In some
cases, customers are competitors and product information must be treated carefully.
2.2.3.1 COMPETITIVE DYNAMIC
The worldwide EMS market is expected to grow at a CAGR of almost 35%, from $72 billion in
2000 to $150 billion in 2003. The major players in the EMS market include Solectron (with $14.1
billion in revenues in 2000), Celestica ($9.8 billion), SCI Systems ($9.2 billion), Flextronics ($4.3
billion) and Jabil Circuit ($3.5 billion) but a large number of smaller EMSs, several thousand
worldwide, are obtaining large contracts from major OEMs.
2.2.3.2 TRENDS
Two important trends have emerged for the assembler layer. First EMSs are acquiring plant and
building long-term relationships with system integrators. Second, they are diversifying their
offering by moving up the value chain. A short description of each trend is presented in order to
understand the dynamic of this layer.

The Case of the Canadian Optical Connectivity Equipment Value Chain
© Lefebvre et al, 2001
22
A) Plant acquisition and long-term relationship
The impressive growth of EMSs is partly explained by their many acquisitions of system
integrators’ manufacturing plants. EMSs are lured into buying OEM plants with promises of long-
term contracts. Plants sold to EMSs are mainly exploited to assemble electronic components and
subsystems such as printed circuit-boards, representing 75% to 80% of their business, leaving 20%
to 25% for the assembly of consumer electronics. Numerous examples of acquisitions could be
listed to demonstrate this trend, including:
• Nortel Networks has recently sold 15 of its manufacturing facilities to several EMSs such as
Solectron, SCI, C-MAC and Sanmina3;
• Flextronics purchased JIT Holdings Ltd. plants in Singapore, Malaysia, China, Hungary and
Indonesia to add capacity and expand geographically;
• Motorola sold plants in Ireland and the USA to Celestica for $70 million.
Plant acquisitions from OEMs and new investments in infrastructure have enabled major EMSs to
build up a solid network of manufacturing plants. Manufacturing facilities are now spread around
the world, providing faster services to their customers; when confronted with a large order from a
particular region of the world, an EMS can easily manage production in neighbouring plants. These
acquisitions, along with an ever-growing pool of customers, have also provided EMSs with a far
larger asset turnover than any OEM alone could develop with its manufacturing plant.
B) Moving up the value chain
Experience in dealing with contract manufacturing allowed EMSs to offer complementary and
high-value-added services. In order to distinguish themselves, EMSs have developed the ability to
provide cradle-to-grave design, engineering, sourcing, and fulfillment services. To extend their
services to a higher level, EMSs have also acquired top design and engineering firms. In the
telecommunication industry, system integrators require more engineering-type services and are
inviting EMSs to provide very specific services such as testing. A few EMSs are even going further
by acquiring their suppliers and showing interest in distribution services.
3 Craincross, (2000)

The Case of the Canadian Optical Connectivity Equipment Value Chain
© Lefebvre et al, 2001
23
By outsourcing the procurement process to EMSs, OEMs leverage their buying power, benefiting
from the EMSs’ economy of scale. The example of Elcoteq in the production of mobile phones
illustrates this trend. In buying mobile phone components for both Nokia and Ericsson, Elcoteq
obtains better prices from suppliers.
In order to optimize manufacturing to the fullest, EMSs have integrated services such as design.
OEMs’ trust in the exchange of product design data with EMSs is increasing and industry members
now yearn for these services. Flextronics International has announced its intention to double its
design service capabilities within one year. It also intends to generate 50% to 60% of its revenues
from design-oriented products next year, compared to 30% in 2000.
2.2.4 SUB-ASSEMBLERS
Second-, third- and fourth-tier suppliers represent the sub-assembler layer. While their functions are
basically similar, the size and status of sub-assemblers differ. Some are owned and operated by
large multinationals with worldwide contracts while others are SMEs with one or two major
customers continuously booking orders. Component manufacturing and subsystem assembly are
the foremost activities being carried out in this layer of the value chain.
2.2.4.1 COMPETITIVE DYNAMIC
Sub-assemblers in the telecommunication industry (and also in other high-tech industries) have
been caught up in a very competitive environment over the last few years. Realizing that the
supplier base was too large and difficult to deal with, OEMs and EMSs are progressively reducing
it to a few key suppliers. Hence, knowing they could easily lose their business to a competitor, sub-
assemblers face constant pressure to supply high-quality products with minimal delays and
reasonable prices.
On the other hand, once suppliers have proven they can handle the stringent requirements of
customers, OEMs engage this condensed supplier base in long-term relationships. Although the
Y2K bug prompted the implementation of enterprise-wide information systems, small sub-
assemblers still lack data integration.

The Case of the Canadian Optical Connectivity Equipment Value Chain
© Lefebvre et al, 2001
24
2.2.4.2 TRENDS
Web-based collaboration tools, often developed or promoted by OEMs, are now being identified
and configured to reduce cycle and fulfillment times. Canadian sub-assemblers are slowly
reorganizing themselves to access these platforms. The adoption of e-commerce enabling
technologies such as e-procurement tools will allow them to collaborate with OEMs and
assemblers. However, financial barriers have compelled sub-assemblers to be creative when it
comes to exploiting e-commerce functionalities. Sub-assemblers will be relieved by two main
trends:
• The emergence of electronic marketplaces is providing new business opportunities for
sub-assemblers with easy-to-use transactional tools and worldwide market visibility.
• The option of renting services from an application service provider (ASP) to fulfill e-
commerce requirements is slowly gaining momentum and will facilitate the decision to
exploit new technologies.
All of these e-commerce technologies will be put in place to react to the system integrator’s goal of
a leaner supply chain. Furthermore, sub-assemblers will develop demand-pull capabilities by
increasing manufacturing and assembly flexibility and by giving fast response times to assemblers
and system integrators. This supply chain will emphasize efficient inventory management,
especially on joint inventory strategies such as vendor-managed inventory (VMI). Along with
increased product modularity, these strategies are inciting a small number of sub-assemblers to
produce final assemblies.
2.3 MARKETPLACES AND TRANSACTION STRUCTURE
To conclude the second chapter, marketplaces4 in the optical connectivity solution value chain are
defined. Table 2.1 presents the four main marketplaces with their associated transaction structure.
4 In the context of the OECD EBIP project, marketplace is defined as a specific environment in which the
characteristics and dynamics of actual transaction points can be observed through qualitative and/or quantitative research

The Case of the Canadian Optical Connectivity Equipment Value Chain
© Lefebvre et al, 2001
25
Table 2.1 Drivers of the transaction structure in the marketplaces
for the optical connectivity solution value chain
Sellers
Sub-assemblers Assemblers
System
integrators
Network
operators
Network operators Marketplace 4
MRO N/A
Marketplace 1 Project scope,
technological
dependencies, informal
relationships and time to
market
N/A
System integrators N/A Marketplace 2 LT Collaboration
N/A
Assemblers Marketplace 3
Demand-pull strategy N/A
Buy
ers
Sub-assemblers N/A
In marketplace 1, four major drivers influence the dynamic of the transaction between network
operators and system integrators. First, the scope of the telecommunication project for which the
equipment is needed is a determining factor in the procurement process. For example, in the case of
large new infrastructure projects, the network operator usually invites preferred equipment
providers to summit a bid in a formal request for proposal based on the technical specifications of
the project. Technological dependencies also greatly influence the procurement process; network
operators who own equipment from a certain manufacturer will be inclined to reorder from the
same OEM. Time to market is the third determining driver; the OEM with the shortest order cycle
time will often be granted the contract. The importance of relationship is the last driver. The
transaction structure of this marketplace is greatly influenced by informal relationships that exist
between the network operator’s engineering department and the OEM’s field engineers.
The dynamic of the transaction structure in marketplace 2 is mostly driven by the long-term
relationships that link system integrators and assemblers. As described in section 2.2.3, many
OEMs are selling their former manufacturing plants to EMSs and establishing long-term
contracting agreements with them. Moreover, in order to reduce its risks, a system integrator will
always contract with more than one EMS.

The Case of the Canadian Optical Connectivity Equipment Value Chain
© Lefebvre et al, 2001
26
Assemblers and sub-assemblers are doing business in the third marketplace. The transaction
structure that unites them is shaped by the OEM’s supply chain strategy. Leading OEMs are
currently gearing their supplier base to handle the increasing velocity of the supply chain’s physical
and informational flow. Moreover, the shift from “supply chain” to “demand chain” emerges as
just-in-time initiatives are enforced and inventory levels are optimized. To achieve this demand-
pull manufacturing strategy, suppliers are granted blanket orders and more responsibilities to
deliver on very short notice.
In marketplace 4, network operators deal directly with sub-assemblers. The products being
exchanged are mostly used for maintenance, repair and operations (MRO). These products are
usually shipped directly to the network operator.

The Case of the Canadian Optical Connectivity Equipment Value Chain
© Lefebvre et al, 2
3. CASE STUDY PRESENTATIONS
3.1 POSITION OF PROACTIVE FIRMS IN THE VALUE CHAIN
This section describes the case studies of the four firms involved in the connectivity equipment
value chain (see figure 3.1). These firms, which form the core group of the study, were selected
because they are proactive in e-commerce. Nortel Networks, a large Canadian telecommunication
equipment manufacturer, was chosen for the first case study. It has implemented leading-edge
electronic commerce tools to support its supply chain. Celestica, also selected in the core group, is
a large EMS and part of the assembler layer of the value chain. The last two companies both do
business in the sub-assembler layer. They have asked to remain unidentified and thus will be
referred as SUB1 and SUB2.
After the case p
• the valu
for all la
• motivat
• effects o
Figure 3.1 The Optical Connectivity Equipment Value Chain
001 27
resentations, the next sections will elaborate on:
e chain’s technology profile, which presents nine common e-commerce initiatives
yers of the value chain;
ions and obstacles in the adoption of e-commerce;
f e-commerce on product, process and relational innovations.

The Case of the Canadian Optical Connectivity Equipment Value Chain
© Lefebvre et al, 2001
28
3.2 PRESENTATION OF THE CASES
3.2.1 THE CASE OF AN INTEGRATOR/ASSEMBLER: NORTEL NETWORKS
3.2.1.1 BACKGROUND INFORMATION ON NORTEL NETWORKS
Nortel Networks was founded in 1895 as Northern Electric and Manufacturing Company, later
operating under the name of Northern Telecom. For the last hundred years, this Canadian company
has maintained a reputation as a leading-edge firm in the field of manufacturing and research in the
telecommunication equipment industry. In 1998, Northern Telecom acquired Bay Networks, a
worldwide leader in data networks, and changed its name to Nortel Networks to better position
itself as an integrated network solutions provider. In 2000, BCE Inc., Nortel’s largest shareholder,
decided to sell its equity in the manufacturer. Nortel Networks is now a truly independent global
Internet and communications leader in the optical, wireless, local Internet and e-business fields.5
Appendix A offers a graphical timeline of Nortel’s major milestones from 1997-2000.
In recent years, Nortel has benefited from a huge expansion. From 1995 to 2000, revenues
increased from US $10 billion to US $30.2 billion. Nortel Networks serves service providers,
carriers, dot-coms, and corporations in more than 100 countries around the world. It has offices and
facilities in Canada, Europe, the Asia-Pacific region, the Caribbean, Latin America, the Middle
East, Africa, and the United States. Nortel Networks employs approximately 75,000 people
worldwide.
In 1999, Nortel announced its intention to make a transition from vertical to virtual integration.
Nortel decided to increase its focus on competitive advantages such as R&D, product design and
system integration and to outsource low-value-added activities like manufacturing and assembly.
To adopt this “virtual manufacturing” strategy, Nortel sold a significant number of its assembly
plants to manufacturing specialists such as Solectron and Celestica. By outsourcing assembly,
Nortel benefits from higher manufacturing flexibility, lower production costs and a high return on
investments. However, Nortel did keep the most strategic parts of its manufacturing processes in-
house.
5 An extensive version of Nortel Networks’ history can be found at
http://www.nortelnetworks.com/corporate/events/1-26-00a/history.html

The Case of the Canadian Optical Connectivity Equipment Value Chain
© Lefebvre et al, 2001
29
Furthermore, Nortel has been investing time and energy to build and maintain a well-oiled demand-
driven supply chain in order to respond efficiently to the critical time-to-market imperative. Nortel
has implemented a major business-to-business electronic commerce initiative to support this supply
chain strategy. Over the last four years, Nortel global operations invested more than CAN $500
million to web-enable its supply chain. This investment has already generated a high return on
investments by improving response time with its first-tier suppliers and thus significantly reducing
inventory levels.
3.2.1.2 BACKGROUND INFORMATION ON NORTEL NETWORKS’ OPTICAL DIVISION
Optical connectivity equipment accounts for Nortel’s most important and most valuable product
lines and will constitute the main focus of this case study6. As described in 2.2.2, Nortel Optical is
the world leader in the optical equipment industry, controlling more than 43 % of a market
estimated at US $1.5 billion annually.
Nortel Optical’s success in the optical industry can be attributed to the groundbreaking introduction
of its OC-192 product. In the mid-1990s, led by the vision of its CEO, John Roth, and by the R&D
innovativeness of the Bell Northern Research lab, Nortel Optical successfully bet on the right
technological choice for the development of its broadband transmission equipment. At that time,
the manufacturers of optical equipment were at a crossroads: they could either increase the speed of
the lasers in the transport node, or split the laser beam into a greater number of colours. Unlike
Lucent, which chose the second alternative, Nortel Optical decided to increase the speed of its
equipment to OC-192. As a result adoption of Nortel Optical’s equipment proved to be cheaper for
network operators, and thus the better decision. As of 1999, 80% of the world’s most important
network operators had adopted Nortel Optical equipment.
Nortel Network’s optical division is almost entirely located in Canada7, although it runs offices in
Northern Ireland and the USA. On a global basis, this division employs close to 6,000 workers,
including 4,000 in Canada. In 1999, approximately 80% of the division’s revenues were generated
from products manufactured in Canadian facilities.
6 For this point on, “Nortel Optical” will be used to designate Nortel Networks’ optical division
7 Laser manufacturing is executed in Paignton, UK

The Case of the Canadian Optical Connectivity Equipment Value Chain
© Lefebvre et al, 2001
30
3.2.1.3 POSITIONING NORTEL OPTICAL IN THE OPTICAL CONNECTIVITY EQUIPMENT VALUE CHAIN
On the supplier side, Nortel Optical deals with a limited number of large assemblers (for example,
Celestica, C-Mac and SCI) and with a supplier base that ranges from 300 to 400 sub-assemblers
and component manufacturers. Very large enterprises with more than 500 employees make up 85%
of these suppliers, while the remaining 15% are small firms (10 to 250 employees). Furthermore,
sourcing globally, Nortel Optical buys 60% of the parts and components outside Canada. Finally,
Nortel Optical seldom buys electronic parts and components of low value through intermediaries,
especially for product shortages.
According to Nortel Optical, the rate of entry of new suppliers in the industry is generally very low
except for suppliers of optical components, a field of business in which many start-up companies
with leading-edge knowledge in optical technology have experienced rapid growth. Moreover,
major suppliers generally have a strong influence on the value chain, especially when these firms
own unique technological knowledge or provide a strategic component. Nortel Optical usually
develops long-term collaborative relationships with these key suppliers.
On the customer side, Nortel Optical sells its optical products directly to network operators in more
than 100 countries. Nortel Optical, which rarely uses intermediaries to sell its products, addresses
all customer segments described in section 2.2.1.
As described earlier, deregulation in the telecommunication industry, the shift from voice to data,
and the booming demand for bandwidth have greatly changed the competitive dynamic among
network operators. The rate of entry of new players and the expanding service offerings of existing
operators are creating tremendous opportunities for equipment manufacturers like Nortel Optical.
Moreover, Nortel Optical understands the critical role of the operators in the value chain and
involves the customer at every stage of its demand-pull supply chain.
3.2.1.4 BUSINESS PROFILE OF THE FIRM
The transaction structure with each supplier is influenced by the nature and maturity of the parts or
components provided to Nortel Optical.
For standard and mature components, Nortel Optical usually develops long-term relationships with
its suppliers by negotiating supply contracts. The conditions of these blanket orders are reviewed
and benchmarked annually to the market situation. Moreover, most of the standard components are

The Case of the Canadian Optical Connectivity Equipment Value Chain
© Lefebvre et al, 2001
31
ordered on a rapid replenishment basis, i.e. Nortel Optical keeps a very low inventory level and
suppliers must ship required components more frequently, sometimes up to twice a day. To reduce
the risks of shortages, suppliers need to maintain a safety stock of these finished products.
For customized or newly designed components, suppliers are usually selected during a request for
proposal (RFP). Until components reach the required maturity and/or production volume, they are
negotiated in an annual supply contract and are often ordered on an “as per order” basis. These
orders represent approximately 30% of all procurement transactions. Nortel Optical puts a lot of
effort to work with suppliers to monitor their supply chain and capacity constraints
The transaction structure between Nortel Optical and the network operators has been generically
described in 2.3. These transactions, usually based on an RFP, rely extensively on human
interaction between the buyer and the seller, and are very difficult to automate with electronic
commerce.
Moreover, due to the constant need to be first to market in the optical business, Nortel Optical has
been pursuing a strategy of acquiring knowledge-intensive firms in the field of optical networks for
the last three years. Indeed, since 1998, Nortel has acquired on average one firm per month. Among
the most notable acquisitions, Nortel bought Bay Networks, the third largest member of the US
data communication industry. With such a portfolio in optical networks, Nortel now holds the
leading position in the industry, with the capacity to act as the one-stop-shop for any network
operator.
3.2.2 THE CASE OF AN ASSEMBLER: CELESTICA
3.2.2.1 BACKGROUND INFORMATION
Celestica is a Canadian EMS specializing in the contract manufacturing of electronic products. It
offers a wide range of services, from design and prototyping to printed circuit and full-system
assembly, as well as failure analysis, packaging and repair services. With over US $10 billion in
worldwide revenues, 40% of which is generated in Canada, Celestica ranks among the world’s
three largest EMSs.
Celestica Inc. was founded in 1994 as a wholly owned IBM Canada subsidiary. Acquired by Onex
Corporation and a team of former IBM officers in 1996, Celestica has been a publicly owned

The Case of the Canadian Optical Connectivity Equipment Value Chain
© Lefebvre et al, 2001
32
company since 1999; it now has a market capitalization of more than US $14 billion. Celestica’s
shares (symbol: CLS) are traded on both the Toronto and New York stock exchanges.
In recent years, this Canadian EMS has made major investments to develop a large worldwide
network of manufacturing plants located close to its major customers. Celestica has thus acquired
18 plants over the last three years and now owns a network of 34 manufacturing and design
facilities in 12 countries (United States, Canada, Mexico, United Kingdom, Ireland, Italy, Czech
Republic, Thailand, Hong Kong, China, Malaysia and Brazil). Celestica employs 29,000 people,
7,000 of them at its Canadian facilities in Toronto, Aurora, and Richmond Hill.
3.2.2.2 POSITIONING OF CELESTICA IN THE OPTICAL CONNECTIVITY EQUIPMENT VALUE CHAIN
On the customer side, Celestica actively serves a portfolio of 75 to 100 OEMs. These customers are
mostly large multinationals with over 500 employees. Cisco Systems, Dell Computer, EMC
Corporation, Hewlett-Packard, IBM, Lucent Technologies, Nortel Networks,8 and Sun
Microsystems are Celestica’s most important customers. Moreover, Celestica’s top five customers
usually represent more than 60% of its annual revenues. As explained in section 2.3, transactions
between Celestica and its customers are structured around long-term relationships. EMSs will often
agree to acquire OEMs’ manufacturing facilities against a promise of a three- or four-year contract.
As described in section 2.2.3.1, the EMS segment is growing exponentially, driven by the
outsourcing trend in the system integrator layer. Like its main competitors, Celestica expects its
customer base to expand as more OEMs move toward outsourcing more of their manufacturing
activities.
On the supplier side, Celestica deals with 800 to 900 sub-assemblers and component
manufacturers. This large supplier base (four time the size of Nortel Optical’s) is explained by the
fact that OEMs very often impose their choice of suppliers upon Celestica. Therefore, the EMS has
to deal with all of its customers’ supplier bases. Suppliers can be divided into two categories:
medium-sized sub-assemblers and large manufacturers of components such as Texas Instruments
and Hewlett-Packard. In the past, EMSs’ buying power was not strong enough to really influence
8 Celestica and Nortel Networks have been in a relationship for just over one year.

The Case of the Canadian Optical Connectivity Equipment Value Chain
© Lefebvre et al, 2001
33
these multinational suppliers but as contract manufacturers reach a certain size, they can negotiate
preferred conditions.
Celestica only uses intermediaries to source scarce components. Celestica’s preferred intermediary
is PartMiner (www.partminer.com). This on-line marketplace operates a web-based catalogue that
facilitates the procurement of components in short supply. According to Andrew Gort, senior vice-
president of supply chain management at Celestica, “PartMiner’s unique on-line model enables
Celestica to fulfill global orders faster and more effectively.” Moreover, PartMiner has recently
announced that it has entered into a partnership with e2open, the supply chain platform selected by
Nortel Networks and nine other large OEMs in the electronics industry (see section 3.3).
3.2.2.3 BUSINESS PROFILE OF THE FIRM
To respond efficiently to the dynamic contract manufacturing environment, Celestica aims to
differentiate its offering from those of competing EMSs. First, Celestica has been investing a lot of
energy in enlarging its service scope with new value-added services such as design for
manufacturing and prototyping solutions. In fact, Celestica has internally developed the expertise to
collaborate with its customers at the product development stage in order to help reduce the
manufacturing cycle time of products.
Second, Celestica now operates a web-based catalogue that includes all the required information on
its suppliers’ products. Celestica’s customers can log on to the platform and benchmark their own
suppliers against a wider range of options. This catalogue is further described in section 3.3.
3.2.3 THE CASE OF SUB-ASSEMBLER: SUB1
3.2.3.1 BACKGROUND INFORMATION
SUB1 is an independent Canadian business unit that operates a single plant in the Montreal area.
This plant specializes in metal sheet transformation, where customized metal parts and components
are manufactured to the customer’s requirements.
3.2.3.2 POSITIONING OF SUB1 IN THE ICT VALUE CHAIN
In spite of its small size compared to the other players in the value chain, SUB1 is proactive in
adopting new ways to improve its offering. On the customer side, SUB1 deals with more than 100

The Case of the Canadian Optical Connectivity Equipment Value Chain
© Lefebvre et al, 2001
34
customers, a majority of which operate in Canada. Ten large assemblers in various industries
account for 90% of SUB1’s revenues. On the supplier side, SUB1 deals with 250 suppliers, mainly
SMEs, and with 50 metal wholesalers that act as intermediaries.
The metal industry is known as a traditional one and SUB1’s external environment has remained
relatively stable, with very few entries and exits of customers, competitors and suppliers.
Moreover, due to their size, SUB1’s major customers and major suppliers highly influence the
market structure, as they become vital business partners.
3.2.3.3 BUSINESS PROFILE OF SUB1
As explained earlier, in the case of Nortel Optical, one of its major customers, transactions are “as
per order” (APO) for customized and newly designed parts. For mature parts, transactions are
processed under an annual supply chain contract. As most of SUB1’s products are customized, the
transaction process with its customers is as follows:
1. SUB1 replies to an RFP received by fax or e-mail and usually accompanied by a technical
drawing of the component.
2. The CAD drawing is then evaluated and the quote is sent back to the customer by e-mail.
With its suppliers, procurement of components, consisting mainly of raw materials, is very simple
and straightforward requiring no RFPs or other forms. A simple phone call and a fixed price list are
sufficient to carry out business efficiently.
Moreover, with a shorter time-to-market imperative and with the reduction of the supplier base in
the ICT industry, SUB1 knows that it could easily lose its business to a competitor. SUB1 is
therefore forced to supply very high-quality products at low prices while shortening its cycle times.
In response to these trends, SUB1 has used the following strategies:
1. Reducing response times to RFPs.
2. Appling flexible internal manufacturing processes by
• following a demand-pull manufacturing strategy on the shop floor,
• operating on an assemble-to-order format (keeping WIP before its differentiation
point to customize the product afterwards).

The Case of the Canadian Optical Connectivity Equipment Value Chain
© Lefebvre et al, 2001
35
3. Responding to different supply chain strategies with the implementation of e-commerce and
rapid replenishment tools.
In addition, even though SUB1’s suppliers are hard to influence, it has automated the replenishment
process with some of its key suppliers to extend the demand-pull strategy through the supply chain,
thereby ensuring better integration and faster time to market.
3.2.4 THE CASE OF SUB-ASSEMBLER : SUB2
3.2.4.1 BACKGROUND OF SUB2
SUB2 is the subsidiary of a privately owned American multinational and is located closed to Nortel
Optical’s plant in St-Laurent. SUB2 produces and sub-assembles a wide range of cables, harnessing
and electronic mechanical components.
3.2.4.2 POSITIONING OF SUB2 IN THE ICT INDUSTRY VALUE CHAIN
SUB2’s customer base is composed of OEMs such as Nortel and contract manufacturers like C-
Mac, Celestica and Solectron. On the whole, SUB2 deals with less than 100 customers, 75 % of
them Canadian firms. SUB2 rarely sells through intermediaries. On the supplier side, SUB2 sources
from 1100 suppliers and few intermediaries, located mainly in Canada.
Compared to SUB1’s highly stable environment, SUB2’s case study has revealed a much more
dynamic context. This part of the industry value chain is slowly moving from a linear physical
chain to a web-like structure.
3.2.4.3 BUSINESS PROFILE
SUB2 provides its customers with basic components customized to specific requirements. The life
cycle of these parts is usually very long due to their standard nature and low complexity. The
majority of SUB2’s products are sold to assemblers under long-term contracts where prices are
negotiated once a year.
SUB2 was quick to recognize the importance of information systems. Several years ago, it
internally developed its own enterprise resource planning (ERP) software to fulfill its very specific
management needs. To complement the ERP system, SUB2 also implemented, in the early 1990s,
several EDI links with its major customers, such as Nortel. As the EDI system is well integrated

The Case of the Canadian Optical Connectivity Equipment Value Chain
© Lefebvre et al, 2001
36
with the ERP, SUB2 has decided not to develop a customized interface with Nortel Optical’s new
web-based communication tools (described in 3.2), but to operate both communication channels
(EDI and web) simultaneously. Performing in a make-to-stock environment, SUB2 emphasizes
flexible manufacturing to deliver products in a demand-driven supply chain. According to a SUB2
representative: “We have been dealing with them long enough to know that we are internally set up
to deal with whatever they throw at us.”
3.3 TECHNOLOGY PROFILE OF THE VALUE CHAIN
This section introduces ten electronic commerce initiatives identified in the optical connectivity
value chain. Note that the number associated with each initiative will later be used to describe the
effects of electronic commerce on business practices.
#1: COMMON SUPPLY CHAIN PLATFORM
Nortel’s optical division’s extranet is being used to exchange information with suppliers. Based on
TCP/IP, the extranet is accessible through the Internet by authorized business partners (secure
access using the Nortel.access portal). The extranet supports different supply chain tools (see
initiatives 2, 3, 4 and 5) and serves as a collaboration platform for all value chain partners.
#2: WEB PURCHASE ORDERS
Web PO is one of Nortel Optical’s extranet applications. It enables the transmission of purchase
orders (PO) through a web interface. Web PO has replaced the traditional fax ordering system and
is an alternative to the EDI system. Integrated into an ERP system, Web PO allows purchase orders
to flow directly to the appropriate supplier account on the extranet, increasing the velocity of
information transfer and eliminating the risk of redundancy and human errors. Suppliers log on to
the extranet and acknowledge POs by confirming the delivery date, quantity and price. The
supplier’s acknowledgment is then fed back to Nortel Optical’s ERP system after a final validation
by the buyer. As for Celestica, it has chosen to send ERP-generated electronic POs directly to its
suppliers without using any web-based tools.
#3: WEB REPLENISHMENT
The replenishment tool is a web-based application also accessible through the extranet. It is based
on a demand-driven system where ordering is done directly from the shop floor. Team leaders on

The Case of the Canadian Optical Connectivity Equipment Value Chain
© Lefebvre et al, 2001
37
the production line have the responsibility for inputting the number of components or subsystems
needed to fill their respective Kanban bins. Upon receipt of these replenishment orders, suppliers
have a short time to accept or refuse the request. If they accept, the delivery must be made in a 12-
to 48-hour window, influenced by the supplier’s logistical constraints.
#4: WEB SHIPPING
The web shipping tool is another extranet application designed to collect shipping information from
Nortel Optical’s suppliers, which deliver directly to the final customer, i.e. network operators. Once
a requested material is shipped, the supplier signs on to the web shipping module to complete the
transaction. The supplier enters the shipping information, finds the appropriate PO line and submits
the transaction. This input is then extracted from the extranet and fed back to the packing, shipping
and account payable modules of Nortel Optical’s ERP.
#5: SUPPLY CHAIN VISIBILITY TOOL
Nortel Optical’s extranet also enables visibility of information throughout the supply chain. On the
one hand, the tool ensures the diffusion of Nortel Optical’s forecasts to the suppliers. Forecasts are
extracted from the ERP system and posted on the extranet. Suppliers then log on to the platform
and download the forecasts (linking them to their information system in some cases). On the other
hand, suppliers use the tool to issue frequent updates on their internal capacity and inventory status.
The visibility that this tool brings to the supply chain helps Nortel Optical to efficiently coordinate
its supplier base. For example, Nortel Optical can now easily identify potential shortages in
advance and has more time to resolve them. Celestica uses a similar tool with its suppliers, the
repetitive supplier scheduling (RSS) system.
#6: BILLING AND PAYMENT
When processed electronically, billing and payment are mostly done over EDI between every level
of the supply chain. These transactions are usually linked to the firms’ internal systems.
#7: TECHNICAL FILE TRANSFERS
When an assembler sends a request for proposal (RFP) for a custom-made component or
subsystem, the selected suppliers receive the blueprint of the required part in a standard digital

The Case of the Canadian Optical Connectivity Equipment Value Chain
© Lefebvre et al, 2001
38
format. The files are either sent through an FTP server or directly by encrypted e-mail. The
electronic transfer of these files has significantly reduced the length of the bidding process.
#8: e2open
Along with technology partners Ariba, I2 Technologies, IBM, PartMiner and MatrixOne, a group
of leading OEMs in the computer, telecom equipment and consumer electronics industries, namely
Acer, Hitachi, IBM, LG Electronics, Lucent Technologies, Nortel Networks, Panasonic, Seagate
Technology, Solectron and Toshiba, have recently announced the creation of an electronic
marketplace to bring together their common supplier base, thereby creating a web of potential
multi-tiers suppliers. Called e2open (www.e2open.com), this non-buyer-centric sectorial platform
“will support the entire product lifecycle from design, source and build, to marketing, selling, and
end-of-life management.”9 More specifically, this industry hub will facilitate collaborative design,
enable MRO procurement, operate auctions and spot buys, and allow the planning, management
and execution of supply chain transactions.
Nortel Networks has recently decided to adopt e2open for the total of its global operations.
Therefore, Nortel Optical is currently in the process of migrating from the web tools hosted in its
extranets (initiatives 2, 3, 4 and 5) to e2open. Nortel Optical could buy up to $5 billion in goods and
services on this marketplace by the end of 2001 (Economist, 2000). Moreover, Nortel Networks
wishes to have its first- and second-tier suppliers carry out their own procurement activities on
e2open.
#9: PRODUCT CONFIGURATOR
As described earlier, the ordering process for optical connectivity equipment is complex because of
the high level of product customization. Nortel Optical’s vision is to create a web-based expert
system that will enable network planners to configure the required telecommunication equipment.
Even though some pilot projects have been initiated, it is very difficult to develop an all-inclusive
efficient product configurator.
9 www.e2open.com

The Case of the Canadian Optical Connectivity Equipment Value Chain
© Lefebvre et al, 2001
39
#10: COMPONENT AND SUPPLIER MANAGEMENT TOOL
Celestica’s component and supplier management tool, developed by Aspect Development, is a
web-based catalogue classifying qualified suppliers. It facilitates and supports the decision-making
process for supplier selection at Celestica. In the long run, this tool will also enable major
customers to expand and benchmark their supplier base.
3.4 THE FIRM’S MOTIVATIONS AND EXPECTATIONS REGARDING THE EFFECTS OF E-
COMMERCE
Nortel Networks, like most OEMs, drives the adoption of electronic commerce tools and
applications in its supply chain. Most of the tools described earlier (initiatives 1, 2, 3, 4 and 5) were
developed internally by Nortel Optical’s development team to suit the very specific needs and
imperatives of the optical equipment supply chain.
Nortel Optical’s main motivations in adopting electronic commerce are the following:
• Build a real-time web-based information exchange mechanism with its whole supplier base;
• Reduce human intervention in the procurement process;
• Ensure efficient data integrity, traceability and warehousing;
• Eliminate information redundancy;
• Become a paperless supply chain by digitizing the transaction;
• Achieve supply chain integration by linking electronic commerce tools to internal systems
(e.g. ERP system);
• Secure supply chain partnerships.
Nortel Optical expected its electronic commerce tools to:
• Be deployed rapidly and efficiently;
• Create significant savings in the procurement process (e.g. 57% savings in the procurement
cycle time and 63% reduction in the order confirmation time);
The Case of the Canadian Optical Connectivity Equipment Value Chain
© Lefebvre et al, 2001
40
• Improve manufacturing flexibility;
• Support its demand-pull strategy;
• Reduce replenishment cycle time (e.g. lowering inventory levels by 35%);
• Support expected business growth.
Building on its strong influence on the chain, Nortel Optical was well positioned to urge its
business partners to adopt these new tools, thereby achieving a rapid diffusion of business-to-
business electronic commerce in the value chain.
Furthermore, suppliers obviously expected to benefit from the adoption of electronic commerce.
Most of Nortel Optical’s motivations and expectations in adopting e-commerce tools also applied
to the supplier base. For example, real-time information exchange, information integrity and
digitization benefit both buyers and sellers. However, since e-commerce tools are not yet integrated
with the suppliers’ internal systems, the expected savings are lower for the suppliers.
The main motivation for suppliers to adopt electronic commerce was to satisfy their customer,
Nortel Optical. For most suppliers, Nortel Optical’s requirements are critical as it represents their
major account. Moreover, suppliers are aware that Nortel Optical usually prefers dealing with a
limited numbers of business partners and that adopting its e-commerce initiative is a method to
develop or maintain preferred relationships with the OEM.
Celestica’s motivation to adopt electronic commerce is strongly influenced by its relationships with
large customers (e.g. Nortel Networks and Sun Microsystems) and large suppliers (e.g. Hewlett-
Packard and Texas Instruments). Electronic commerce tools and standards are imposed by these
strong business partners and Celestica has no choice but to adapt its internal system to these
different ways of conducting business. Moreover, Celestica’s expectations of electronic commerce
are quite similar to those of Nortel Optical: faster cycle time, less human intervention, data
integrity, and better integration within the chain.
3.5 OBSTACLES AND ADVANTAGES FOR EXPLOITING E-COMMERCE’S POTENTIAL
Several factors constitute obstacles or advantages for exploiting the potential of electronic
commerce. For each of the following issues, Nortel Optical’s perception and the perception of the
other members of the core group are explained.

The Case of the Canadian Optical Connectivity Equipment Value Chain
© Lefebvre et al, 2001
41
3.5.1 FACTORS RELATING TO THE TELECOMMUNICATION INFRASTRUCTURE
For Nortel Optical and Celestica, the cost, reliability and flexibility of the telecommunication
infrastructure do not determine the success of the electronic commerce initiative. The cost and
availability of reliable high-speed Internet access occasionally constitute obstacles to the successful
adoption of electronic commerce tools by suppliers. One SUB1 identified poor network reliability
as a factor that impeded the success of the electronic commerce initiative.
3.5.2 REGULATORY FACTORS
Nortel Optical considers that the Canadian regulatory context (transaction security, authentication
and certification as well as the legal structure) encourages electronic commerce. For the other
members of the core group, regulatory factors were not taken into consideration due to their passive
role in the development of electronic commerce initiatives. Nevertheless, Celestica considers that
weak intellectual property protection discourages electronic commerce, while one sub-assembler
considers that authentication and certification technology is generating growing trust in electronic
commerce.
3.5.3 INTERNAL FACTORS
Unlike Nortel Optical and Celestica, the sub-assemblers believe they do not have sufficient internal
expertise to efficiently support their participation in electronic commerce projects. Only Nortel
Optical had existing in-house technology to support electronic commerce. Finally, management of
all firms has been proactive and investment costs were easily justified.
3.5.4 EXTERNAL FACTORS RELATING TO RELATIONS WITH OTHER ENTERPRISES
As for the external factors, all firms have encountered similar positive impacts, apart from the
human factors, which have been a challenging issue for all members of the core group. The success
of the electronic commerce initiatives has contributed positively to enhancing the brand image of
all firms interviewed. Finally, electronic commerce has played a key role in the development of a
more flexible supply chain network.

The Case of the Canadian Optical Connectivity Equipment Value Chain
© Lefebvre et al, 2001
42
3.5.5 STRATEGIC FACTORS RELATING TO COMPETITIVENESS
Both Nortel Optical and Celestica consider that electronic commerce contributed to strengthen
preferred long-term relationships with their supplier bases (lock-in situation for the suppliers).
Moreover, all members of the core group believe that e-commerce facilitates the management and
coordination of relationships in the supply chain.
3.5.6 GOVERNMENT POLICY IN GENERAL
The four companies interviewed all agreed that an “e-commerce-aware” education initiative is the
most important contribution a government could make. Policies in the field of e-commerce could
enable the education system to provide adequately trained personnel to engage in e-business.
Finally, Celestica considers that taxation measures do not encourage firms to engage in electronic
commerce.
3.6 EFFECTS
This section points out the impacts of e-commerce on transaction preparation and completion and
production support at all levels of the value chain. These impacts are assessed according to three
types of innovations generated in the value chain: product, process, and relational innovations.
The ten e-commerce initiatives identified in section 3.3 have present (E) and/or future (F) effects on
the value chain. Each of these initiatives can have potential effects at different levels (one or more)
of the chain. The effects of the ten initiatives are mapped on the evaluation grids presented below
(tables 3.1 to 3.4) according to the type of innovation and the transaction process. These grids have
been prepared for each firm in the core group. As a reminder, here are the ten initiatives:
#1: Common supply chain platform
#2: Web purchase orders
#3: Web replenishment
#4: Web shipping
#5: Supply chain visibility tool
#6: Billing and payment
#7: Technical file transfers
#8: e2open
#9: Product configurator
#10: Component and supplier management

The Canadian Optical Connectivity Equipment Value Chain
43
3.6.1 NORTEL OPTICAL‘S EVALUATION GRID
Table 3.1 Nortel Optical‘s evaluation grid
ELECTRONIC COMMERCE INNOVATIONS
Transaction Preparation
Transaction Completion
Production Support
adve
rtis
ing
cata
logu
es
info
ser
vice
s
nego
tiatio
n
orde
rs
billi
ng &
pa
ymen
t
finan
ce
deliv
ery
tran
sact
ion
in
fo c
aptu
re
info
rmat
ion
man
agem
ent
mar
ket a
naly
sis
mar
ket
deve
lopm
ent
supp
lier
deve
lopm
ent
diversification
differentiation
customization F9 F9 Prod
uct
inno
vatio
ns
bundling
design F8 F9
E7
logistics F8 E5 E5 F8 E6 E4
production lines E5 E5 E3 F8
Proc
ess
inno
vatio
ns
coordination and integration F8 E5
E3 E5 F8
E2 F8
E6 E4 E1 E1
geographical expansion F8
market segmentation F8
trust E7 E1 E1 Rel
atio
nal
inno
vatio
ns
loyalty E1 E1
E1: A common platform induces process and relational innovations by supporting production.
This extranet provides common supply chain means to capture and manage information,
leveraging trust, loyalty and integration. Other layers of the value chain encounter similar
effects.

The Canadian Optical Connectivity Equipment Value Chain
44
E2: Web PO is a process innovation that supports transaction completion. The integration of
web orders with Nortel Optical’s ERP system provides a medium that ensures the
integrity and reliability of the transaction between Nortel Optical and its supplier base.
E3: The replenishment tool’s impact on Nortel Optical is threefold. Firstly, it promotes
coordination by accelerating the suppliers’ response time in the replenishment negotiation
process. Secondly, it assigns ordering responsibility directly to the production team
leaders. Finally, it enables a real pull system with daily exchanges of final customer
demand information.
E4: Web shipping is a process innovation that facilitates transaction completion for direct
product delivery from suppliers to network operators. It automates the closure of POs in
Nortel Optical’s systems, triggers the payment and helps product tracking for logistical
purposes.
E5: The supply chain visibility tool has improved the transaction preparation process,
especially for logistics, production and coordination activities. This tool is essential to
Nortel Optical’s demand-driven strategy which, by sharing forecasts and capacity
constraints with first-tier suppliers, reduces required inventory levels and avoids inventory
increases. Furthermore, supply chain tools changed the way Nortel Optical deals with its
suppliers. As a matter of fact, “the buyers now spend much of their time talking, not only
to first tier suppliers, but also to second and third tier about the main constraints in
meeting demand for a particular market or consumer, and how they can be eased.”10
E6: Nortel Optical continues to use an EDI system to complete billing and payment with its
suppliers. The integration with the ERP system accelerates the process and maintains data
integrity.
E7: Technical file transfer speeds up negotiations in the preparation of and RFP. Suppliers can
rapidly gain access to the electronic file and quickly respond to Nortel Optical’s demand,
10 Interview with Chahram Bolouri, president of Nortel’s global operations. The shape of the new e-company,
The Economist, November 9, 2000.

The Canadian Optical Connectivity Equipment Value Chain
45
thus reducing the RFP cycle time. Nortel Optical will use this type of transfer with trusted
suppliers only.
F8: While enhancing some of the effects of Nortel Optical’s web tools, the additional
functionalities provided by e2open are expected to effect process and relational
innovations. e2open, with its catalogue and dynamic market mechanisms such as auctions,
will increase the flexibility and scope of Nortel Networks’ supply base. Collaboration
should also be improved with a common design platform. Finally, by integrating its
second- and third-tier suppliers into the e2open platform, Nortel’s objective is to enhance
and optimize its entire supply chain.
F9: The product configurator will provide important gains in transaction preparation and
completion while dealing with network operators. It will stimulate product innovation by
automating the process of negotiating and ordering customized telecommunication
equipment. It will also intensify process innovation by facilitating and accelerating the
customer’s network design.

The Canadian Optical Connectivity Equipment Value Chain
46
3.6.2 CELESTICA’S EVALUATION GRID
Table 3.2 Celestica’s evaluation grid
ELECTRONIC COMMERCE INNOVATIONS
Transaction Preparation
Transaction Completion
Production Support
adve
rtis
ing
cata
logu
es
info
ser
vice
s
nego
tiatio
n
orde
rs
billi
ng &
pa
ymen
t
finan
ce
deliv
ery
tran
sact
ion
in
fo c
aptu
re
info
rmat
ion
man
agem
ent
mar
ket a
naly
sis
mar
ket
deve
lopm
ent
supp
lier
deve
lopm
ent
diversification
differentiation
customization E7
Prod
uct i
nnov
atio
ns
bundling
design E7
logistics E5 F5
E5 F5 F2 E6
production lines E5 F5
E5 F5
Proc
ess
inno
vatio
ns
coordination and integration E10 E5 E5 E2 E6 F1 F1
geographical expansion F10
market segmentation F10
trust E7 F1 F1
Rela
tiona
l inn
ovat
ions
loyalty F1 F1
The Canadian Optical Connectivity Equipment Value Chain
47
Celestica and Nortel have been engaged in a integrator-assembler relationship for just over a year.
Celestica is planning to adopt some of Nortel Optical’s supply chain tools to do business with
Nortel. The future effects of these tools, displayed in table 3.2, are fully described below.
F1: Nortel Optical’s common platform is not yet being used by Celestica. However, given the
effects brought about by similar platforms with other customers, Celestica anticipates that
Nortel Optical’s extranet will positively affect not only the capture and management of
information but also trust, loyalty and integration between organizations.
F2-E2: By sending electronic POs to suppliers, Celestica benefits from quicker transaction
completion while improving the coordination of the supply chain. On the customer side,
transactions with Nortel Optical are not yet processed through Nortel Optical’s web PO
tool. This should induce process innovation by shortening the order cycle time.
F5-E5: Although Nortel Optical and Celestica do not yet share forecasts through web tools,
shared demand planning has been an integral part of customer relationship at Celestica for
some time now. For example, OEM platforms, such as Sun Microsystems’, enable the
sharing of forecasts with Celestica and ultimately with component suppliers. The use of
Nortel Optical’s supply chain visibility tool will improve the transaction preparation
process. Celestica has also put in place an EDI-based mechanism called Repetitive
Supplier Program to share lead time and demand data. This initiative generates process
innovations in transaction preparation.
E6: Celestica exploits an EDI system to bill customers and pay suppliers. Its integration with
Celestica’s ERP system ensures the speed and integrity of this process.
E7: Like Nortel Optical, Celestica uses technical file transfer to speed up negotiations with
suppliers at the transaction preparation stage. It uses this technology to collaborate in the
design process with its customers, thus inducing product innovation (e.g. product
customization) at the transaction preparation level.
E10: The component and supplier management tool affects both process and relational
innovations. On the one hand, Celestica’s catalogue greatly improves the selection of
suppliers and the coordination of transaction preparation. On the other hand, it will enable

The Canadian Optical Connectivity Equipment Value Chain
48
the assembler’s customers to benchmark their supplier base against a larger database of
potential business partners. This may have the effect of breaking existing relationships
between OEMs and their supplier bases.
3.6.3 SUB-ASSEMBLERS’ EVALUATION GRIDS
In order to clearly underline the similarities and differences in effects triggered by e-commerce
innovations within the sub-assembler layer, the evaluation grids of the two chosen sub-assemblers
in the core group are analyzed together in this section.
E1-F1: Sub-assemblers benefit from the same relational innovations as Nortel Optical with regard
to the use of a common supply chain platform. However, since neither sub-assembler has
yet integrated its internal systems with the extranet, they have not benefited as much as
the assembler from process innovations. Indeed, the sub-assemblers must rely on human
intervention to input and output data to and from the platform.
E2: Web PO fosters process innovations in the ordering transaction. It provides a faster
channel for procurement while ensuring data integrity. Moreover, the tool allows sub-
assemblers to centralize management of the relationship with Nortel Optical around a
single person.
E3-F3: In order to accelerate the suppliers’ response time to orders, process innovations such as
the assemblers’ web replenishment tools have changed the way transactions are
completed. SUB2 carries out a make-to-stock manufacturing strategy where standard
products are fabricated with a proficient manufacturing system. This information system
facilitates replenishment data integration and benefits supply chain relationships with
assemblers. On the other hand, SUB1’s manufacturing system is quite rigid but it has until
now been able to respond to demand with a flexible shop floor, thus compensating for
inadequate systems. However, SUB1 does not really benefit from web replenishment, as it
constantly has to implement production planning changes manually.
E4: Web shipping’s process innovation is exploited by SUB2 to deliver products to system
integrators and network operators. While automating the settlement of Nortel Optical’s
purchase orders, it informs all parties involved that the delivery is underway. This process

The Canadian Optical Connectivity Equipment Value Chain
49
innovation influences the promptness of payment and reduces the number of
communications for package tracking.
E5: Among the foremost activities involved in the transaction preparation process for supply
chain visibility tools are information services and negotiation. Affecting logistical and
production units, this involves better overall planning, forecast sharing and regular
updates (weekly) for both sub-assemblers. In the long run, SUB1 and SUB2 plan to
develop and extend Nortel Optical’s demand-driven strategy to their own suppliers.
E6: Billing and payment is a process innovation that supports transaction completion. Some
sub-assemblers have adopted EDI systems to bill customers; this is the case for both
SUB1 and SUB2, the latter of which has accelerated the procurement cycle with an EDI
system integrated into its information system.
E7: In order to speed up negotiations in the transaction preparation phase, SUB1 uses a
technical file transfer mechanism. Some manufacturers do not realize the value of this
device but it is perceived by others as a tool that accelerates design by increasing
workability on electronic blueprints. It also enables some companies to differentiate
themselves by offering value-added activities through the adoption of easy data exchange
formats and the reduction of RFP cycle time.
F8: e2open will constitute major process and relational innovations for sub-assemblers. In
terms of process innovations, sub-assemblers will benefit from the same efficiency gains
Nortel Optical experienced in its newly implemented web-based tools, such as increased
visibility and better coordination. Regarding relational innovations, e2open will enable
sub-assemblers to expand their market to other industries and to diversify their supply
base.
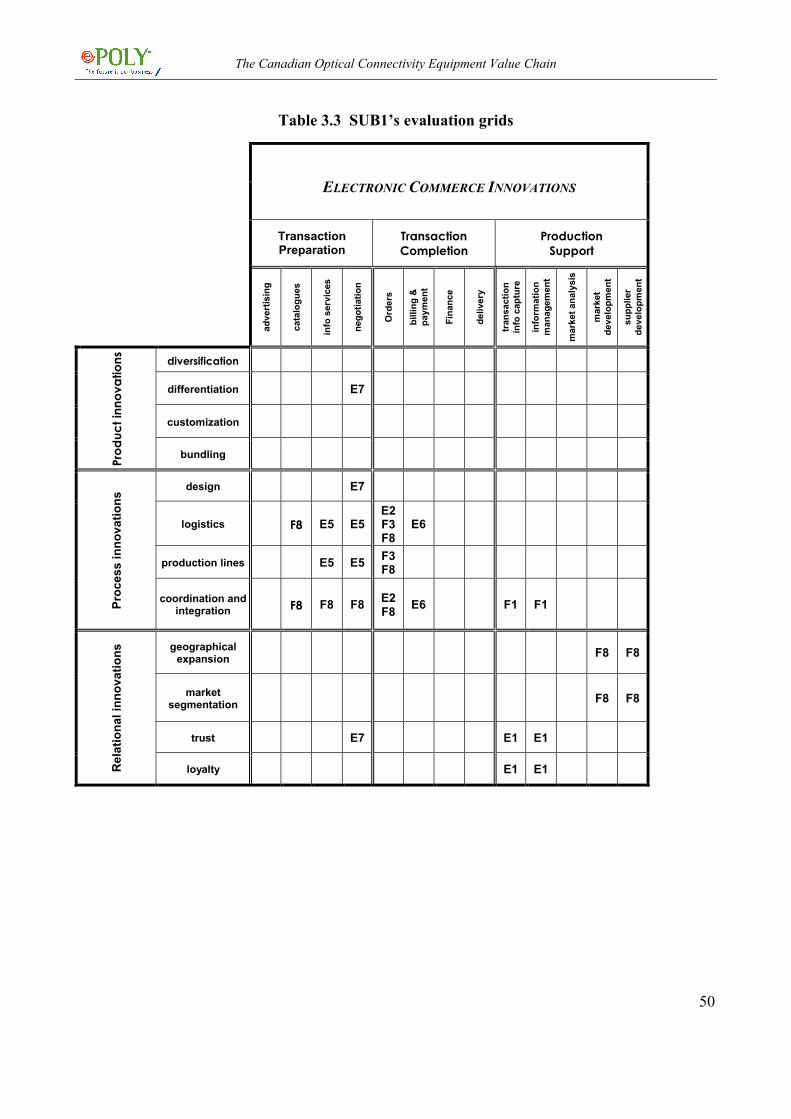
The Canadian Optical Connectivity Equipment Value Chain
50
Table 3.3 SUB1’s evaluation grids
ELECTRONIC COMMERCE INNOVATIONS
Transaction Preparation
Transaction Completion
Production Support
ad
vert
isin
g
cata
logu
es
info
ser
vice
s
nego
tiatio
n
Ord
ers
billi
ng &
pa
ymen
t
Fina
nce
deliv
ery
tran
sact
ion
in
fo c
aptu
re
info
rmat
ion
man
agem
ent
mar
ket a
naly
sis
mar
ket
deve
lopm
ent
supp
lier
deve
lopm
ent
diversification
differentiation E7
customization
Prod
uct i
nnov
atio
ns
bundling
design E7
logistics F8 E5 E5E2 F3 F8
E6
production lines E5 E5 F3 F8
Proc
ess
inno
vatio
ns
coordination and integration F8 F8 F8 E2
F8 E6 F1 F1
geographical expansion F8 F8
market segmentation F8 F8
trust E7 E1 E1
Rel
atio
nal i
nnov
atio
ns
loyalty E1 E1

The Canadian Optical Connectivity Equipment Value Chain
51
Table 3.4 SUB2’s evaluation grid
ELECTRONIC COMMERCE INNOVATIONS
Transaction Preparation
Transaction Completion
Production Support
adve
rtis
ing
Cat
alog
ues
info
ser
vice
s
nego
tiatio
n
orde
rs
billi
ng &
pa
ymen
t
Fina
nce
deliv
ery
tran
sact
ion
in
fo c
aptu
re
info
rmat
ion
man
agem
ent
mar
ket a
naly
sis
mar
ket
deve
lopm
ent
Supp
lier
deve
lopm
ent
diversification
differentiation
customization
Prod
uct i
nnov
atio
ns
bundling
design
logistics F8 E5 E5E2 E3 F8
E6 E4
production lines E5 E5 E3 F8
Proc
ess
inno
vatio
ns
coordination and integration F8 F8 F8
E2 F8
F9 E6 E4 E4 F1 F1
geographical expansion F8 F8
market segmentation F8 F8
trust E1 E1
Rel
atio
nal i
nnov
atio
ns
loyalty E1 E1

The Canadian Optical Connectivity Equipment Value Chain
52
4. ELECTRONIC COMMERCE IMPACT ANALYSIS AND FUTURE
DEVELOPMENTS
This concluding section presents a synthesis of the current and future impacts of process, product and relational innovations. Particular attention is paid to how the transaction structure dynamic has been affected by these innovations and how it will evolve in the future. The results have prompted us to propose several policy implications to assist companies dealing with electronic commerce initiatives.
4.1 E-commerce supports process innovations
The findings of all four case studies clearly reveal that electronic commerce particularly influences process innovations in the optical connectivity value chain. Indeed, all core group members of the value chain have indicated that the main objective in adopting e-commerce is to optimize the supply chain and support more efficient business processes. The current and future impacts of business-to-business e-commerce on process innovation can be categorized by two main trends: use of visibility tools to improve transaction preparation, and implementation of demand-driven supply chain strategies to complete transactions. These impacts are described in the following paragraphs.
E-commerce brings visibility in the value chain
The case studies reveal the importance and the related benefits of information visibility throughout the chain. Visibility in the supply chain is achieved by making accurate information, such as forecasts, schedules and production capacity, accessible to all members of the chain.
Current electronic commerce initiatives have improved visibility, mostly between the assembler and sub-assembler layers. This first step has benefited both layers. The web-based forecast tool enables sub-assemblers to better plan production and anticipate fluctuations in demand. On the assembler side, schedule and capacity visibility allow, among other things, better anticipation and tighter management of shortages.
However, the real benefits will come with end-to-end visibility in the supply chain. With e2open, e-commerce initiatives will be extended to second and third tier levels of suppliers, thus granting sub-assemblers the same benefits currently derived by assemblers. On the upper end of the chain, visibility tools will permit the system integrators and network operators to exchange accurate

The Canadian Optical Connectivity Equipment Value Chain
53
information concerning demand, thus improving forecasting for the whole supply chain. Indeed, network operators and systems integrators are looking to link their functional systems in order to exchange critical information such as delivery dates and tracking, inventory levels and anticipated demand.
E-commerce enables a demand-driven supply chain strategy
Customization and diminishing lead times are forcing the implementation of demand-pull strategies for all levels of the optical connectivity equipment supply chain. In order to quickly produce only what has been sold, system integrators are keeping inventories at a minimum and they now rely on efficient procurement cycles to fulfill their needs. In other words, the business partners of this value chain are replacing inventories with on time information.
As such, visibility between the business partners is not sufficient to support a demand-driven strategy. Advanced collaboration tools are needed to fully integrate planning and scheduling activities. As of now, Nortel Optical and its assemblers have been the greatest beneficiaries of electronically supported demand-driven strategies. They have been able to significantly reduce total cycle times and inventory levels.
However, in order to really benefit from the e-collaboration tools, sub-assemblers may have to rethink the way their internal system is designed. For example, shorter response times require more flexible planning systems such as Advanced Planning and Scheduling (APS) tools that can run different planning scenarios on a daily basis. Moreover, large industry initiatives like e2open will help sub-assemblers create tighter links with their own suppliers and thus achieve inventory and cycle time gains.
In the near future, assemblers and sub-assemblers will link their APS systems together to make it
easier to dispatch work to the production lines of all business partners. Such collaboration requires
real-time information sharing on matters such as manufacturing capacity, inventory levels and
distribution constraints. Furthermore, the use of methodologies and tools such as Collaborative
Planning, Forecasting and Replenishment (CPFR) should extend demand-driven efficiencies
throughout the whole chain.

The Canadian Optical Connectivity Equipment Value Chain
54
4.2 PRODUCT INNOVATIONS WITH E-CONFIGURATION
The web-based configuration of optical connectivity equipment at the transaction preparation stage
would provide benefits for both the network operator and the system integrator. This kind of “self-
service” electronic commerce tool would significantly reduce human intervention in the ordering
process and thus improve the response time. However, due to the complexity and high level of
customization of optical equipment, these anticipated effects on product innovations have not yet
been achieved. Cisco is well known for having successfully implemented an e-configuration tool on
its web site, but its products (routers and switches) are less complex and less customized. Some
pilot projects are currently being undertaken at Nortel Optical to gradually move toward a
comprehensive e-configurator. For the moment, network operators can order simple products (such
as MRO products) as well as make-to-stock equipment (products with few functionalities) on
Nortel’s web site (http://www.nortelnetworks.com/ecommerce).
4.3 RELATIONAL INNOVATIONS
One main finding of the case studies is that electronic commerce in the optical connectivity
equipment value chain strengthens existing relationships between business partners. The learning
process required to develop efficient electronic collaboration between the supply chain partners
constitutes an important switching cost for the assembler. Indeed, sub-assemblers adopting
electronic commerce need to invest time and money to adapt their internal processes and systems
and develop the human competencies needed to handle these new challenges. Other things being
equal, once the sub-assembler has adapted itself, it is very unlikely that the assembler will want to
put an end to their relationship. This explains why OEMs like Nortel tend to develop close, long-
term partnerships with a narrower supplier base. This trend is reinforced by the fact that faster cycle
times often compel suppliers to invest in infrastructure in order to bring their manufacturing plants
closer to the assembler’s facility.
However, when products (and components) are mature or non-complex, intermediaries have always
become involved to track down parts that are in short supply. The case studies point out a trend
towards the emergence of a new breed of electronically based intermediaries. These web
intermediaries are either industry-led initiatives like e2open or privately owned neutral
marketplaces such as Fastpart.com. They usually maintain large, industry-specific catalogues where

The Canadian Optical Connectivity Equipment Value Chain
55
assemblers or sub-assemblers can find scarce parts and benchmark their established suppliers
against a pool of other companies from all over the world. These intermediaries induce relational
innovations at the level of transaction preparation and completion. As the intermediaries grow in
importance, they will contribute to modifying the transaction structure in this particular industry
segment.
4.4 POLICY IMPLICATIONS
Two important sets of implications come to mind from a policy perspective:
First, results from our analysis clearly show that business-to-business electronic commerce is
merely a mean to support supply chain strategies. The ultimate objective of the B2B initiatives is to
optimize supply chain configurations. As a result, policy makers should focus on helping sub-
contractors acquire new technological and employee competencies required to work in an
integrated supply chain environment.
Second, in the telecommunication equipment industry, electronic commerce has and will continue
to be driven by sectorial initiatives (e.g. e2open) and proprietary supply chain extranets, such as
Nortel Optical’s. These electronic commerce platforms are more likely to rapidly reach critical
masses of stakeholders and reshape industries by defining new business practices. Such initiatives
should be closely monitored by policy makers to ensure leading-edge knowledge on the major
sectorial trends in electronic commerce and to assist in the identification of international initiatives
in the development and diffusion of product and process norms and standards.
The Canadian Optical Connectivity Equipment Value Chain
56
REFERENCES
ANONYMOUS (1998). National Electronic Manufacturing Technology Roadmaps, NEMI,
Herndon, VA.
ANONYMOUS (1999). Nortel expands fibre optic product manufacturing to meet explosive
demand. The Electronics Communicator, 30, 29, 1-3.
ANONYMOUS (1999). Nortel unveils new global manufacturing strategy; to close all but two mfg
facilities. The Electronics Communicator, 30, 13, 1-4.
ANONYMOUS (2000). Fading light. The Economist, 357, 8194, 58-60.
Tessier, Y. (2000). L’ABC des Réseaux de Télécommunications, Institut International des
Télécommunications, Montréal, 199 pages.
ANONYMOUS (2000). Scaling Optical Data Networks with Cisco Wavelength Routing, Cisco
Systems, White Paper, www.cisco.com.
BOYD, J. (2000). Supply chain gains – $500 million investment in Net automation delivers market
share, revenue gains in critical optical market. Internetweek, September 25, 137-138.
CAHN, D. (2000). Visibility Needed Across Supply Chain Shell Game of High-Tech, AMR
Research, Cambridge, MA.
CARBONE, J. (1999). High-tech buyers see tidal wave of opportunity. Purchasing, 126, 10, 108-
109.
CARBONE, J. (2000). Web: Key to electronics contract manufacturing. Purchasing, 128, 1, 73-76.
CORNING (2000). Fiber-optic Technology, The International Engineering Consortium, …
CHEN, C.Y., DIBA, A. (2000). How Nortel beat Lucent at its own game. Fortune, 141, 5, 438-440.
CRAINCROSS, F. (2000). Survey on e-management: The shape of the new e-company. The
Economist, 357, 8196. S37-S38.

The Canadian Optical Connectivity Equipment Value Chain
57
ELLIOTT, H. (2000). Another B2B consortium. Electronic News, 46, 24, 14-15.
ENGARDIO, P. (2000). The barons of outsourcing. Business Week, August 28, 177.
KARPINSKI, R. (2000). e2open makes grand entrance. B to B, 85, 14, 3-5.
LEMBRE, P. (2000). The all-optical IP network. Telephony, 238, 19, 60-64.
LEVINE, B. (2000). Is EMS the final answer? Electronic News, 46, 15, 2.
MCCORMICK, A. (2000) Moving at Light Speed: The Transition to Optical Networks,
AberdeenGroup, Boston, MA, 156 pages.
RHK (2000) RHK unveils new optical transport forecast: North American DWDM market
projected to grow over 50% per annum through 2004. Press Release, www.rhk.com, October 30,
2000.
ROTH, J. (2000). Building the High Performance Internet, Conference for financial analysis,
Boston, MA.
SCARBOROUGH, J. (2000). Information is money: Moving data is as important today as moving
product. Transportation & Distribution, 41, 5, S25-28.
TAYLOR, C. (2000). The need for speed. Far Eastern Economic Review, 163, 23, 44-46.
TERESKO, J. (2000). E-collaboration. Industry Week, 249, 11, 31-35.

The Canadian Optical Connectivity Equipment Value Chain
58
PEOPLE INTERVIEWED
Dean Gauthier, Business process manager, Nortel Networks, Optical Division
Nicolas Tremblay, Project manager, Nortel Networks, Optical Division
Daniel Rousse, Project manager, Nortel Networks, Optical Division
Michel Lacroix, Seller, Nortel Networks, Optical Division
Annie Bourque, Buyer, Nortel Networks, Optical Division
Sébastien Langlois, Marketing systems engineer, Nortel Networks, Optical Division
Information technology director, SUB1
Buyer, SUB1
Customer service representative, SUB2
James Ward, Customer service representative, Celestica
Steve Radewyc, Director, Supply chain management, Celestica
Riccardo Castaldo, Director, Supply chain management, Celestica
Alix Dugazon, Network Engineer, CESCOM
Kamal Medjdoub, Network engineer, Teleglobe
Marc Courtemanche, Lab specialist, International Institute of Telecommunications
Philippe Giroux, Business development, International Institute of Telecommunications

The Canadian Optical Connectivity Equipment Value Chain
59
APPENDIX A: NORTEL MILESTONES FROM 1997–2000
Source: www.nortelnetworks.com