Electricity Sector in India - Wikipedia, The Free Encyclopedia
20
*Electricity Production in India till 2012 Sources of electricity in India by Installed Capacity as of 2013 Ramagundam Thermal Power Station, Telangana Sabarmati Thermal Power Station, Gujarat Electricity sector in India From Wikipedia, the free encyclopedia The electricity sector in India had an installed capacity of 261.006 GW as of end February 2015 and generated around 961.777 BU for the period April 2014 - February 2015. [1] India became the world's third largest producer of electricity in the year 2013 with 4.8% global share in electricity generation surpassing Japan and Russia. [2] Renewable Power plants constituted 27.80% of total installed capacity and Non-Renewable Power Plants constituted the remaining 72.20%. [1] India generated around 967 TWh (967,150.32 GWh) of electricity [3][4] (excluding electricity generated from renewable and captive power plants) during the 2013–14 fiscal. The total annual generation of electricity from all types of sources was 1102.9 TeraWatt-hours (TWh) in 2013. [2] As of March 2013, the per capita total electricity consumption in India was 917.2 kWh. [5] The per capita average annual domestic electricity consumption in India in 2009 was 96 kWh in rural areas and 288 kWh in urban areas for those with access to electricity in contrast to the worldwide per capita annual average of 2,600 kWh and 6,200 kWh in the European Union. [6] Electric energy consumption in agriculture is highest (18%) in India. The per capita electricity consumption is lower compared to many countries despite cheaper electricity tariff in India. [7] Contents 1 History 2 Demand 2.1 Rural Electrification 3 Electricity consumption 4 Electricity generation 5 Conventional sources 5.1 Thermal power 5.2 Hydro power 5.3 Nuclear power 6 Non-conventional sources 6.1 Solar power 6.2 Wind power 6.3 Biomass power 6.4 Geothermal energy 6.5 Tidal wave energy 7 Electricity transmission and distribution 8 Problems with India's power sector 9 Resource potential in electricity sector 10 Electricity trading with neighbour countries 11 Electricity as substitute to imported LPG and kerosene 12 Electricity driven vehicles 13 Human resource development 14 Regulation and administration 14.1 Trading 14.2 Government-owned power companies 14.3 Funding of power infrastructure 14.4 Budgetary support 15 See also 16 References 17 External links History The first demonstration of electric light in Calcutta was conducted on 24 July 1879 by P W Fleury & Co. On 7 January 1897, Kilburn & Co secured the Calcutta electric lighting license as agents of the Indian Electric Co, which was registered in London on 15 January 1897. A month later, the company was renamed the Calcutta Electric Supply Corporation. The control of the company was transferred from London to Calcutta only in 1970. Enthused by the success of electricity in Calcutta, power was thereafter introduced in Bombay. [8] Mumbai saw electric lighting demonstration for the first time in 1882 at Crawford Market, and Bombay Electric Supply & Tramways Company (BEST) set up a generating station in 1905 to provide electricity for the
description
Electricity sector in india
Transcript of Electricity Sector in India - Wikipedia, The Free Encyclopedia

*Electricity Production in India till 2012
Sources of electricity in India by Installed Capacity
as of 2013
Ramagundam Thermal Power
Station, Telangana
Sabarmati Thermal Power Station,
Gujarat
Electricity sector in IndiaFrom Wikipedia, the free encyclopedia
The electricity sector in India had an installed capacity of 261.006 GW as of end February 2015 and
generated around 961.777 BU for the period April 2014 - February 2015.[1] India became the world's
third largest producer of electricity in the year 2013 with 4.8% global share in electricity generation
surpassing Japan and Russia.[2] Renewable Power plants constituted 27.80% of total installed capacity
and Non-Renewable Power Plants constituted the remaining 72.20%.[1] India generated around 967
TWh (967,150.32 GWh) of electricity[3][4] (excluding electricity generated from renewable and
captive power plants) during the 2013–14 fiscal. The total annual generation of electricity from all
types of sources was 1102.9 TeraWatt-hours (TWh) in 2013.[2]
As of March 2013, the per capita total electricity consumption in India was 917.2 kWh.[5] The per
capita average annual domestic electricity consumption in India in 2009 was 96 kWh in rural areas
and 288 kWh in urban areas for those with access to electricity in contrast to the worldwide per capita
annual average of 2,600 kWh and 6,200 kWh in the European Union.[6] Electric energy consumption
in agriculture is highest (18%) in India. The per capita electricity consumption is lower compared to
many countries despite cheaper electricity tariff in India.[7]
Contents
1 History
2 Demand
2.1 Rural Electrification
3 Electricity consumption
4 Electricity generation
5 Conventional sources
5.1 Thermal power
5.2 Hydro power
5.3 Nuclear power
6 Non-conventional sources
6.1 Solar power
6.2 Wind power
6.3 Biomass power
6.4 Geothermal energy
6.5 Tidal wave energy
7 Electricity transmission and distribution
8 Problems with India's power sector
9 Resource potential in electricity sector
10 Electricity trading with neighbour countries
11 Electricity as substitute to imported LPG and kerosene
12 Electricity driven vehicles
13 Human resource development
14 Regulation and administration
14.1 Trading
14.2 Government-owned power companies
14.3 Funding of power infrastructure
14.4 Budgetary support
15 See also
16 References
17 External links
History
The first demonstration of electric light in Calcutta was conducted on 24 July 1879 by P W Fleury & Co. On 7 January 1897, Kilburn & Co secured the
Calcutta electric lighting license as agents of the Indian Electric Co, which was registered in London on 15 January 1897. A month later, the company
was renamed the Calcutta Electric Supply Corporation. The control of the company was transferred from London to Calcutta only in 1970. Enthused by
the success of electricity in Calcutta, power was thereafter introduced in Bombay.[8] Mumbai saw electric lighting demonstration for the first time in 1882
at Crawford Market, and Bombay Electric Supply & Tramways Company (BEST) set up a generating station in 1905 to provide electricity for the
PREET ROSALIN
Highlight
PREET ROSALIN
Highlight
PREET ROSALIN
Highlight
PREET ROSALIN
Highlight
PREET ROSALIN
Highlight
PREET ROSALIN
Highlight
PREET ROSALIN
Highlight
PREET ROSALIN
Highlight
PREET ROSALIN
Highlight
PREET ROSALIN
Highlight
PREET ROSALIN
Highlight
PREET ROSALIN
Highlight

Satellite pictures of India show thick
haze and black carbon smoke above
India and other Asian countries. This
problem is particularly severe along
the Ganges Basin in northern India.
Major sources of particulate matter
and aerosols are believed to be smoke
from biomass burning in rural parts of
India, and air pollution from large
cities in northern India.
tramway.[9] The first hydroelectric installation in India was installed near a tea estate at Sidrapong for the Darjeeling Municipality in 1897.[10] The first
electric train ran between Bombay's Victoria Terminus and Kurla along the Harbour Line, in 1925.[11] In 1931, electrification of the metre gauge track
between Madras Beach and Tambaram was started.[12]
Growth of Installed Capacity in India[5]
Installed
Capacity
as on
Thermal (MW)Nuclear
(MW)
Renewable (MW)Total
(MW)
% Growth
(on yearly
basis)Coal Gas Diesel
Sub-Total
ThermalHydel
Other
Renewable
Sub-Total
Renewable
31-Dec-1947 756 - 98 854 - 508 - 508 1,362 -
31-Dec-1950 1,004 - 149 1,153 - 560 - 560 1,713 8.59%
31-Mar-1956 1,597 - 228 1,825 - 1,061 - 1,061 2,886 13.04%
31-Mar-1961 2,436 - 300 2,736 - 1,917 - 1,917 4,653 12.25%
31-Mar-1966 4,417 137 352 4,903 - 4,124 - 4,124 9,027 18.80%
31-Mar-1974 8,652 165 241 9,058 640 6,966 - 6,966 16,664 10.58%
31-Mar-1979 14,875 168 164 15,207 640 10,833 - 10,833 26,680 12.02%
31-Mar-1985 26,311 542 177 27,030 1,095 14,460 - 14,460 42,585 9.94%
31-Mar-1990 41,236 2,343 165 43,764 1,565 18,307 - 18,307 63,636 9.89%
31-Mar-1997 54,154 6,562 294 61,010 2,225 21,658 902 22,560 85,795 4.94%
31-Mar-2002 62,131 11,163 1,135 74,429 2,720 26,269 1,628 27,897 105,046 4.49%
31-Mar-2007 71,121 13,692 1,202 86,015 3,900 34,654 7,760 42,414 132,329 5.19%
31-Mar-2012 112,022 18,381 1,200 131,603 4,780 38,990 24,503 63,493 199,877 9.00%
30-Nov-2014[13] 153,571 22,971 1,200 177,742 4,780 40,799 @31,692 72,491 255,013 10.34%
@The break up of other RES is small hydro (3,804 MW), wind power (21,136 MW), biomass power/Cogeneration (4,014 MW), waste-to-power (107 MW)
and solar power (2,632 MW).[13]
The planned additional thermal power generation capacity excluding renewable power during the remaining period of the 12th plan period (up to March
2017) is 90,925 MW.[14]
Demand
Demand drivers
"Expanding access to energy means including 2.4 billion people: 1.4 billion that still have no access to
electricity (87% of whom live in the rural areas) and 1 billion that only has access to unreliable
electricity networks. We need smart and practical approaches because energy, as a driver of
development, plays a central role in both fighting poverty and addressing climate change. The
implications are enormous: families forego entrepreneurial endeavors, children cannot study after dark,
health clinics do not function properly, and women are burdened with time consuming chores such as
pounding grain or hauling water, leaving them with less time to engage in income generating activities.
Further, it is estimated that kitchen smoke leads to around 1.5 million premature deaths every year,
more than the number of deaths from malaria each year. After gaining access to energy, households
generate more income, are more productive and are less hungry, further multiplying the Millennium
Development Goal's progress."
— Rebeca Grynspan, UNDP Associate Administrator and Under Secretary General, Bloomberg New
Energy Summit, 7 April 2011[15]
Of the 1.4 billion people of the world who have no access to electricity in the world, India accounts for over 300
million. The International Energy Agency estimates India will add between 600 GW to 1,200 GW of additional
new power generation capacity before 2050.[16] This added new capacity is equivalent to the 740 GW of total
power generation capacity of European Union (EU-27) in 2005. The technologies and fuel sources India adopts, as
it adds this electricity generation capacity, may make significant impact to global resource usage and
environmental issues.[17]
Some 800 million Indians use traditional fuels – fuelwood, agricultural waste and biomass cakes – for cooking and general heating needs. These
traditional fuels are burnt in cook stoves, known as chulah or chulha in some parts of India.[18][19] Traditional fuel is inefficient source of energy, its
burning releases high levels of smoke, PM10 particulate matter, NOX, SOX, PAHs, polyaromatics, formaldehyde, carbon monoxide and other air
pollutants.[20][21][22] Some reports, including one by the World Health Organisation, claim 300,000 to 400,000 people in India die of indoor air pollution
and carbon monoxide poisoning every year because of biomass burning and use of chullahs.[23] Traditional fuel burning in conventional cook stoves
releases unnecessarily large amounts of pollutants, between 5 to 15 times higher than industrial combustion of coal, thereby affecting outdoor air quality,
haze and smog, chronic health problems, damage to forests, ecosystems and global climate. Burning of biomass and firewood will not stop, these reports
claim, unless electricity or clean burning fuel and combustion technologies become reliably available and widely adopted in rural and urban India. The
growth of electricity sector in India may help find a sustainable alternative to traditional fuel burning.
PREET ROSALIN
Highlight
PREET ROSALIN
Highlight
PREET ROSALIN
Highlight
In addition to air pollution problems, a 2007 study finds that discharge of untreated sewage is single most important cause for pollution of surface and
ground water in India. There is a large gap between generation and treatment of domestic wastewater in India. The problem is not only that India lacks
sufficient treatment capacity but also that the sewage treatment plants that exist do not operate and are not maintained. Majority of the government-owned
sewage treatment plants remain closed most of the time in part because of the lack of reliable electricity supply to operate the plants. The wastewater
generated in these areas normally percolates in the soil or evaporates. The uncollected wastes accumulate in the urban areas cause unhygienic conditions,
release heavy metals and pollutants that leaches to surface and groundwater.[24][25] Almost all rivers, lakes and water bodies are severely polluted in
India. Water pollution also adversely impacts river, wetland and ocean life. Reliable generation and supply of electricity is essential for addressing India's
water pollution and associated environmental issues.
Other drivers for India's electricity sector are its rapidly growing economy, rising exports, improving infrastructure and increasing household incomes.
Demand trends
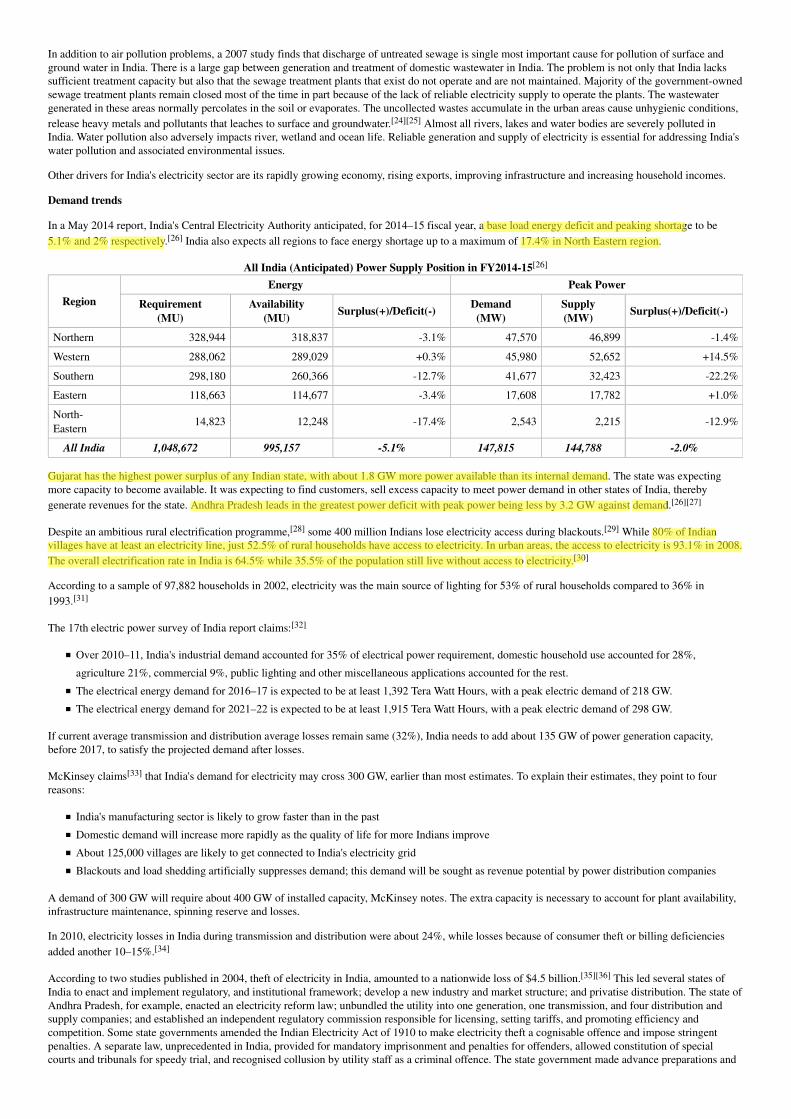
In a May 2014 report, India's Central Electricity Authority anticipated, for 2014–15 fiscal year, a base load energy deficit and peaking shortage to be
5.1% and 2% respectively.[26] India also expects all regions to face energy shortage up to a maximum of 17.4% in North Eastern region.
All India (Anticipated) Power Supply Position in FY2014-15[26]
Region
Energy Peak Power
Requirement
(MU)
Availability
(MU)Surplus(+)/Deficit(-)
Demand
(MW)
Supply
(MW)Surplus(+)/Deficit(-)
Northern 328,944 318,837 -3.1% 47,570 46,899 -1.4%
Western 288,062 289,029 +0.3% 45,980 52,652 +14.5%
Southern 298,180 260,366 -12.7% 41,677 32,423 -22.2%
Eastern 118,663 114,677 -3.4% 17,608 17,782 +1.0%
North-
Eastern14,823 12,248 -17.4% 2,543 2,215 -12.9%
All India 1,048,672 995,157 -5.1% 147,815 144,788 -2.0%
Gujarat has the highest power surplus of any Indian state, with about 1.8 GW more power available than its internal demand. The state was expecting
more capacity to become available. It was expecting to find customers, sell excess capacity to meet power demand in other states of India, thereby
generate revenues for the state. Andhra Pradesh leads in the greatest power deficit with peak power being less by 3.2 GW against demand.[26][27]
Despite an ambitious rural electrification programme,[28] some 400 million Indians lose electricity access during blackouts.[29] While 80% of Indian
villages have at least an electricity line, just 52.5% of rural households have access to electricity. In urban areas, the access to electricity is 93.1% in 2008.
The overall electrification rate in India is 64.5% while 35.5% of the population still live without access to electricity.[30]
According to a sample of 97,882 households in 2002, electricity was the main source of lighting for 53% of rural households compared to 36% in
1993.[31]
The 17th electric power survey of India report claims:[32]
Over 2010–11, India's industrial demand accounted for 35% of electrical power requirement, domestic household use accounted for 28%,
agriculture 21%, commercial 9%, public lighting and other miscellaneous applications accounted for the rest.
The electrical energy demand for 2016–17 is expected to be at least 1,392 Tera Watt Hours, with a peak electric demand of 218 GW.
The electrical energy demand for 2021–22 is expected to be at least 1,915 Tera Watt Hours, with a peak electric demand of 298 GW.
If current average transmission and distribution average losses remain same (32%), India needs to add about 135 GW of power generation capacity,
before 2017, to satisfy the projected demand after losses.
McKinsey claims[33] that India's demand for electricity may cross 300 GW, earlier than most estimates. To explain their estimates, they point to four
reasons:
India's manufacturing sector is likely to grow faster than in the past
Domestic demand will increase more rapidly as the quality of life for more Indians improve
About 125,000 villages are likely to get connected to India's electricity grid
Blackouts and load shedding artificially suppresses demand; this demand will be sought as revenue potential by power distribution companies
A demand of 300 GW will require about 400 GW of installed capacity, McKinsey notes. The extra capacity is necessary to account for plant availability,
infrastructure maintenance, spinning reserve and losses.
In 2010, electricity losses in India during transmission and distribution were about 24%, while losses because of consumer theft or billing deficiencies
added another 10–15%.[34]
According to two studies published in 2004, theft of electricity in India, amounted to a nationwide loss of $4.5 billion.[35][36] This led several states of
India to enact and implement regulatory, and institutional framework; develop a new industry and market structure; and privatise distribution. The state of
Andhra Pradesh, for example, enacted an electricity reform law; unbundled the utility into one generation, one transmission, and four distribution and
supply companies; and established an independent regulatory commission responsible for licensing, setting tariffs, and promoting efficiency and
competition. Some state governments amended the Indian Electricity Act of 1910 to make electricity theft a cognisable offence and impose stringent
penalties. A separate law, unprecedented in India, provided for mandatory imprisonment and penalties for offenders, allowed constitution of special
courts and tribunals for speedy trial, and recognised collusion by utility staff as a criminal offence. The state government made advance preparations and
PREET ROSALIN
Highlight
PREET ROSALIN
Highlight
PREET ROSALIN
Highlight
PREET ROSALIN
Highlight
PREET ROSALIN
Highlight
PREET ROSALIN
Highlight
constituted special courts and appellate tribunals as soon as the new law came into force. High quality metering and enhanced audit information flow was
implemented. Such campaigns have made a big difference in the Indian utilities' bottom line. Monthly billing has increased substantially, and the
collection rate reached more than 98%. Transmission and distribution losses were reduced by 8%.
Power cuts are common throughout India and the consequent failure to satisfy the demand for electricity has adversely effected India's economic
growth.[37]
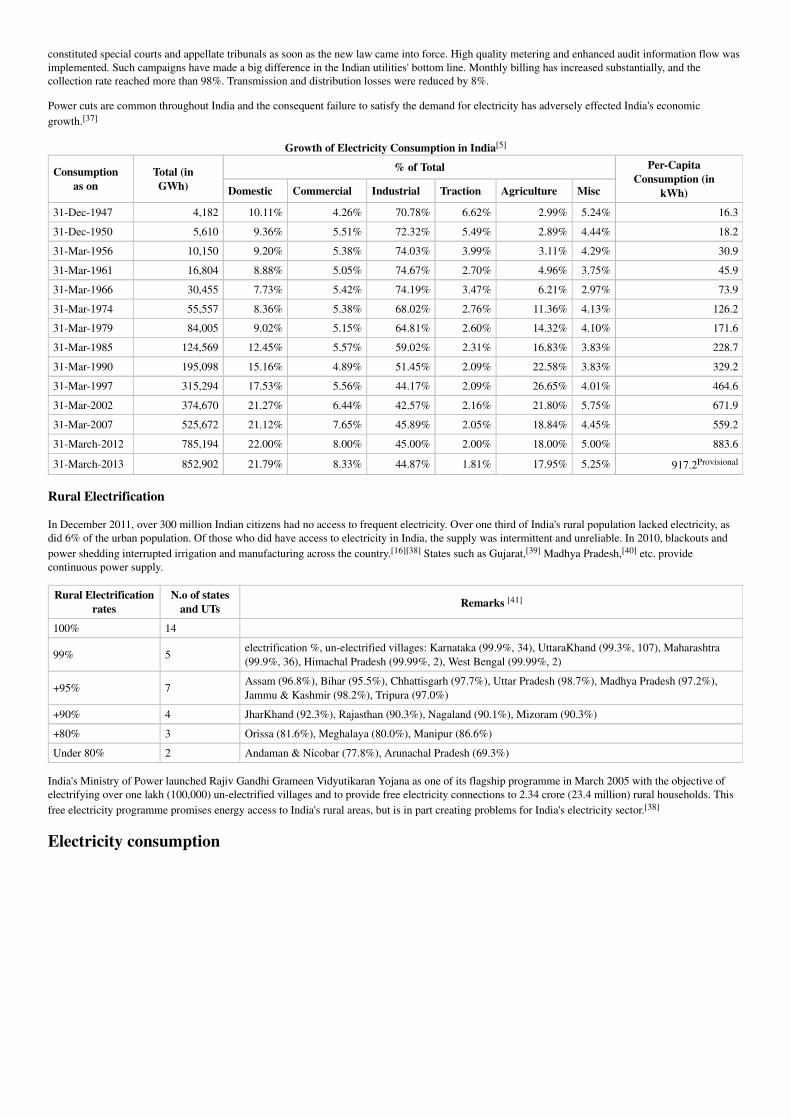
Growth of Electricity Consumption in India[5]
Consumption
as on
Total (in
GWh)
% of Total Per-Capita
Consumption (in
kWh)Domestic Commercial Industrial Traction Agriculture Misc
31-Dec-1947 4,182 10.11% 4.26% 70.78% 6.62% 2.99% 5.24% 16.3
31-Dec-1950 5,610 9.36% 5.51% 72.32% 5.49% 2.89% 4.44% 18.2
31-Mar-1956 10,150 9.20% 5.38% 74.03% 3.99% 3.11% 4.29% 30.9
31-Mar-1961 16,804 8.88% 5.05% 74.67% 2.70% 4.96% 3.75% 45.9
31-Mar-1966 30,455 7.73% 5.42% 74.19% 3.47% 6.21% 2.97% 73.9
31-Mar-1974 55,557 8.36% 5.38% 68.02% 2.76% 11.36% 4.13% 126.2
31-Mar-1979 84,005 9.02% 5.15% 64.81% 2.60% 14.32% 4.10% 171.6
31-Mar-1985 124,569 12.45% 5.57% 59.02% 2.31% 16.83% 3.83% 228.7
31-Mar-1990 195,098 15.16% 4.89% 51.45% 2.09% 22.58% 3.83% 329.2
31-Mar-1997 315,294 17.53% 5.56% 44.17% 2.09% 26.65% 4.01% 464.6
31-Mar-2002 374,670 21.27% 6.44% 42.57% 2.16% 21.80% 5.75% 671.9
31-Mar-2007 525,672 21.12% 7.65% 45.89% 2.05% 18.84% 4.45% 559.2
31-March-2012 785,194 22.00% 8.00% 45.00% 2.00% 18.00% 5.00% 883.6
31-March-2013 852,902 21.79% 8.33% 44.87% 1.81% 17.95% 5.25% 917.2Provisional
Rural Electrification
In December 2011, over 300 million Indian citizens had no access to frequent electricity. Over one third of India's rural population lacked electricity, as
did 6% of the urban population. Of those who did have access to electricity in India, the supply was intermittent and unreliable. In 2010, blackouts and
power shedding interrupted irrigation and manufacturing across the country.[16][38] States such as Gujarat,[39] Madhya Pradesh,[40] etc. provide
continuous power supply.
Rural Electrification
rates
N.o of states
and UTsRemarks [41]
100% 14
99% 5electrification %, un-electrified villages: Karnataka (99.9%, 34), UttaraKhand (99.3%, 107), Maharashtra
(99.9%, 36), Himachal Pradesh (99.99%, 2), West Bengal (99.99%, 2)
+95% 7Assam (96.8%), Bihar (95.5%), Chhattisgarh (97.7%), Uttar Pradesh (98.7%), Madhya Pradesh (97.2%),
Jammu & Kashmir (98.2%), Tripura (97.0%)
+90% 4 JharKhand (92.3%), Rajasthan (90.3%), Nagaland (90.1%), Mizoram (90.3%)
+80% 3 Orissa (81.6%), Meghalaya (80.0%), Manipur (86.6%)
Under 80% 2 Andaman & Nicobar (77.8%), Arunachal Pradesh (69.3%)
India's Ministry of Power launched Rajiv Gandhi Grameen Vidyutikaran Yojana as one of its flagship programme in March 2005 with the objective of
electrifying over one lakh (100,000) un-electrified villages and to provide free electricity connections to 2.34 crore (23.4 million) rural households. This
free electricity programme promises energy access to India's rural areas, but is in part creating problems for India's electricity sector.[38]
Electricity consumption

Per-Capita Electricity consumption (kWh)[42] (in 2011–12)
State/Union Territory RegionPer-Capita Consumption
(kWh)
Dadra & Nagar Haveli Western 13,766.6
Daman & Diu Western 7,785.2
Goa Western 2,025.5
Gujarat Western 1,663.2
Chhattisgarh Western 1,319.6
Maharashtra Western 1,204.4
Madhya Pradesh Western 671.5
Western Region 1,201.2
Puducherry Southern 2,124.7
Tamil Nadu Southern 1,276.6
Andhra Pradesh Southern 1,156.5
Karnataka Southern 1,081.4
Kerala Southern 593.8
Lakshadweep Southern 1,098.0
Southern Region 938.88
Punjab Northern 1,799.0
Haryana Northern 1,628.3
Delhi Northern 1,586.7
Himachal Pradesh Northern 1,289.4
Uttarakhand Northern 1,232.2
Chandigarh Northern 1,217.4
Jammu & Kashmir Northern 1,015.2
Rajasthan Northern 927.4
Uttar Pradesh Northern 449.9
Northern Region 833.2
Odisha Eastern 1,145.8
Sikkim Eastern 886.4
Jharkhand Eastern 790.2
West Bengal Eastern 563.8
Andaman & Nicobar Islands Eastern 501.4
Bihar Eastern 133.6
Eastern Region 521.2
Arunachal Pradesh North Eastern 683.1
Meghalaya North Eastern 657.6
Mizoram North Eastern 506.7
Nagaland North Eastern 257.2
Tripura North Eastern 253.8
Assam North Eastern 249.8
Manipur North Eastern 235.9
North Eastern Region 257.98
National' 883.6
Electricity generation
Power development in India was first started in 1897 in Darjeeling, followed by commissioning of a hydropower station at Sivasamudram in Karnataka
during 1902. Thermal power stations which generates electricity more than 1,000 MW are referred as Super Thermal Power Stations.
India's electricity generation capacity additions from 1950 to 1985 were very low when compared to developed nations. Since 1990, India has been one of
the fastest growing markets for new electricity generation capacity. India's electricity generation capacity has increased from 179 TW-h in 1985 to 1053
TW-h in 2012.[2]
India's Power Finance Corporation Limited projects that current and approved electricity capacity addition projects in India are expected to add about 100
GW of installed capacity between 2012 and 2017. This growth makes India one of the fastest growing markets for electricity infrastructure equipment.[44][45] India's installed capacity growth rates are still less than those achieved by China, and short of capacity needed to ensure universal availability of

Tehri Hydroelectric Power station's lake in Uttarakhand.
Tehri is world's 7th tallest dam.[43] With a capacity of 2.4
GW, it is India's largest hydroelectric power generation
installation.
electricity throughout India by 2017.
The table below presents the electricity generation capacity, as well as availability to India's end
user and their demand. The difference between installed capacity and availability is the
transmission, distribution and consumer losses. The gap between availability and demand is the
shortage India is suffering. This shortage in supply ignores the effects of waiting list of users in
rural, urban and industrial customers; it also ignores the demand gap from India's unreliable
electricity supply.
Electricity sector capacity and availability in India (excludes effect of
blackouts/power-shedding)
Item Value Date reported Reference
Total installed capacity (GW) 209.27 October 2012 [46][47]
Available base load supply (MU) 893371 October 2012 [48]
Available peak load supply (GW) 125.23 October 2012 [48]
Demand base load (MU) 985317 October 2012 [48]
Demand peak load (GW) 140.09 October 2012 [48]
State-owned and privately owned companies are significant players in India's electricity sector, with the private sector growing at a faster rate. India's
central government and state governments jointly regulate electricity sector in India.
Major economic and social drivers for India's push for electricity generation include India's goal to provide universal access, the need to replace current
highly polluting energy sources in use in India with cleaner energy sources, a rapidly growing economy, increasing household incomes, limited domestic
reserves of fossil fuels and the adverse impact on the environment of rapid development in urban and regional areas.[49]

State-wise All India installed capacity[50]
(as of 31-December-2013 including allocated shares in joint and central sector utilities)
State/Union
Territory
Thermal (in MW)Nuclear
(in
MW)
Renewable (in MW)Total (in
MW)
% of
National
Installed
CapacityCoal Gas Diesel
Sub-Total
ThermalHydel
Other
Renewable
Sub-Total
Renewable
Maharastra 20,239.27 3,475.93 - 23,715.20 690.14 3,331.84 4,768.80 8,100.64 32,505.98 13.90%
Gujarat 15,738.27 4,978.99 17.48 20,734.74 559.32 772.00 4,203.06 4,975.06 26,269.12 11.23%
Madhya
Pradesh8,503.89 257.18 - 8,761.07 273.24 3,223.66 644.38 3,868.04 12,902.35 5.52%
Chhattisgarh 6,388.49 - - 6,388.49 47.52 120.00 308.90 428.90 6,864.91 2.93%
Dadra &
Nagar Haveli1,622.35 196.91 - 1,819.26 228.14 - - - 2,047.40 0.88%
Goa 326.17 48.00 - 374.17 25.80 - 0.05 0.05 400.02 0.17%
Daman & Diu 36.71 4.20 - 40.91 7.38 - - - 48.29 0.02%
Central -
Unallocated1,622.35 196.91 - 1,819.26 228.14 - - - 2,047.40 0.88%
Western 52,899.51 8,988.31 17.48 61,905.30 1,840.00 7,447.50 9,925.19 17,372.69 81,117.99 34.68%
Uttar Pradesh 10,682.95 549.97 - 11,232.92 335.72 1,859.45 846.48 2,705.93 14,274.57 6.10%
Rajasthan 7,679.72 775.03 - 8,454.75 573.00 1,548.32 3,483.05 5,031.37 14,059.12 6.01%
Haryana 6,082.03 560.29 3.92 6,646.24 109.16 1,373.21 123.20 1,496.41 8,251.81 3.53%
Punjab 3,790.88 288.92 - 4,079.80 208.04 3,029.53 297.58 3,327.11 7,614.95 3.26%
Delhi 4,556.37 2,116.01 - 6,672.38 122.08 690.33 16.00 706.33 7,500.79 3.21%
Himachal
Pradesh152.02 61.88 3.92 214.03 34.08 2,950.94 625.91 3,576.85 3,824.96 1.64%
Uttarakhand 300.50 69.35 - 369.85 22.28 2,006.01 189.87 2,195.88 2,588.01 1.11%
Jammu &
Kashmir329.32 304.14 8.94 642.40 77.00 1,658.03 147.53 1,805.56 2,524.96 1.08%
Chandigarh 32.54 15.32 - 47.86 8.84 52.88 - 52.88 109.58 0.05%
Central -
Unallocated977.19 290.35 - 1,267.54 129.80 524.05 - 524.05 1,921.39 0.82%
Northern 34,583.50 5,031.26 12.99 39,627.75 1,620.00 15,692.75 5,729.62 21,422.37 62,670.12 26.79%
Tamil Nadu 8,726.40 1026.30 411.66 10,014.36 524.00 2,182.20 7,946.13 10,128.33 20,666.69 8.83%
Andhra
Pradesh8,573.48 3,370.40 36.80 11,980.68 275.78 3,734.53 1,294.49 5,029.02 17,285.48 7.39%
Karnataka 6,158.39 - 234.42 6,392.81 254.86 3,599.80 3,693.19 7,292.99 13,940.66 5.96%
Kerala 914.56 533.58 256.44 1,704.58 95.60 1881.50 193.52 2,075.02 3,875.20 1.66%
Puducherry 230.09 32.50 - 262.59 19.28 - - - 281.87 0.12%
Central -
Unallocated1,329.58 - - 1,329.58 150.48 - - - 1,480.06 0.82%
Southern 25,932.50 4,962.78 939.32 31,834.60 1,320.00 11,398.03 13,127.33 24,525.36 57,679.96 24.66%
West Bengal 7,216.87 100.00 12.20 7,329.07 - 1,248.30 131.45 1,379.75 8,708.82 3.72%
Odisha 5,115.06 - - 5,115.06 - 2,166.93 99.80 2,266.73 7,381.79 3.16%
DVC 6,555.60 90.00 - 6,645.60 - 193.26 - 193.26 6838.86 2.92%
Jharkhand 2,358.88 - - 2,358.88 - 200.93 20.05 220.98 2,579.86 1.10%
Bihar 1,954.70 - - 1,954.70 - 129.43 114.00 243.43 2,198.13 0.94%
Assam 60.00 598.52 20.69 679.21 - 429.72 31.11 460.83 1,140.04 0.49%
Meghalaya - 65.61 2.05 67.66 - 356.58 31.03 387.61 455.27 0.19%
Tripura - 349.84 4.85 354.69 - 62.37 16.01 78.38 433.07 0.19%
Sikkim 82.61 - 5.00 87.61 - 174.27 52.11 226.38 313.99 0.13%
Arunachal
Pradesh- 32.05 15.88 47.93 - 97.57 103.91 201.48 249.41 0.11%
Manipur - 46.96 45.41 92.37 - 80.98 5.45 86.43 178.80 0.08%
Mizoram - 27.28 51.86 79.14 - 34.31 36.47 70.78 149.92 0.06%
Islands - - 70.02 70.02 - - 10.35 10.35 80.37 0.03%
Total 138,213.39 20,380.85 1,199.75 159,793.99 4,780 39,893.40 29,462.55 69,355.95 233,929.94 100.00%
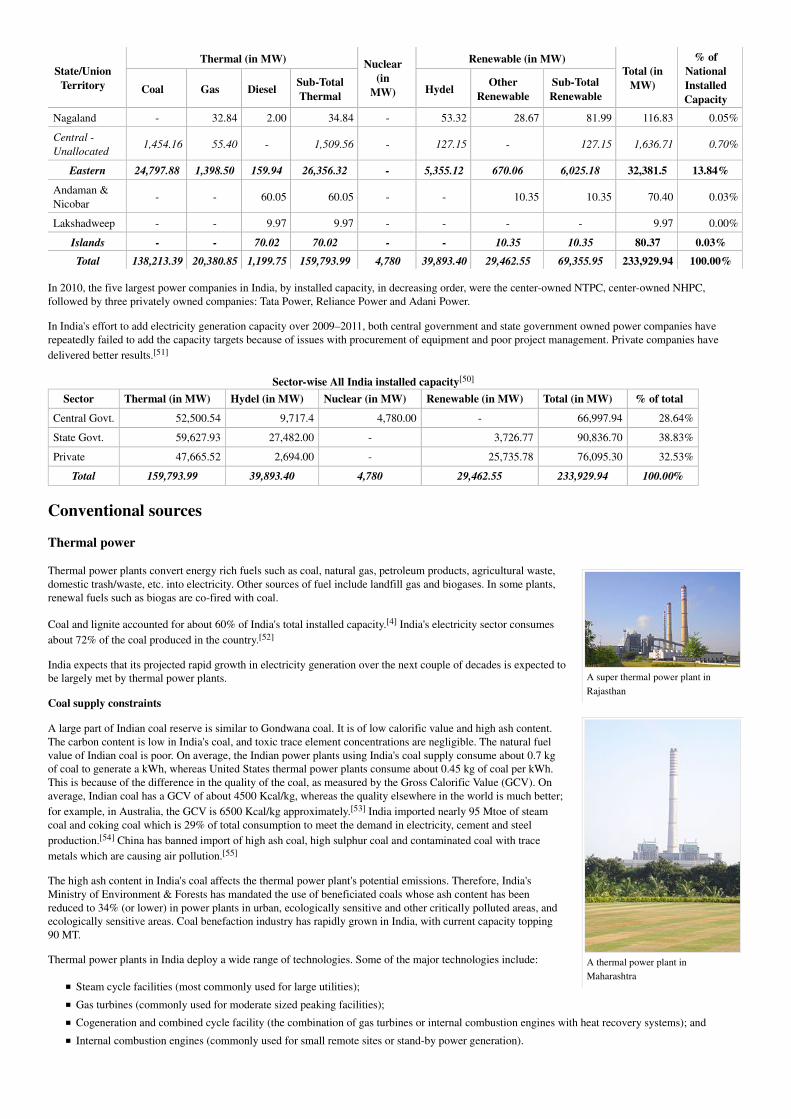
A super thermal power plant in
Rajasthan
A thermal power plant in
Maharashtra
State/Union
Territory
Thermal (in MW)Nuclear
(in
MW)
Renewable (in MW)Total (in
MW)
% of
National
Installed
CapacityCoal Gas Diesel
Sub-Total
ThermalHydel
Other
Renewable
Sub-Total
Renewable
Islands - - 70.02 70.02 - - 10.35 10.35 80.37 0.03%
Total 138,213.39 20,380.85 1,199.75 159,793.99 4,780 39,893.40 29,462.55 69,355.95 233,929.94 100.00%
Nagaland - 32.84 2.00 34.84 - 53.32 28.67 81.99 116.83 0.05%
Central -
Unallocated1,454.16 55.40 - 1,509.56 - 127.15 - 127.15 1,636.71 0.70%
Eastern 24,797.88 1,398.50 159.94 26,356.32 - 5,355.12 670.06 6,025.18 32,381.5 13.84%
Andaman &
Nicobar- - 60.05 60.05 - - 10.35 10.35 70.40 0.03%
Lakshadweep - - 9.97 9.97 - - - - 9.97 0.00%
In 2010, the five largest power companies in India, by installed capacity, in decreasing order, were the center-owned NTPC, center-owned NHPC,
followed by three privately owned companies: Tata Power, Reliance Power and Adani Power.
In India's effort to add electricity generation capacity over 2009–2011, both central government and state government owned power companies have
repeatedly failed to add the capacity targets because of issues with procurement of equipment and poor project management. Private companies have
delivered better results.[51]
Sector-wise All India installed capacity[50]
Sector Thermal (in MW) Hydel (in MW) Nuclear (in MW) Renewable (in MW) Total (in MW) % of total
Central Govt. 52,500.54 9,717.4 4,780.00 - 66,997.94 28.64%
State Govt. 59,627.93 27,482.00 - 3,726.77 90,836.70 38.83%
Private 47,665.52 2,694.00 - 25,735.78 76,095.30 32.53%
Total 159,793.99 39,893.40 4,780 29,462.55 233,929.94 100.00%
Conventional sources
Thermal power
Thermal power plants convert energy rich fuels such as coal, natural gas, petroleum products, agricultural waste,
domestic trash/waste, etc. into electricity. Other sources of fuel include landfill gas and biogases. In some plants,
renewal fuels such as biogas are co-fired with coal.
Coal and lignite accounted for about 60% of India's total installed capacity.[4] India's electricity sector consumes
about 72% of the coal produced in the country.[52]
India expects that its projected rapid growth in electricity generation over the next couple of decades is expected to
be largely met by thermal power plants.
Coal supply constraints
A large part of Indian coal reserve is similar to Gondwana coal. It is of low calorific value and high ash content.
The carbon content is low in India's coal, and toxic trace element concentrations are negligible. The natural fuel
value of Indian coal is poor. On average, the Indian power plants using India's coal supply consume about 0.7 kg
of coal to generate a kWh, whereas United States thermal power plants consume about 0.45 kg of coal per kWh.
This is because of the difference in the quality of the coal, as measured by the Gross Calorific Value (GCV). On
average, Indian coal has a GCV of about 4500 Kcal/kg, whereas the quality elsewhere in the world is much better;
for example, in Australia, the GCV is 6500 Kcal/kg approximately.[53] India imported nearly 95 Mtoe of steam
coal and coking coal which is 29% of total consumption to meet the demand in electricity, cement and steel
production.[54] China has banned import of high ash coal, high sulphur coal and contaminated coal with trace
metals which are causing air pollution.[55]
The high ash content in India's coal affects the thermal power plant's potential emissions. Therefore, India's
Ministry of Environment & Forests has mandated the use of beneficiated coals whose ash content has been
reduced to 34% (or lower) in power plants in urban, ecologically sensitive and other critically polluted areas, and
ecologically sensitive areas. Coal benefaction industry has rapidly grown in India, with current capacity topping
90 MT.
Thermal power plants in India deploy a wide range of technologies. Some of the major technologies include:
Steam cycle facilities (most commonly used for large utilities);
Gas turbines (commonly used for moderate sized peaking facilities);
Cogeneration and combined cycle facility (the combination of gas turbines or internal combustion engines with heat recovery systems); and
Internal combustion engines (commonly used for small remote sites or stand-by power generation).

Gasification of Char/Coal
Indira Sagar Dam partially completed in 2008
Nagarjuna Sagar Dam and
hydroelectric power plant on the
Krishna River. It is the world's largest
masonry dam, with an installed
capacity of 800 MW. The dam also
irrigates about 1.4 million acres of
previously drought-prone land.
Kudankulam Nuclear Power Plant
under construction in 2009. It was
96% complete as of March 2011, with
first phase expected to be in use in
2012. With initial installed capacity
of 2 GW, this plant will be expanded
to 6.8 GW capacity.
India has an extensive review process, one that includes environment impact assessment, prior to a thermal power plant being approved for construction
and commissioning. The Ministry of Environment and Forests has published a technical guidance manual to help project proposers and to prevent
environmental pollution in India from thermal power plants.[56]
Natural gas supply constraints
The installed capacity of natural gas based power plants is 21,727 MW at the end of financial year 2013-14. These base load
power plants are operating at overall PLF of 25% only due to severe shortage of Natural gas in the country.[57] Imported
LNG is too costly for the power generation. Many of these power stations are shut down throughout the year for lack of
natural gas supply. Natural gas shortage for power sector alone is nearly 100 MMSCMD
Gasification of coal or lignite or biomass, produces syngas or coal gas or wood gas which is a mixture of hydrogen, carbon
monoxide and carbon dioxide gases. Coal gas can be converted in to synthetic natural gas by using Fischer–Tropsch process
at low pressure and high temperature. Coal gas can also be produced by underground coal gasification where the coal deposits are located deep in the
ground or uneconomical to mine the coal.[58] Synthetic natural gas production technologies have tremendous scope to meet the SNG requirements of Gas
based power stations fully using the locally available coal (or imported coal in short run). Dankuni coal complex is producing syngas which is piped to
the industrial users in Calcutta.[59] Many coal based fertiliser plants which are shut down can also be retrofitted economically to produce synthetic natural
gas for bridging natural gas shortages. It is estimated that SNG production cost would be below 6 $ per Mbtu.[60][61] The indigenously produced natural
gas by the Exploration & Production (E&P) contractors sold at prevailing international gas prices do not guarantee the natural gas supply whereas the
SNG produced from coal/ biomass is reliable & dependable fuel supply to the gas based power stations and other natural gas consumers.
Hydro power
The hydro-electric power plants at Darjeeling and Shimsha (Shivanasamudra) were
established in 1898 and 1902 respectively and were among the first in Asia.
India is endowed with economically exploitable and viable hydro potential assessed to be
about 84,000 MW at 60% load factor. In addition, 6740 MW in terms of installed capacity
from Small, Mini, and Micro Hydel schemes have been assessed. Also, 56 sites for
pumped storage schemes with an aggregate installed capacity of 94,000 MW have been
identified. It is the most widely used form of renewable energy. India is blessed with
immense amount of hydro-electric potential and ranks 5th in terms of exploitable hydro-potential on global
scenario.
The present installed capacity as of 31 May 2014 is approximately 40,661.41 MW which is 16.36% of total
electricity generation in India.[4] The public sector has a predominant share of 97% in this sector.[62] National
Hydroelectric Power Corporation (NHPC), Northeast Electric Power Company (NEEPCO), Satluj jal vidyut
nigam (SJVNL), Tehri Hydro Development Corporation, NTPC-Hydro are a few public sector companies engaged
in development of hydroelectric power in India.
Pumped storage schemes are perfect centralised peaking power stations for the load management in the electricity
grid. Pumped storage schemes would be in high demand for meeting peak load demand and storing the surplus
electricity as India graduates from electricity deficit to electricity surplus. They also produce secondary /seasonal
power at no additional cost when rivers are flooding with excess water. Storing electricity by other alternative
systems such as batteries, compressed air storage systems, etc. is more costlier than electricity production by
standby generator. India has already established nearly 6800 MW pumped storage capacity which is part of its
installed hydro power plants.[63]
Nuclear power
As of 2011, India had 4.8 GW of installed electricity generation capacity using nuclear fuels. India's Nuclear
plants generated 32455 million units or 3.75% of total electricity produced in India.[64]
India's nuclear power plant development began in 1964. India signed an agreement with General Electric of the
United States for the construction and commissioning of two boiling water reactors at Tarapur. In 1967, this effort
was placed under India's Department of Atomic Energy. In 1971, India set up its first pressurised heavy water
reactors with Canadian collaboration in Rajasthan. In 1987, India created Nuclear Power Corporation of India
Limited to commercialise nuclear power.
Nuclear Power Corporation of India Limited is a public sector enterprise, wholly owned by the Government of
India, under the administrative control of its Department of Atomic Energy. Its objective is to implement and
operate nuclear power stations for India's electricity sector. The state-owned company has ambitious plans to
establish 63 GW generation capacity by 2032, as a safe, environmentally benign and economically viable source
of electrical energy to meet the increasing electricity needs of India.[65]
India's nuclear power generation effort satisfies many safeguards and oversights, such as getting ISO-14001
accreditation for environment management system and peer review by World Association of Nuclear Operators including a pre-start up peer review.
Nuclear Power Corporation of India Limited admits, in its annual report for 2011, that its biggest challenge is to address the public and policy maker
perceptions about the safety of nuclear power, particularly after the Fukushima incident in Japan.[64]
In 2011, India had 18 pressurised heavy water reactors in operation, with another four projects of 2.8 GW capacity launched. The country plans to
implement fast breeder reactors, using plutonium based fuel. Plutonium is obtained by reprocessing spent fuel of first stage reactors. India successfully
launched its first prototype fast breeder reactor of 500 MW capacity in Tamil Nadu, and now operates two such reactors.
India has nuclear power plants operating in the following states: Maharashtra, Gujarat, Rajasthan, Uttar Pradesh, Tamil Nadu and Karnataka. These
reactors have an installed electricity generation capacity between 100 to 540 MW each. New reactors with installed capacity of 1000 MW per reactor are
expected to be in use by 2012.
In 2011, The Wall Street Journal reported the discovery of uranium in a new mine in India, the country's largest ever. The estimated reserves of 64,000
tonnes, could be as large as 150,000 tonnes (making the mine one of the world's largest). The new mine is expected to provide India with a fuel that it
now imports. Nuclear fuel supply constraints had limited India's ability to grow its nuclear power generation capacity. The newly discovered ore, unlike
those in Australia, is of slightly lower grade. This mine is expected to be in operation in 2012.[66]
India's share of nuclear power plant generation capacity is just 1.2% of worldwide nuclear power production capacity, making it the 15th largest nuclear
power producer. Nuclear power provided 3% of the country's total electricity generation in 2011. India aims to supply 9% of it electricity needs with
nuclear power by 2032.[64] India's largest nuclear power plant project under implementation is at Jaitapur, Maharashtra in partnership with Areva, France.
India's government is also developing up to 62, mostly thorium reactors, which it expects to be operational by 2025. It is the "only country in the world
with a detailed, funded, government-approved plan" to focus on thorium-based nuclear power. The country currently gets under 2% of its electricity from
nuclear power, with the rest coming from coal (60%), hydroelectricity (16%), other renewable sources (12%) and natural gas (9%). It expects to produce
around 25% of its electricity from nuclear power.[67]
Non-conventional sources
Renewable energy in India is a sector that is still in its infancy.
India's electricity sector is amongst the world's most active players in renewable energy utilization, especially wind energy.[68] As of 31 January 2014,
India had an installed capacity of about 31.15 GW of non-conventional renewable technologies-based electricity, about 13.32% of its total.[69][70] For
context, the total installed capacity for electricity in Switzerland was about 18 GW in 2009.
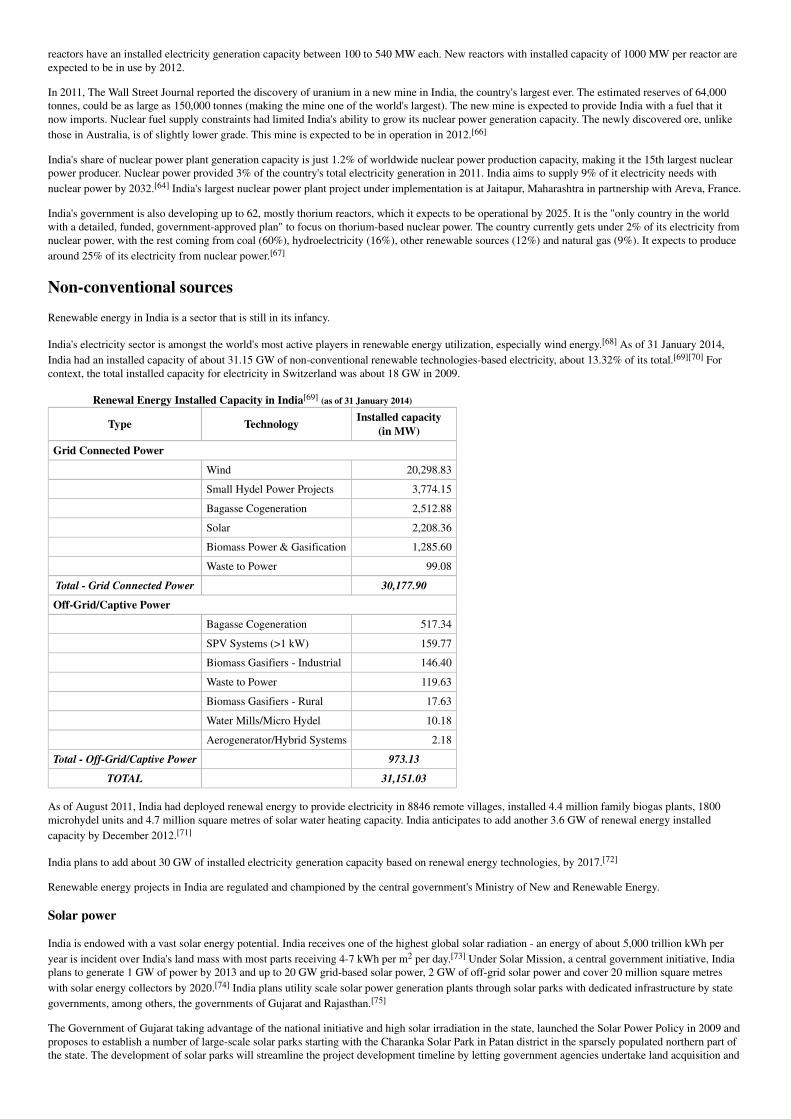
Renewal Energy Installed Capacity in India[69] (as of 31 January 2014)
Type TechnologyInstalled capacity
(in MW)
Grid Connected Power
Wind 20,298.83
Small Hydel Power Projects 3,774.15
Bagasse Cogeneration 2,512.88
Solar 2,208.36
Biomass Power & Gasification 1,285.60
Waste to Power 99.08
Total - Grid Connected Power 30,177.90
Off-Grid/Captive Power
Bagasse Cogeneration 517.34
SPV Systems (>1 kW) 159.77
Biomass Gasifiers - Industrial 146.40
Waste to Power 119.63
Biomass Gasifiers - Rural 17.63
Water Mills/Micro Hydel 10.18
Aerogenerator/Hybrid Systems 2.18
Total - Off-Grid/Captive Power 973.13
TOTAL 31,151.03
As of August 2011, India had deployed renewal energy to provide electricity in 8846 remote villages, installed 4.4 million family biogas plants, 1800
microhydel units and 4.7 million square metres of solar water heating capacity. India anticipates to add another 3.6 GW of renewal energy installed
capacity by December 2012.[71]
India plans to add about 30 GW of installed electricity generation capacity based on renewal energy technologies, by 2017.[72]
Renewable energy projects in India are regulated and championed by the central government's Ministry of New and Renewable Energy.
Solar power
India is endowed with a vast solar energy potential. India receives one of the highest global solar radiation - an energy of about 5,000 trillion kWh per
year is incident over India's land mass with most parts receiving 4-7 kWh per m2 per day.[73] Under Solar Mission, a central government initiative, India
plans to generate 1 GW of power by 2013 and up to 20 GW grid-based solar power, 2 GW of off-grid solar power and cover 20 million square metres
with solar energy collectors by 2020.[74] India plans utility scale solar power generation plants through solar parks with dedicated infrastructure by state
governments, among others, the governments of Gujarat and Rajasthan.[75]
The Government of Gujarat taking advantage of the national initiative and high solar irradiation in the state, launched the Solar Power Policy in 2009 and
proposes to establish a number of large-scale solar parks starting with the Charanka Solar Park in Patan district in the sparsely populated northern part of
the state. The development of solar parks will streamline the project development timeline by letting government agencies undertake land acquisition and

Solar resources in India
Canal Solar Power Project in Kadi,
Gujarat
Price history of silicon PV cells since
1977
Wind farm in Rajasthan.
necessary permits, and provide dedicated common infrastructure for setting up solar power generation plants
largely in the private sector. This approach will facilitate the accelerated installation of private sector solar power
generation capacity reducing costs by addressing issues faced by stand alone projects. Common infrastructure for
the solar park include site preparation and leveling, power evacuation, availability of water, access roads, security
and services. In parallel with the central government's initiative, the Gujarat Electricity Regulatory Commission
has announced feed-in tariff to mainstream solar power generation which will be applied for solar power
generation plants in the solar park. Gujarat Power Corporation Limited is the responsible agency for developing
the solar park of 500 MW and will lease the lands to the project developers to generate solar power. Gujarat
Energy Transmission Corporation Limited will develop the transmission evacuation from the identified
interconnection points with the solar developer. This project is being supported, in part, by the Asian Development
Bank.[75]
The Indian Solar Loan Programme, supported by the United Nations Environment Programme has won the
prestigious Energy Globe World award for Sustainability for helping to establish a consumer financing programme
for solar home power systems. Over the span of three years more than 16,000 solar home systems have been
financed through 2,000 bank branches, particularly in rural areas of South India where the electricity grid does not
yet extend. Launched in 2003, the Indian Solar Loan Programme was a four-year partnership between UNEP, the
UNEP Risoe Centre, and two of India's largest banks, the Canara Bank and Syndicate Bank.[76][77]
Installation of solar power plants require nearly 2.4 hectares (6 acres) land per MW capacity which is similar to
coal fired power plants when life cycle coal mining, consumptive water storage & ash disposal areas are also
accounted and hydro power plants when submergence area of water reservoir is also accounted. 1.33 million MW
capacity solar plants can be installed in India on its 1% land (32,000 square km). There are vast tracts of land
suitable for solar power in all parts of India exceeding 8% of its total area which are unproductive barren and
devoid of vegetation.[78] Part of waste lands (32,000 square km) when installed with solar power plants can
produce 2000 billion Kwh of electricity (two times the total generation in the year 2013-14) with land
productivity/yield of 1.5 million Rs per acre (6 Rs/kwh price) which is at par with many industrial areas and many
times more than the best productive irrigated agriculture lands. Moreover these solar power units are not
dependent on supply of any raw material and are self productive. There is unlimited scope for solar electricity to
replace all fossil fuel energy requirements (natural gas, coal, lignite, nuclear fuels and crude oil) if all the
marginally productive lands are occupied by solar power plants in future.[79] The solar power potential of India
can meet perennially to cater per capita energy consumption at par with USA/Japan for the peak population in its demographic transition.[80]
Land acquisition is a challenge to solar farm projects in India. Some state governments are exploring means to address land availability through
innovation; for example, by exploring means to deploy solar capacity above their extensive irrigation canal projects, thereby harvesting solar energy
while reducing the loss of irrigation water by solar evaporation.[81] The state of Gujarat was first to implement the Canal Solar Power Project, to use
19,000 km (12,000 mi) long network of Narmada canals across the state for setting up solar panels to generate electricity. It was the first ever such project
in India.
Synergy with irrigation water pumping and hydro power stations
The major disadvantage of solar power (PV type) is that it can not produce electricity during the night time and
cloudy day time also. In India, this disadvantage can be overcome by installing pumped-storage hydroelectricity
stations. Ultimate electricity requirement for river water pumping (excluding ground water pumping) is 570 billion
Kwh to pump one cubic meter of water for each square meter area by 125 m height on average for irrigating 140
million hectares of net sown area (42% of total land) for three crops in a year.[82] This is achieved by utilising all
the usable river waters by interlinking Indian rivers.[83] These river water pumping stations would also be
envisaged with pumped-storage hydroelectricity features to generate electricity during the night time. These
pumped-storage stations would work at 200% water pumping requirement during the day time and generate
electricity at 50% of total capacity during the night time. Also, all existing and future hydro power stations can be
expanded with additional pumped-storage hydroelectricity units to cater night time electricity consumption. Most
of the ground water pumping power can be met directly by solar power.[84]
Wind power
India has the fifth largest installed wind power capacity in the world.[85] In 2010, wind power accounted for 6% of
India's total installed power capacity, and 1.6% of the country's power output.
The development of wind power in India began in the 1990s by Tamil Nadu Electric Board near Tuticorin, and has
significantly increased in the last few years. Suzlon is the leading Indian company in wind power, with an installed
generation capacity of 6.2 GW in India. Vestas is another major company active in India's wind energy
initiative.[86]
As December 2011, the installed capacity of wind power in India was 15.9 GW, spread across many states of
India.[72][85] The largest wind power generating state was Tamil Nadu accounting for 30% of installed capacity,
followed in decreasing order by Maharashtra, Gujarat, Karnataka, and Rajasthan.[87] It is estimated that 6 GW of
additional wind power capacity will be installed in India by 2012.[88] In Tamil Nadu, wind power is mostly harvested in the southern districts such as
Kanyakumari, Tirunelveli and Tuticorin.
The state of Gujarat is estimated to have the maximum gross wind power potential in India, with a potential of 10.6 GW.[86]
Biomass power
In this system biomass, bagasse, forestry and agro residue & agricultural wastes are used as fuel to produce electricity.[89] Nearly 750 million tons of non

Wind turbines midst India's
agricultural farms.
Wind farms midst paddy fields in
India.
edible (by cattle) biomass is available annually in India which can be put to use for higher value addition.
Torrefied biomass
Huge quantity of imported coal is being used in pulverised coal fired power stations. Raw biomass can not be used
in the pulverised coal mills as they are difficult to grind in to fine powder due to caking property of raw biomass.
However biomass can be used after Torrefaction in the pulverised coal mills for replacing imported coal.[90] North
west and southern regions can replace imported coal use with torrefied biomass where surplus agriculture/crop
residual biomass is available.
Biomass gasifier
India has been promoting biomass gasifier technologies in its rural areas, to utilise surplus biomass resources such
as rice husk, crop stalks, small wood chips, other agro-residues. The goal was to produce electricity for villages
with power plants of up to 2 MW capacities. During 2011, India installed 25 rice husk based gasifier systems for
distributed power generation in 70 remote villages of Bihar. The Largest Biomass based power plant in India is at
Sirohi, Rajasthan having the capacity of 20 MW, i.e., Sambhav Energy Limited. In addition, gasifier systems are
being installed at 60 rice mills in India. During the year, biomass gasifier projects of 1.20 MW in Gujarat and 0.5
MW in Tamil Nadu were successfully installed.[72]
Biogas
This pilot programme aims to install small-scale biogas plants for meeting the cooking energy needs in rural areas
of India. During 2011, some 45000 small-scale biogas plants were installed. Cumulatively, India has installed 4.44
million small-scale biogas plants.
In 2011, India started a new initiative with the aim to demonstrate medium size mixed feed biogas-fertiliser pilot
plants. This technology aims for generation, purification/enrichment, bottling and piped distribution of biogas.
India approved 21 of these projects with aggregate capacity of 37016 cubic metre per day, of which 2 projects
have been successfully commissioned by December 2011.[72]
India has additionally commissioned 158 projects under its Biogas based Distributed/Grid Power Generation
programme, with a total installed capacity of about 2 MW.
India is rich in biomass and has a potential of 16,881 MW (agro-residues and plantations), 5000 MW (bagasse cogeneration) and 2700 MW (energy
recovery from waste). Biomass power generation in India is an industry that attracts investments of over INR 6 billion every year, generating more than
5000 million units of electricity and yearly employment of more than 10 million man-days in the rural areas.
As of 2010, India burnt over 200 million tonnes of coal replacement worth of traditional biomass fuel every year to meet its energy need for cooking and
other domestic use. This traditional biomass fuel – fuelwood, crop waste and animal dung – is a potential raw material for the application of biomass
technologies for the recovery of cleaner fuel, fertilisers and electricity with significantly lower pollution.
Biomass available in India can and has been playing an important role as fuel for sugar mills, textiles, paper mills, and small and medium enterprises
(SME). In particular there is a significant potential in breweries, textile mills, fertiliser plants, the paper and pulp industry, solvent extraction units, rice
mills, petrochemical plants and other industries to harness biomass power.[91]
Geothermal energy
Geothermal energy is thermal energy generated and stored in the Earth. Thermal energy is the energy that determines the temperature of matter. India's
geothermal energy installed capacity is experimental. Commercial use is insignificant.
According to some ambitious estimates, India has 10,600 MW of potential in the geothermal provinces but it still needs to be exploited.[92] India has
potential resources to harvest geothermal energy. The resource map for India has been grouped into six geothermal provinces:[93]
Himalayan Province – Tertiary Orogenic belt with Tertiary magmatism
Areas of Faulted blocks – Aravalli belt, Naga-Lushi, West coast regions and Son-Narmada lineament.
Volcanic arc – Andaman and Nicobar arc.
Deep sedimentary basin of Tertiary age such as Cambay basin in Gujarat.
Radioactive Province – Surajkund, Hazaribagh, Jharkhand.
Cratonic province – Peninsular India
India has about 340 hot springs spread over the country. Of this, 62 are distributed along the northwest Himalaya, in the States of Jammu and Kashmir,
Himachal Pradesh and Uttarakhand. They are found concentrated along a 30-50-km wide thermal band mostly along the river valleys. Naga-Lusai and
West Coast Provinces manifest a series of thermal springs. Andaman and Nicobar arc is the only place in India where volcanic activity, a continuation of
the Indonesian geothermal fields, and can be good potential sites for geothermal energy. Cambay graben geothermal belt is 200 km long and 50 km wide
with Tertiary sediments. Thermal springs have been reported from the belt although they are not of very high temperature and discharge. During oil and
gas drilling in this area, in recent times, high subsurface temperature and thermal fluid have been reported in deep drill wells in depth ranges of 1.7 to
1.9 km. Steam blowout have also been reported in the drill holes in depth range of 1.5 to 3.4 km. The thermal springs in India's peninsular region are
more related to the faults, which allow down circulation of meteoric water to considerable depths. The circulating water acquires heat from the normal
thermal gradient in the area, and depending upon local condition, emerges out at suitable localities. The area includes Aravalli range, Son-Narmada-Tapti
lineament, Godavari and Mahanadi valleys and South Cratonic Belts.[93]
In a December 2011 report, India identified six most promising geothermal sites for the development of geothermal energy. These are, in decreasing order
of potential:

Electricity transmission grid in
eastern India.
Tattapani in Chhattisgarh
Puga in Jammu & Kashmir
Cambay Graben in Gujarat
Manikaran in Himachal Pradesh
Surajkund in Jharkhand
Chhumathang in Jammu & Kashmir
India plans to set up its first geothermal power plant, with 2–5 MW capacity at Puga in Jammu and Kashmir.[94]
Tidal wave energy
Tidal energy technologies harvest energy from the seas. The potential of tidal wave energy becomes higher in certain regions by local effects such as
shelving, funnelling, reflection and resonance.
India is surrounded by sea on three sides, its potential to harness tidal energy is significant.
Energy can be extracted from tides in several ways. In one method, a reservoir is created behind a barrage and then tidal waters pass through turbines in
the barrage to generate electricity. This method requires mean tidal differences greater than 4 metres and also favourable topographical conditions to keep
installation costs low. One report claims the most attractive locations in India, for the barrage technology, are the Gulf of Khambhat and the Gulf of Kutch
on India's west coast where the maximum tidal range is 11 m and 8 m with average tidal range of 6.77 m and 5.23 m respectively. The Ganges Delta in
the Sunderbans, West Bengal is another possibility, although with significantly less recoverable energy; the maximum tidal range in Sunderbans is
approximately 5 m with an average tidal range of 2.97 m. The report claims, barrage technology could harvest about 8 GW from tidal energy in India,
mostly in Gujarat. The barrage approach has several disadvantages, one being the effect of any badly engineered barrage on the migratory fishes, marine
ecosystem and aquatic life. Integrated barrage technology plants can be expensive to build.
In December 2011, the Ministry of New & Renewable Energy, Government of India and the Renewable Energy Development Agency of Govt. of West
Bengal jointly approved and agreed to implement India's first 3.75 MW Durgaduani mini tidal power project. Indian government believes that tidal
energy may be an attractive solution to meet the local energy demands of this remote delta region.[94]
Another tidal wave technology harvests energy from surface waves or from pressure fluctuations below the sea surface. A report from the Ocean
Engineering Centre, Indian Institute of Technology, Madras estimates the annual wave energy potential along the Indian coast is between 5 MW to 15
MW per metre, suggesting a theoretical maximum potential for electricity harvesting from India's 7500 kilometre coast line may be about 40 GW.
However, the realistic economical potential, the report claims, is likely to be considerably less.[95] A significant barrier to surface energy harvesting is the
interference of its equipment to fishing and other sea bound vessels, particularly in unsettled weather. India built its first seas surface energy harvesting
technology demonstration plant in Vizhinjam, near Thiruruvananthpuram.
The third approach to harvesting tidal energy consists of ocean thermal energy technology. This approach tries to harvest the solar energy trapped in
ocean waters into usable energy. Oceans have a thermal gradient, the surface being much warmer than deeper levels of ocean. This thermal gradient may
be harvested using modified Rankine cycle. India's National Institute of Ocean Technology (NIOT) attempted this approach over the last 20 years, but
without success. In 2003, with Saga University of Japan, NIOT attempted to build and deploy a 1 MW demonstration plant.[96] However, mechanical
problems prevented success. After initial tests near Kerala, the unit was scheduled for redeployment and further development in the Lakshadweep Islands
in 2005. The demonstration project's experience have limited follow-on efforts with ocean thermal energy technology in India.
Electricity transmission and distribution
Installed transmission (circuit km) and distribution capacity (MVA) up to June
2014
CapacitySubstations [97]
(MVA)
Transmission lines [98]
(c.km)c.km / MVA ratio#
± 500 kV HVDC 13,500 9,432 0.699
765 kV 88,500 12,367 0.140
400 kV 180,872 127,261 0.704
200 kV 258,444 145,561 0.563
# the ratio to be multiplied with transmission line capacity (MVA) to give average installed length of transmission line per one MVA of installed
substation capacity at each voltage level.
The all time maximum peak load is not exceeding 151,000 MW in the unified grid whereas the all time peak load met is 136,000 MW on 30/6/2014.[99][100] The maximum achieved demand factor of substations is nearly 61.91% at 200 kV level. The operational performance of the huge capacity
substations and the vast network of high voltage transmission lines with low demand factor is not satisfactory in meeting the peak electricity load.
Detailed forensic engineering studies are to be undertaken and system inadequacies rectified to evolve in to smart grid for maximising utility of the
existing transmission infrastructure with optimum future capital investments.
The July 2012 blackout, affecting the north of the country, was the largest power grid failure in history by number of people affected. The introduction of
Availability Based Tariff (ABT) has brought about stability to a great extent in the Indian transmission grids.
India's network technical losses is 23.65% in 2013 compared to world average of less than 15%.[50] The Government has pegged the national T&D losses
at around 24% for the year 2011 & has set a target of reducing them to 17.1% by 2017 & to 14.1% by 2022. A high proportion of non-technical losses are
caused by illegal tapping of lines, and faulty electric meters that underestimate actual consumption also contribute to reduced payment collection. A case
study in Kerala estimated that replacing faulty meters could reduce distribution losses from 34% to 29%.[16]

A tower supporting 220 kV line near
Ennore, Chennai
Problems with India's power sector
India's electricity sector faces many issues. Some are:[22][38][101][102]
A system of cross-subsidization is practiced based on the principle of 'the consumer's ability to pay'. In
general, the industrial and commercial consumers subsidize the domestic and agricultural consumers.[103]
Further, Government giveaways such as free electricity for farmers, partly to curry political favour, have
depleted the cash reserves of state-run electricity-distribution system. This has financially crippled the
distribution network, and its ability to pay for power to meet the demand.[104] This situation has been
worsened by government departments of India that do not pay their bills.
The residential building sector is one of the largest consumers of electricity in India. Continuous
urbanisation and the growth of population result in increasing power consumption in buildings. Thus, while
experts express the huge potential for energy conservations in this sector, the belief still predominates
among stakeholders that energy-efficient buildings are more expensive than conventional buildings, which
adversely affects the “greening” of the building sector.[105]
Key implementation challenges for India's electricity sector include new project management and
execution, ensuring availability of fuel quantities and qualities, lack of initiative to develop large coal and natural gas resources available in India,
land acquisition, environmental clearances at state and central government level, and training of skilled manpower to prevent talent shortages for
operating latest technology plants.[106]
Shortages of fuel: despite abundant reserves of coal, India is facing a severe shortage of coal. The country isn't producing enough to feed its power
plants. Some plants do not have reserve coal supplies to last a day of operations. India's monopoly coal producer, state-controlled Coal India, is
constrained by primitive mining techniques and is rife with theft and corruption; Coal India has consistently missed production targets and growth
targets. Poor coal transport infrastructure has worsened these problems. To expand its coal production capacity, Coal India needs to mine new
deposits. However, most of India's coal lies under protected forests or designated tribal lands. Any mining activity or land acquisition for
infrastructure in these coal-rich areas of India, has been rife with political demonstrations, social activism and public interest litigations.
Poor pipeline connectivity and infrastructure to harness India's abundant coal bed methane and shale gas potential.
The giant new offshore natural gas field has delivered less fuel than projected. India faces a shortage of natural gas.
Hydroelectric power projects in India's mountainous north and north east regions have been slowed down by ecological, environmental and
rehabilitation controversies, coupled with public interest litigations.
Theft of power
Losses in the connector systems/service connections leading to premature failure of capital equipments like transformers
India's nuclear power generation potential has been stymied by political activism since the Fukushima disaster in Japan.
Average transmission, distribution and consumer-level losses exceeding 30% which includes auxiliary power consumption of thermal power
stations, fictitious electricity generation by wind generators & independent power producers (IPPs), etc.
Over 300 million (300 million) people in India have no access to electricity. Of those who do, almost all find electricity supply intermittent and
unreliable.
Lack of clean and reliable energy sources such as electricity is, in part, causing about 800 million (800 million) people in India to continue using
traditional biomass energy sources – namely fuel wood, agricultural waste and livestock dung – for cooking and other domestic needs.[18]
Traditional fuel combustion is the primary source of indoor air pollution in India, causes between 300,000 to 400,000 deaths per year and other
chronic health issues.
India's coal-fired, oil-fired and natural gas-fired thermal power plants are inefficient and offer significant potential for greenhouse gas (CO2)
emission reduction through better technology. Compared to the average emissions from coal-fired, oil-fired and natural gas-fired thermal power
plants in European Union (EU-27) countries, India's thermal power plants emit 50% to 120% more CO2 per kWh produced.[107]
Resource potential in electricity sector
According to Oil and Gas Journal, India had approximately 38 trillion cubic feet (Tcf) of proven natural gas reserves as of January 2011, world's 26th
largest. United States Energy Information Administration estimates that India produced approximately 1.8 Tcf of natural gas in 2010, while consuming
roughly 2.3 Tcf of natural gas. The electrical power and fertiliser sectors account for nearly three-quarters of natural gas consumption in India. Natural
gas is expected to be an increasingly important component of energy consumption as the country pursues energy resource diversification and overall
energy security.[108][109]
Until 2008, the majority of India's natural gas production came from the Mumbai High complex in the northwest part of the country. Recent discoveries
in the Bay of Bengal have shifted the centre of gravity of Indian natural gas production.
The country already produces some coalbed methane and has major potential to expand this source of cleaner fuel. According to a 2011 Oil and Gas
Journal report, India is estimated to have between 600 to 2000 Tcf of shale gas resources (one of the world's largest). Despite its natural resource
potential, and an opportunity to create energy industry jobs, India has yet to hold a licensing round for its shale gas blocks. It is not even mentioned in
India's central government energy infrastructure or electricity generation plan documents through 2025. The traditional natural gas reserves too have been
very slow to develop in India because regulatory burdens and bureaucratic red tape severely limit the country's ability to harness its natural gas resources.[38][107][110]

Electricity trading with neighbour countries
India has constructed few hydro projects in Bhutan totalling to nearly 2600 MW. Most of the electricity generated by Bhutan from these hydro projects is
exported to India. India can also enter into long term power purchase agreements with China for developing the Zangmu Dam, a hydro power plant in the
Brahmaputra River basin of Tibet region. India can also supply its surplus/imported electricity to Sri Lanka by undersea cable link. There is ample trading
synergy for India with its neighbour countries in securing its energy requirements.
Electricity as substitute to imported LPG and kerosene
The net import of liquefied petroleum gas (LPG) is 6.093 million tons and the domestic consumption is 13.568 million tons with Rs. 41,546 crores
subsidy to the domestic consumers in the year 2012-13.[111] The LPG import content is nearly 40% of total consumption in India. The affordable
electricity retail tariff (860 Kcal/Kwh at 90% heating efficiency) to replace LPG (lower heating value 11,000 Kcal/Kg at 75% heating efficiency) in
domestic cooking is 6.47 Rs/Kwh when the retail price of LPG cylinder is Rs 1000 (without subsidy) with 14.2 kg LPG content. Replacing LPG
consumption with electricity reduces its imports substantially.
The domestic consumption of kerosene is 7.349 million tons with Rs. 30,151 crores subsidy to the domestic consumers in the year 2012-13. The
subsidised retail price of kerosene is 13.69 Rs/litre whereas the export/import price is 48.00 Rs/litre. The affordable electricity retail tariff (860 Kcal/Kwh
at 90% heating efficiency) to replace kerosene (lower heating value 8240 Kcal/litre at 75% heating efficiency) in domestic cooking is 6.00 Rs/Kwh when
Kerosene retail price is 48 Rs/litre (without subsidy).
In the year 2013-14, the plant load factor (PLF) of coal fired thermal power stations is only 65.43% whereas these stations can run above 85% PLF
comfortably provided there is adequate electricity demand in the country.[112] The additional electricity generation at 85% PLF is nearly 240 billion units
which is adequate to replace all the LPG and kerosene consumption in domestic sector. The incremental cost of generating additional electricity is only
their coal fuel cost which is less than 3 Rs/Kwh. Enhancing the PLF of coal fired stations and encouraging domestic electricity consumers to substitute
electricity in place of LPG and kerosene in household cooking, would reduce the government subsidies and idle capacity of thermal power stations can be
put to use economically. The domestic consumers who are willing to surrender the subsidised LPG/kerosene permits or eligible for subsidised
LPG/kerosene permits, may be given free electricity connection and subsidised electricity tariff.
During the year 2014, IPPs are offering to sell solar power below 5.50 Rs/Kwh to feed in to the high voltage grid.[113][114] This price is close to affordable
electricity tariff for the solar power to replace LPG and Kerosene use (after including subsidy on LPG & Kerosene) in domestic sector.
Electricity driven vehicles
The retail prices of petrol and diesel are high in India to make electricity driven vehicles more economical as more and more electricity is generated from
solar energy in near future without appreciable environmental effects. The retail price of diesel is 53.00 Rs/litre in the year 2012-13. The affordable
electricity retail price (860 Kcal/Kwh at 75% input electricity to shaft power efficiency) to replace diesel (lower heating value 8572 Kcal/litre at 40% fuel
energy to crank shaft power efficiency) is 9.97 Rs/Kwh. The retail price of petrol is 75.00 Rs/litre in the year 2012-13. The affordable electricity retail
price (860 Kcal/Kwh at 75% input electricity to shaft power efficiency) to replace petrol (lower heating value 7693 Kcal/litre at 33% fuel energy to crank
shaft power efficiency) is 19.06 Rs/Kwh. In the year 2012-13, India consumed 15.744 million tons petrol and 69.179 millon tons diesel which are mainly
produced from imported crude oil at huge foreign exchange out go.[111]
V2G is also feasible with electricity driven vehicles to contribute for catering to the peak load in the electricity grid. Electricity driven vehicles would
become popular in future when its energy storage/battery technology becomes more long lasting and maintenance free.
Human resource development
Rapid growth of electricity sector in India demands that talent and trained personnel become available as India's new installed capacity adds new jobs.
India has initiated the process to rapidly expand energy education in the country, to enable the existing educational institutions to introduce courses
related to energy capacity addition, production, operations and maintenance, in their regular curriculum. This initiative includes conventional and renewal
energy.
A Ministry of Renewal and New Energy announcement claims State Renewable Energy Agencies are being supported to organise short-term training
programmes for installation, operation and maintenance and repair of renewable energy systems in such places where intensive RE programme are being
implemented. Renewable Energy Chairs have been established in IIT Roorkee and IIT Kharagpur.[72]
Education and availability of skilled workers is expected to be a key challenge in India's effort to rapidly expand its electricity sector.
Regulation and administration
The Ministry of Power is India's apex central government body regulating the electrical energy sector in India. This ministry was created on 2 July 1992.
It is responsible for planning, policy formulation, processing of projects for investment decisions, monitoring project implementation, training and
manpower development, and the administration and enactment of legislation in regard to thermal, hydro power generation, transmission and distribution.
It is also responsible for the administration of India's Electricity Act (2003), the Energy Conservation Act (2001) and to undertake such amendments to
these Acts, as and when necessary, in conformity with the Indian government's policy objectives.[115]
Electricity is a concurrent list subject at Entry 38 in List III of the seventh Schedule of the Constitution of India. In India's federal governance structure,
this means that both the central government and India's state governments are involved in establishing policy and laws for its electricity sector. This
principle motivates central government of India and individual state governments to enter into memorandum of understanding to help expedite projects
and reform electricity sector in respective state.[116]
Trading
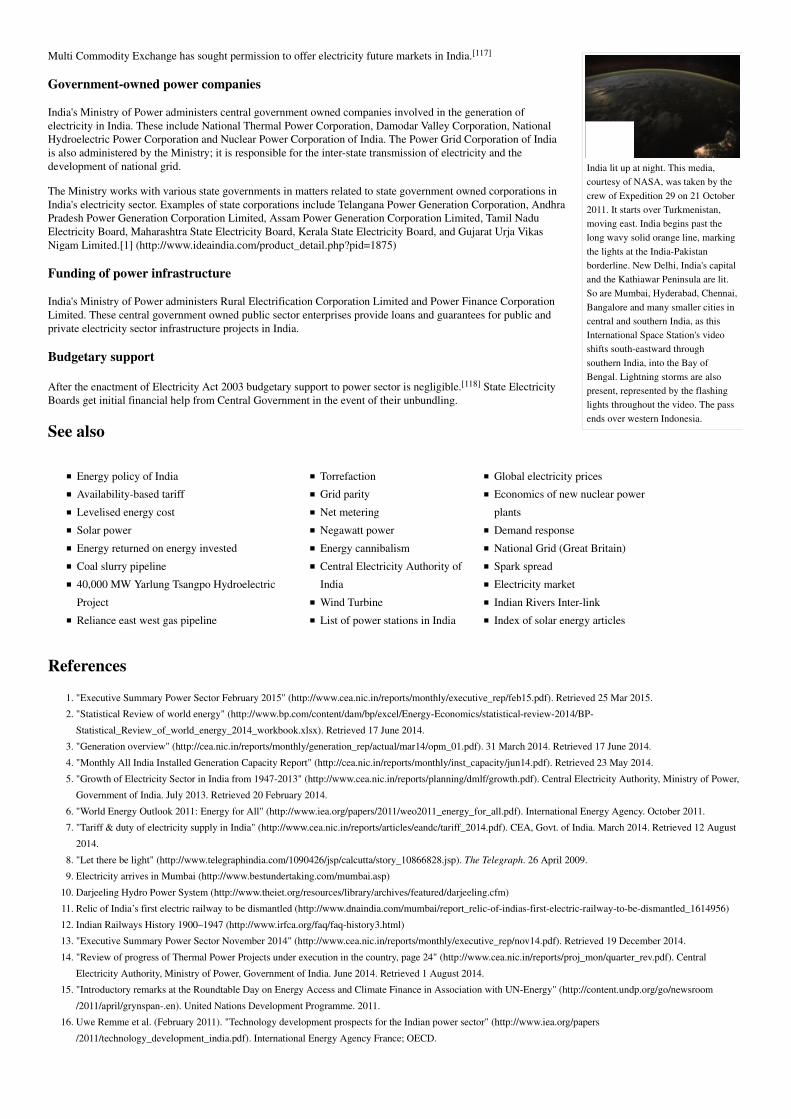
India lit up at night. This media,
courtesy of NASA, was taken by the
crew of Expedition 29 on 21 October
2011. It starts over Turkmenistan,
moving east. India begins past the
long wavy solid orange line, marking
the lights at the India-Pakistan
borderline. New Delhi, India's capital
and the Kathiawar Peninsula are lit.
So are Mumbai, Hyderabad, Chennai,
Bangalore and many smaller cities in
central and southern India, as this
International Space Station's video
shifts south-eastward through
southern India, into the Bay of
Bengal. Lightning storms are also
present, represented by the flashing
lights throughout the video. The pass
ends over western Indonesia.
Multi Commodity Exchange has sought permission to offer electricity future markets in India.[117]
Government-owned power companies
India's Ministry of Power administers central government owned companies involved in the generation of
electricity in India. These include National Thermal Power Corporation, Damodar Valley Corporation, National
Hydroelectric Power Corporation and Nuclear Power Corporation of India. The Power Grid Corporation of India
is also administered by the Ministry; it is responsible for the inter-state transmission of electricity and the
development of national grid.
The Ministry works with various state governments in matters related to state government owned corporations in
India's electricity sector. Examples of state corporations include Telangana Power Generation Corporation, Andhra
Pradesh Power Generation Corporation Limited, Assam Power Generation Corporation Limited, Tamil Nadu
Electricity Board, Maharashtra State Electricity Board, Kerala State Electricity Board, and Gujarat Urja Vikas
Nigam Limited.[1] (http://www.ideaindia.com/product_detail.php?pid=1875)
Funding of power infrastructure
India's Ministry of Power administers Rural Electrification Corporation Limited and Power Finance Corporation
Limited. These central government owned public sector enterprises provide loans and guarantees for public and
private electricity sector infrastructure projects in India.
Budgetary support
After the enactment of Electricity Act 2003 budgetary support to power sector is negligible.[118] State Electricity
Boards get initial financial help from Central Government in the event of their unbundling.
See also
Energy policy of India
Availability-based tariff
Levelised energy cost
Solar power
Energy returned on energy invested
Coal slurry pipeline
40,000 MW Yarlung Tsangpo Hydroelectric
Project
Reliance east west gas pipeline
Torrefaction
Grid parity
Net metering
Negawatt power
Energy cannibalism
Central Electricity Authority of
India
Wind Turbine
List of power stations in India
Global electricity prices
Economics of new nuclear power
plants
Demand response
National Grid (Great Britain)
Spark spread
Electricity market
Indian Rivers Inter-link
Index of solar energy articles
References
"Executive Summary Power Sector February 2015" (http://www.cea.nic.in/reports/monthly/executive_rep/feb15.pdf). Retrieved 25 Mar 2015.1.
"Statistical Review of world energy" (http://www.bp.com/content/dam/bp/excel/Energy-Economics/statistical-review-2014/BP-
Statistical_Review_of_world_energy_2014_workbook.xlsx). Retrieved 17 June 2014.
2.
"Generation overview" (http://cea.nic.in/reports/monthly/generation_rep/actual/mar14/opm_01.pdf). 31 March 2014. Retrieved 17 June 2014.3.
"Monthly All India Installed Generation Capacity Report" (http://cea.nic.in/reports/monthly/inst_capacity/jun14.pdf). Retrieved 23 May 2014.4.
"Growth of Electricity Sector in India from 1947-2013" (http://www.cea.nic.in/reports/planning/dmlf/growth.pdf). Central Electricity Authority, Ministry of Power,
Government of India. July 2013. Retrieved 20 February 2014.
5.
"World Energy Outlook 2011: Energy for All" (http://www.iea.org/papers/2011/weo2011_energy_for_all.pdf). International Energy Agency. October 2011.6.
"Tariff & duty of electricity supply in India" (http://www.cea.nic.in/reports/articles/eandc/tariff_2014.pdf). CEA, Govt. of India. March 2014. Retrieved 12 August
2014.
7.
"Let there be light" (http://www.telegraphindia.com/1090426/jsp/calcutta/story_10866828.jsp). The Telegraph. 26 April 2009.8.
Electricity arrives in Mumbai (http://www.bestundertaking.com/mumbai.asp)9.
Darjeeling Hydro Power System (http://www.theiet.org/resources/library/archives/featured/darjeeling.cfm)10.
Relic of India’s first electric railway to be dismantled (http://www.dnaindia.com/mumbai/report_relic-of-indias-first-electric-railway-to-be-dismantled_1614956)11.
Indian Railways History 1900–1947 (http://www.irfca.org/faq/faq-history3.html)12.
"Executive Summary Power Sector November 2014" (http://www.cea.nic.in/reports/monthly/executive_rep/nov14.pdf). Retrieved 19 December 2014.13.
"Review of progress of Thermal Power Projects under execution in the country, page 24" (http://www.cea.nic.in/reports/proj_mon/quarter_rev.pdf). Central
Electricity Authority, Ministry of Power, Government of India. June 2014. Retrieved 1 August 2014.
14.
"Introductory remarks at the Roundtable Day on Energy Access and Climate Finance in Association with UN-Energy" (http://content.undp.org/go/newsroom
/2011/april/grynspan-.en). United Nations Development Programme. 2011.
15.
Uwe Remme et al. (February 2011). "Technology development prospects for the Indian power sector" (http://www.iea.org/papers
/2011/technology_development_india.pdf). International Energy Agency France; OECD.
16.

"Analysis of the energy trends in the European Union & Asia to 2030" (http://www.eeas.europa.eu/energy/events/asem_energy_2009
/eu_asia_energy_trends_en.pdf). Centre for Energy-Environment Resources Development, Thailand. January 2009.
17.
The Partnership for Clean Indoor Air – Sierra Club (http://www.pciaonline.org/sierra-club). Pciaonline.org. Retrieved on 13 January 2012.18.
Atmanand et al. (2009). "Energy and Sustainable Development-An Indian Perspective" (http://www.waset.org/journals/waset/v54/v54-24.pdf). World Academy of
Science.
19.
Ganguly et al. (2001). "INDOOR AIR POLLUTION IN INDIA – A MAJOR ENVIRONMENTAL AND PUBLIC HEALTH CONCERN" (http://icmr.nic.in
/bumay01.pdf). Indian Council of Medical Research, New Delhi.
20.
"The Asian Brown Cloud: Climate and Other Environmental Impacts" (http://www.rrcap.unep.org/issues/air/impactstudy/Executive%20Summary.pdf). United
Nations Environmental Programme. 2002.
21.
"Indoor air pollution and household energy" (http://www.who.int/heli/risks/indoorair/indoorair/en/index.html). WHO and UNEP. 2011.22.
"Green stoves to replace chullahs" (http://articles.timesofindia.indiatimes.com/2009-12-03/india/28096828_1_biomass-climate-renewable-energy-sources). The
Times of India. 3 December 2009.
23.
"Status of Sewage Treatment in India" (http://www.cpcb.nic.in/newitems/12.pdf). Central Pollution Control Board, Ministry of Environment & Forests, Govt of
India. 2005.
24.
"Evaluation of Operation And Maintenance Of Sewage Treatment Plants in India-2007" (http://www.cpcb.nic.in/upload/NewItems
/NewItem_99_NewItem_99_5.pdf). Central Pollution Control Board, Ministry of Environment & Forests. 2008.
25.
"Load Generation Balance Report 2014-15" (http://www.cea.nic.in/reports/yearly/lgbr_report.pdf). 30 May 2014. Retrieved 18 July 2014.26.
"Gujarat govt sets aside Tata's demand for power price hike" (http://articles.timesofindia.indiatimes.com/2011-12-18/ahmedabad/30530713_1_power-surplus-
power-purchase-agreement-tata-power). The Times of India. 18 December 2011.
27.
Rural electrification in India (http://www.electricitypolicy.org.uk/pubs/wp/eprg0730.pdf)28.
Revkin, Andrew C. (9 April 2008). "Money for India's ‘Ultra Mega' Coal Plants Approved" (http://dotearth.blogs.nytimes.com/2008/04/09/money-for-indias-ultra-
mega-coal-plants-approved/). The New York Times. Retrieved 1 May 2010.
29.
The Electricity Access Database (http://www.iea.org/weo/database_electricity/electricity_access_database.htm). iea.org30.
"Housing condition in India: Household amenities and other characteristics (July – September 2002)" (http://www.mospi.nic.in
/nss_58round_press_note_6june05.htm). Government of India.
31.
"Report on 17th electric power survey of India" (http://powermin.gov.in/generation/pdf/17th%20EPS.pdf). Central Electricity Authority, Ministry of Power. 2007.32.
"Powering India: The Road to 2017" (http://www.mckinsey.com/locations/india/mckinseyonindia/pdf/Power_Report_Exec_Summary.pdf). McKinsey. 2008.33.
Yoginder Alagh, Former Minister of Power and Science Technology of India (2011). "Transmission and Distribution of Electricity in India Regulation, Investment
and Efficiency" (http://www.oecd.org/dataoecd/35/33/46235043.pdf). OECD.
34.
"India struggles with power theft" (http://news.bbc.co.uk/2/hi/business/4802248.stm). BBC. 15 March 2006. Retrieved 3 January 2010.35.
"Reforming the Power Sector: Controlling Electricity Theft and Improving Revenue" (http://rru.worldbank.org/documents/publicpolicyjournal
/272bhatia_Gulati.pdf) (PDF). The World Bank.
36.
Range, Jackie. (28 October 2008) India Faulted for Failure to Improve Power Supply (http://online.wsj.com/article
/SB122513218298172749.html?mod=googlenews_wsj). Online.wsj.com. Retrieved on 13 January 2012.
37.
"For India, a Power Failure Looms" (http://online.wsj.com/article/SB10001424052970203550304577136283175793516.html). The Wall Street Journal. 2 January
2012.
38.
"‘Power-full’ Gujarat gives 24-hour electricity" (http://articles.timesofindia.indiatimes.com/2013-03-04/india/37436402_1_gujarat-energy-minister-gujarat-
model-surplus-power). Times of India. 4 May 2012.
39.
"Madhya Pradesh goes the Gujarat way for power" (http://www.business-standard.com/article/economy-policy/madhya-pradesh-goes-the-gujarat-way-for-power-
113051601191_1.html). Business Standard. 16 May 2013.
40.
http://www.cea.nic.in/reports/monthly/dpd_div_rep/village_electrification.pdf41.
"Rajya Sabha - Starred Question No. 241" (http://powermin.gov.in/loksabhatable/pdf/Raj_27082013_Eng.pdf). Ministry of Power, Govt. of India. 29 August 2013.
Retrieved 20 February 2014.
42.
Basistha Raj Adhikari (July 2009). "Tehri Dam: An Engineering Marvel" (http://www.nepjol.info/index.php/HN/article/view/2481/2214). Hydro Nepal 5.
doi:10.3126/hn.v5i0.2481 (https://dx.doi.org/10.3126%2Fhn.v5i0.2481).
43.
"Annual Report 2010-2011" (http://www.pfcindia.com/writereaddata/userfiles/file/Annual%20reports/ann_rpt1011.pdf). Power Finance Corporation Ltd, India – A
Govt of India entity. 2011.
44.
"Boom time for power equipment companies" (http://www.business-standard.com/india/news/boom-time-for-power-equipment-companies/368827/). Business
Standard. September 2009.
45.
"ALL INDIA REGIONWISE GENERATING INSTALLED CAPACITY OF POWER" (http://www.cea.nic.in/reports/monthly/executive_rep/oct13/contents.pdf).
Central Electricity Authority, Ministry of Power, Government of India. October 2013.
46.
"Ministry of Power" (http://www.powermin.nic.in/JSP_SERVLETS/internal.jsp). Powermin.nic.in. 31 October 2012. Retrieved 18 December 2012.47.
"Load Generation and Balance Report" (http://www.cea.nic.in/reports/yearly/lgbr_report.pdf). Central Electricity Authority, Ministry of Power, Government of
India. 2012.
48.
Ravi Krishnan (March 2010). "Power Report – India: Can she make the most of her opportunities?" (http://www.powerengineeringint.com/index.html). Power
Engineering International (PennWell): 16–20.
49.
"Executive summary of month of February 2014" (http://www.cea.nic.in/reports/monthly/executive_rep/feb14.pdf). Central Electricity Authority, Ministry of
Power, Government of India. February 2014. Retrieved 21 March 2014.
50.
"Private firms overtake government enterprises in power production, adds about 84% of the target" (http://articles.economictimes.indiatimes.com/2011-07-27
/news/29820911_1_capacity-addition-private-sector-power-sector). The Economic Times. 27 July 2011.
51.
"Key World Energy Statistics" (http://www.iea.org/publications/freepublications/publication/KeyWorld2013.pdf). International Energy Agency. International
Energy Agency. 2013. Retrieved 18 June 2014.
52.

"Economics of Coal and Gas Based Energy" (http://www.thirdwavesolutions.in/index.php/reports-and-opinions/2-uncategorised/14-coal-gas-indian-perspective).
Third Wave Solutions. 2012.
53.
"Statistical Review of world energy 2014 workbook" (http://www.bp.com/content/dam/bp/excel/Energy-Economics/statistical-review-2014/BP-
Statistical_Review_of_world_energy_2014_workbook.xlsx). Retrieved 17 June 2014.
54.
"China Bans Use of Coal With High Ash or Sulfur to Fight Smog" (http://www.bloomberg.com/news/2014-09-16/china-bans-use-of-coal-with-high-ash-or-sulfur-
to-combat-smog.html). Retrieved 17 September 2014.
55.
"TECHNICAL EIA GUIDANCE MANUAL FOR THERMAL POWER PLANTS" (http://moef.nic.in/Manuals/Thermal%20Power.pdf). Ministry of Environment
and Forests, Government of India. 2009.
56.
"Plant load factor for the gas based power stations, 2013-14, CEA report" (http://www.cea.nic.in/reports/monthly/generation_rep/actual/mar14/opm_17.pdf).
Retrieved 25 August 2014.
57.
"Chinese firm plans Thar coal mining in Pakistan" (http://www.steelguru.com/raw_material_news/Chinese_firm_plans_Thar_coal_mining_in_October
/273972.html). Retrieved 25 August 2014.
58.
"GAIL, Coal India in pact to expand Dankuni gas project" (http://www.thehindubusinessline.in/2004/02/15/stories/2004021501330200.htm). Retrieved 25 August
2014.
59.
"China’s synthetic natural gas revolution" (http://people.duke.edu/~cy42/SNG.pdf). Retrieved 2014-08-06.60.
"Conversion of Coal to Substitute Natural Gas (SNG)" (http://www.hceco.com/HCEI105001.pdf). Retrieved 2014-08-06.61.
Hydropower Development in India: A Sector Assessment62.
"Pumped storage hydro power plant" (http://npti.in/Download/Hydro
/Pumped%20Storage%20Hydro%20Power%20Plant,%20Electrical%20India,%20Nov,%202013.pdf). Retrieved 2014-08-27.
63.
"NPCIL Annual Report, 2010–2011" (http://www.npcil.nic.in/main/CompanyProfile.aspx). Nuclear Power Corporation of India Limited. 2011.64.
"NPCIL Annual Report, 2009–2010" (http://www.npcil.nic.in/main/CompanyProfile.aspx). Nuclear Power Corporation of India Limited. 2010.65.
"India Steps Up Uranium Exploration After Record Discovery" (http://online.wsj.com/article/SB10001424053111903461104576459323026021378.html). The Wall
Street Journal. 21 July 2011.
66.
http://www.world-nuclear.org/info/Country-Profiles/Countries-G-N/India/67.
Winds of change come to country plagued by power blackouts (http://www.guardian.co.uk/environment/2008/dec/30/renewable-energy-alternative-energy-wind).
Guardian. 30 December 2008. Retrieved on 13 January 2012.
68.
"Physical Progress (Achievements)" (http://www.mnre.gov.in/mission-and-vision-2/achievements/). Ministry of New and Renewable Energy, Govt. of India. 31
January 2014. Retrieved 21 February 2014.
69.
"Power Generation from Various Renewable Energy Sources" (http://pib.nic.in/newsite/pmreleases.aspx?mincode=28). Ministry of New and Renewable Energy. 9
December 2013. Retrieved 10 January 2014.
70.
"NEW & RENEWABLE ENERGY, Cumulative deployment of various Renewable Energy Systems as on 31/12/2012" (http://www.mnre.gov.in/mission-
and-vision-2/achievements/). Ministry of New and Renewable Energy, Government of India. December 2012.
71.
"Year End Review – 2011" (http://pib.nic.in/newsite/pmreleases.aspx?mincode=28). Press Information Bureau, Government of India. December 2011.72.
"Solar" (http://www.mnre.gov.in/schemes/grid-connected/solar/). Ministry of New and Renewable Energy, Govt. of India. Retrieved 21 February 2014.73.
Sethi, Nitin (18 November 2009). "India targets 1,000 MW solar power in 2013" (http://articles.timesofindia.indiatimes.com/2009-11-18/india/28064964_1_solar-
power-solar-mission-solar-lighting-systems). Times of India.
74.
"Gujarat Solar Power Transmission Project: India" (http://pid.adb.org/pid/LoanView.htm?projNo=44431&seqNo=01&typeCd=3). Asian Development Bank.
September 2011.
75.
Consumer financing programme for solar home systems in southern India (http://www.energyglobe.info/geg/frontend_en/view.php?MENUEID=138).
Energyglobe.info. Retrieved on 13 January 2012.
76.
UNEP wins Energy Globe award (http://www.renewable-energy-world.com/articles/print_screen.cfm?ARTICLE_ID=289927). Renewable-energy-world.com.
Retrieved on 13 January 2012.
77.
"Waste lands atlas of India, 2011" (http://dolr.nic.in/dolr/wasteland_atlas.asp). Retrieved 30 May 2014.78.
"Price Quotes" (http://www.webcitation.org/6QcjhW4C9). http://pv.energytrend.com/. Archived from the original (http://pv.energytrend.com/pricequotes.html) on
26 June 2014. Retrieved 26 June 2014.
79.
Population pyramids of India from 1950 to 2100 (http://populationpyramid.net/india/)80.
India’s Building A Huge Floating Solar Farm (http://indianpowersector.com/home/2014/07/indias-building-a-huge-floating-solar-farm/)81.
India - Land and Water Resources at a glance, CWC (accessdate 13 July 2014) (http://www.cwc.nic.in/main/webpages/statistics.html#2)82.
National perspectives for water resources development (accessdate 13 July 2014) (http://nwda.gov.in/writereaddata/linkimages/2175421921.pdf)83.
Brown, Lester R. (19 November 2013). "India's dangerous 'food bubble' " (http://www.earth-policy.org/plan_b_updates/2013/update119). Los Angeles Times.
Archived from the original (http://articles.latimes.com/2013/nov/29/opinion/la-oe-brown-india-food-bubble-famine-20131129) on 4 December 2013. Retrieved
13 July 2014.
84.
"World Wind Energy Report 2010" (http://www.wwindea.org/home/images/stories/pdfs/worldwindenergyreport2010_s.pdf) (PDF). Report. World Wind Energy
Association. February 2011.
85.
"Facts & Figures, India" (http://www.windpowerindia.com/index.php?option=com_content&view=article&id=3:facts-a-figures&catid=5:facts-a-figures). Wind
Power India. 2011.
86.
State-wise Wind Power Installed Capacity In India (http://web.archive.org/web/20080731085449/http://www.windpowerindia.com/statstate.html).
windpowerindia.com
87.
India to add 6,000 mW wind power by 2012; but below target (http://www.business-standard.com/india/storypage.php?tp=on&autono=44562). Business-
standard.com. Retrieved on 13 January 2012.
88.
"Biomass for power generation and CHP" (http://www.iea.org/techno/essentials3.pdf). International Energy Agency. 2007.89.
"The upgrading of solid biomasss by means of Torrefaction" (http://www.sari-energy.org/PageFiles/What_We_Do/activities/worldbiofuelsmarkets/Presentations
/BiofuelsShippingStorageLogistics/Michael_Wild.pdf). Retrieved 2014-09-18.
90.

"India, Biofuels Annual 2011" (http://gain.fas.usda.gov/Recent%20GAIN%20Publications/Biofuels%20Annual_New%20Delhi_India_7-1-2011.pdf). United States
Department of Agriculture: Global Agricultural Information Network. July 2011.
91.
Geothermal Energy and its Potential in India | For the Changing Planet (http://greencleanguide.com/2013/07/20/geothermal-energy-and-its-potential-in-india/).
Greencleanguide.com (20 July 2013). Retrieved on 6 December 2013.
92.
"Geothermal fields of India" (http://www.portal.gsi.gov.in/portal/page?_pageid=127,699645&_dad=portal&_schema=PORTAL). Geological Survey of India. 2001.93.
"Development of 3.75 MW Durgaduani Mini Tidal Power Project, Sunderbans, West Bengal" (http://www.nhpc.gov.in/english/Scripts/RDgeothermal.aspx). NHPC
Limited – A Government of India Enterprise. December 2011.
94.
"Tidal Energy in India" (http://www.eai.in/ref/ae/oce/oce.html). Energy Alternatives India. 2008.95.
"Survey of Energy Resources" (http://www.worldenergy.org/documents/otec_country_notes.pdf). World Energy Council. 2007. pp. 575–576.96.
"Progress of Susstations capacity in the Country up to June 2014" (http://www.cea.nic.in/reports/proj_mon/pspm/growth_sub.pdf). Central Electricity Authority,
GoI. 2014.
97.
"Progress of Transmission lines in the Country up to June 2014" (http://www.cea.nic.in/reports/proj_mon/pspm/growth_trans.pdf). Central Electricity Authority,
GoI. 2014.
98.
"Daily report of power situation, Ministry of Power, GoI," (http://www.nldc.in/2013-03-12-10-34-42/daily-report). Retrieved 17 February 2013.99.
"See Reports section, National load dispatch centre, Ministry of Power, GoI," (http://www.nldc.in/). Retrieved 17 February 2013.100.
Chris Gascoyne and Alexis Aik (February 2011). "Unconventional Gas and Implications for the LNG Market FACTS Global Energy" (http://www.nbr.org
/downloads/pdfs/eta/PES_2011_Facts_Global_Energy.pdf). Pacific Energy Summit.
101.
Amol Sharma and Megha Bahree (1 July 2012). "Grinding Energy Shortage Takes Toll on India's Growth" (http://online.wsj.com/article
/SB10001424052702304331204577352232515290226.html). The Wall Street Journal.
102.
Samir K Srivastava, Consumers need quality power, The Economic Times, 10 May 2007, pp. 12 (Available at: http://m.economictimes.com/PDAET/articleshow
/msid-2024426,curpg-1.cms).
103.
"Outstanding dues of power utilities to CPSUs up to July 2014" (http://www.cea.nic.in/reports/articles/eandc/outstandingdues_cpsu.pdf). Central Electricity
Authority, GoI. 2014.
104.
"Energy-efficient buildings – a business case for India? An analysis of incremental costs for four building projects of the Energy-Efficient Homes Programme"
(http://www.adelphi.de/en/publications/dok/43509.php?pid=1971).
105.
"Power Sector in India: White paper on Implementation Challenges and Opportunities" (http://www.kpmg.de/docs/PowerSector_2010.pdf). KPMG. January 2010.106.
"CO2 EMISSIONS FROM FUEL COMBUSTION HIGHLIGHTS, 2011 Edition" (http://www.iea.org/co2highlights/co2highlights.pdf). International Energy
Agency, France. 2011.
107.
"Natural Gas – Proved Reserves" (https://www.cia.gov/library/publications/the-world-factbook/rankorder/2179rank.html). CIA World Factbook. Retrieved January
2012.
108.
"Country Analysis Brief: India" (http://www.eia.gov/countries/country-data.cfm?fips=IN). U.S. Energy Information Administration. 2011.109.
"India starts testing shale-gas plays" (http://www.ogj.com/articles/print/volume-109/issue-49/drilling-production/india-starts-testing-p1.html). Oil and Gas Journal.
5 December 2011.
110.
"Indian Petroleum & Natural Gas statistics" (http://petroleum.nic.in/docs/pngstat.pdf). Retrieved 25 April 2014.111.
"All India coal fired stations performance (2013-14)" (http://www.cea.nic.in/reports/monthly/generation_rep/tentative/mar14/opm_11.pdf). Retrieved 27 May 2014.112.
"Madhya Pradesh plans India’s largest Solar Power Plant)" (http://indianpowersector.com/home/2014/08/madhya-pradesh-plans-indias-largest-solar-power-plant/).
Retrieved 3 August 2014.
113.
"Solar power bidders accept Rs 6.49/unit offer from AP" (http://www.thehindubusinessline.com/news/states/solar-power-bidders-accept-rs-649unit-offer-from-ap
/article4873499.ece). Retrieved 27 May 2014.
114.
"Ministry of Power" (http://www.powermin.nic.in/). Government of India. Retrieved December 2011.115.
"REFORM PROGRAMME OF GUJARAT" (http://www.powermin.nic.in/acts_notification/gujarat.htm). Ministry of Power, Government of India. January 2001.116.
"MCX move to launch electricity future faces legal hurdle" (http://www.financialexpress.com/news/mcx-move-to-launch-electricity-future-faces-legal-hurdle
/401592/). The Financial Express.
117.
‘No proposal to bring down power price’ (http://www.thehindu.com/todays-paper/tp-national/tp-kerala/no-proposal-to-bring-down-power-price/article6205519.ece)
- Dr D Shina
118.
External links
Indianpowersector.com - Latest news about Indian Power Sector at one place (http://indianpowersector.com/home/)
National electricity Plan - 2012, CEA, GoI (http://www.cea.nic.in/reports/powersystems/nep2012/nep13.pdf)
Electricity grid maps of southern region (http://www.srpc.kar.nic.in/html/grid_map.html)
Macro Patterns in the Use of Traditional Biomass Fuels – A Stanford/TERI report on energy sector and human history (http://iis-db.stanford.edu
/evnts/3920/VICTOR_ppr.pdf)
India's Energy Policy and Electricity Production (http://www.nbr.org/research/activity.aspx?id=181)
Electricity industry in Public Sector in India- Dr M Sarngadharan and Dr Shina Radhakrishnan (http://www.ideaindia.com
/product_detail.php?pid=1875)
Retrieved from "http://en.wikipedia.org/w/index.php?title=Electricity_sector_in_India&oldid=653568094"
Categories: Electric power in India

This page was last modified on 26 March 2015, at 05:57.
Text is available under the Creative Commons Attribution-ShareAlike License; additional terms may apply. By using this site, you agree to the
Terms of Use and Privacy Policy. Wikipedia® is a registered trademark of the Wikimedia Foundation, Inc., a non-profit organization.