
Electrical Power and Energy Systems power... · Flower Pollination Algorithm and Loss Sensitivity...
8
Flower Pollination Algorithm and Loss Sensitivity Factors for optimal sizing and placement of capacitors in radial distribution systems A.Y. Abdelaziz a , E.S. Ali b,⇑ , S.M. Abd Elazim b a Electric Power and Machine Department, Faculty of Engineering, Ain Shams University, Cairo, Egypt b Electric Power and Machine Department, Faculty of Engineering, Zagazig University, Zagazig, Egypt article info Article history: Received 30 July 2014 Received in revised form 29 September 2015 Accepted 17 November 2015 Keywords: Flower Pollination Algorithm Power systems Power losses Optimal capacitor locations Loss Sensitivity Factors Distribution systems abstract In this paper, Flower Pollination Algorithm (FPA) is proposed for optimal allocations and sizing of capac- itors in various distribution systems. First the most candidate buses for installing capacitors are sug- gested using Loss Sensitivity Factors (LSF). Then the proposed FPA is employed to deduce the locations of capacitors and their sizing from the elected buses. The proposed algorithm is tested on 10, 33 and 69 bus radial distribution systems. The obtained results via the proposed algorithm are compared with others to highlight the benefits of the proposed algorithm in reducing total cost and maximizing the net saving. Moreover, the results are introduced to verify the effectiveness of the proposed algorithm to enhance the voltage profiles for various distribution systems. Ó 2015 Elsevier Ltd. All rights reserved. Introduction In distribution networks, reactive power flows cause high power losses, high voltage drop and low power factor. These effects can be reduced by optimally installing of shunt capacitors [1]. Compensation of reactive power presents the basic role in power system planning to provide compatible locations of the compensa- tion apparatus to guarantee the minimum cost of compensation with suitable voltage profiles [2]. Many techniques and optimization algorithms have been addressed in literature to deal with the problem of locations and sizing of capacitors in distribution systems. Genetic Algorithm (GA) [2], Particle Swarm Optimization (PSO) [3,4], Firefly Algorithm (FA) [5], Memetic Algorithm [6], Differential Evolutionary (DE) [7– 9], Evolutionary Algorithm (EA) [10,11], Fuzzy Logic [12–15], Hybrid Algorithm [16], Heuristic Algorithm [17–19], Cuckoo Search Algorithm [20], Plant Growth Simulation Algorithm (PGSA) [21–23], Harmony Search (HS) [24], Ant Colony Optimization (ACO) [25], Mixed Integer Non Linear Programming (MINLP) [26], Artificial Bee Colony (ABC) [27], Teaching Learning Based Opti- mization (TLBO) [28] and Direct Search Algorithm (DSA) [29] are introduced as a solution to capacitor placement problem. However, these algorithms appear to be effective to deal with this problem, they may not guarantee reaching the optimal cost due to many reasons. In [4,5,10,20–22,24], the values of capacitors are treated as a continuous value. Moreover, the suggested objective function in [6,7,23,29] is so conventional and doesn’t take all costs in con- sideration. The studies in [3,4,6,9,13,16,17,19,22–24,26] are lim- ited to small scale system. Also, some use large number of buses to compensate [2,11,24]. On the other hand, the mentioned tech- niques have their own defects and have many parameters to assign that lead to large processing time [8,12–15,27]. Recently, the Flower Pollination Algorithm (FPA) is proposed in this paper to deal with the problem of optimal capacitor placement. It has only one key parameter p (switch probability) which makes the algo- rithm easier to implement and faster to reach optimum solution. Moreover, this transferring switch between local and global polli- nation can guarantee escaping from local minimum solution. In addition, it is clear from the literature survey that the application of FPA to solve the problem of capacitor location has not been dis- cussed. This encourages us to adopt FPA to deal with this problem. FPA technique is introduced in this paper in order to minimize the investment cost of new compensation sources and the active power losses with mitigating the voltage profiles for different dis- tribution systems. The locations of the shunt capacitors problem are obtained at first by examinations the buses of higher LSF. Then FPA is introduced to decide the optimal locations and sizing of capacitors from specified buses. The effectiveness of the proposed http://dx.doi.org/10.1016/j.ijepes.2015.11.059 0142-0615/Ó 2015 Elsevier Ltd. All rights reserved. ⇑ Corresponding author. E-mail addresses: [email protected] (A.Y. Abdelaziz), [email protected] (E.S. Ali), [email protected] (S.M. Abd Elazim). Electrical Power and Energy Systems 78 (2016) 207–214 Contents lists available at ScienceDirect Electrical Power and Energy Systems journal homepage: www.elsevier.com/locate/ijepes
Transcript of Electrical Power and Energy Systems power... · Flower Pollination Algorithm and Loss Sensitivity...

Electrical Power and Energy Systems 78 (2016) 207–214
Contents lists available at ScienceDirect
Electrical Power and Energy Systems
journal homepage: www.elsevier .com/locate / i jepes
Flower Pollination Algorithm and Loss Sensitivity Factors for optimalsizing and placement of capacitors in radial distribution systems
http://dx.doi.org/10.1016/j.ijepes.2015.11.0590142-0615/� 2015 Elsevier Ltd. All rights reserved.
⇑ Corresponding author.E-mail addresses: [email protected] (A.Y. Abdelaziz),
[email protected] (E.S. Ali), [email protected] (S.M. AbdElazim).
A.Y. Abdelaziz a, E.S. Ali b,⇑, S.M. Abd Elazim b
a Electric Power and Machine Department, Faculty of Engineering, Ain Shams University, Cairo, Egyptb Electric Power and Machine Department, Faculty of Engineering, Zagazig University, Zagazig, Egypt
a r t i c l e i n f o a b s t r a c t
Article history:Received 30 July 2014Received in revised form 29 September 2015Accepted 17 November 2015
Keywords:Flower Pollination AlgorithmPower systemsPower lossesOptimal capacitor locationsLoss Sensitivity FactorsDistribution systems
In this paper, Flower Pollination Algorithm (FPA) is proposed for optimal allocations and sizing of capac-itors in various distribution systems. First the most candidate buses for installing capacitors are sug-gested using Loss Sensitivity Factors (LSF). Then the proposed FPA is employed to deduce the locationsof capacitors and their sizing from the elected buses. The proposed algorithm is tested on 10, 33 and69 bus radial distribution systems. The obtained results via the proposed algorithm are compared withothers to highlight the benefits of the proposed algorithm in reducing total cost and maximizing thenet saving. Moreover, the results are introduced to verify the effectiveness of the proposed algorithmto enhance the voltage profiles for various distribution systems.
� 2015 Elsevier Ltd. All rights reserved.
Introduction
In distribution networks, reactive power flows cause highpower losses, high voltage drop and low power factor. These effectscan be reduced by optimally installing of shunt capacitors [1].Compensation of reactive power presents the basic role in powersystem planning to provide compatible locations of the compensa-tion apparatus to guarantee the minimum cost of compensationwith suitable voltage profiles [2].
Many techniques and optimization algorithms have beenaddressed in literature to deal with the problem of locations andsizing of capacitors in distribution systems. Genetic Algorithm(GA) [2], Particle Swarm Optimization (PSO) [3,4], Firefly Algorithm(FA) [5], Memetic Algorithm [6], Differential Evolutionary (DE) [7–9], Evolutionary Algorithm (EA) [10,11], Fuzzy Logic [12–15],Hybrid Algorithm [16], Heuristic Algorithm [17–19], CuckooSearch Algorithm [20], Plant Growth Simulation Algorithm (PGSA)[21–23], Harmony Search (HS) [24], Ant Colony Optimization(ACO) [25], Mixed Integer Non Linear Programming (MINLP) [26],Artificial Bee Colony (ABC) [27], Teaching Learning Based Opti-mization (TLBO) [28] and Direct Search Algorithm (DSA) [29] areintroduced as a solution to capacitor placement problem. However,
these algorithms appear to be effective to deal with this problem,they may not guarantee reaching the optimal cost due to manyreasons. In [4,5,10,20–22,24], the values of capacitors are treatedas a continuous value. Moreover, the suggested objective functionin [6,7,23,29] is so conventional and doesn’t take all costs in con-sideration. The studies in [3,4,6,9,13,16,17,19,22–24,26] are lim-ited to small scale system. Also, some use large number of busesto compensate [2,11,24]. On the other hand, the mentioned tech-niques have their own defects and have many parameters to assignthat lead to large processing time [8,12–15,27]. Recently, theFlower Pollination Algorithm (FPA) is proposed in this paper todeal with the problem of optimal capacitor placement. It has onlyone key parameter p (switch probability) which makes the algo-rithm easier to implement and faster to reach optimum solution.Moreover, this transferring switch between local and global polli-nation can guarantee escaping from local minimum solution. Inaddition, it is clear from the literature survey that the applicationof FPA to solve the problem of capacitor location has not been dis-cussed. This encourages us to adopt FPA to deal with this problem.
FPA technique is introduced in this paper in order to minimizethe investment cost of new compensation sources and the activepower losses with mitigating the voltage profiles for different dis-tribution systems. The locations of the shunt capacitors problemare obtained at first by examinations the buses of higher LSF. ThenFPA is introduced to decide the optimal locations and sizing ofcapacitors from specified buses. The effectiveness of the proposed
Nomenclature
Pk, Qk the total effective active and reactive power suppliedbehind the bus ‘k’
Vk the magnitude of voltage at bus kRik, Xik the resistance and reactance of transmission line be-
tween bus ‘i’ and ‘k’Vi the magnitude of voltage at bus ixtl the pollen lg* the current best solution found at the current genera-
tionc scaling factorCðkÞ the standard gamma functionp switch probabilityKP the cost per kW hPLoss the total power losses after compensationT the time in hoursCB the number of compensated busesKC the cost per kVArKI the cost per installationQCi the value of installed reactive power in kVArPSwing the active power of swing busQSwing the reactive power of swing busL the number of transmission line in a distribution systemPd(q) the demand of active power at bus qQd(q) the demand of reactive power at bus qN the number of total busesVmin the minimum voltage at bus iVmax the maximum voltage at bus i
PF Power FactorPFmin the minimum power factorPFmax the maximum power factorPFsys the power factor at swing busQCmin the minimum injected reactive power in kVArQCmax the maximum injected reactive power in kVAr
List of abbreviationsFPA Flower Pollination AlgorithmLSF Loss Sensitivity FactorsSA Simulated AnnealingTS Tabu SearchGA Genetic AlgorithmPSO Particle Swarm OptimizationPGSA Plant Growth Simulation AlgorithmDSA Direct Search AlgorithmTLBO Teaching Learning Based OptimizationCSA Cuckoo Search AlgorithmABC Artificial Bee ColonyACO Ant Colony OptimizationFA Firefly AlgorithmMINLP Mixed Integer Nonlinear ProgrammingHS Harmony SearchDE–PS Differential Evolution and Pattern SearchGSA Gravitational Search AlgorithmIP Interior Point
208 A.Y. Abdelaziz et al. / Electrical Power and Energy Systems 78 (2016) 207–214
FPA is shown for three distribution systems. The results of the FPAare compared with various techniques to detect its superiority.
Loss Sensitivity Factors
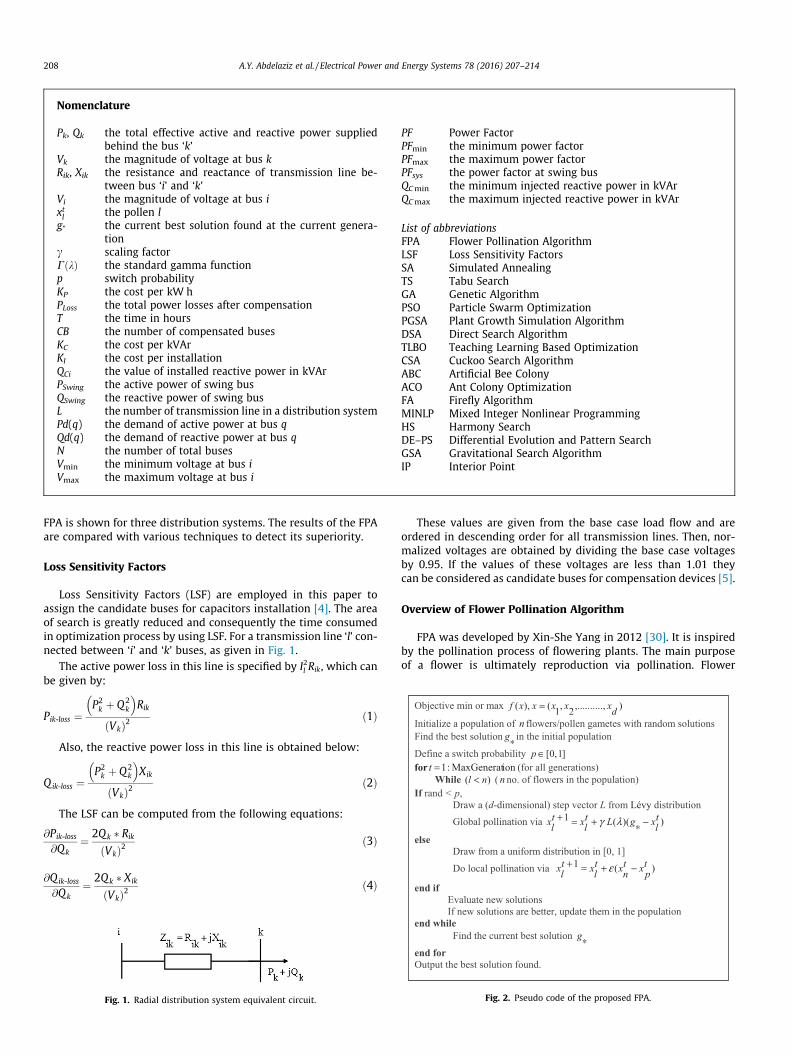
Loss Sensitivity Factors (LSF) are employed in this paper toassign the candidate buses for capacitors installation [4]. The areaof search is greatly reduced and consequently the time consumedin optimization process by using LSF. For a transmission line ‘l’ con-nected between ‘i’ and ‘k’ buses, as given in Fig. 1.
The active power loss in this line is specified by I2l Rik, which canbe given by:
Pik-loss ¼P2k þ Q2
k
� �Rik
Vkð Þ2ð1Þ
Also, the reactive power loss in this line is obtained below:
Qik-loss ¼P2k þ Q2
k
� �Xik
Vkð Þ2ð2Þ
The LSF can be computed from the following equations:
@Pik-loss
@Qk¼ 2Qk � Rik
Vkð Þ2ð3Þ
@Qik-loss
@Qk¼ 2Qk � Xik
Vkð Þ2ð4Þ
Fig. 1. Radial distribution system equivalent circuit.
These values are given from the base case load flow and areordered in descending order for all transmission lines. Then, nor-malized voltages are obtained by dividing the base case voltagesby 0.95. If the values of these voltages are less than 1.01 theycan be considered as candidate buses for compensation devices [5].
Overview of Flower Pollination Algorithm
FPA was developed by Xin-She Yang in 2012 [30]. It is inspiredby the pollination process of flowering plants. The main purposeof a flower is ultimately reproduction via pollination. Flower
Fig. 2. Pseudo code of the proposed FPA.

Table 1The used parameters.
KP = 0.06 $/kW h, 0:90 6 jVij 6 1:05T = 8760 h, 0:9 lagging 6 PFsys 6 1KC = 3 $/kVAr, 50 kVAr 6 QC 6 1500 kVArKI = 1000 $
~
2 3 4 5 6 7 8 9 10 1
Fig. 3. The schematic diagram of the 10 bus system.
Fig. 4. The values of LSF for 10 bus system.
A.Y. Abdelaziz et al. / Electrical Power and Energy Systems 78 (2016) 207–214 209
pollination is typically correlating with the transfer of pollen,which often associated with pollinators such as birds, insects, batsand other animals.
Pollination appears in two major forms: abiotic and biotic. Mostof flowering plants depend on the biotic pollination process. Inwhich the pollen is transferred by pollinators. The rest of pollina-tion follows abiotic form that does not require any pollinators such
Table 2Results for 10 bus system.
Items Un-compensated Compensated
Fuzzyreasoning[12]
PSO
Year 1996 2007Total losses (kW) 783.77 704.883 696.Loss reduction (%) – 10.065 11.1Minimum voltage 0.8375 – –Optimal location and size in kVAr – 4 1050 6
5 1050 56 1950 910 900 10– – –– – –
Total kVAr 4950 3186Annual cost ($/year) 411949.5 389336.5 379,Net saving ($/year) – 22,613 3246% saving – 5.5 7.9Worst losses NA NABest losses NA NAMean losses NA NAVariance NA NAStandard deviation NA NA
Bold items present the result obtained by the proposed algorithm.
as grass [31]. Wind and diffusion help in pollination process ofsuch flowering plants. On the other hand, pollination can beachieved by self-pollination or cross-pollination. Self-pollinationis the pollination of one flower from pollen of the same flower.Cross-pollination is the pollination from pollen of a flower of dif-ferent plants [32].
The objective of flower pollination is the survival of the fittestand the optimal reproduction of plants in terms of numbers as wellas the fittest. This can be considered as an optimization process ofplant species. All of these factors and processes of flower pollina-tion created optimal reproduction of the flowering plants [33].FPA has been adopted in this paper to optimize capacitors alloca-tion problems.
Flower Pollination Algorithm
For FPA, the following four steps are used [34]:
Step 1: Global pollination represented in biotic and cross-pollination processes, as pollen-carrying pollinators fly follow-ing Lévy flight [31].Step 2: Local pollination represented in abiotic and self-pollination as the process does not require any pollinators.Step 3: Flower constancy which can be developed by insects,which is on a par with a reproduction probability that is propor-tional to the similarity of two flowers involved.Step 4: The interaction of local and global pollination is con-trolled by a switch probability p 2 [0,1], lightly biased towardlocal pollination.
The above rules have to be converted into proper updatingequations. For example at the global pollination step, the pollina-tors carry the flower pollen gametes, so the pollen can travel overa long distance. Therefore, global pollination step and flower con-stancy step can be represented by:
xtþ1l ¼ xtl þ cLðkÞ g� � xtl
� � ð5ÞIn fact, LðkÞ the Lévy flights based step size that corresponds to
the strength of the pollination. Since long distances can be coveredusing various distance steps, a Lévy flight can be used to mimic thisbehavior efficiently. That is, L > 0 from a Lévy distribution.
[4] PGSA [21] MINLP [26] DiscretePSO [39]
ProposedFPA
2011 2014 2014 201521 694.93 673.44 701.2 648.777 11.33 14.08 10.53 17.22
0.901 – 0.9002 0.91681174 5 1200 5 400 4 3000 6 10501182 7 1200 7 2000 5 1500 5 1050264 8 200 8 200 6 150 9 450566 9 407 9 1400 7 450 10 450– – – – – 8 600 – –– – – – – 9 300 – –
3007 4000 6000 3000486 378276.2 369960.1 390550.72 353993.53.5 33673.3 41989.45 21398.79 57,956
8.2 10.2 5.2 14.1NA NA 716.2 661.4NA NA 701.2 648.77NA NA 708.4 650.19NA NA NA 16.01NA NA 4.4 4.001

Fig. 5. The effect of compensated devices on voltages of 10 bus system.
19 20 21 22
~
2 3 4 5 6 7 8 9 10 11 12 13 14 15 16 17 18
23 24 25
26 27 28 29 30 31 32 33
1
Fig. 6. The schematic diagram of the 33 bus system.
Fig. 7. The values of LSF
210 A.Y. Abdelaziz et al. / Electrical Power and Energy Systems 78 (2016) 207–214
L � kCðkÞ sinðpk=2Þp
1s1þk
; ðs � s0 > 0Þ ð6Þ
CðkÞ is the standard gamma function, and this distribution is validfor large steps s > 0.
For the local pollination, both Step 2 and Step 3 can be repre-sented as
xtþ1l ¼ xtl þ e xtn � xtp
� �ð7Þ
where xtn and xtp are pollen from different flowers of the same plantspecies mimicking the flower constancy in a limited neighborhood.For a local random walk, xtn and xtp comes from the same speciesthen e is drawn from a uniform distribution as [0,1].
In principle, flower pollination activities can occur at all scales,both local and global. In fact adjacent flower patches are pollinatedby local flower pollen than those far away. In order to mimic this,one can effectively use a switch probability (Step 4) p to switchbetween common global pollination to intensive local pollination.One can use a value of p = 0.5 as an initially value. A preliminaryparametric showed that p = 0.8 might work better for mostapplications.
The previous steps of FPA plus the switch condition can be sum-marized in the pseudo code shown in Fig. 2 while the parametersof FPA are given in appendix.
Objective function
The proposed objective function of optimal capacitor locationproblem is to minimize the total cost which is determined by thefollowing equation:
Cost ¼ KP � PLoss � T þ KI � CBþ KC �XCB
i
QCi ð8Þ
where the constants are taken from [11].
Equality and inequality constraints
Eq. (8) is minimized whilst satisfying the following equality andinequality constraints.
for 33 bus system.

Table 3Results for 33 bus system.
Items Un-compensated Compensated
GA [2] PGSA [22] GSA [40] SA [40] IP [40] ProposedFPA
Year 2005 2011 2015 2015 2015 2015Total losses (kW) 202.66 135.5 135.4 134.5 151.75 171.78 134.47Loss reduction (%) 33.14 33.19 33.63 25.12 15.24 33.65Minimum voltage 0.9131 0.9349 0.9463 0.9672 0.9591 0.9501 0.9365Optimal location and size in kVAr 8 300 6 1200 13 450 10 450 9 450 6 250
15 300 28 760 15 800 14 900 29 800 9 40020 300 29 200 26 350 30 350 30 900 30 95021 300 – – – – – –24 300 – – – – – –26 300 – – – – – –28 300 – – – – – –27 600 – – – – – –
Total kVAr 2700 2160 1600 1700 2150 1600Annual cost ($/year) 106518.1 87318.8 80646.24 78493.2 87859.8 87859.8 78477.4Net saving ($/year) 19199.3 25871.9 28024.9 18658.3 18658.3 28040.7% saving 18 24.3 26.3 17.5 17.52 26.33Worst losses NA NA NA NA NA 138.85Best losses NA NA NA NA NA 134.47Mean losses NA NA NA NA NA 136.53Variance NA NA NA NA NA 2.7145Standard deviation NA NA NA NA NA 1.64
Bold items present the result obtained by the proposed algorithm.
A.Y. Abdelaziz et al. / Electrical Power and Energy Systems 78 (2016) 207–214 211
Equality constraint
� Load flow constraintTraditional methods such as Newton Raphson and Gauss Siedel
cannot be used in distribution system due to ill condition [35]. For-ward sweep algorithm has been introduced by Das et al. [36,37] tosolve load flow problem of distribution systems. The equality con-straint is given by the following equation:
PSwing ¼XL
i¼1
PLinelossðiÞ þXNq¼1
PdðqÞ ð9Þ
QSwing þXCB
b¼1
QCðbÞ ¼XL
i¼1
QLinelossðiÞ þXNq¼1
QdðqÞ ð10Þ
Fig. 8. The effect of compensated devices on voltages of 33 bus system.
Inequality constraints
� Voltage constraintThe magnitude of voltage at each bus must be limited by the
following equation:
Vmin 6 jVij 6 Vmax ð11Þ
� Compensation constraintThe injected reactive power at each candidate bus should be
less than its effective reactive power.
� Total reactive power constraint
It is noteworthy that the total injected reactive power is lessthan 0.75 of the total reactive power demand to sustain workingof power system with lagging power factor and averting the lead-ing one [11].
XCB
b¼1
QCðbÞ 6 0:75XNq
QdðqÞ ð12Þ
� Power factor constraint
Power Factor of overall system (PFsys) should exceed the mini-mum value and less than the maximum value as shown by the fol-lowing equation:
PFmin 6 PFsys 6 PFmax ð13Þ
� Capacitor rating constraintThe injected kVAr of the installed capacitor is presented as a
discrete value by step of 50 kVAr and specified by the followingrange:
QCmin 6 QC 6 QCmax ð14Þ

47 48 49 50
~2 3 4 5 6 7 8 9 10 11 12 13 14 15 16 17 18 19 20 21 22 23 24 25 26 27
68 69
53 54 55 56 57 58 59 60 61 62 63 64 65
28 29 30 31 32 33 34 35
66 67 51 52
36 37 38 39 40 41 42 43 44 45 46
1
Fig. 9. Line diagram of the 69 bus system.
Fig. 10. The values of LSF for 69 bus system.
212 A.Y. Abdelaziz et al. / Electrical Power and Energy Systems 78 (2016) 207–214
Results and discussion
The superiority of the proposed FPA with LSF is implemented tovarious distribution systems. The results of 10 bus, 33 bus and 69bus radial distribution systems are given below in details. The pro-posed algorithm has been performed via Matlab [38]. The parame-ters used in calculation are given in Table 1 [11].
10 bus test system
First, the suggested algorithm is applied to 10 bus system asshown in Fig. 3. The system data are given in [36]. The total loadfor this system is (13151.77 + J 5176.6) kVA. Fig. 4 gives the candi-date buses according to their LSF. The ordered of these buses are 6,5, 9, 10, 8 and 7. For this system, FPA decides the optimum loca-tions and their sizing from the candidate buses based on higherLSF. Four buses are selected for capacitor placements by FPA. Thelosses without compensation are 783.77 kW and are decreased to648.77 kW due to capacitors installation as shown in Table 2.The percentage reduction in losses is increased to be 17.22%. The
notability of the suggested FPA to reduce losses and decide the sizeof capacitors is demonstrated compared with those obtained in[4,12,21,26,39]. The minimum voltage before compensation is0.8375 p.u. and this voltage is enhanced after compensation to be0.9168 p.u. Fig. 5 shows the effect of installed capacitors on systemvoltages. The value of installed capacity of reactive power is3000 kVAr. The value of total cost due to the proposed objectivefunction 353993.5 $ which is the smallest one. Moreover, the netsaving with the proposed FPA is 57956 $ which is the maximumone compared with other algorithms. Also, the percentage of netsaving with the proposed FPA is equal to 14.1% which is the great-est one. In addition, the statistical performance of the proposedFPA is displayed in Table 2 to show the best, worst, mean, varianceand standard deviations of the total losses for 50 runs.
33 bus test system
The second tested case via the suggested LSF and FPA is a 33 bussystem. Fig. 6 gives the system diagram which consists of mainfeeders and three laterals. The system data are given in [37]. The

Table 4Results of 69 bus system for different algorithms.
Items Un-compensated Compensated
PSO [4] DSA [29] TLBO [9] Fuzzy GA[15]
DE–PS[11]
DE–PS[11]
Heuristic[18]
ProposedFPA
Year 2007 2012 2013 2008 2013 2013 2010 2015Total losses (kW) 224.8949 152.48 147 146.35 156.62 146.1347 151.3763 148.48 150.28Loss reduction (%) – 32.2 34.64 34.92 30.4 35.02 32.7 34 33.2Minimum voltage 0.9092 – – 0.9313 0.9369 0.9327 0.9311 0.9305 0.9333Optimal location and size in kVAr – 46 241 61 900 12 600 59 100 61 950 57 150 8 600 61 1350
47 365 15 450 61 1050 61 700 64 200 58 50 58 150 – –50 1015 60 450 64 150 64 800 59 150 61 1000 60 1050 – –– – – – – – 65 50 60 150 – – – –– – – – – – 21 300 59 100 – – – –
Total kVAr 1621 1800 1800 1600 1650 1450 1800 1350Annual cost ($/year) 118204.8 88006.5 85663.2 85321.56 90119.5 86758.4 88913.4 86441.1 84038.06Net saving ($/year) – 30198.3 32541.56 32883.2 28085.3 31446.36 29291.4 31763.7 34166.7% saving – 25.6 27.53 27.82 23.8 26.6 24.8 26.9 28.91Worst losses – NA NA 146.92 NA NA NA NA 151.38Best losses – NA NA 146.35 NA NA NA NA 150.01Mean losses – NA NA 146.57 NA NA NA NA 151.11Variance – NA NA NA NA NA NA NA 0.069Standard deviation – NA NA 0.02134 NA NA NA NA 0.26
Bold items present the result obtained by the proposed algorithm.
Fig. 11. The effect of compensated device on voltages of 69 bus system.
A.Y. Abdelaziz et al. / Electrical Power and Energy Systems 78 (2016) 207–214 213
values of LSF for all buses are given in Fig. 7. Three buses areselected for capacitor placements by FPA. The notability of the pro-posed FPA to select the optimal locations and sizing of capacitors isverified compared with those obtained in [2,22,40]. The losseswithout compensation are 202.66 kW and are decreased to134.47 kW due to compensation devices as shown in Table 3.Moreover, the minimum voltage has been increased from0.9131 p.u. to 0.9365 p.u. The improvement of system voltages isgiven in Fig. 8 due to installed capacitors. The value of installedcapacity of reactive power is 1600 kVAr which is the lowest onecompared with other techniques. The value of total cost due tothe proposed objective function is 78477.4 $ which is the smallestone. Moreover, the net saving with the proposed FPA is 28040.7 $which is the maximum one compared with other algorithms. Also,
the percentage of net saving with the proposed FPA is equal to26.33% which is the greatest one. In addition, the statistical perfor-mance of the proposed FPA is displayed in Table 3 to show the best,worst, mean, variance and standard deviations of the total lossesfor 50 runs.
69 bus test system
The third tested case via the suggested algorithm is a 69 bussystem. Fig. 9 gives the system diagram which consists of mainfeeders and seven branches. The system data are given in [41].The order of candidate buses for this system according to theirLSF values is 57, 58, 61, 60, 59, 64, 17, 65, 16, 21, 19, 63, 20, 62,25, 24, 23, 26, 27, 18 and 22 as given in Fig. 10. Only one bus isselected by FPA for capacitor placements. The superiority of theproposed technique to solve the problem of optimal capacitor loca-tion compared with those obtained in [4,9,11,15,18,29] is con-firmed. The losses without compensation are 224.8949 kW andare decreased to 150.28 kW due to compensation device as shownin Table 4. Moreover, the minimum voltage has been enhancedfrom 0.9092 p.u. to 0.9333 p.u. The improvement of system volt-ages is shown in Fig. 11 due to installed capacitor. The value ofinstalled capacity of reactive power is 1350 kVAr which is the low-est one compared with other techniques. The value of total costdue to the proposed objective function is 84038.06 $ which is thesmallest one. Moreover, the net saving with the proposed FPA is34166.7 $ with percentage of 28.91% which is the maximum onecompared with other algorithms. Also, the statistical performanceof the proposed FPA is displayed in Table 4 to show the best, worst,mean, variance and standard deviations of the total losses for 50runs.
Conclusions
In this paper, FPA has been successfully implemented with LSFfor optimal location and sizing of shunted capacitors in various dis-tribution systems. The designed problem has been formulated asan optimization task with computing cost of power losses, installa-tion and vars. The effectiveness of the suggested approach is clar-ified by using different test systems. The results have beencompared with those obtained using other algorithms. It is obviousfrom the comparison that the proposed approach provides a nota-

214 A.Y. Abdelaziz et al. / Electrical Power and Energy Systems 78 (2016) 207–214
ble performance in terms of total cost and net saving. Applicationsof the proposed algorithm to large scale distribution power sys-tems and unbalanced one with other techniques are the futurescope of this work.
Appendix
The parameters of FPA are as follow: maximum number of iter-ations = 100, population size = 25, probability switch = 0.8, c = 0.1and k ¼ 1:5.
References
[1] Yang HT, Huang YC, Huang CL. Solution to capacitor placement problem inradial distribution system using tabu search method. In: IEEE internationalconference on energy management and power delivery, vol. 1, 21–23November 1995. p. 388–93.
[2] Swarup KS. Genetic algorithm for optimal capacitor allocation in radialdistribution systems. In: Proceedings of the 6th WSEAS internationalconference on evolutionary, Lisbon, Portugal, June 16–18, 2005. p. 152–9.
[3] Amanifar O, Golshan MEH. Optimal distributed generation placement andsizing for loss and THD reduction and voltage profile improvement indistribution systems using particle swarm optimization and sensitivityanalysis. Int J Tech Phys Probl Eng 2011;3(2):47–53.
[4] Prakash K, Sydulu M. Particle swarm optimization based capacitor placementon radial distribution systems. IEEE power engineering society generalmeeting, 2007, 24–28 June 2007. p. 1–5.
[5] Das P, Banerjee S. Optimal sizing and placement of capacitor in a radialdistribution system using loss sensitivity factor and firefly algorithm. Int J EngComput Sci 2014;3:5346–52.
[6] Samimi Asl T, Jamali S. Optimal capacitor placement size and location of shuntcapacitor for reduction of losses on distribution feeders. In: Internationalconference on clean electrical power, Capri; 2009. p. 223–6.
[7] Neelima S, Subramanyam PS. Optimal capacitor placement in distributionnetworks using differential evolution incorporating dimension reducing powerflow method. IEEE PES innovative smart grid technologies, 1–3 December2011, India. p. 396–401.
[8] Karimi M, Shayeghi H, Banki T, Farhadi P, Ghadimi N. Solving optimal capacitorallocation problem using DE algorithm in practical distribution networks.Electr Rev 2012(7a):90–3.
[9] Dideban M, Ghadimi N, Ahmadi MB, Karimi M. Optimal location and sizing ofshunt capacitors in distribution systems by considering different loadscenarios. J Electr Eng Technol 2013;8(5):1012–20.
[10] Elmaouhab A, Boudour M, Gueddouche R. New evolutionary technique foroptimization shunt capacitors in distribution networks. J Electr Eng 2011;62(3):163–7.
[11] Elfergany A. Optimal capacitor allocations using evolutionary algorithm. IETProc Gener Transm Distrib 2013;7(6):593–601.
[12] Su CT, Tsai CC. A new fuzzy reasoning approach to optimum capacitorallocation for primary distribution systems. In: Proceeding of the IEEE onindustrial technology conference (ICIT ‘96), 2–6 December 1996, Shanghai. p.237–41.
[13] Mekhamer SF, Soliman SA, Moustafa MA, El-Hawary ME. Application of fuzzylogic for reactive power compensation of radial distribution feeders. IEEETrans Power Syst 2003;18(1):206–13.
[14] Prasad PV, Sivanagaraju S, Sreenivasulu N. A fuzzy genetic algorithm foroptimal capacitor placement in radial distribution systems. ARPN J Eng ApplSci 2007;2(3):28–32.
[15] Das D. Optimal placement of capacitors in radial distribution system using afuzzy-GA method. Int J Electr Power Energy Syst 2008;30:361–7.
[16] Seifi A, Hesamzadeh MR. A hybrid optimization approach for distributioncapacitor allocation considering varying load conditions. Int J Electr PowerEnergy Syst 2009;31:589–95.
[17] Chis M, Salama MMA, Jayaram S. Capacitor placement in distribution systemsusing heuristic search strategies. IEE Proc Gener Transm Distrib 1997;144(3):225–30.
[18] Hamouda A, Lakehal N, Zehar K. Heuristic method for reactive energymanagement in distribution feeders. Int J Energy Convers Manage2010;51:518–23.
[19] Hamouda A, Sayah S. Optimal capacitors sizing in distribution feeders usingheuristics search based node stability indices. Int J Electr Power Energy Syst2013;46:56–64.
[20] Das P, Banerjee S. Placement of capacitor in a radial distribution system usingloss sensitivity factor and cuckoo search algorithm. Int J Sci Res Manage2013;2:751–7.
[21] Rao RS, Narasimham SVL, Ramakingaraju M. Optimal capacitor placement in aradial distribution system using plant growth simulation algorithm. Int J ElectrPower Energy Syst 2011;33:1133–9.
[22] Sarma AK. Optimal selection of capacitors for radial distribution systemsusing plant growth simulation algorithm. Int J Adv Sci Technol 2011;30:43–54.
[23] Kumar SA. Power loss reduction in radial distribution system by using plantgrowth simulation algorithm. J Energy Technol Policy 2012;2(3):19–26.
[24] Sirjani R, Mohamed A, Shareef H. Optimal capacitor placement in a radialdistribution systems using harmony search algorithm. J Appl Sci 2010;10(23):2998–3006.
[25] Chang CF. Reconfiguration and capacitor placement for loss reduction ofdistribution systems by ant colony search algorithm. IEEE Trans Power Syst2008;23(4):1747–55.
[26] Nojavan S, Jalali M, Zare K. Optimal allocation of capacitors in radial/meshdistribution systems using mixed integer nonlinear programming approach.Int J Electric Power Syst Res 2014;107:119–24.
[27] Elfergany A, Abdelaziz AY. Capacitor placement for net saving maximizationand system stability enhancement in distribution networks using artificial beecolony based approach. Int J Electr Power Energy Syst 2014;54:235–43.
[28] Sultana S, Roy PK. Optimal capacitor placement in radial distribution systemsusing teaching learning based optimization. Int J Electr Power Energy Syst2014;54:387–98.
[29] Raju M, Murthy K, Avindra K. Direct search algorithm for capacitivecompensation in radial distribution systems. Int J Electr Power Energy Syst2012;42:24–30.
[30] Yang XS. Flower pollination algorithm for global optimization. In:Unconventional computation and natural computation. Lecture Notes inComputer Science, vol. 7445; 2012. p. 240–9.
[31] Yang XS, Karamanoglu M, He X. Multi-objective flower algorithm foroptimization. Procedia Comput Sci 2013;18:61–8.
[32] Glover BJ. Understanding flowers and flowering: an integratedapproach. Oxford, UK: Oxford University Press; 2007.
[33] Yang XS. Engineering optimization: an introduction with metaheuristicsapplications. Wiley; 2010.
[34] Abdelaziz AY, Ali ES. Static VAR compensator damping controller design basedon flower pollination algorithm for a multi-machine power system. ElectricPower Compon Syst 2015;43(11):1268–77.
[35] Teng JH. A direct approach for distribution system load flow solutions. IEEETrans Power Delivery 2003;18(3):882–7.
[36] Das D, Nagi HS, Kothari DP. Novel method for solving radial distributionnetworks. IEE Proc Gener Transm Distrib 1994;141(4):291–8.
[37] Das D, Kothari DP, Kalam A. Simple and efficient method for load flow solutionof radial distribution network. Int J Electr Power Energy Syst 1995;17(5):335–46.
[38] MathWorks. <http://www.mathworks.com>.[39] Elsheikh A, Helmy Y, Abouelseoud Y, Elsherif A. Optimal capacitor placement
and sizing in radial electric power systems. Alexandria Eng J 2014;53(4):809–16.
[40] Shuiab Y, Kalavathi M, Rajan C. Optimal capacitor placement in radialdistribution system using gravitational search algorithm. Int J Electr PowerEnergy Syst 2015;64:384–97.
[41] Baran ME, Wu FF. Optimal capacitor placement on radial distribution systems.IEEE Trans Power Delivery 1989;4(1):725–34.