Electoral competition and political selection: An analysis of the productivity of French deputies,...
42
Electoral competition and political selection: An analysis of the productivity of French deputies, 1958-2012 Nicolas Gavoille * Marijn Verschelde † Abstract In this paper, we study the relation between electoral competition and po- litical selection, using a unique dataset containing detailed yearly information about members of the French National Assembly from 1959 to 2012. First, we innovate by using productivity as a measure of politicians’ quality. As we gath- ered information on the many aspects of deputies’ individual work, we use a nonparametric composite indicator of deputy activity that fully acknowledges the multidimensional nature of parliamentary work. Second, we do not impose any assumption about the relationship between electoral competition and po- litical selection by using a fully nonparametric framework. Third, this method allows studying the evolution of the relationship between electoral competi- tion and political selection over time. Overall, our results show that deputies elected in a priori contested districts have a higher overall productivity, with the intensity of this relationship reaching its peak in the 80’s but constantly decreasing since then. Keywords: Competition, Election, Political Selection, Kernel Regression, Nonparametric Econometrics JEL: D72, J45, C14 * Corresponding author. Stockholm School of Economics in Riga, Strelnieku iela 4a, Riga LV- 1010 - Latvia and Condorcet Center for Political Economy, Universit´ e de Rennes 1, Facult´ e de Sciences Economiques, 7 place Hoche, 35000 Rennes - France. E-mail : [email protected] † Department of Economics and Quantitative Methods, I ´ ESEG School of Management, Socle de la Grande Arche, 1 Parvis de La D´ efense, 92044 Paris La D´ efense cedex - France and Center for Economic Studies, Katholieke Universiteit Leuven, Etienne Sabbelaan 51, 8500 Kortrijk - Belgium. E-mail: [email protected]. 1
-
Upload
stockholm-institute-of-transition-economics -
Category
Education
-
view
280 -
download
1
Transcript of Electoral competition and political selection: An analysis of the productivity of French deputies,...
Electoral competition and politicalselection: An analysis of the productivity
of French deputies, 1958-2012
Nicolas Gavoille∗ Marijn Verschelde†
Abstract
In this paper, we study the relation between electoral competition and po-litical selection, using a unique dataset containing detailed yearly informationabout members of the French National Assembly from 1959 to 2012. First, weinnovate by using productivity as a measure of politicians’ quality. As we gath-ered information on the many aspects of deputies’ individual work, we use anonparametric composite indicator of deputy activity that fully acknowledgesthe multidimensional nature of parliamentary work. Second, we do not imposeany assumption about the relationship between electoral competition and po-litical selection by using a fully nonparametric framework. Third, this methodallows studying the evolution of the relationship between electoral competi-tion and political selection over time. Overall, our results show that deputieselected in a priori contested districts have a higher overall productivity, withthe intensity of this relationship reaching its peak in the 80’s but constantlydecreasing since then.
Keywords: Competition, Election, Political Selection, Kernel Regression,Nonparametric EconometricsJEL: D72, J45, C14
∗Corresponding author. Stockholm School of Economics in Riga, Strelnieku iela 4a, Riga LV-1010 - Latvia and Condorcet Center for Political Economy, Universite de Rennes 1, Faculte deSciences Economiques, 7 place Hoche, 35000 Rennes - France. E-mail : [email protected]†Department of Economics and Quantitative Methods, IESEG School of Management, Socle de
la Grande Arche, 1 Parvis de La Defense, 92044 Paris La Defense cedex - France and Center forEconomic Studies, Katholieke Universiteit Leuven, Etienne Sabbelaan 51, 8500 Kortrijk - Belgium.E-mail: [email protected].
1

1 Introduction
Political economy recently rediscovered that individuals, and not only institutions,
matter for economic outcomes (Besley et al., 2010; Dreher et al., 2009; Jones and
Olken, 2005). This emphasizes the need not only to shape institutions in order
to discipline incumbent politicians, but also to design efficient political selection
mechanisms. Several theoretical determinants have been shown to affect political
selection: the wage of politicians (Besley, 2004; Gagliarducci and Nannicini, 2013;
Mattozzi and Merlo, 2008; Messner and Polborn, 2004; Poutvaara and Takalo, 2007),
the transparency of politics (Mattozzi and Merlo, 2007), the institutional flexibility
(Acemoglu et al., 2010), and reservation quotas (Besley et al., 2005, 2013). In ad-
dition to a well-known disciplining effect (Stigler, 1972; Becker, 1983 for instance),
electoral competition is also likely to enhance this selection process, by pushing the
competing parties to select candidates of higher quality in order to seduce sufficiently
enough unaligned voters to ensure electoral success (Galasso and Nannicini, 2011).
Only little is known about the empirical relationship between electoral competi-
tion and political selection. This paper extends the empirical investigation of this
relationship exploiting a unique dataset focusing on the deputies of the V th French
Republic, from its birth in 1958 to the end of the XIII th legislature in 2012. We
innovate in three distinctive ways. First, we provide for the first time a measure of
quality based on productivity, i.e., on what deputies do, which is much more precise
than what is usually used in the literature, e.g., absenteeism rate or years of school-
ing. We gathered from the Assemblee Nationale archive all the information that has
been systematically collected over the years for each deputy and for each year from
1958 to 2012: (i) propositions of law, (ii) oral questions, (iii) reports and (iv) debates
in which the deputy has been involved in. From these four aspects of parliamentary
work, we compute a composite indicator of productivity using an α-domination es-
timator, based on Aragon et al. (2006) and Daraio and Simar (2007). As it is a fully
nonparametric estimator, no arbitrary weights are imposed on the different activity
items.
A second distinguishing feature of our analysis is that we use a nonparametric
multivariate generalized kernel regression approach as introduced by Racine and Li
(2004). The first advantage of this technique is that contrary to standard parametric
2

methods it does not require any assumption about the relationship between electoral
competition and the productivity of deputies. It lets the data ‘speak for themselves ’.
In particular, this implies that we allow for non-linearities and interactions with
the many (discrete or continuous) control variables. Considering the richness of our
dataset, which contains detailed information about more than 2,400 deputies for a
total of 24,000 observations, this fully flexible approach is of particular interest since
quite little is known about the empirical relationship between political selection and
electoral competition.
The third major innovation of this paper consists of fully exploiting the large
time span of our dataset to test whether the discussed relationship is time-varying.
Stated differently, using the nonparametric methodology, we are able to observe how
the relationship between electoral competition and political selection evolved over
time. In France as in Europe, the progressive convergence of the competing political
platforms over the second part of the XXth century, marked by the reconciliation of
the left with the market in the early 80’s, suggests that the electorate became more
ideologically neutral, hence more sensitive to the quality of the candidates (Green,
2007; Knapp and Wright, 2001). By the free interaction between time and political
competition measure allowed by the nonparametric approach, we can test whether
the intensity of the competition/selection relationship increased (or not) over time.
To our knowledge this is the first exploration of drivers of political selection over time.
The French National Assembly is an ideal testing ground in many respects. First,
the institutional context remains (quasi) stable since 1958, allowing meaningful com-
parisons over such a long period. Second, this institutional stability is paired with a
highly heterogeneous political context, with left-wing majorities following right-wing
ones. Finally, this institutional context fits the theoretical framework of Galasso and
Nannicini (2011) which we adopt.
Overall, our results point a clear positive relationship between electoral competi-
tion and political selection. Deputies elected in ex ante competitive districts exhibit
a higher productivity, ceteris paribus. This relationship is robust to different speci-
fications. The overall productivity of deputies is continuously increasing over time,
but the intensity of the relationship between competition and selection, after having
increased till the early 80’s, is continuously decreasing since then, and turns insignif-
3

icant since the beginning of the 2000’s. The political context of the 70’s and 80’s
is the closest one to the theoretical hypothesis of the Galasso and Nannicini (2011)
model, providing support to their formalization of the link between competiton and
selection.
The remaining of the paper is structured as follows. In section 2 we present the
theoretical background. Section 3 briefly describes the French political and institu-
tional context. We introduce our measure of electoral competition and of quality
together with the dataset in Section 4. Section 5 presents the nonparametric kernel
approach. The results are detailed in Section 6, and Section 7 concludes.
2 Theoretical framework
While the link between competition in the political market and economic outcomes
is well established (Besley et al., 2010; Besley and Preston, 2007; Padovano and
Ricciuti, 2009; Sole-Olle, 2006), the role of political competition is often left implicit;
it is not always clear whether competition plays a disciplining role (incentivizing
incumbents to adopt good policies) or helps selecting politicians of higher quality
(who are better equipped to formulate good policies).
To our knowledge, only Galasso and Nannicini (2011) and De Paola and Scoppa
(2011) exclusively focus on the impact of electoral competition on political selection,
respectively in the context of the Italian Parliament and Italian municipalities. While
De Paola and Scoppa (2011) show that mayors elected in contested municipalities
are more educated, Galasso and Nannicini (2011) go one step further and show that
deputies coming from highly competitive districts exert more effort, as measured by
absenteeism rate, even after controlling for reelection incentives. They are the first
to propose (and test) a formal model explicitly relating electoral competition to the
quality of elected representatives and attribute a central role to political parties. At
the opposite of the citizen candidate model (Besley and Coate, 1997; Osborne and
Slivinski, 1996), this model focuses on the demand side of the political market, which
is more suitable for democracies like France where political competition opposes
parties1.
1The importance of parties in the selection process has previously been emphasized (Carrillo
4

To briefly sum-up the model, two ideological parties compete in a majoritarian
system characterized by plurality rule in single-member districts. Each district is
composed of a specific share of party supporters and neutral voters. The former
always vote for their favorite party. The latter are uniformly distributed on a left-
right spectrum (and thus are more or less close to a specific party). Neutral voters
care about the national policy that the winning party will implement, but also about
the quality of the elected incumbent in their district. Quality of politicians is assumed
to be observable before the elections, by both voters and parties.
Parties can select two types of candidates: loyalists and experts, respectively of
low and high quality. An important assumption is that recruiting high quality candi-
dates is costly for parties, for example because of a higher financial compensation for
their opportunity cost, or because of a minor dedication to party propaganda. To win
the elections, a party needs to win more than 50% of the districts. The distribution
of the three types of voters over the districts determines the ex ante contestability
of each district (ex ante since parties base their strategy on this information, before
the election). In some districts, the bias in favor of a party is so important that the
outcome of the election is certain. In other districts, the parties need to attract votes
of the neutral voters, who vote according to a standard probabilistic voting model.
In this set up, parties recruit the same proportion of experts, and allocate them to
the most contested districts. This implies that high-quality candidates are confronted
to each other. Intuitively, the latter result comes from the fact that allocating an
expert to an uncontested district is useless for both parties: the party benefiting of
the bias has no interest in recruiting a costly expert since the victory is certain; the
same applies for the other party since defeat is unavoidable.
The model shows the conditions for a positive relationship between electoral
competition and political selection, which is the main hypothesis that we want to
verify. In this framework, it is easy to verify that the magnitude of the relationship
is time-varying as it is highly likely the institutional setting (including the party
polarization and the share of neutral voters) is time-varying as well. Insight in
the evolution of the relationship over time is important to understand the drivers
and Mariotti, 2001; Caillaud and Tirole, 2002; Mattozzi and Merlo, 2010; Poutvaara and Takalo,2007).
5

of political selection, which is the other main concern of this paper. We carefully
discuss the French institutional and political context to consider how the institutional
setting fits this framework while being time-varying.
3 The French institutional context
With a powerful presidency and a prime minister subject to assembly confidence, the
French V th Republic can be described as a semi-presidential system (Shugart, 2005)
since the adoption of the current Constitution in 1958. The President is elected
by universal direct suffrage, and nominates the prime minister. The resulting ‘two-
headed’ executive (Lewis-Beck, 1997) makes France a unique institutional case. The
Parliament is bicameral, consisting of the Senat and the Assemblee Nationale. A
bill has to be approved by both chambers to be validated. In case of disagreement
between the chambers, the Constitution gives the final word to the Assemblee Na-
tionale. The natural length of a legislature is five years. However, the President has
the power to dissolve the National Assembly. Dissolution happened on five occasions,
hence it is not a rare event. At the opposite, the chamber dismissed a government
only once, in 1962. Contrary to senators, deputies of the National Assembly are
elected by universal direct suffrage, explaining our focus on this chamber.
The institutional context described in Galasso and Nannicini (2011) model relies
on three specific features. First, the electoral system is a two-round majoritarian
system characterized by plurality rule in single-member districts. Second, two parties
compete for these elections. Third, parties recruit and allocate their candidates
strategically, depending on the contestability of the districts, implying a centralized
selection process. We successively describe how the French context fits these three
features, before focusing on the evolution of the context.
The deputies of the French National Assembly are elected with a two-round ma-
joritarian system. There is no term limit. Each constituency elects one deputy. If
no candidate receives more than 50% of the votes at the first round, only candidates
obtaining more than 12.5% of the votes in the first round are qualified for the second
round. In the vast majority of cases, only two candidates run for the second round.
The only exception to these electoral rules is the 1986 elections, which adopted a
6

proportional system2.
The party system can be described as ‘bipolar multipartism’ (Knapp and Wright,
2001; Knapp, 2002): in line with Duverger (1973), the two-round majoritarian elec-
toral system is a force tending to bipolarisation, but each pole remains multiparty.
The governing majority is based on a clear left-wing or right-wing coalition, and
does not rely on a pivot party likely to change partner during a legislature, ensuring
stability3. In a general case, a deputy has to first compete against candidates of
the same wing but from different parties in the first round, before confronting the
opposite wing candidate at the second round. If this is not a pure two party com-
petition, the mechanism is similar, especially in the 70s and 80s when the ‘overall
victory against the opposite camp became less important than regaining a dominant
position against allies’ (Knapp and Wright, 2001).
Despite some differences among parties, the candidate selection process is overall
highly centralized (Lundell, 20014; Thiebault, 1988). There is no law concerning
candidate selection, as it is the case for instance in the United States. The basic
organization is a central committee studying and eventually modifying propositions
of the local base. The candidate is not necessary originating from the constituency.
A ‘parachutage’ describes a situation in which a candidate is strategically sent to a
constituency with which he/she does not have any previous link with. An illustrative
example is the operation ’young wolves’ in 1967. The Gaullist party allocated ten
young and talented politicians from Paris (among them the future President Jacques
Chirac) in constituencies located in the Center-West of France, dominated by the
left-wing but winnable. The reaction of the main left-party was to allocate Roland
Dumas, a prestigious lawyer, future Foreign Affairs Minister, and Robert Mitterrand,
the brother of future president Francois Mitterrand. This example also provides an
anecdotal evidence of the strategical use of candidate selection by parties as well as
the convergence of candidates’ quality in close races as expressed by the theoretical
framework. More recent evidences of such a convergence could be the first election
of Francois Hollande in 1988 against another enarque in a rural constituency, or the
2The reason of this change is purely strategical. Francois Mitterrand, President since 1981, sawthis electoral reform as a way to soften the anticipated upcoming defeat (Chevallier et al., 2012).The original design came back for the next elections, together with a major redistricting. Sincethen, the number of deputies kept stable at 577.
3Centrist parties traditionally supported right-wing governments.
7

opposition in the 2012 elections between Jean-Luc Melenchon, leader of a left-wing
party and candidate for presidential election earlier the same year, and Marine Le
Pen, leader of the extreme-right party and who also run for presidential election,
while the Socialist party selected a university professor and the center-right another
enarque.
Concerning the time-variation in institutional context, the most noticeable evo-
lution over the second part of the XX th century in France is certainly the ideological
convergence after the 80’s, marked with the reconciliation of the Socialist Party with
the market and the rise of the Pensee unique (Knapp and Wright, 2001). According
to the theoretical model of Galasso and Nannicini (2011), such an evolution should
have decreased ideological voting and produced more competence-based elections
(Green, 2007). The selection process of the parties should have been more thorough
and careful, resulting in a tighter relationship between electoral competition and
political selection.
A second factor that might have impacted the electoral competition/selection
process relationship is the continuously increasing volatility of voters over time. The
effect of this well documented phenomenon (Drummond, 2006; Ysmal, 1994) is am-
biguous. In light of the theoretical model, an increase of the volatility can be as-
sociated with an increase of the share of neutral voters. Hence this should enhance
the effect of electoral competition on political selection. On the other hand, Knapp
(2002) suggest that this might have had the opposite consequence. The increas-
ing volatility leads the power to change hands at every national election between
1981 and 2002. Allocating candidates may have become more difficult since the link
between ex ante competition and effective competition is less straightforward.
Two other factors may have weakened the competition/selection mechanism. A
common evolution of the candidate selection process of all parties is an expansion
of their electorate, i.e., the selection process became progressively more collective
(Hazan and Rahat, 2010). This collective decision making may be a source of inef-
ficiency concerning the strategic allocation of candidates. Third, the party member-
ship grew up till the early 80’s and continuously decreased since then (Knapp, 2002).
This implies a declining stock of potential candidates in which parties can recruit.
Active partisanship is a way for parties to screen and identify promising politicians
8

(Best and Cotta, 2000).
In sum, a priori it is not clear which were the main drivers of political selection
and its relation with electoral competition. An empirical examination is needed to
clarify the changing importance of the discussed relation.
4 Data and measurement
To study the relationship between political competition and political selection, we
constructed a dataset which contains detailed individual information about all the
members of the French National Assembly from its first effective working year in
1959 to the end of the XIII th legislature in 2012 at a yearly rate. We keep only
deputies who stayed in office the whole legislature (more than 2,400), for a total of
over 24,000 observations.
4.1 Measuring quality
Measuring the quality of politicians is not straightforward. A wide theoretical accep-
tation is a combination of competence and motivation4 (Besley, 2006). Motivation
and competence are valence issues, which means that voters agree that a higher level
of motivation and competence is desirable. Such a broad definition is challenging
to operationalize. The existing empirical literature relies on two different strategies.
The first strategy consists in using ex ante measures of quality, such as schooling and
experience (Baltrunaite et al., 2014; Besley et al., 2011; De Paola and Scoppa, 2011;
Kotakorpi and Poutvaara, 2011). The link with the theoretical definition of qual-
ity is however not direct as these proxies focus on competence, and fail to capture
the multidimensional definition of quality. The second strategy consists in measur-
ing the quality of politicians ex post, according to their performance in office. But
again, measuring the performance of an individual politician is not straightforward.
Galasso and Nannicini (2011) use the absenteeism rate, while Gagliarducci and Nan-
nicini (2013) use the vote attendance. Both measure effort, and not quality.
We innovate by proposing an ex post measure of quality which is much more
4Motivation here is not driven by incentives, but can be related to what Benabou and Tirole(2003) call ‘intrinsic motivation’. See Besley (2006) for a thorough discussion.
9
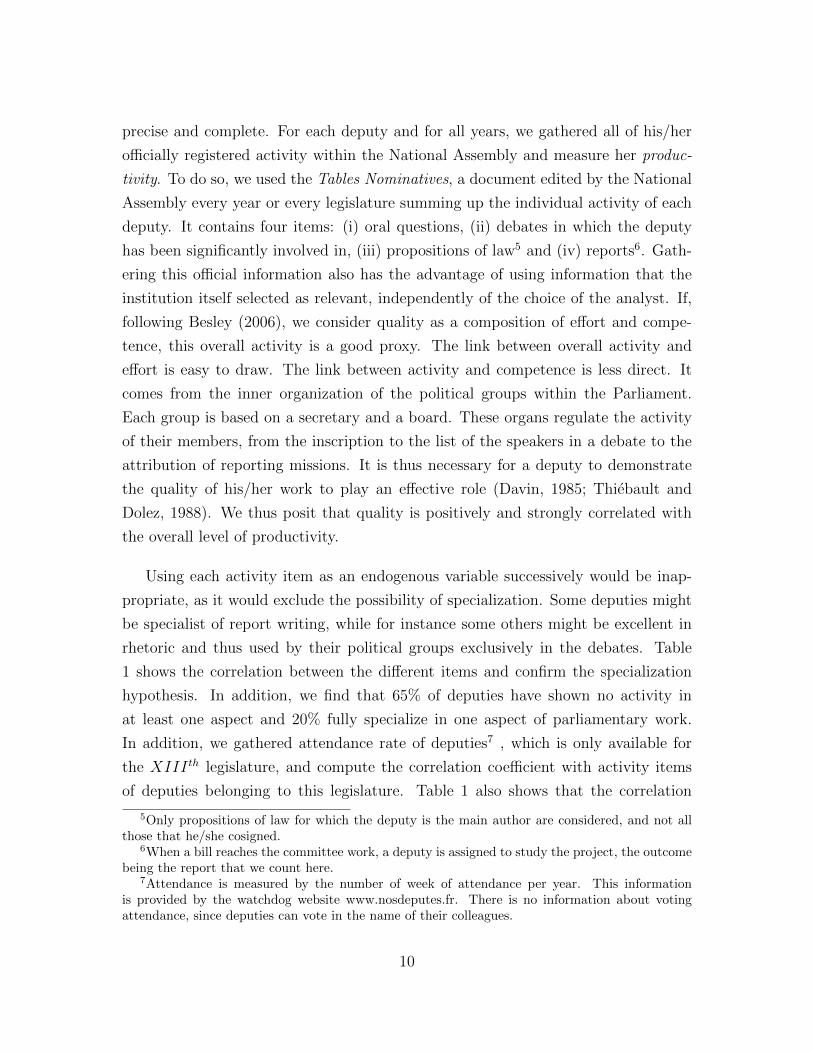
precise and complete. For each deputy and for all years, we gathered all of his/her
officially registered activity within the National Assembly and measure her produc-
tivity. To do so, we used the Tables Nominatives, a document edited by the National
Assembly every year or every legislature summing up the individual activity of each
deputy. It contains four items: (i) oral questions, (ii) debates in which the deputy
has been significantly involved in, (iii) propositions of law5 and (iv) reports6. Gath-
ering this official information also has the advantage of using information that the
institution itself selected as relevant, independently of the choice of the analyst. If,
following Besley (2006), we consider quality as a composition of effort and compe-
tence, this overall activity is a good proxy. The link between overall activity and
effort is easy to draw. The link between activity and competence is less direct. It
comes from the inner organization of the political groups within the Parliament.
Each group is based on a secretary and a board. These organs regulate the activity
of their members, from the inscription to the list of the speakers in a debate to the
attribution of reporting missions. It is thus necessary for a deputy to demonstrate
the quality of his/her work to play an effective role (Davin, 1985; Thiebault and
Dolez, 1988). We thus posit that quality is positively and strongly correlated with
the overall level of productivity.
Using each activity item as an endogenous variable successively would be inap-
propriate, as it would exclude the possibility of specialization. Some deputies might
be specialist of report writing, while for instance some others might be excellent in
rhetoric and thus used by their political groups exclusively in the debates. Table
1 shows the correlation between the different items and confirm the specialization
hypothesis. In addition, we find that 65% of deputies have shown no activity in
at least one aspect and 20% fully specialize in one aspect of parliamentary work.
In addition, we gathered attendance rate of deputies7 , which is only available for
the XIII th legislature, and compute the correlation coefficient with activity items
of deputies belonging to this legislature. Table 1 also shows that the correlation
5Only propositions of law for which the deputy is the main author are considered, and not allthose that he/she cosigned.
6When a bill reaches the committee work, a deputy is assigned to study the project, the outcomebeing the report that we count here.
7Attendance is measured by the number of week of attendance per year. This informationis provided by the watchdog website www.nosdeputes.fr. There is no information about votingattendance, since deputies can vote in the name of their colleagues.
10

between activity and attendance rate is rather low, confirming the need to use a
quality measure which is more complex than attendance.
Table 1: Correlation of activity items
Attendance Reports Questions Interventions Propositions
Attendance 1
Reports 0.350 1
Questions 0.346 0.062 1
Interventions 0.593 0.290 0.447 1
Propositions 0.140 0.077 0.221 0.267 1
In this paper, we fully acknowledge deputies as agents that use their inputs to
produce the multiple aspects of parliamentary activity. Concerning input usage, we
consider that all deputies have the same tools (e.g., the same grant for hiring staff)
and twenty-four hours per day. Hence, we normalize the input to 1 for all deputies
and the remaining question is how we can aggregate the different aspects of deputy
work. One could simply use a weighted sum, but such weights would however be
subjective, and the literature about the French parliament does not provide any
information about this.
An alternative for imposing a priori defined weights is the use of a so called
‘benefit-of-the-doubt ’ (after Melyn and Moesen, 1991) nonparametric composite in-
dicator that allows for an endogenous weighting of the different outputs via linear
programming8. The model grants each deputy its most favorable weights and thus
allows for full specialization. However, the important number of extreme values in
our data precludes the use of traditional frontier methods such as FDH, DEA and
the benefit-of-the-doubt model9. These nonparametric efficiency methods are based
on the computation of the boundary of the attainable set (the so called efficiency
frontier), which is highly sensible to outliers (Cazals et al., 2002).
To avoid this problem we use an alternative probability-based score to measure
8Francois and Weill (2014) use this method in the case of the French deputies over the 2002-2007period, focusing on the multiple-office holding issue.
9See Fried et al. (2008) for an extensive overview.
11

the multidimensional parliamentary activity. The α-probability measure estimates
the probability to not be dominated in activity and is the equal-input variant of
the α-efficiency estimator of Aragon et al. (2006) and Daraio and Simar (2007)10.
Particularly convenient is that a) this indicator is robust to outlying observations,
b) it is consistent with production theory and c) it is easy to interpret. The α-
performance is defined for observation i with d-dimensional output yi = (yi1, ..., yid)
as the probability that another observation does not produce more of each output,
with αi(y, yi) ∈ [0, 1], higher values indicating higher activity:
αi(y, yi) = 1− Sy,yi , with Sy,yi = Prob(y ≥ yi). (1)
Stated differently, the α-measure provides the probability for a deputy not to be
dominated by another deputy taken randomly. The vector y is composed of our four
outputs of parliamentary activity. The concept of dominance here is similar to the
one extensively used in game theory. To illustrate this point, consider a deputy i
producing (yi1, yi2, yi3, yi4) = (2, 2, 2, 2), with yi1, yi2, yi3 and yi4 respectively denot-
ing reports, questions, propositions of law and debates. This deputy is dominated
by a second deputy producing (3, 2, 2, 2), and dominates a third deputy producing
(2, 1, 2, 2). Furthermore, compared to a fourth deputy producing (3, 0, 0, 0), the pro-
duction of each deputy does not dominate the other. The empirical estimation of
the α-domination measure for deputy i is obtained by computing:
αi(y, yi) = 1− Sy,yi = 1−∑
j=1 I(yj ≥ yi)
n, (2)
with n the total number of individuals, yi and yj the multidimensional output of
respectively deputy i and j, I the indicator function, taking the value 1 if yj ≥ yi is
true, 0 otherwise. By applying the methodology, we obtain a full ranking of deputies
according to their overall parliamentary activity without imposing any weight to the
different items composing their work and allowing for full specialization. Descriptive
statistics of this measure are provided in Table 3
10See e.g. Tulkens (2006) for a discussion of domination-based indicators.
12

4.2 Measuring political competition
Various measures of political competition have been used in the literature, from the
number of parties competing for an election (Ashworth et al., 2014) to the length
a party stayed in office (Skilling and Zeckhauser, 2002). The most commonly used
measure is based on the vote-margin, computed between the vote share of the winner
and the runner-up (for instance Becker et al. (2009); De Paola and Scoppa (2011);
Padovano and Ricciuti (2009)) or between the vote share of the winner and 50%
(Sole-Olle and Viladecans-Marsal, 2012). Given the two-round system of the French
set up, a possibility could be to use the vote-margin at the decisive round. This
might however be spurious because the decisive round is not everywhere the same,
some deputies winning the elections at the first round. Using only jurisdictions where
elections needed two rounds would considerably reduce the number of observations
available, and the voter transference occurring between the two rounds could depict a
spurious degree of contestability. An illustrative example is the presidential election
of 2002, which exhibits a very similar electoral system. At the first round, Jacques
Chirac obtained only 20% of the votes, while the runner-up, the extreme-right leader
Jean-Marie Le Pen, received 17%. Both have been qualified for the second round,
and Lionel Jospin, the candidate of the Socialist Party, has been eliminated with 16%
of the votes. At the second round, Jacques Chirac won with the dictator-like score
of 82% of the votes. The vote margin at the second round would indicate a very low
degree of competition. Looking at the first-round score, with three candidates in 4
percentage points, this is obviously not the case. Our favorite measure of political
competition C is based on a Herfindahl index based on the first round, as for instance
in Larcinese (2014) and De Paola and Scoppa (2011)11. It is computed as follows:
C = 1−∑
i=1 s2i ,
where si is the vote share at the first round obtained by party i. We compute this
measure for each constituency and for each election, using data provided by the
Ministry of Interior. To ensure that a Herfindahl-based measure captures the real
degree of electoral competition, we compute for each constituency dif = Ct − Ct−1,which measures the evolution of the district competitiveness over time and report it
11Note that this measure is correlated with the vote-margins at both the first and the secondround, with a correlation coefficient of respectively -0.499 and -0.231. The three alternative measureshence describe a similar situation.
13
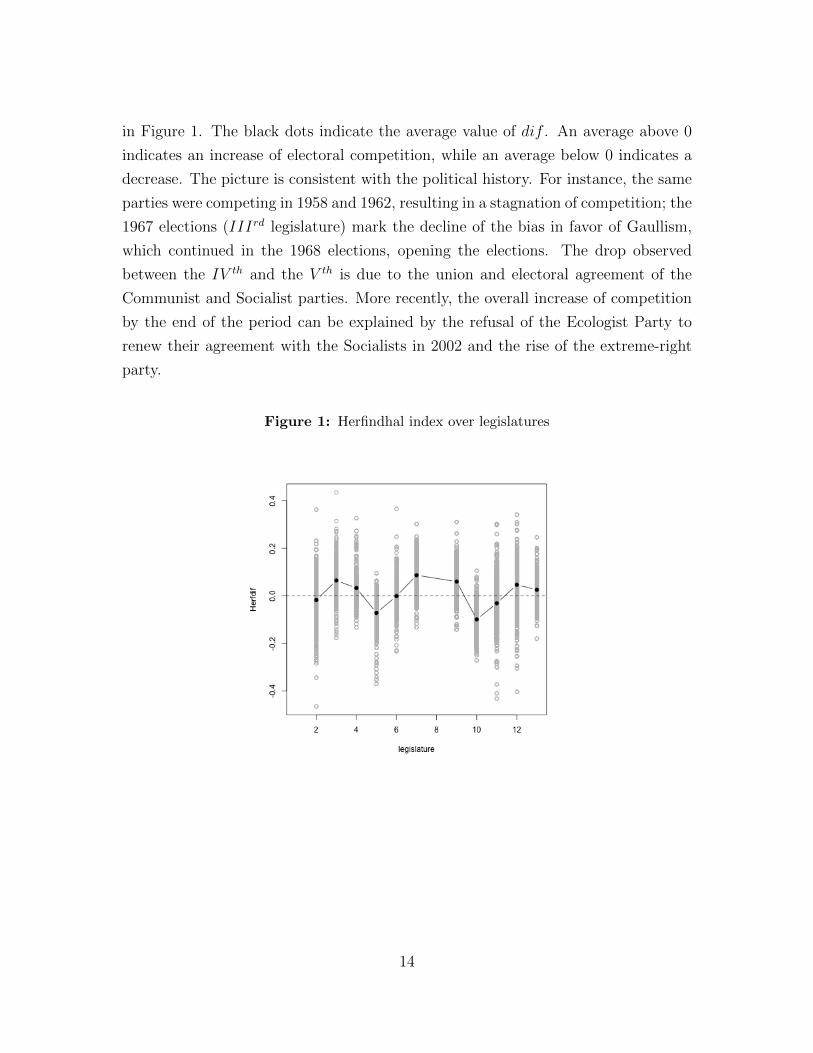
in Figure 1. The black dots indicate the average value of dif . An average above 0
indicates an increase of electoral competition, while an average below 0 indicates a
decrease. The picture is consistent with the political history. For instance, the same
parties were competing in 1958 and 1962, resulting in a stagnation of competition; the
1967 elections (IIIrd legislature) mark the decline of the bias in favor of Gaullism,
which continued in the 1968 elections, opening the elections. The drop observed
between the IV th and the V th is due to the union and electoral agreement of the
Communist and Socialist parties. More recently, the overall increase of competition
by the end of the period can be explained by the refusal of the Ecologist Party to
renew their agreement with the Socialists in 2002 and the rise of the extreme-right
party.
Figure 1: Herfindhal index over legislatures
14
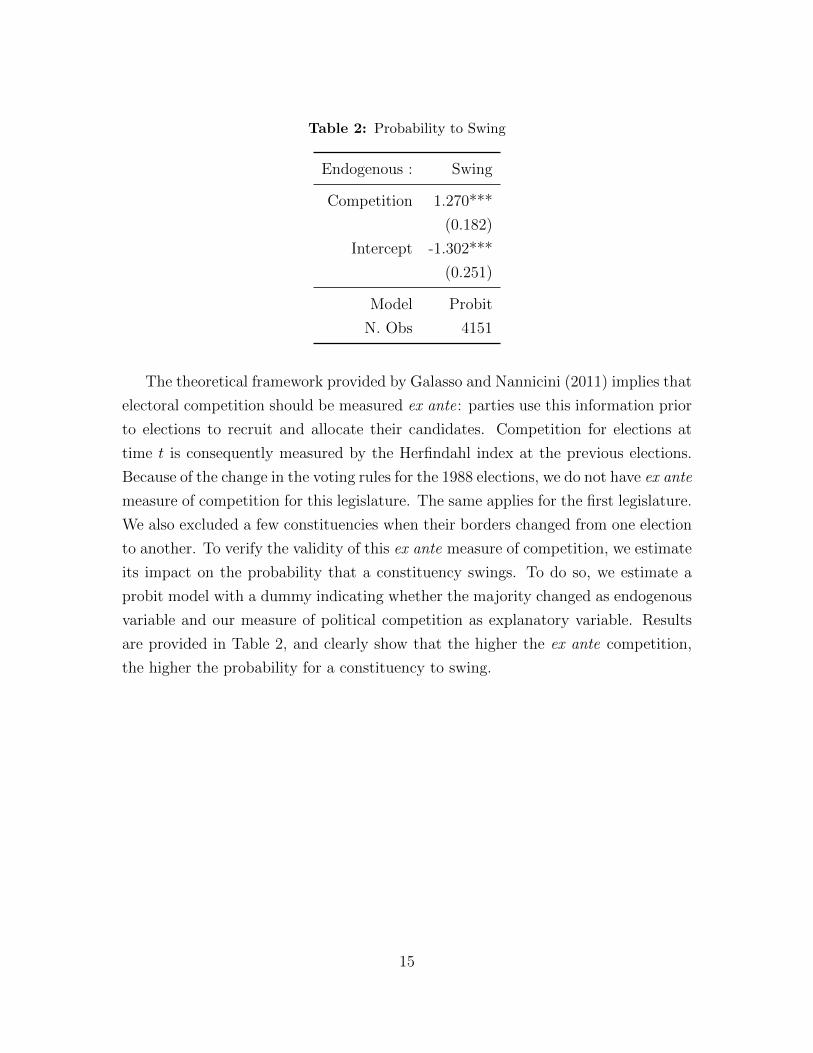
Table 2: Probability to Swing
Endogenous : Swing
Competition 1.270***
(0.182)
Intercept -1.302***
(0.251)
Model Probit
N. Obs 4151
The theoretical framework provided by Galasso and Nannicini (2011) implies that
electoral competition should be measured ex ante: parties use this information prior
to elections to recruit and allocate their candidates. Competition for elections at
time t is consequently measured by the Herfindahl index at the previous elections.
Because of the change in the voting rules for the 1988 elections, we do not have ex ante
measure of competition for this legislature. The same applies for the first legislature.
We also excluded a few constituencies when their borders changed from one election
to another. To verify the validity of this ex ante measure of competition, we estimate
its impact on the probability that a constituency swings. To do so, we estimate a
probit model with a dummy indicating whether the majority changed as endogenous
variable and our measure of political competition as explanatory variable. Results
are provided in Table 2, and clearly show that the higher the ex ante competition,
the higher the probability for a constituency to swing.
15

Table 3: Descriptive statistics
N. Observations Mean Min Max
Propositions 24011 0.602 0 34
Questions 24011 1.154 0 29
Reports 24011 0.681 0 30
Debates 24011 3.243 0 53
Productivity 24011 0.671 0.000 1.000
Competition 20868 0.724 0.206 0.945
Left 24011 0.375 0 1
Right 24011 0.549 0 1
Center 24011 0.075 0 1
Majority 24011 0.610 0 1
Group size 24011 178.5 0 363
Experience 24011 7.798 1 45
Mayor 24011 0.511 1 0
Women 24011 0.059 0 1
Age 24011 53.92 26 93
Schooling 24011 15.36 5 21
ENA 24011 0.044 0 1
Teaching 24011 0.151 0 1
Healthcare 24011 0.119 0 1
Legal 24011 0.091 0 1
Business 24011 0.076 0 1
Academic 24011 0.056 0 1
Farming 24011 0.052 0 1
Politics 24011 0.046 0 1
Engineering 24011 0.041 0 1
Blue collar 24011 0.034 0 1
16

4.3 Control variables
The dataset contains several variables that are likely to impact the parliamentary
productivity of a deputy along with electoral competition. For each deputy, two
sets of information are collected. The first set encompasses political variables. The
political membership of a deputy is introduced through a variable indicating the
political wing (Right, Center and Left), based on the political group to which the
deputy belongs. We choose this categorization instead of focusing on individual
parties to ensure a continuity over the 53 years of the sample. We also control whether
the deputy is in the majority, and the number of deputies composing the political
group. Several papers relate the size of a political group to free-riding behavior
of its members (for instance Crain and Tollison, 1982 and Rogers (2002)). The
committee of which the deputy is a member might also be important, as the agenda
may give much more importance to some issues according to the period, impacting
the amount of potential work of the deputies differently among the committees. The
experience of deputies in the Parliament, measured in years, is included as well. All
this information has been gathered from the Assemblee Nationale website12.
The second set focuses on personal variables. It encompasses civil status infor-
mation, age and gender, but also occupation before the mandate and simultaneous
mayoral mandate. We consider nine categories of occupation covering more than 65%
of the deputies: teaching, healthcare, legal, business, academic, farming, politics, en-
gineering and blue collars (industry workers). The dataset also contains the number
of years of schooling, computed as the difference between the required number of years
to receive the highest diploma obtained by a deputy and six, the age for mandatory
school. In addition, a dummy variable indicates whether a deputy is a graduate of
ENA, the prestigious high administration school from which many French politi-
cians and administrators are graduated. Finally, there is an important debate in
France about multiple-office holding and the possibility (or not) to correctly carry
out parliamentary duties. A majority of deputies also has local government man-
dates, especially mayoral responsibilities. We introduce a variable indicating whether
the deputy is simultaneously a mayor. This individual personal information comes
from various sources: the National Assembly website and archive service, Who’s Who
in France dictionaries, several issues of the Jean Maitron’s Dictionnaire Biographique
12www.assemblee-nationale.fr.
17

du Mouvement Ouvrier Francais, press articles, campaign leaflets, deputies’ websites,
biographies and memoirs (see Gavoille, 2014 for more details).
5 Nonparametric regression approach
The empirical model for deputy observations i = 1, ..., n is defined by a n × 1 de-
pendent scalar α (or α, our measure of productivity), a n× v multivariate regressor
x = (x1, ..., xv) (encompassing our measure of political competition and control vari-
ables) and an additive error ε:
αi = g(xi) + εi , with i = 1, ..., n. (3)
This model can be estimated by imposing a parametric form, such as:
αi = β0 + β1xi1 + ...+ βqxiv + εi , with i = 1, ..., n. (4)
The problem with this specification is that, if there are non-linearities or interactions
in the true model which are not parametrized, the empirical model is misspecified
and the estimated coefficients are inconsistent (Henderson and Kumbhakar, 2006).
Only little is known about the functional form linking electoral competition to qual-
ity, which is here proxied by productivity. In order to avoid to impose a priori a
functional relationship between the productivity of deputies and electoral competi-
tion and hence to stay on the safe side, we implement a nonparametric approach13.
Such an approach is especially relevant here considering the large size of our sample,
as it lets ‘the data speak freely’. A minimum of structure is therefore imposed, as a
data-driven methodology directly chooses the shape of functional form linking pro-
ductivity to the covariates. There is thus nothing constraining the points to lie along
a straight line, or along a low-order polynomial (Deaton, 1989). This in fact means
that the effect of electoral competition on political competition is allowed to differ
according to the level of electoral competition, but also that electoral competition is
allowed to freely interact with the other covariates, e.g. legislature or year effects.
The results are thus displayed in a graphical way, showing the impact of a covariate
on the dependent variable for the different values taken by this covariate.
13See Li and Racine (2007) for an extensive overview of the used kernel regression approach
18
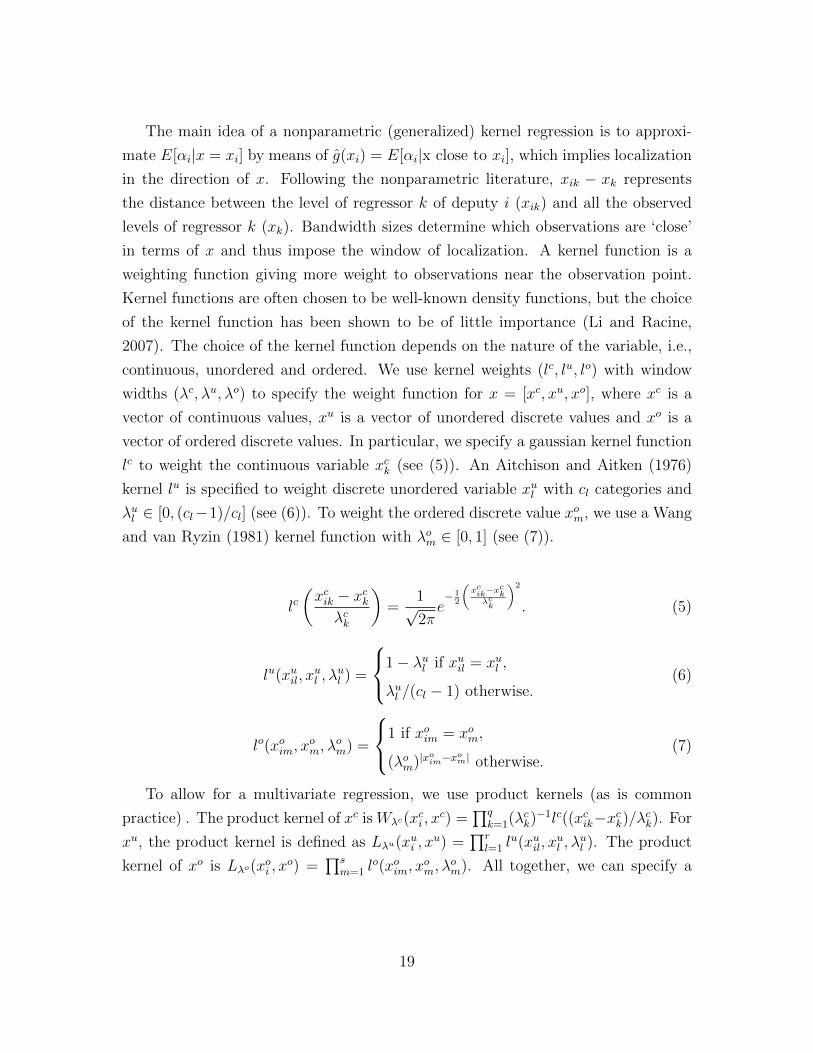
The main idea of a nonparametric (generalized) kernel regression is to approxi-
mate E[αi|x = xi] by means of g(xi) = E[αi|x close to xi], which implies localization
in the direction of x. Following the nonparametric literature, xik − xk represents
the distance between the level of regressor k of deputy i (xik) and all the observed
levels of regressor k (xk). Bandwidth sizes determine which observations are ‘close’
in terms of x and thus impose the window of localization. A kernel function is a
weighting function giving more weight to observations near the observation point.
Kernel functions are often chosen to be well-known density functions, but the choice
of the kernel function has been shown to be of little importance (Li and Racine,
2007). The choice of the kernel function depends on the nature of the variable, i.e.,
continuous, unordered and ordered. We use kernel weights (lc, lu, lo) with window
widths (λc, λu, λo) to specify the weight function for x = [xc, xu, xo], where xc is a
vector of continuous values, xu is a vector of unordered discrete values and xo is a
vector of ordered discrete values. In particular, we specify a gaussian kernel function
lc to weight the continuous variable xck (see (5)). An Aitchison and Aitken (1976)
kernel lu is specified to weight discrete unordered variable xul with cl categories and
λul ∈ [0, (cl−1)/cl] (see (6)). To weight the ordered discrete value xom, we use a Wang
and van Ryzin (1981) kernel function with λom ∈ [0, 1] (see (7)).
lc(xcik − xckλck
)=
1√2πe− 1
2
(xcik−x
ck
λck
)2
. (5)
lu(xuil, xul , λ
ul ) =
1− λul if xuil = xul ,
λul /(cl − 1) otherwise.(6)
lo(xoim, xom, λ
om) =
1 if xoim = xom,
(λom)|xoim−xom| otherwise.
(7)
To allow for a multivariate regression, we use product kernels (as is common
practice) . The product kernel of xc is Wλc(xci , x
c) =∏q
k=1(λck)−1lc((xcik−xck)/λck). For
xu, the product kernel is defined as Lλu(xui , xu) =
∏rl=1 l
u(xuil, xul , λ
ul ). The product
kernel of xo is Lλo(xoi , x
o) =∏s
m=1 lo(xoim, x
om, λ
om). All together, we can specify a
19
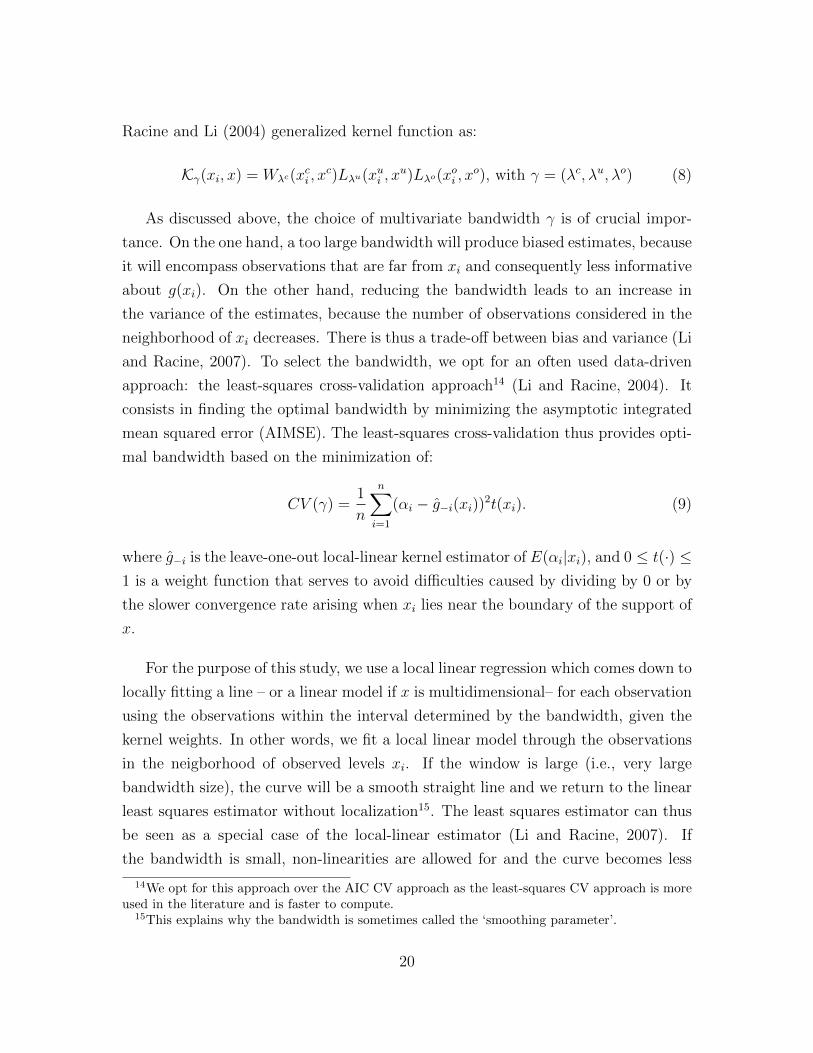
Racine and Li (2004) generalized kernel function as:
Kγ(xi, x) = Wλc(xci , x
c)Lλu(xui , xu)Lλo(x
oi , x
o), with γ = (λc, λu, λo) (8)
As discussed above, the choice of multivariate bandwidth γ is of crucial impor-
tance. On the one hand, a too large bandwidth will produce biased estimates, because
it will encompass observations that are far from xi and consequently less informative
about g(xi). On the other hand, reducing the bandwidth leads to an increase in
the variance of the estimates, because the number of observations considered in the
neighborhood of xi decreases. There is thus a trade-off between bias and variance (Li
and Racine, 2007). To select the bandwidth, we opt for an often used data-driven
approach: the least-squares cross-validation approach14 (Li and Racine, 2004). It
consists in finding the optimal bandwidth by minimizing the asymptotic integrated
mean squared error (AIMSE). The least-squares cross-validation thus provides opti-
mal bandwidth based on the minimization of:
CV (γ) =1
n
n∑i=1
(αi − g−i(xi))2t(xi). (9)
where g−i is the leave-one-out local-linear kernel estimator of E(αi|xi), and 0 ≤ t(·) ≤1 is a weight function that serves to avoid difficulties caused by dividing by 0 or by
the slower convergence rate arising when xi lies near the boundary of the support of
x.
For the purpose of this study, we use a local linear regression which comes down to
locally fitting a line – or a linear model if x is multidimensional– for each observation
using the observations within the interval determined by the bandwidth, given the
kernel weights. In other words, we fit a local linear model through the observations
in the neigborhood of observed levels xi. If the window is large (i.e., very large
bandwidth size), the curve will be a smooth straight line and we return to the linear
least squares estimator without localization15. The least squares estimator can thus
be seen as a special case of the local-linear estimator (Li and Racine, 2007). If
the bandwidth is small, non-linearities are allowed for and the curve becomes less
14We opt for this approach over the AIC CV approach as the least-squares CV approach is moreused in the literature and is faster to compute.
15This explains why the bandwidth is sometimes called the ‘smoothing parameter’.
20

smooth. We opt for a local-linear estimator because the local-linear regression has
better boundary properties than the local-constant regression (Hall et al., 2007).
The local-linear estimator estimates a local linear relation for each observation
point xi by obtaining a and b in Equation (10):
min{a,b}
n∑i=1
(αi − a− (xi − x)′b)2Kγ(xi, x). (10)
Note that this equation describes a weighted least squares regression of αi on
(xi − x) with weights Kγ(xi, x). That is, the estimator runs for each xi a regression
with weights that are smaller for observations that are far from xi. We use xi − xrather than xi as regressors in order to define the intercept ai as g(xi) = E[αi|xi = x].
That is, g(xi) is the observation-specific constant term of the regression equation.
6 Regression results
6.1 Base model
The base model uses our measure of productivity, which is discussed in detail in
section 4.1, as the endogenous variable, and includes as explanatory variables the
measure of electoral competition, the set of political variables (experience, mayor,
committee, group size, majority and the political wing right, center and left) and
the set of personal variables (age, gender, occupation, schooling and ENA). We
introduce an ordered discrete variable representing the successive legislatures to take
into account the political context and the evolution of time. The model also includes
an unordered discrete variable to capture potential regional disparities as well as
another variable indicating the first year of a legislature, since these years are not
complete working years. To check the sensitivity of the results, we run the same
model substituting the ordered variable legislature by an ordered variable taking
into account years instead of legislatures (see Appendix A and B).
We provide in Figure 2 the nonparametric results concerning the effect of electoral
competition by showing the estimated level of productivity (bounded between 0 and
1) as a function of the degree of competition, holding the other regressors equal to,
21

respectively, the median for continuous variables and modus for discrete variables,
using the V I th legislature (the median one) as the reference legislature16. The dotted
lines represent the 95% confidence intervals. First of all, electoral competition does
have a positive effect on productivity, in accordance with the theoretical prediction
of Galasso and Nannicini (2011): the tighter the ex ante competition, the more
productive the elected official will be. Everything else equal, a deputy elected in
the ex ante most contested district is estimated to reach a productivity close to 0.8,
while if she is elected in a safe district her productivity is estimated to be at most
0.6. This means that the productivity of deputies can vary by up to 30% depending
on the degree of contestability. The relationship is found to be linear. It suggests
that there is no threshold above which electoral competition becomes harmful for
political selection. This result is confirmed if we replace the legislature variables by
year effects, as shown in Appendix A.
As shown in the lower part of Figure 2, the general productivity increased over
the legislatures, suggesting an increase of the quality of deputies over time. An
alternative explanation of this increase in productivity might be an increase of the
legislative production of the Parliament. Since the government controls the agenda
(see Padovano and Gavoille, 2014), if the government imposes an increased number of
bills on the agenda, deputies might automatically have more activity. We document
in Figure 3 that the average number of legislative output only slightly increases over
time, while the average productivity grew at a much higher pace, increasing from
roughly 0.5 to 0.8. In addition, we document that the share of “ghost” deputies, i.e.
deputies who do not have any recorded activity reduced with 75% in fifty years.
16In addition, the use of a standard linear parametric model estimated via OLS reveals a sig-nificant positive relationship between electoral competition and productivity. Results are availableupon request.
22

Figure 2: Baseline model results
Effect of Competition
●●
●●
●●
●●
●●
●●
●●
●●
●●
●●
●●
●●
●
0.2 0.4 0.6 0.8
0.4
0.5
0.6
0.7
0.8
Competition
Con
ditio
nal F
it
(a) Full sample
●
●
●
●
●
●
●
●
●
●
●
●
●
●
●
●
●
●
●
●
●
●
●
●
●
0.3 0.4 0.5 0.6 0.7 0.8 0.9
0.3
0.4
0.5
0.6
0.7
0.8
0.9
Competition
Con
ditio
nal F
it
(b) Freshmen sample
Conditional productivity over legislatures
●
●
●
●● ●
●
●
●
●
●
2 4 6 8 10 12
0.65
0.70
0.75
0.80
Legislature
Con
ditio
nal F
it
(c) Full sample
●●
●
●
●●
●
●
●
●
●
2 4 6 8 10 12
0.60
0.65
0.70
0.75
0.80
Legislature
Con
ditio
nal F
it
(d) Freshmen sample
23

Figure 3: The increase of deputies’ productivity over time
1960 1970 1980 1990 2000 2010
4060
80100
120
140
160
Year
Laws
(a) Legislative production
1960 1970 1980 1990 2000 2010
0.3
0.4
0.5
0.6
0.7
0.8
Year
Productivity
(b) Average productivity
1960 1970 1980 1990 2000 2010
0.1
0.2
0.3
0.4
0.5
Year
No
prod
uctio
n
(c) Share of deputies who did
not produce anything
We present the results of the other explanatory variables in Table 4. For continu-
ous variables, we report the marginal effect at the median, the minimum the second
and third quartile and the maximum value. For categorical variables, we report the
conditional fit according to the value taken by the variable. Values in brackets are
the 95% confidence intervals. In addition, we also provide the R-squared statistic,
which has the same interpretation as in the parametric framework. It shows the
goodness-of-fit of the model.
In line with Besley et al. (2011), who show that more educated leaders are asso-
ciated with better economic outcome, we find that schooling is positively correlated
with our measure of quality. But the effect of an additional year of schooling is
only important for low levels of schooling. There is also an interesting non-linearity
in the impact of age: if one additional year does not significantly impact deputies’
productivity for young deputies, the impact becomes significant starting with the
median age, and an extra year has an increasing negative impact on productivity.
The impact of experience on productivity is negative and not linear17: a marginal
year of experience only matters for intermediate levels of experience. Finally, we do
not find that group size exerts any effect on productivity, contrary to the free-riding
in legislature hypothesis.
Concerning categorical variables, results suggest that deputies who are simul-
taneously mayors tend to have a lower level of productivity, even if this is not a
17The correlation coefficient between age and experience is mild (0.49).
24
significant effect. This result is consistent with Bach (2011), who fails to establish a
causal impact of multiple office-holding on parliamentary activity. The three follow-
ing variables, i.e. ENA, Majority and Sex, do not turn significant either. Similarly,
we cannot say that deputies of a specific political group group tend to be more
productive than others.
25

Table 4: Control variables - Full sample
Median Min. 25% 75% Max.
Gradients of continuous variables
Schooling 3.266* 16.534* -1.49 0.828 0.568
[1.303,5.369] [13.739,20.352] [-5.436,2.513] [-0.003,1.669] [-0.867,2.24]
Age -0.383* 0.093 -0.003 -0.977* -1.378*
[-0.583,-0.19] [-0.174,0.332] [-0.169,0.151] [-1.372,-0.592] [-1.98,-0.787]
Experience -0.391* -0.126 -0.295* -0.389* -0.301
[-0.712,-0.09] [-0.4,0.119] [-0.59,-0.028] [-0.732,-0.048] [-0.66,0.082]
Group size 0.005 0.005 0.005 0.005 0.005
[-0.005,0.017] [-0.005,0.017] [-0.005,0.017] [-0.005,0.017] [-0.005,0.017]
Conditional fits of categorical variables
0 1
Mayor 0.808 0.798
[0.792,0.826] [0.783,0.813]
ENA 0.798 0.797
[0.784,0.812] [0.784,0.812]
Majority 0.798 0.798
[0.784,0.812] [0.784,0.812]
Sex 0.798 0.802
[0.784,0.812] [0.788,0.817]
First year 0.798 0.72*
[0.785,0.812] [0.699,0.742]
Left Neutral Right
Left-Right 0.798 0.777 0.793
[0.783,0.812] [0.761,0.794] [0.779,0.806]
Region dummies Included
Occupation dummies Included
Committee dummies Included
R-squared 0.730
Observations 20867
6.2 Controlling for reverse causality: the freshman subsam-
ple
The results from the base model might suffer from an endogeneity problem. In the
case of deputies running for reelection, the lagged measure of competition might be
26

influenced by the unobservable characteristics of those deputies. As they were already
in office and taking part in the political competition, their personal characteristics
might have affected the degree of competition, implying a potential reverse causality
issue: it is because ‘good’ politicians are running in a district that competition is
tight, and not the opposite as we claim.
To mitigate this issue and considering the lack of instrumental variables available,
we restrict our sample to deputies being elected for the first time, for a total of
more than 7,500 observations. Results are presented in Figure 2 and Table 4. The
positive and linear relationship between electoral competition and productivity still
holds in this context. Despite the reduced number of observations in the sample, the
confidence intervals are much narrower, reinforcing the relationship between electoral
competition and productivity. The increasing productivity over time is also observed
in this subsample, even with the model including year dummies instead of legislature
ones (see Appendix A).
Concerning control variables, most of the results obtained with the whole sample
are confirmed. Schooling is again strongly and positively correlated with produc-
tivity, and age has a negative increasing impact for the oldest deputies. Experience
might in very few cases take high values since we consider the first mandate of a
deputy after his/her election, and some of them previously worked in the Parliament
as substitutes. The size of the political group is negatively correlated with pro-
ductivity for small groups, but its impact becomes positive as the size of the group
increases. For the categorical variables, all the sign of correlations are preserved with
respect to the full sample. All these results are robust to the alternative specification
which replaces the legislature variable by a year variable (see Appendix C).
27
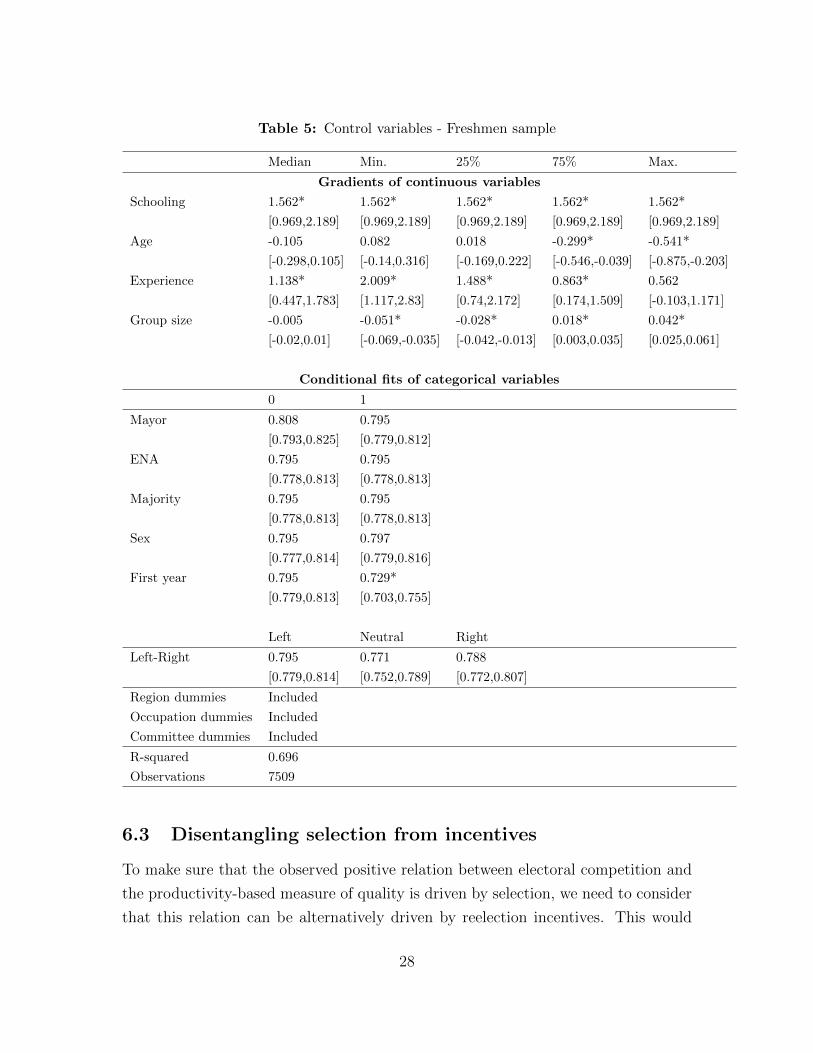
Table 5: Control variables - Freshmen sample
Median Min. 25% 75% Max.
Gradients of continuous variables
Schooling 1.562* 1.562* 1.562* 1.562* 1.562*
[0.969,2.189] [0.969,2.189] [0.969,2.189] [0.969,2.189] [0.969,2.189]
Age -0.105 0.082 0.018 -0.299* -0.541*
[-0.298,0.105] [-0.14,0.316] [-0.169,0.222] [-0.546,-0.039] [-0.875,-0.203]
Experience 1.138* 2.009* 1.488* 0.863* 0.562
[0.447,1.783] [1.117,2.83] [0.74,2.172] [0.174,1.509] [-0.103,1.171]
Group size -0.005 -0.051* -0.028* 0.018* 0.042*
[-0.02,0.01] [-0.069,-0.035] [-0.042,-0.013] [0.003,0.035] [0.025,0.061]
Conditional fits of categorical variables
0 1
Mayor 0.808 0.795
[0.793,0.825] [0.779,0.812]
ENA 0.795 0.795
[0.778,0.813] [0.778,0.813]
Majority 0.795 0.795
[0.778,0.813] [0.778,0.813]
Sex 0.795 0.797
[0.777,0.814] [0.779,0.816]
First year 0.795 0.729*
[0.779,0.813] [0.703,0.755]
Left Neutral Right
Left-Right 0.795 0.771 0.788
[0.779,0.814] [0.752,0.789] [0.772,0.807]
Region dummies Included
Occupation dummies Included
Committee dummies Included
R-squared 0.696
Observations 7509
6.3 Disentangling selection from incentives
To make sure that the observed positive relation between electoral competition and
the productivity-based measure of quality is driven by selection, we need to consider
that this relation can be alternatively driven by reelection incentives. This would
28

mean that deputies elected in highly contested districts reach a higher productivity in
order to ‘look good’ to voters and increase their reelection probability. As explained
in Section 3, the organization of the political group limits this alternative explana-
tion since our measure of productivity does not only depend on effort. To further
rule out this mechanism, we proceed as Galasso and Nannicini (2011) by including
in the model a measure of the future degree of competition and using a subsample
containing the last year of legislatures to account for the fact that incentives are
at their maximum during the preelectoral year. We further restrict the sample to
legislatures during which an exogenous shock significantly impacted the degree of
competition for the upcoming elections (detailed below). Finally, only deputies run-
ning for reelection face such incentives. Deputies not running for legislative elections
are hence excluded.
The future degree of electoral competition is approximated by the Herfindahl in-
dex of the upcoming elections. We gather additional information about the decision
to run again or not from the official lists of candidates provided by the Ministry of
Interior. This information is only available for the period 1988-201218. During this
period, we identify two exogenous shocks that are likely to have affected the degree
of competition in all constituencies. First, the 1993 elections have been held just
after a series of political scandals, involving the President of the National Assembly
as well as ministers, provoking a collapse of the leftist coalition, while disagreement
concerning the Maastricht treaty divided the right wing (Chevallier et al., 2012).
Second, the creation of the UMP for the 2002 presidential election, aiming at unify-
ing the right wing, drastically modified the landscape of French politics (Chevallier
et al., 2012). Focusing on the deputies running for reelection in 1992 and 2001 yields
851 observations.
Results for ex ante competition and future competition are provided in Figure
419. They indicate that even when we control for reelection incentives, the ex ante
competition is still positively correlated with productivity. On the other hand, the
contestability of the upcoming elections is even negatively related to the productivity
18The name of candidates do not appear on election results provided by the Ministry of Interiorbefore this date, only the name of the party. It is thus not possible to know if a deputy who leaveshis/her seat ran for reelection and lost or decided not to run.
19We present here only results for these two variables. Results for the other explanatory variablesremain stable, and are available upon request.
29

in the last year of a legislature. This can be explained by the fact that candidates
expecting a tight competition spend more time campaigning in their constituency
during the last year of a legislature ceteris paribus20
Figure 4: Reelection incentives
●
●
9.0 9.5 10.0 10.5 11.0
−1.
0−
0.5
0.0
0.5
1.0
1.5
Legislature
Gra
dien
t of C
ompe
titio
n
(a) Ex ante competition
●
●
9.0 9.5 10.0 10.5 11.0
−2
−1
01
2
Legislature
Gra
dien
t of C
ompe
titio
n in
nex
t per
iod
(b) Future competition
6.4 Variation of the relationship over time
An interesting feature of the nonparametric approach is that it allows for interactions
between variables in the most flexible way, enabling us to observe how the positive
relationship between electoral competition and political selection evolves over time.
In other words we can test the validity of the Galasso and Nannicini (2011) model
in a temporal perspective. Figure 5 shows the impact of competition depending
on legislatures using the whole sample. The dotted lines indicate the confidence
interval at the 95% level. It indicates a clear inverse-U shape: the effect of electoral
competition sharply increased till the IX th legislature, i.e., the 1988 elections, but it
has decreased since then, and it has become insignificant since the XI th legislature.
When restricted to the freshmen subsample, results are similar. The inverse-U
shape is even clearer when we replace the legislature variable by the year variable
20As the number of observations is relatively small for a nonparametric investigation, we imple-mented a GAM semiparametric model as well as a standard parametric model estimated with OLS.Both indicate a significant positive impact of ex ante competition together with a negative impactof future competition. Results are available upon request.
30
for the whole sample. Electoral competition exerts its highest impact in the 80’s,
which corresponds to the period between the V II th and the IX th legislatures. For
the freshmen deputies in this setting, the results are not as clear, but the highest
impact of electoral competition is also achieved in the 80’s, in accordance with the
previous results. In these two settings, competition never plays a negative role, but
as previously, the effect of ex ante competition turns insignificant in the most recent
years.
To explain this pattern, we present three elements21. As explained in Section 3,
the 1980s were a turning point. First, the relative convergence of political parties on
the left/right scale is supposed to have increased the volatility of voters. If at first
sight it indicates an increase in the share of neutral voters, hence intensifying the
relationship between competition and productivity, this is however not necessarily
the case. Instead of moving from partisanship to neutrality, it is possible that sup-
porters of a party A at election t turn into supporters of party B at election t + 1.
Partisans disappointed by the behavior of their party while in office might provide an
unconditional support to the competing party at the next election. This is consistant
with the fact that not any party succeeded to win two national elections in a row
since the 80’s. This mechanism might moreover have hampered the efficiency of the
candidate allocation process of political parties, as suggested by Knapp (2002).
Second, the selection mechanism might have been further weakened due to both
the move toward the decentralization of the selection process (Hazan and Rahat,
2010) and to the shrinking pool of potential candidates due to the decreasing party
membership (Knapp, 2002). These two phenomena also tend to drift away the con-
text from the theoretical model, providing support to the mechanism that it de-
scribes. Third, the ‘bipolar quadrille’, i.e. the context in the 70’s during which the
two political wings were each represented by two parties of equal importance, ended
with the election of Francois Mitterrand in 1981, slightly shifting away the political
context from the strict two-party competition described in the theoretical model. It
is thus interesting to note that it is during this particular situation that the intensity
of the competition/productivity relation reached its maximum.
21Formally testing the relevance of these explanations is out of the scope of this paper. Ratherwe aim at providing some direction for future work.
31

Figure 5: Effect of competition over time
Effect of Competition over legislatures
●
●●
●
●
●
●
●
●
●
●
2 4 6 8 10 12
−0.
20.
00.
20.
40.
60.
8
Legislature
Gra
dien
t of C
ompe
titio
n
(a) Full sample
●
●
●
●
●
●
●
●
●
●
●
2 4 6 8 10 12
−0.
50.
00.
51.
0
Legislature
Gra
dien
t of C
ompe
titio
n
(b) Freshmen sample
Effect of Competition over years
●
●
●
●
●
●
●
●
●
●
●
●
●●
●
●
●●
●● ●
●● ●
●●
●●
●
●
●
●
●● ● ● ●
●
●
●●
● ●●
● ●
●
1970 1980 1990 2000 2010
−1.
0−
0.5
0.0
0.5
Year
Gra
dien
t of C
ompe
titio
n
(c) Full sample
●●
●
●
●
●●
● ● ●
●●
●●
●
●
●●
●
●●
● ●
●
● ● ● ●
●
●
●
●
●
●●
● ● ●
●
●
●●
●
●
●●
●
1970 1980 1990 2000 2010
−0.
50.
00.
51.
0
Year
Gra
dien
t of C
ompe
titio
n
(d) Freshmen sample
7 Conclusion
Since politicians may differ in their quality, one needs to identify the drivers of
an efficient selection mechanism. This paper investigated the relationship between
electoral competition and political selection. To this purpose we constructed an
original dataset encompassing detailed information about more than 2,400 deputies
of the French Assemblee Nationale from 1958 to 2012, including their individual
work within the Parliament as well as personal characteristics on a yearly basis.
32
Our first task has been to develop a measure of quality based on the parliamen-
tary activity of each deputy. To do so, we used a robust nonparametric efficiency
method based on dominance, the α-efficiency estimator. Because individual parlia-
mentary productivity reflects both effort and competence, this measure of quality is
much more precise that what has previously been used in the literature. We then
constructed a measure of electoral competition based on a Herfindahl index, fitting
both the French institutional and political framework and the theoretical framework
provided by Galasso and Nannicini (2011).
We used a nonparametric kernel regression model allowing for non-linearity and
interaction effects, providing full flexibility. The estimated models, controlling for
various factors likely to influence parliamentary productivity, point out a clear pos-
itive relationship between electoral competition and political selection. Deputies
elected in a priori contested districts tend to perform better than others. This result
is robust to alternative model specifications. To ensure that this finding is driven by
a selection and not by a reelection incentive effect, we control in a separate analysis
for reelection perspectives. Interestingly and as suggested by the literature, we also
obtain a positive effect of education.
The nonparametric approach allows us to observe how the relationship between
electoral competition and political selection evolved over time. Since ideologies tend
to convergence over time, we expected the relationship to gain in intensity. This is
however not the case. The impact of competition increased till the 80’s, but contin-
uously decreases since then, even if it remains positive. This opens the door for a
vast research agenda. The literature identified a few other factors impacting political
selection, such as politicians’ wage. Our results however indicate that drivers of an
efficient selection mechanism are not necessarily stable over time. Both theoretical
and empirical work is needed to better understand under which conditions to enhance
the functioning of political selection drivers.
Acknowledgements
We would like to thank Elise Brezis, Laurens Cherchye, Bram De Rock, Fabio
Padovano and participants at the seminar at the University of Leuven in Kortrijk,
33

at the European Public Choice Society meeting 2015 and at the annual meeting
of the French Economic Association 2015 for their insightful comments and sugges-
tions. We also thank Dominique Angles d’Auriac from the Archive department of
the Assemblee Nationale. The usual caveats apply.
References
Acemoglu, D., Egorov, G., Sonin, K., 2010. Political selection and persistence of bad
government. Quarterly Journal of Economics 125 (4), 1511–1575.
Aitchison, J., Aitken, C. G. G., 1976. Multivariate binary discrimination by kernel
method. Biometrika 63 (3), 413–420.
Aragon, Y., Daouia, A., Thomas-Agnan, C., 2006. Efficiency measurement: a non-
parametric approach. Annales d’economie et de statistique 82, 217–242.
Ashworth, J., Geys, B., Heyndels, B., Wille, F., 2014. Competition in the political
arena and local government performance. Applied Economics 46 (19), 2264–2276.
Bach, L., 2011. Should multiple office-holding be forbidden to politicians? Evidence
from France. Mimeo working paper.
Baltrunaite, A., Bello, P., Casarico, A., Profeta, P., 2014. Gender quotas and the
quality of politicians. Journal of Public Economics 118, 62–74.
Becker, G. S., 1983. A theory of competition among pressure groups for political
influence. Quarterly Journal of Economics 97, 371–400.
Becker, J., Peichl, A., Rincke, J., 2009. Politicians’ outside earning and electoral
competition. Public Choice 140, 379–394.
Benabou, R., Tirole, J., 2003. Intrinsic and extrinsic motivation. Review of Economic
Studies 70 (3), 469–520.
Besley, T., 2004. Paying politicians: theory and evidence. Journal of the European
Economic Association 2 (2-3), 193–215.
Besley, T., 2006. Principled agents? The political economy of good government.
Oxford University Press.
34

Besley, T., Coate, S., 1997. An economic model of representative democracy. Quar-
terly Journal of Economics, 85–114.
Besley, T., Folke, O., Persson, T., Rickne, J., 2013. Gender quotas and the crisis of
the mediocre man: Theory and evidence from sweden. IFN Working Paper 985.
Besley, T., Montalvo, J., Reynal-Querol, M., 2011. Do educated leaders matter?
Economic Journal 121, 205–227.
Besley, T., Pande, R., Rao, V., 2005. Political selection and the quality of govern-
ment: Evidence from south india. PEPP/8, Suntory and Toyota International
Centres for Economics and Related Disciplines, London School of Economics and
Political Science, London, UK.
Besley, T., Persson, T., Sturm, D., 2010. Political competition, policy and growth:
Theory and evidence from the us. Review of Economic Studies 77, 1329–1352.
Besley, T., Preston, I., 2007. Electoral bias and policy choice: Theory and evidence.
Quarterly Journal of Economics 122 (4), 1473–1510.
Best, H., Cotta, M., 2000. Parliamentary Representatives in Europe 1848- 2000.
Oxford University Press.
Caillaud, B., Tirole, J., 2002. Parties as political intermediaries. Quarterly Journal
of Economics 117 (4), 1453–1489.
Carrillo, J. D., Mariotti, T., 2001. Electoral competition and politicians turnover.
European Economic Review 45, 1–25.
Cazals, C., Florens, J. P., Simar, L., 2002. Nonparametric frontier estimation: A
robust approach. Journal of Econometrics 106 (1), 1–25.
Chevallier, J. J., Carcassonne, G., Duhamel, O., 2012. Histoire de la Ve Republique:
1958-2012. Dalloz.
Crain, M. W., Tollison, R. D., 1982. Team production in political majorities. Mi-
cropolitics 2, 111–121.
35
Daraio, C., Simar, L., 2007. Advanced robust and nonparametric methods in ef-
ficiency analysis: methodology and applications. Springer Science and Business
Media.
Davin, J. P., 1985. Les groupes parlementaires. Pouvoirs 34, 23–29.
De Paola, M., Scoppa, V., 2011. Political competition and politician quality: Evi-
dence from italian municipalities. Public Choice 148, 547–559.
Deaton, A., 1989. Rice prices and income distribution in thailand: a non-parametric
analysis. The Economic Journal, 1–37.
Dreher, A., Lamla, M., Lein, S., Somogyi, F., 2009. The impact of political leaders’
profession and education on reforms. Journal of Comparative Economics 37, 169–
193.
Drummond, A. J., 2006. Electoral volatility and party decline in western democracies:
1970–1995. Political Studies 54 (3), 628–647.
Duverger, M., 1973. Un quadrille bipolaire. Le Monde 15/03/1973.
Francois, A., Weill, L., 2014. Le cumul de mandats locaux affecte-t-il l’activite des
deputes francais? Revue economique 65 (6), 881–906.
Fried, H., Lovell, C., Schmidt, S., 2008. Efficiency and productivity. The measure-
ment of productive efficiency and productivity growth, 3–91.
Gagliarducci, S., Nannicini, T., 2013. Do better paid politicians perform better?
disentangling incentives from selection. Journal of the European Economic Asso-
ciation 11 (2), 369–398.
Galasso, V., Nannicini, T., 2011. Competing on good politicians. American Political
Science Review 105 (1), 79–99.
Gavoille, N., 2014. The deputies of the fifth french republic: a database (1958-2012).
Condorcet Center for Political Economy working paper.
Green, J., 2007. When voters and parties agree: Valence issues and party competi-
tion. Political Studies 55, 629–655.
36

Hall, P., Li, Q., Racine, J. S., 2007. Nonparametric estimation of regression functions
in the presence of irrelevant regressors. Review of Economics and Statistics 89 (4),
784–789.
Hazan, R. Y., Rahat, G., 2010. Democracy within parties. Oxford University Press.
Henderson, D. J., Kumbhakar, S. C., 2006. Public and private capital productivity
puzzle: A nonparametric approach. Southern Economic Journal 73 (1), 219–232.
Jones, B., Olken, B., 2005. Do leaders matter? National leadership and growth since
world war II. Quarterly Journal of Economics 120 (3), 835–864.
Knapp, A., 2002. Political parties in advanced industrial democracies. Oxford, Ch.
France: Never a golden age, pp. 107–150.
Knapp, A., Wright, V., 2001. The government and politics of France. Routledge.
Kotakorpi, K., Poutvaara, P., 2011. Pay for politicians and candidate selection: An
empirical analysis. Journal of Public Economics 95, 877–885.
Larcinese, V., 2014. Enfranchisement and representation: Evidence from the in-
troduction of quasi-universal suffrage in italy. Innocenzo Gasparini Institute for
Economic Research working paper series.
Lewis-Beck, M., 1997. Who’s the chef? Economic voting under a dual executive.
European Journal of Political Research 31 (3), 315–325.
Li, Q., Racine, J., 2004. Cross-validated local linear nonparametric regression. Sta-
tistica Sinica 14 (2), 485–512.
Li, Q., Racine, J., 2007. Nonparametric Econometrics: Theory and practice. Prince-
ton University Press.
Lundell, K., 20014. Determinants of candidate selection: The degree of centralization
in comparative perspective. Party Politics 10 (1), 25–47.
Mattozzi, A., Merlo, A., 2007. The transparency of politics and the quality of politi-
cians. American Economic Review 97 (2), 311–315.
37

Mattozzi, A., Merlo, A., 2008. Political careers or career politicians? Journal of
Public Economics 92 (3-4), 597–608.
Mattozzi, A., Merlo, A., 2010. Mediocracy. PIER working paper 13-010.
Melyn, W., Moesen, W., 1991. Towards a synthetic indicator of macroeconomic
performance: Unequal weighting when limited information is available. Public
Economics Research Paper 17, Centre for Economic Studies, Leuven.
Messner, M., Polborn, M., 2004. Paying politicians. Journal of Public Economics 88,
2423–2445.
Osborne, M. J., Slivinski, A., 1996. A model of political competition with citizen-
candidates. Quarterly Journal of Economics, 65–96.
Padovano, F., Gavoille, N., 2014. Legislative cycles in semipresidential systems. Con-
dorcet Center for Political Economy working paper.
Padovano, F., Ricciuti, R., 2009. Political competition and economic performance:
Evidence from italian regions. Public Choice 138, 263–277.
Poutvaara, P., Takalo, T., 2007. Candidate quality. International Tax and Public
Finance 14, 7–27.
Racine, J., Li, Q., 2004. Nonparametric estimation of regression functions with both
categorical and continuous data. Journal of Econometrics 119 (1), 99–130.
Rogers, J. R., 2002. Free riding in state legislature. Public Choice 113, 59–76.
Shugart, M. S., 2005. Semi-presidential systems: Dual executive and mixed authority
patterns. French Politics 3, 323–351.
Skilling, D., Zeckhauser, R. J., 2002. Political competition and debt trajectories in
japan and the oecd. Japan and the World Economy 14, 121–135.
Sole-Olle, A., 2006. The effects of party competition on budget outcomes: Empirical
evidence from local government in spain. Public Choice 126, 145–176.
Sole-Olle, A., Viladecans-Marsal, E., 2012. Lobbying, political competition, and local
land supply: Recent evidence from spain. Journal of Public Economics, 10–19.
38

Stigler, G., 1972. Economic competition and political competition. Public Choice 13,
91–106.
Thiebault, J. L., 1988. Candidate selection in perspective: The secret garden of
politics. Sage, Ch. France: The impact of electoral system change, pp. 73–95.
Thiebault, J. L., Dolez, B., 1988. Parliamentary party groups in European democra-
cies. Routledge, Ch. Parliamentary parties in the French Fifth Repubic, pp. 57–70.
Tulkens, H., 2006. Public goods, environmental externalities and fiscal competition.
Springer US, Ch. Efficiency Dominance Analysis (EDA): Basic Methodology, pp.
431–442.
Wang, M. C., van Ryzin, J., 1981. A class of smooth estimators for discrete-
distributions. Biometrika 68 (1), 301–309.
Ysmal, C., 1994. The history of electoral studies in france. European Journal of
Political Research 25 (3), 367–385.
39
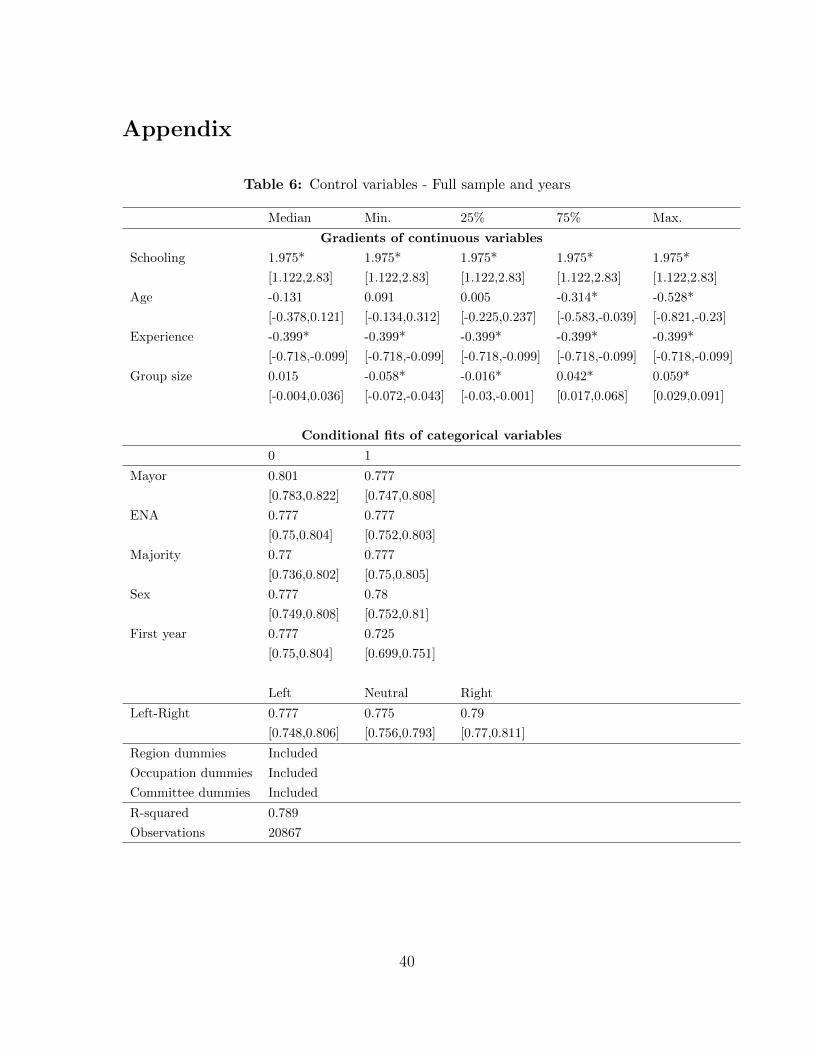
Appendix
Table 6: Control variables - Full sample and years
Median Min. 25% 75% Max.
Gradients of continuous variables
Schooling 1.975* 1.975* 1.975* 1.975* 1.975*
[1.122,2.83] [1.122,2.83] [1.122,2.83] [1.122,2.83] [1.122,2.83]
Age -0.131 0.091 0.005 -0.314* -0.528*
[-0.378,0.121] [-0.134,0.312] [-0.225,0.237] [-0.583,-0.039] [-0.821,-0.23]
Experience -0.399* -0.399* -0.399* -0.399* -0.399*
[-0.718,-0.099] [-0.718,-0.099] [-0.718,-0.099] [-0.718,-0.099] [-0.718,-0.099]
Group size 0.015 -0.058* -0.016* 0.042* 0.059*
[-0.004,0.036] [-0.072,-0.043] [-0.03,-0.001] [0.017,0.068] [0.029,0.091]
Conditional fits of categorical variables
0 1
Mayor 0.801 0.777
[0.783,0.822] [0.747,0.808]
ENA 0.777 0.777
[0.75,0.804] [0.752,0.803]
Majority 0.77 0.777
[0.736,0.802] [0.75,0.805]
Sex 0.777 0.78
[0.749,0.808] [0.752,0.81]
First year 0.777 0.725
[0.75,0.804] [0.699,0.751]
Left Neutral Right
Left-Right 0.777 0.775 0.79
[0.748,0.806] [0.756,0.793] [0.77,0.811]
Region dummies Included
Occupation dummies Included
Committee dummies Included
R-squared 0.789
Observations 20867
40

Table 7: Control variables - Freshmen sample and years
Median Min. 25% 75% Max.
Gradients of continuous variables
Schooling 1.379* 2.051* 1.7* 1.062* 0.742*
[0.703,2.064] [1.117,2.965] [0.915,2.475] [0.462,1.694] [0.181,1.354]
Age -0.069 0.148 0.073 -0.286 -0.542*
[-0.302,0.18] [-0.177,0.451] [-0.169,0.318] [-0.59,0.038] [-0.955,-0.101]
Experience 1.938* 1.938* 1.938* 1.938* 1.938*
[1.123,2.709] [1.123,2.709] [1.123,2.709] [1.123,2.709] [1.123,2.709]
Group size -0.003 -0.01 -0.007 0.001 0.005
[-0.016,0.011] [-0.023,0.002] [-0.02,0.006] [-0.013,0.015] [-0.009,0.02]
Conditional fits of categorical variables
0 1
Mayor 0.812 0.81
[0.794,0.83] [0.792,0.829]
ENA 0.81 0.797
[0.79,0.831] [0.756,0.849]
Majority 0.81 0.81
[0.791,0.828] [0.791,0.828]
Sex 0.81 0.815
[0.792,0.83] [0.786,0.847]
First year 0.81 0.755*
[0.794,0.828] [0.73,0.78]
Left Neutral Right
Left-Right 0.81 0.78 0.803
[0.79,0.83] [0.76,0.8] [0.786,0.821]
Region dummies Included
Occupation dummies Included
Committee dummies Included
R-squared 0.767
Observations 7509
41

Figure 6: Year model
Conditional productivity over years
● ● ●●
●●
●
●
●
●
●
●●
●● ● ● ● ● ● ● ● ● ● ● ● ●
●●
● ●● ● ● ● ● ●
●●
●●
●●
●●
● ●
1970 1980 1990 2000 2010
0.60
0.65
0.70
0.75
0.80
Year
Con
ditio
nal F
it
(a) Full sample
● ●● ●
●●
●
●
●
●
●●
●●
● ● ● ● ● ● ●● ● ● ●
●●
●
●
●●
●●
●
●
●
●●
●
●●
●●
●● ● ●
1970 1980 1990 2000 2010
0.60
0.65
0.70
0.75
0.80
Year
Con
ditio
nal F
it(b) Freshmen sample
Effect of Competition
●
●
●
●
●
●
●
●
●
●
●
●
●
●
●
●
●
●
●
●
●
●
●
●
●
0.2 0.4 0.6 0.8
0.4
0.5
0.6
0.7
0.8
Competition
Con
ditio
nal F
it
(c) Full sample
●
●
●
●
●
●
●
●
●
●
●
●
●
●
●
●
●
●
●
●
●
●
●
●
●
0.3 0.4 0.5 0.6 0.7 0.8 0.9
0.3
0.4
0.5
0.6
0.7
0.8
0.9
Competition
Con
ditio
nal F
it
(d) Freshmen sample
42