El Cerrito Middle School A learning community soaring together

2011-12 School Accountability Report Card for El Cerrito Senior High School Page 1 of 16
El Cerrito Senior High School
School Accountability Report Card
Reported Using Data from the 2011-12 School Year
Published During 2012-13
Every school in California is required by state law to publish a School Accountability Report Card (SARC), by February 1 of each year. The SARC contains information about the condition and performance of each California public school. • For more information about SARC requirements, see the California Department of Education (CDE) SARC webpage at
http://www.cde.ca.gov/ta/ac/sa/. • For additional information about the school, parents and community members should contact the school principal or the district
office.
I. Data and Access
EdData Partnership Web Site EdData is a partnership of the CDE, EdSource, and the Fiscal Crisis Management and Assistance Team (FCMAT) that provides extensive financial, demographic, and performance information about California’s public kindergarten through grade twelve school districts and schools. DataQuest DataQuest is an online data tool located on the CDE DataQuest webpage at http://dq.cde.ca.gov/dataquest/ that contains additional information about this school and comparisons of the school to the district, the county, and the state. Specifically, DataQuest is a dynamic system that provides reports for accountability (e.g., state Academic Performance Index [API], federal Adequate Yearly Progress [AYP]), test data, enrollment, high school graduates, dropouts, course enrollments, staffing, and data regarding English learners. Internet Access Internet access is available at public libraries and other locations that are publicly accessible. Access to the Internet at libraries and public locations is generally provided on a first-come, first-served basis. Other use restrictions may include the hours of operation, the length of time that a workstation may be used (depending on availability), the types of software programs available on a workstation, and the ability to print documents.
II. About This School Contact Information (School Year 2012-13)
School Contact Information
School Name------- El Cerrito Senior High School
Street------- 540 Ashbury Avenue
City, State, Zip------- El Cerrito, CA 94530
Phone Number------- (510) 231-1437
Principal------- David Luongo
E-mail Address------- [email protected]
CDS Code------- 07-61796-0732941

2011-12 School Accountability Report Card for El Cerrito Senior High School Page 2 of 16
District Contact Information
District Name------- West Contra Costa Unified School District
Phone Number------- (510) 231-1100
Web Site------- www.wccusd.net
Superintendent------- Dr. Bruce Harter
E-mail Address------- [email protected]
School Description and Mission Statement (School Year 2011-12) This section provides information about the school, its programs and its goals.
El Cerrito High School is a mutually supportive, academic community dedicated to helping all students develop pride, perseverance, and purpose in order to realize their potential. We are committed to providing a rigorous, comprehensive, and meaningful education for all students. El Cerrito students, staff, and larger community works collaboratively so that students will become independent, resilient, motivated critical thinkers, who contribute to the greater community. Realizing this vision is possible through providing a wide-variety of engaging courses, implementing effective teaching practices and engaging in collaboration with faculty, community, students and parent stakeholders. Equity and academic excellence form the foundation of our beliefs and permeate all school activities and programs. ECHS is a professional community where all members interact respectfully. We strive to build confidence and opportunities for success for all students. Further, El Cerrito High School seeks to create an environment that is inclusive of all stakeholders. By reflecting on our teaching practices, attitudes and beliefs, as well as examining student performance data, we seek to create a learning environment that serves the entire El Cerrito High School community. Opportunities for Parental Involvement (School Year 2011-12) This section provides information on how parents can become involved in school activities, including contact information pertaining to organized opportunities for parent involvement.
The Parent, Teacher and Student Association (PTSA) promotes a safe and enriching educational environment for all ECHS students and encourages communication between parents, teachers, administration, students, and community members. The El Cerrito Student Activity Fund (ECSAF) is a non-profit organization that raises contributions for extra-curricular programs and establishes a foundation to ensure that school wide programs are fully funded. The School Site Council (SSC) is a governing body that controls the use of selected categorical and non-categorical funds. The role of the SSC is to give parents, faculty and staff more on-site decision making ability by giving individuals the opportunity to work together in planning school program improvements. The Gifted and Talented Education (GATE) program has monthly site meetings per year to which all parents and guardians of GATE students are invited and encouraged to participate in the decision-making process. The English Language Advisory Committee (ELAC) is an advisory committee that works to improve the service provided to English Learners. This committee works alongside the SSC in deciding how to allocate categorical funds associated with English language support programs. The Instructional Leadership Team (ILT) consists of students, parents, teachers, classified staff, community members and administrators. The ILT oversees the implementation of the MPAC and guides the school's master plan throughout the school year. The Writer Coach Connection (WCC) is an opportunity for parents and community members to volunteer to coach ELD students and 9th grade students in coordination with English classes. Coaches commit to 10 coaching sessions per semester and go through training in order to be prepared to coach students. Investing In Academic Excellence (IAE) is a group of parents that works to raise funds to help support academic programs on campus. This group typically meets once a month and focuses on finding donors that are willing to contribute donations of at least $500.

2011-12 School Accountability Report Card for El Cerrito Senior High School Page 3 of 16
Student Enrollment by Grade Level (School Year 2011-12)
Grade Level Number of Students
Grade 9------- 319
Grade 10------- 332
Grade 11------- 314
Grade 12------- 338
Total Enrollment------- 1,303
Student Enrollment by Group (School Year 2011-12)
Group Percent of
Total Enrollment Group
Percent of Total Enrollment
Black or African American------- 31.9 White 19.7
American Indian or Alaska Native-------
0.2 Two or More Races 0
Asian------- 18.3 Socioeconomically Disadvantaged 51.8
Filipino------- 3.3 English Learners 22
Hispanic or Latino------- 26.2 Students with Disabilities 9.7
Native Hawaiian/Pacific Islander 0.4
Average Class Size and Class Size Distribution (Secondary)
Subject
2009-10 2010-11 2011-12
Avg. Class Size
Number of Classrooms Avg. Class Size
Number of Classrooms Avg. Class Size
Number of Classrooms
1-22 23-32 33+ 1-22 23-32 33+ 1-22 23-32 33+
English------- ----------
28.1 4 18 5 34.5 8 3 10 29.4 6 10 11
Mathematics ----------
26.5 8 15 2 42.2 3 1 12 30.4 3 10 10
Science------- ----------
28.4 3 9 5 50.4 2 1 5 35.1 0 3 10
Social Science ----------
30.6 0 17 6 43.4 5 1 6 29.5 4 6 10
* Number of classes indicates how many classrooms fall into each size category (a range of total students per classroom). At the secondary school level, this
information is reported by subject area rather than grade level.
III. School Climate
School Safety Plan (School Year 2011-12) This section provides information about the school’s comprehensive safety plan, including the dates on which the safety plan was last reviewed, updated, and discussed with faculty; as well as a brief description of the key elements of the plan.
The Site Supervision Team meets on a weekly basis and the administrative team meets weekly to address school wide
culture and climate issues.
Fire drills are held twice annually.
Staff and parents are informed of safety situations as needed.
A site supervision plan has been printed and distributed to all staff.
The Local Review Committee meets regularly to analyze student discipline and conduct.
An administrative representative attends the monthly district safety meetings

2011-12 School Accountability Report Card for El Cerrito Senior High School Page 4 of 16
Suspensions and Expulsions
Rate* School District
2009-10 2010-11 2011-12 2009-10 2010-11 2011-12
Suspensions------- 31.62 36.47 27.5 21.15 23.83 26.7
Expulsions------- 0.32 1.57 0.2 0.5 0.49 0.2
* The rate of suspensions and expulsions is calculated by dividing the total number of incidents by the total enrollment (and multiplying by 100).
IV. School Facilities
School Facility Conditions and Planned Improvements (School Year 2012-13) This section provides information from the most recent Facility Inspection Tool (FIT) data (or equivalent), including: • Description of the safety, cleanliness, and adequacy of the school facility • Description of any planned or recently completed facility improvements • The year and month in which the data were collected • Description of any needed maintenance to ensure good repair
Year and month in which data were collected: September 2012 El Cerrito opened its new campus January 2009. El Cerrito High School is a closed campus. Site supervisors, police, and administrators monitor the campus throughout the day. All visitors are required to check in at the Main Office. Classroom space and facilities are limited. The majority of teaching staff have rooms; however, due to increase in enrollment and specialized programs, some of our staff shares room/facilities with other colleagues. School Facility Good Repair Status (School Year 2012-13) This section provides information from the most recent Facility Inspection Tool (FIT) data (or equivalent), including: • Determination of repair status for systems listed • Description of any needed maintenance to ensure good repair • The Overall Rating (bottom row)
System Inspected Repair Status Repair Needed and
Action Taken or Planned Exemplary Good Fair Poor
Systems: Gas Leaks, Mechanical/HVAC, Sewer
[ ] [ ] [X] [ ] IDF (utility) room cooling system not working. (Repaired.)
Interior: Interior Surfaces
[ ] [X] [ ] [ ] Window shelves loose, TV not anchored to cart. (Shelves tightened, TV anchored to card.)
Cleanliness: Overall Cleanliness, Pest/ Vermin Infestation
[ ] [X] [ ] [ ]
Electrical: Electrical
[ ] [X] [ ] [ ] VGA cable cord management, light out, light fixture broken. (Cord management, light, and light fixture taken care of._
Restrooms/Fountains: Restrooms, Sinks/ Fountains
[ ] [X] [ ] [ ] Slow/broken urinals, damaged/broken paper towel dispenser. (Urinals repaired. Paper towel dispensers replaced.) Slow faucet, faucet buttons missing. (Both repaired.)
Safety: Fire Safety, Hazardous Materials
[ ] [X] [ ] [ ]

2011-12 School Accountability Report Card for El Cerrito Senior High School Page 5 of 16
System Inspected Repair Status Repair Needed and
Action Taken or Planned Exemplary Good Fair Poor
Structural: Structural Damage, Roofs
[ ] [X] [ ] [ ]
External: Playground/School Grounds, Windows/ Doors/Gates/Fences
[ ] [X] [ ] [ ] Doors sticking, door closer not working properly. (Doors and door closer repaired.)
Overall Rating [ ] [X] [ ] [ ] Facility inspection September 2012
V. Teachers
Teacher Credentials
Teachers School District
2009-10 2010-11 2011-12 2011-12
With Full Credential 57 57 54 1,304
Without Full Credential 0 0 2 17
Teaching Outside Subject Area of Competence 0 0 0 ---
Teacher Misassignments and Vacant Teacher Positions
Indicator 2010-11 2011-12 2012-13
Misassignments of Teachers of English Learners 0 0 0
Total Teacher Misassignments 0 0 0
Vacant Teacher Positions 0 0 1
* “Misassignments” refers to the number of positions filled by teachers who lack legal authorization to teach that grade level, subject area, student group, etc. Core Academic Classes Taught by Highly Qualified Teachers (School Year 2011-12) The Federal Elementary and Secondary Education Act (ESEA), also known as No Child Left Behind (NCLB), requires that core academic subjects be taught by Highly Qualified Teachers, defined as having at least a bachelor’s degree, an appropriate California teaching credential, and demonstrated core academic subject area competence. For more information, see the CDE Improving Teacher and Principal Quality webpage at: http://www.cde.ca.gov/nclb/sr/tq/
Location of Classes Percent of Classes In Core Academic Subjects
Taught by Highly Qualified Teachers Not Taught by Highly Qualified Teachers
This School 98.73 1.27
All Schools in District 96.87 3.13
High-Poverty Schools in District 96.69 3.31
Low-Poverty Schools in District 100 0
* High-poverty schools are defined as those schools with student eligibility of approximately 40 percent or more in the free and reduced price meals program.
Low-poverty schools are those with student eligibility of approximately 25 percent or less in the free and reduced price meals program.

2011-12 School Accountability Report Card for El Cerrito Senior High School Page 6 of 16
VI. Support Staff
Academic Counselors and Other Support Staff (School Year 2011-12)
Title Number of FTE
Assigned to School Average Number of Students per
Academic Counselor
Academic Counselor------- 2 402
Counselor (Social/Behavioral or Career Development) ---
Library Media Teacher (Librarian) 1 ---
Library Media Services Staff (Paraprofessional) 1.0 ---
Psychologist------- 0.70 ---
Social Worker------- ---
Nurse------- ---
Speech/Language/Hearing Specialist 0.30 ---
Resource Specialist------- 2.00 ---
Other------- ---
* One Full-Time Equivalent (FTE) equals one staff member working full-time; one FTE could also represent two staff members who each work 50 percent of full-
time.
VII. Curriculum and Instructional Materials
Quality, Currency, Availability of Textbooks and Instructional Materials (School Year 2012-13) This section describes whether the textbooks and instructional materials used at the school are from the most recent adoption; whether there are sufficient textbooks and instruction materials for each student; and information about the school’s use of any supplemental curriculum or non-adopted textbooks or instructional materials.
Year and month in which data were collected: El Cerrito High School uses standards-based textbooks in all academic subject areas, in addition to supplemental materials, as needed. All students will have access to standards-based textbooks and will have a copy of this textbook for their use in class and at home. The core curriculum is based on California content standards and is designed to provide all students with a rigorous and enriching academic experience. In order to provide this experience to all students, teachers will use standards-based textbooks, but also include auxiliary materials to enrich the academic experience. Examples of auxiliary materials include, but are not limited to novels, laboratory materials, cultural regalia, and other appropriate materials.
Core Curriculum Area Textbooks and Instructional Materials/
Year of Adoption
From Most Recent
Adoption?
Percent of Students Lacking Own
Assigned Copy
Reading/Language Arts Selected Novels for each grade level. Prentice Hall Literature: Timeless Voices – Gold (English 1); Prentice Hall Literature, Timeless Voices – Platinum (English 2); Prentice Hall Literature – Ruby (English 3)
ELD: High Point Reading
Intervention: READ 180.
0%
Mathematics Prentice Hall, Algebra 1 and Addison Wesley, Algebra (Algebra 1); Key Curriculum Advanced Algebra (Algebra 2); Key Curriculum Geometry, Geometry; Glencoe Advanced Mathematical Concepts (Math Analysis); Prentice Hall, Calculus.
0%

2011-12 School Accountability Report Card for El Cerrito Senior High School Page 7 of 16
Core Curriculum Area Textbooks and Instructional Materials/
Year of Adoption
From Most Recent
Adoption?
Percent of Students Lacking Own
Assigned Copy
Science------- Cambridge Physics Outlet (CPO) High School Chemistry: Prentice Hall Chemistry High School Biology: McDougal Littel Biology Prentice Hall: Biology
Pearson Ed: Biology (AP class)
Prentice Hall: Exploring Physical Science (AP)
Prentice Hall: Environmental Science (AP class)
0%
History-Social Science World Geography and Cultures, Glencoe, Cultural Geography
High School World History: The Modern World McDougal Littell High School US History: The Americas McDougal Littell High School Economics: McDougal Littell Economics 2007 edition
Prentice Hall Magrudar's American Government, American Government.
0%
Foreign Language Glencoe, McGraw-Hill: French 1: Bon Voyage
Glencoe: French 2: A Bord
Glencoe: French 3: En Voyage
Prentice-Hall Spanish 1: Realidades
McDougal-Littell: Spanish. 2 Bravo!2
McDougal-Littell: Spanish 3. Bravo! 3
Prentice-Hall: Latin: Ecce Romani Mirai, Cheng & Tsui: Japanese: Level 1
University of Hawaii: Japanese. 2 Learn Japanese
University of Hawaii: Japanese. 3 Learn Japanese
Holt, Rinehart: German: Komm Mit
0%
Health------- Glencoe/McGraw-Hill: Teen Health Course 0%
Science Laboratory Equipment (grades 9-12)
Laboratory equipment is provided to meet the needs of all high school classes in science
0%
VIII. School Finances
Expenditures Per Pupil and School Site Teacher Salaries (Fiscal Year 2010-11)
Level
Expenditures Per Pupil Average Teacher Salary Total
Supplemental/ Restricted
Basic/ Unrestricted
School Site------- $8,209 $4,230 $3,979 $52,481.14
District------- --- --- $4,410 $53,775
Percent Difference: School Site and District --- --- -9.8 -2.4
State------- --- --- $5,455 $68,835
Percent Difference: School Site and State --- --- -27.1 -23.8
* Supplemental/Restricted expenditures come from money whose use is controlled by law or by a donor. Money that is designated for specific purposes by the
district or governing board is not considered restricted. ** Basic/Unrestricted expenditures are from money whose use, except for general guidelines, is not controlled by law or by a donor. For detailed information on school expenditures for all districts in California, see the CDE Current Expense of Education & Per-pupil Spending webpage at http://www.cde.ca.gov/ds/fd/ec/. For information on teacher salaries for all districts in California, see the CDE Certificated Salaries & Benefits webpage at http://www.cde.ca.gov/ds/fd/cs/. To look up expenditures and salaries for a specific school district, see the Ed-Data Web site at: http://www.ed-data.org.
2011-12 School Accountability Report Card for El Cerrito Senior High School Page 8 of 16
Types of Services Funded (Fiscal Year 2011-12) This section provides specific information about the types of programs and services available at the school that support and assists students. For example, this narrative may include information about supplemental educational services related to the school’s federal Program Improvement (PI) status.
Programs and services available at El Cerrito School include:
Special Ed-E
Arts & Music Block Grant
A/M/PE- Drama/Theatre
A/M/PE-Dance
LEP EIA
Gifted & Talented Ed-E Teacher and Administrative Salaries (Fiscal Year 2010-11)
Category District Amount
State Average for Districts In Same Category
Beginning Teacher Salary $35,931 $41,455
Mid-Range Teacher Salary $55,377 $66,043
Highest Teacher Salary $74,235 $85,397
Average Principal Salary (Elementary) $91,800 $106,714
Average Principal Salary (Middle) $97,308 $111,101
Average Principal Salary (High) $108,819 $121,754
Superintendent Salary $221,190 $223,357
Percent of Budget for Teacher Salaries 33% 39%
Percent of Budget for Administrative Salaries 5% 5%
* For detailed information on salaries, see the CDE Certificated Salaries & Benefits webpage at http://www.cde.ca.gov/ds/fd/cs/.
IX. Student Performance
The Standardized Testing and Reporting (STAR) Program consists of several key components, including: • California Standards Tests (CSTs), which include English-language arts (ELA) and mathematics in grades two through eleven;
science in grades five, eight, and nine through eleven; and history-social science in grades eight, and nine through eleven. • California Modified Assessment (CMA), an alternate assessment that is based on modified achievement standards in ELA for
grades three through eleven; mathematics for grades three through seven, Algebra I, and Geometry; and science in grades five and eight, and Life Science in grade ten. The CMA is designed to assess those students whose disabilities preclude them from achieving grade-level proficiency on an assessment of the California content standards with or without accommodations.
• California Alternate Performance Assessment (CAPA), includes ELA and mathematics in grades two through eleven, and science
for grades five, eight, and ten. The CAPA is given to those students with significant cognitive disabilities whose disabilities prevent them from taking either the CSTs with accommodations or modifications or the CMA with accommodations.
The assessments under the STAR Program show how well students are doing in relation to the state content standards. On each of these assessments, student scores are reported as performance levels. For detailed information regarding the STAR Program results for each grade and performance level, including the percent of students not tested, see the CDE STAR Results Web site at http://star.cde.ca.gov.

2011-12 School Accountability Report Card for El Cerrito Senior High School Page 9 of 16
Standardized Testing and Reporting Results for All Students - Three-Year Comparison
Subject
Percent of Students Scoring at Proficient or Advanced
School District State
2009-10 2010-11 2011-12 2009-10 2010-11 2011-12 2009-10 2010-11 2011-12
English-Language Arts 42 42 43 39 41 43 52 54 56
Mathematics------- 17 16 17 34 37 38 48 50 51
Science------- 31 41 38 38 42 45 54 57 60
History-Social Science 25 25 30 26 28 30 44 48 49
* Scores are not shown when the number of students tested is ten or less, either because the number of students in this category is too small for statistical
accuracy or to protect student privacy. Standardized Testing and Reporting Results by Student Group - Most Recent Year
Group Percent of Students Scoring at Proficient or Advanced
English-Language Arts Mathematics Science History-Social Science
All Students in the LEA 43 38 45 30
All Student at the School 43 17 38 30
Male------- 39 19 41 33
Female------- 46 15 36 28
Black or African American 25 6 18 12
American Indian or Alaska Native
Asian------- 53 34 48 39
Filipino------- 43 13 58 20
Hispanic or Latino 35 6 32 24
Native Hawaiian/Pacific Islander
White------- 70 31 68 58
Two or More Races-------
Socioeconomically Disadvantaged 30 11 33 19
English Learners------- 5 10 16 7
Students with Disabilities 24 17 16 11
Students Receiving Migrant Education Services
* Scores are not shown when the number of students tested is ten or less, either because the number of students in this category is too small for statistical
accuracy or to protect student privacy. California High School Exit Examination The California High School Exit Examination (CAHSEE) is primarily used as a graduation requirement. However, the grade ten results of this exam are also used to establish the percentages of students at three proficiency levels (not proficient, proficient, or advanced) in ELA and mathematics to compute AYP designations required by the federal ESEA, also known as NCLB. For detailed information regarding CAHSEE results, see the CDE CAHSEE Web site at http://cahsee.cde.ca.gov/.

2011-12 School Accountability Report Card for El Cerrito Senior High School Page 10 of 16
California High School Exit Examination Results for All Students - Three-Year Comparison
Subject School District State
2009-10 2010-11 2011-12 2009-10 2010-11 2011-12 2009-10 2010-11 2011-12
English-Language Arts 47 53 50 41 41 42 54 59 56
Mathematics 40 50 47 37 41 40 54 56 58
* Scores are not shown when the number of students tested is ten or less, either because the number of students in this category is too small for statistical
accuracy or to protect student privacy. California High School Exit Examination Grade Ten Results by Student Group - Most Recent Year
Group
English-Language Arts Mathematics
Not Proficient
Proficient Advanced Not
Proficient Proficient Advanced
All Students in the LEA 58 22 20 60 28 12
All Students at the School 50 27 23 53 29 18
Male------- 51 26 22 55 26 19
Female------- 48 28 24 51 33 16
Black or African American 66 26 8 79 18 3
American Indian or Alaska Native
Asian------- 37 35 28 29 36 35
Filipino------- 42 17 42 33 50 17
Hispanic or Latino 56 26 18 62 31 7
Native Hawaiian/Pacific Islander
White------- 30 19 51 29 33 38
Two or More Races
Socioeconomically Disadvantaged 57 29 14 59 30 11
English Learners------- 85 15 0 68 21 11
Students with Disabilities 92 4 4 92 0 8
Students Receiving Migrant Education Services
* Scores are not shown when the number of students tested is ten or less, either because the number of students in this category is too small for statistical
accuracy or to protect student privacy. California Physical Fitness Test Results (School Year 2011-12) The California Physical Fitness Test (PFT) is administered to students in grades five, seven, and nine only. This table displays by grade level the percent of students meeting the fitness standards for the most recent testing period. For detailed information regarding this test, and comparisons of a school’s test results to the district and state, see the CDE PFT webpage at http://www.cde.ca.gov/ta/tg/pf/.
Grade Level
Percent of Students Meeting Fitness Standards
Four of Six Standards Five of Six Standards Six of Six Standards
-------9------- 23.4 19 36.9
* Scores are not shown when the number of students tested is ten or less, either because the number of students in this category is too small for statistical
accuracy or to protect student privacy.
2011-12 School Accountability Report Card for El Cerrito Senior High School Page 11 of 16
X. Accountability
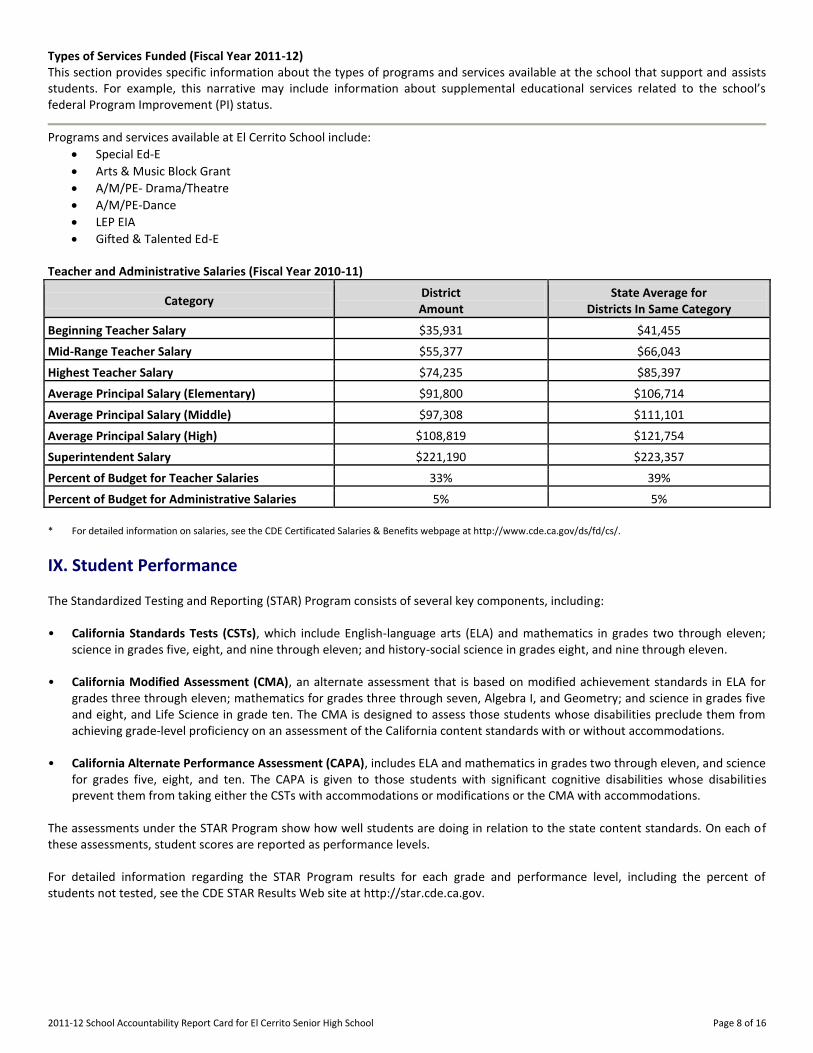
Academic Performance Index The Academic Performance Index (API) is an annual measure of state academic performance and progress of schools in California. API scores range from 200 to 1,000, with a statewide target of 800. For detailed information about the API, see the CDE API webpage at http://www.cde.ca.gov/ta/ac/ap/. Academic Performance Index Ranks - Three-Year Comparison This table displays the school’s statewide and similar schools’ API ranks. The statewide API rank ranges from 1 to 10. A statewide rank of 1 means that the school has an API score in the lowest ten percent of all schools in the state, while a statewide rank of 10 means that the school has an API score in the highest ten percent of all schools in the state. The similar schools API rank reflects how a school compares to 100 statistically matched “similar schools.” A similar schools rank of 1 means that the school’s academic performance is comparable to the lowest performing ten schools of the 100 similar schools, while a similar schools rank of 10 means that the school’s academic performance is better than at least 90 of the 100 similar schools.
API Rank 2009 2010 2011
Statewide------- 2 2 2
Similar Schools------- 1 1 1
Academic Performance Index Growth by Student Group – Three-Year Comparison
Group Actual API Change
2009-10 2010-11 2011-12
All Students at the School 7 13 12
Black or African American 8 22 25
American Indian or Alaska Native
Asian------- -13 16 -8
Filipino-------
Hispanic or Latino 21 1 18
Native Hawaiian/Pacific Islander
White------- -1 -20 8
Two or More Races
Socioeconomically Disadvantaged 26 19 36
English Learners 18 28 -13
Students with Disabilities -33 -27
* "N/D” means that no data were available to the CDE or LEA to report. “B” means the school did not have a valid API Base and there is no Growth or target
information. “C” means the school had significant demographic changes and there is no Growth or target information.

2011-12 School Accountability Report Card for El Cerrito Senior High School Page 12 of 16
Academic Performance Index Growth by Student Group - 2012 Growth API Comparison This table displays, by student group, the number of students included in the API and the 2012 Growth API at the school, district, and state level.
Group
2012 Growth API
School District State
# of Students Growth API # of Students Growth API # of Students Growth API
All Students at the School 896 670 20,687 715 4,664,264 788
Black or African American 272 558 4,265 644 313,201 710
American Indian or Alaska Native 2 34 744 31,606 742
Asian------- 176 755 2,296 816 404,670 905
Filipino------- 29 738 1,307 825 124,824 869
Hispanic or Latino 229 639 10,246 685 2,425,230 740
Native Hawaiian/Pacific Islander 3 154 750 26,563 775
White------- 185 785 2,294 813 1,221,860 853
Two or More Races 0 55 801 88,428 849
Socioeconomically Disadvantaged 473 623 14,600 683 2,779,680 737
English Learners 203 579 9,178 678 1,530,297 716
Students with Disabilities 111 460 2,823 555 530,935 607
Adequate Yearly Progress The federal ESEA requires that all schools and districts meet the following Adequate Yearly Progress (AYP) criteria: • Participation rate on the state’s standards-based assessments in ELA and mathematics • Percent proficient on the state’s standards-based assessments in ELA and mathematics • API as an additional indicator • Graduation rate (for secondary schools) Detailed information about AYP, including participation rates and percent proficient results by student group, can be found at the CDE Adequate Yearly Progress (AYP) webpage at http://www.cde.ca.gov/ta/ac/ay/. Adequate Yearly Progress Overall and by Criteria (School Year 2011-12)
AYP Criteria School District
Made AYP Overall No No
Met Participation Rate: English-Language Arts Yes Yes
Met Participation Rate: Mathematics Yes Yes
Met Percent Proficient: English-Language Arts No No
Met Percent Proficient: Mathematics No No
Met API Criteria Yes Yes
Met Graduation Rate (if applicable) No No
2011-12 School Accountability Report Card for El Cerrito Senior High School Page 13 of 16
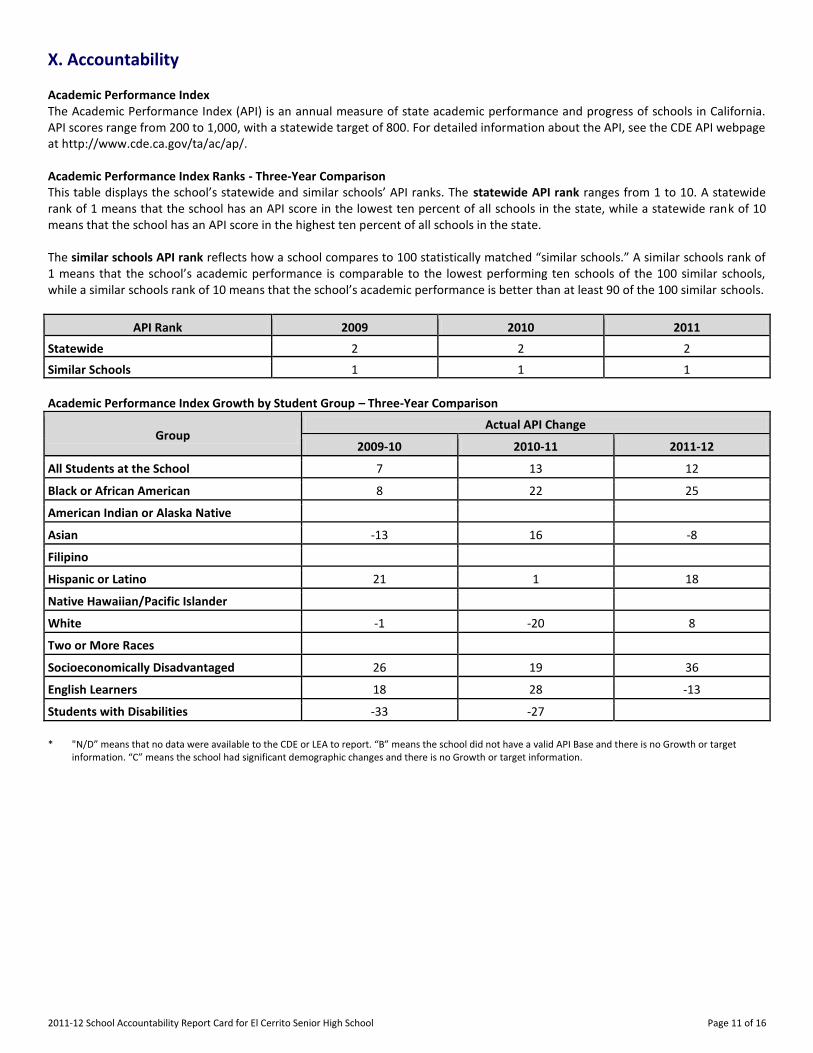
Federal Intervention Program (School Year 2012-13) Schools and districts receiving federal Title I funding enter Program Improvement (PI) if they do not make AYP for two consecutive years in the same content area (ELA or mathematics) or on the same indicator (API or graduation rate). After entering PI, schools and districts advance to the next level of intervention with each additional year that they do not make AYP. For detailed information about PI identification, see the CDE PI Status Determinations webpage: http://www.cde.ca.gov/ta/ac/ay/tidetermine.asp.
Indicator School District
Program Improvement Status In PI
First Year of Program Improvement 2004-2005
Year in Program Improvement Year 3
Number of Schools Currently in Program Improvement --- 25
Percent of Schools Currently in Program Improvement --- 43.1
XI. School Completion and Postsecondary Preparation
Admission Requirements for California’s Public Universities University of California Admission requirements for the University of California (UC) follow guidelines set forth in the Master Plan, which requires that the top one-eighth of the state’s high school graduates, as well as those transfer students who have successfully completed specified college course work, be eligible for admission to the UC. These requirements are designed to ensure that all eligible students are adequately prepared for University-level work. For general admissions requirements, please visit the UC Admissions Information webpage at http://www.universityofcalifornia.edu/admissions/. (Outside source) California State University Eligibility for admission to the California State University (CSU) is determined by three factors: • Specific high school courses • Grades in specified courses and test scores • Graduation from high school Some campuses have higher standards for particular majors or students who live outside the local campus area. Because of the number of students who apply, a few campuses have higher standards (supplementary admission criteria) for all applicants. Most CSU campuses have local admission guarantee policies for students who graduate or transfer from high schools and colleges that are historically served by a CSU campus in that region. For admission, application, and fee information see the CSU webpage at http://www.calstate.edu/admission/admission.shtml. (Outside source) Dropout Rate and Graduation Rate
Indicator School District State
2008-09 2009-10 2010-11 2008-09 2009-10 2010-11 2008-09 2009-10 2010-11
Dropout Rate (1-year) 1.9 10.2 12.4 5.8 22.1 20.5 5.7 16.6 14.4
Graduation Rate 90.46 89.10 85.95 74.17 75.24 74.10 78.59 80.53 76.26
* The National Center for Education Statistics graduation rate as reported in AYP is provided in this table.

2011-12 School Accountability Report Card for El Cerrito Senior High School Page 14 of 16
Completion of High School Graduation Requirements This table displays, by student group, the percent of students who began the 2011-12 school year in grade twelve and were a part of the school’s most recent graduating class, meeting all state and local graduation requirements for grade twelve completion, including having passed both the ELA and mathematics portions of the CAHSEE or received a local waiver or state exemption.
Group Graduating Class of 2012
School District State
All Students ---
Black or African American ---
American Indian or Alaska Native ---
Asian------- ---
Filipino------- ---
Hispanic or Latino ---
Native Hawaiian/Pacific Islander ---
White------- ---
Two or More Races ---
Socioeconomically Disadvantaged ---
English Learners ---
Students with Disabilities ---
* “N/D” means that no data were available to the CDE or LEA to report. Career Technical Education Programs (School Year 2011-12) This section provides information about Career Technical Education (CTE) programs including: • Programs and classes offered that are specifically focused on career preparation and or preparation for work • How these programs and classes are integrated with academic courses and how they support academic achievement • How the school addresses the needs of all students in career preparation and/or preparation for work, including needs unique
to defined special populations of students • The measurable outcomes of these programs and classes, and how they are evaluated • State the primary representative of the district’s CTE advisory committee and the industries represented on the committee
Computer Applications Computer Programming Applications Web DigArt Design Web DigArt Design Web 2 Journalism Journalism 2 Multi Media Photography Photography Advanced Technical Theater Theater 1 Theater 2 Theater Advanced Yearbook Green Auto Technology

2011-12 School Accountability Report Card for El Cerrito Senior High School Page 15 of 16
Career Technical Education Participation (School Year 2011-12)
Measure CTE Program Participation
Number of pupils participating in CTE 326
% of pupils completing a CTE program and earning a high school diploma 33%
% of CTE courses sequenced/articulated between the school/institutions of postsecondary education 38
Courses for University of California and/or California State University Admission
UC/CSU Course Measure Percent
2011-12 Students Enrolled in Courses Required for UC/CSU Admission 76.6
2010-11 Graduates Who Completed All Courses Required for UC/CSU Admission 41.8
Advanced Placement Courses (School Year 2011–12)
Subject Number of AP Courses Offered* Percent of Students In AP Courses
Computer Science 0 ---
English------- 3 ---
Fine and Performing Arts 0 ---
Foreign Language 1 ---
Mathematics 2 ---
Science------- 2 ---
Social Science 4 ---
All courses 12 8.1
* Where there are student course enrollments.

2011-12 School Accountability Report Card for El Cerrito Senior High School Page 16 of 16
XII. Instructional Planning and Scheduling
Professional Development This section provides information on the number of days provided for professional development and continuous professional growth in the most recent three year period. Questions that may be answered include: • What are the primary/major areas of focus for staff development and specifically how were they selected? For example, were
student achievement data used to determine the need for professional development in reading instruction? • What are the methods by which professional development is delivered (e.g., after school workshops, conference attendance,
individual mentoring, etc.)? • How are teachers supported during implementation (e.g., through in-class coaching, teacher-principal meetings, student
performance, and data reporting, etc.)?
El Cerrito High School is participating in the WASC accreditation process for the 2012-13 school-year. This process has involved school staff, parents and students in order to reflect on our current areas of growth in order to continue working towards excellence. The stakeholders have identified two areas of Critical Academic Need (CANs) that have driven the WASC plan. Those two Critical Academic Needs focus on #1 - increasing the number of students completing A-G requirements and #2 - increasing student self awareness as learners and citizens. El Cerrito High School has participated in an ongoing cycle to ensure we maintain our accreditation. That process has involved some of the following: Throughout the final months of the 2009-2010 school year, El Cerrito High School began gathering information from students, teachers, parents, staff and administrators regarding challenges, goals, successes and failure that have been seen at El Cerrito High School. We held three brainstorming sessions that included all of these groups over a two month period and entered the information into a table within three major themes: academics, school culture and capacity for change. At the conclusion of the year, leaders from each academic department, parents, students, staff and administrators were invited to participate in developing a Master Plan for Academic Change (MPAC). This group, the Master Plan for Academic Change (MPAC) Team then spent three days reviewing data, identifying the school's greatest challenges, reviewing the input from two months of stakeholder brainstorming and the ECHS vision statement and mission statement. From all of this, the MPAC team identified the most critical first steps and developed an MPAC for the 2010-2011 school year. The MPAC will serve as a lens through which we will see our efforts, including professional development. This should help us to be a more focused team and to address our challenges more systematically. There will be three professional development goals that we will be focused on this year:
1. We provide all students with challenging learning experiences and a rigorous curriculum. In addition, we focus instruction on the development of critical thinking and problem-solving skills. We encourage active student inquiry and support their acquisition of study skills.
a. Within MPAC goal 1, our professional development plan will focus on student engagement, course planning and continuing work on course planning.
b. Teachers will receive in-house professional development, as well as SIOP training and continued KLT training.
2. We help students develop and maintain a personalized learning plan in which they commit to academic integrity and personal responsibility for their own education. We celebrate student achievement and showcase it in the community. We provide academic support and counseling to help students achieve their educational goals.
a. Teachers will be trained to support students with developing an academic plan and assessing their own skills.
3. We support the effective use of all forms of assessment to improve student learning. We use assessment to measure proficiency, inform instruction, and provide students with a measure of their progress that relates to their educational goals.
a. Teachers will receive training in the use of formative and summative assessment, including how to plan backwards from a course plan to ensure that summative and formative assessments are aligned with course and lesson objectives.