documents.worldbank.orgdocuments.worldbank.org/curated/pt/361711468026129784/pdf/E23450v20P... ·...
164
ENVIRONMENTAL ASSESSMENT REPORT FOR THE NEW BULK CARGO TERMINAL IN THE PORT OF PLOCE (FINAL DRAFT) EKONERG, 2006. Public Disclosure Authorized Public Disclosure Authorized Public Disclosure Authorized Public Disclosure Authorized Public Disclosure Authorized Public Disclosure Authorized Public Disclosure Authorized Public Disclosure Authorized Public Disclosure Authorized Public Disclosure Authorized Public Disclosure Authorized Public Disclosure Authorized
Transcript of documents.worldbank.orgdocuments.worldbank.org/curated/pt/361711468026129784/pdf/E23450v20P... ·...

ENVIRONMENTAL ASSESSMENT REPORTFOR THE NEW BULK CARGO TERMINAL
IN THE PORT OF PLOCE
(FINAL DRAFT)
EKONERG, 2006.
Pub
lic D
iscl
osur
e A
utho
rized
Pub
lic D
iscl
osur
e A
utho
rized
Pub
lic D
iscl
osur
e A
utho
rized
Pub
lic D
iscl
osur
e A
utho
rized
Pub
lic D
iscl
osur
e A
utho
rized
Pub
lic D
iscl
osur
e A
utho
rized
Pub
lic D
iscl
osur
e A
utho
rized
Pub
lic D
iscl
osur
e A
utho
rized
Pub
lic D
iscl
osur
e A
utho
rized
Pub
lic D
iscl
osur
e A
utho
rized
Pub
lic D
iscl
osur
e A
utho
rized
Pub
lic D
iscl
osur
e A
utho
rized
wb20439
Typewritten Text
E2345 v2

EKONERG LtdKoranska 5, ZAGREB, CROATIA
Client: Port of Ploce AuthorityTrg kralja Tomislava 2120 340 Ploce
Contract No: 2960/04
Title:
ENVIRONMENTAL ASSESSMENT REPORTFOR THE NEW BULK CARGO TERMINAL
IN THE PORT OF PLOCE
(FINAL DRAFT)
Authors: EKONERG - Energy and Environmental ProtectionInstitute:Dean Cizmar, B.Sc.Ante Curkovi6, B.Sc.Elvira Horvatic Viduka, B.Sc.Zoran Kisic, B. Sc.Renata Kos, B. Sc.Niko Malbasa, Ph.DHrvoje Sucic, B. Sc.Veronika Tomac, B.Sc.Veljko Vorkapic, B.Sc.
INSTITUT ZA ELEKTROPRIVREDU I ENERGETIKU d.d.:Janko Jurkovic, B.Sc.
OIKON Ltd Institute for Applied Ecology:Donat Petricioli, B.Sc.
Environmental protection department General manager:manager:
Niko Malbasa, Ph.D. Zdravko Muzek, M.Sc.
Zagreb, February 2006.

TABLE OF CONTENTS
LIST OF ABBREVIATIONS USED IN THE DOCUMENTLIST OF FIGURESLIST OF TABLES
0. EXECUTIVE SUMMARY 1/18
1. POLICY, LEGAL AND ADMINISTRATIVE FRAMEWORK 1/10
1.1. PURPOSE OF THE PROJECT 1/101.2. DATA FROM THE PHYSICAL PLANNING DOCUMENTS 6/101.3. INTERNATIONAL TREATIES / AGREEMENTS RELEVANT FOR THE
PROJECT PLANNED 9/10
2. PROJECT DESCRIPTION 1/18
2.1. BASIC DATA ON LOCATION AND THE PROJECT SITE 1/182.2. PROJECT BASIC DATA 4/18
2.2.1. DEEPENING AND BROADENING (DREDGING) OF ACCESSCHANNEL TO CTB AND TO VLASKA CHANNEL 4/18
2.2.2. CONSTRUCTION OF BERTH AND DEVELEOPMENT OF SEARECLAIMED AREA 7/18
2.2.3. CONSTRUCTION OF STORAGE AREA 8/182.2.4. EQUIPMENT FACILITIES AND INFRASTRUCTURE NECESSARY
FOR OPERATION OF PORT TERMINAL 12/182.2.5. USE OF PROJECT 17/18
3. BASELINE DATA 1/313.1. DELTA OF NERETVA RIVER 2/313.2. MARINE COMMUNITIES 6/313.3. CLIMATOLOGICAL CHARACTERISTICS 14/313.4. AIR QUALITY 18/313.5. CHARACTERISTICS OF MARINE SEDIMENT 23/31
3.5.1. GEOTECHNICAL CHARACTERISTICS 23/313.5.2. CHEMICAL ANALYSIS OF SEDIMENT SAMPLES 29/31
3.6. DEVELOPMENT VISIONS FOR THE TOWN OF PLO E 31/31
4. MAIN ENVIRONMENTAL IMPACTS 1/504.1. IMPACTS DURING PROJECT CONSTRUCTION 2/50
4.1.1. MARINE COMMUNITIES 2/504.1.2. NOISE IMPACT 4/504.1.3. IMPACTS ON ORINTHOFAUNA 18/504.1.4. WASTE 19/50
4.2. IMAPCTS DURING PROJECT USAGE 20/504.2.1. AIR QUALITY IMPACTS 20/504.2.2. NOISE IMPACTS 30/504.2.3. SEA AND MARINE COMMUNITIES4.2.4. IMPACTS ON ORNITHOFAUNA 44/504.2.5. WASTE 47/504.2.6. ACCIDENTS 49/50
5. ANALYSIS OF ALTERNATIVES 1/1
6. ENVIRONMENTAL MANAGEMENT PLAN6.1. MITIGATION PLAN 1/15
6.1.1. MITIGTION PLAN DURING THE PROJECT CONSTRUCTION 1/156.1.2. MITIGTION MEASURES DURING THE PROJCT OPERATION (USAGE) 5/156.1.3. MITIGTION MEASURES FOR DECOMMISSIONING 6/15
6.2. MONITORING PLAN 7/156.3. INSTITUTIONAL STRENGTHENING 9/156.4. SCHEDULE 10/156.5. INSTITUTIONAL ARRANGEMENTS 11/156.6. CONSULTATION WITH LOCAL NGOS AND PROJECT-AFFECTED 15/15
GROUPS
7. REFERENCES 1/4
ANNEX 1: ANALYSIS OF ALTERNATIVES

LIST OF ABBREVIATIONS USED IN THE DOCUMENT
ALARA - As Low As Reasonably Achievable
BAT - Best Available Technology
BATNEEC - Best Available Technology Not Entailing Excessive Costs
CBT - Cargo Bulk Terminal
CSD - Cutter Suction Dredge
DEFRA - Department for Environment, Food and Rural Affairs
DGMR - DGMR Industry, Traffic and Environment B.V. Consultants for construction,industry, traffic, environment and software
DWT - dead weight tonnes, represents a maximum load of a ship
EA - Environmental Assessment
EIAS - Environmental Impact Assessment Study
EMP - Environmental Management Plan
EOI - Expression of Interest
EPA - Environmental Protection Agency
HAC - Croatian Highway Corp.
HEP - Croatian Power Industry
HRN EN - Croatian Standards Series
ISO - International Organization for Standardization
LOA - Length overall
MARPOL - International Convention for the Prevention of Pollution from Ships
NPL - Nature Protection Law
PPA - Port Ploce Authority
PPUG - Physical Plan for Area Development
PPZDN - Physical Plan of Dubrovacko-neretvanska County
TDM - Total Deposited Material
TSHD - Trailing Suction Hopper Dredge
UPU - Urban Development Plan
LIST OF FIGURES
Figure 0-1: Ground level noise intensity at different distances during dredgingFigure 0-2: Ground level noise during piling
Figure 0-3: Annual particulate emission from CBT
Figure 0-4: Maximum hourly concentration of particulate matter (PM-10) and totaldeposited matter (TDM)
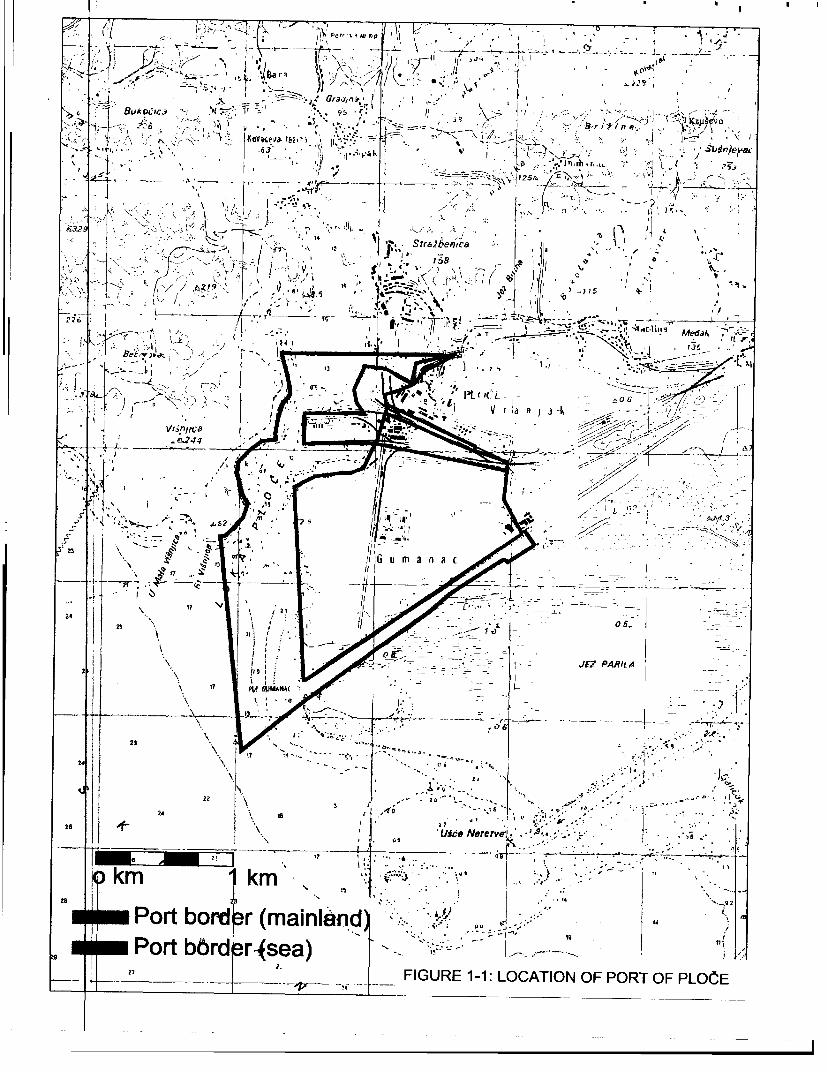
Figure 1-1: Location of port of Ploce
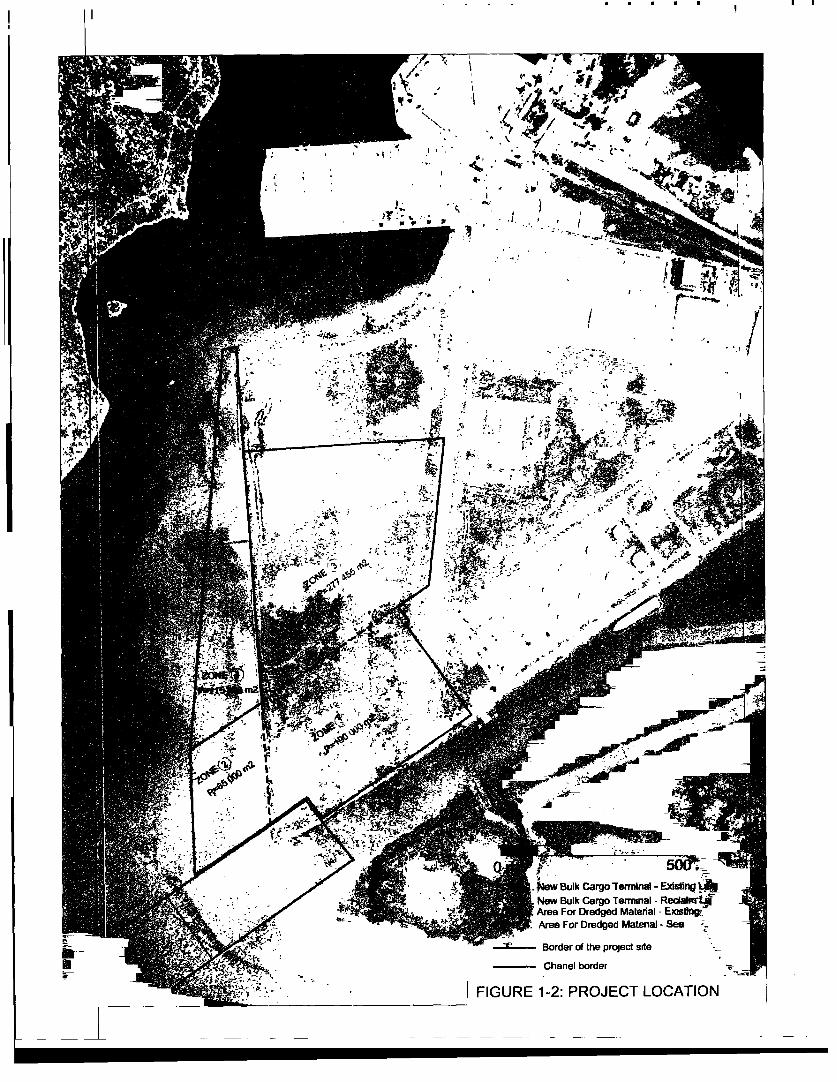
Figure 1-2: Project location
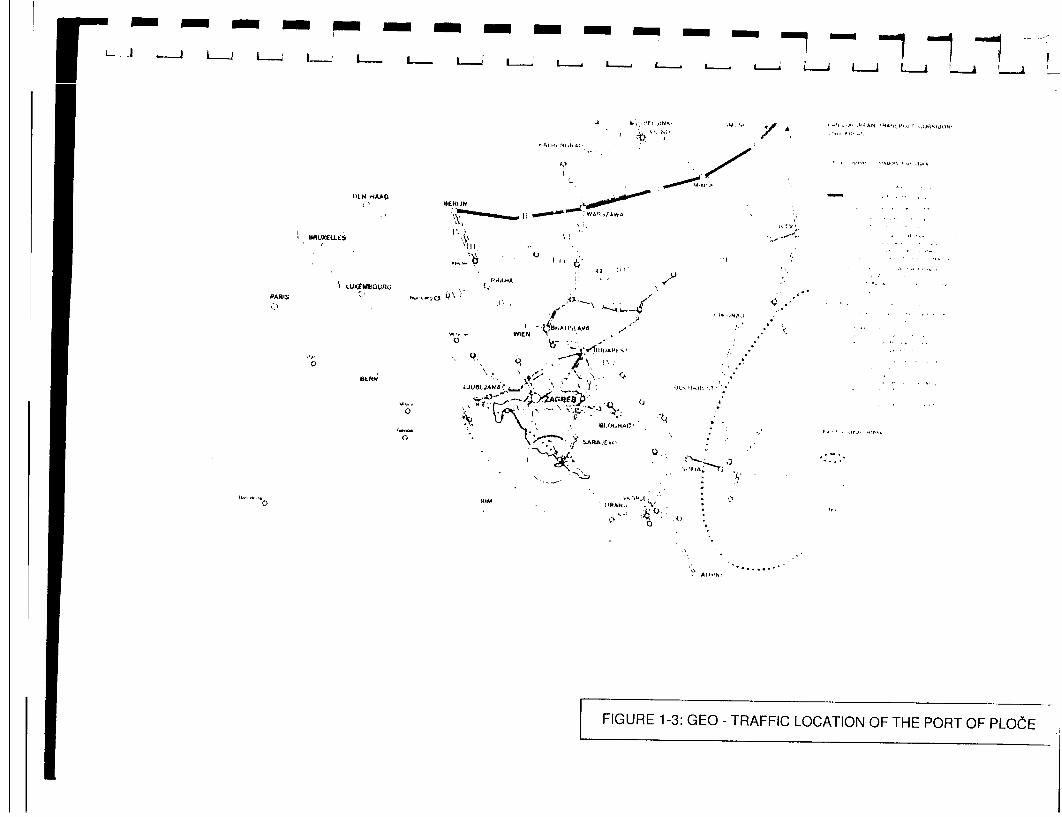
Figure 1-3: Geo-traffic location of the port of Ploce
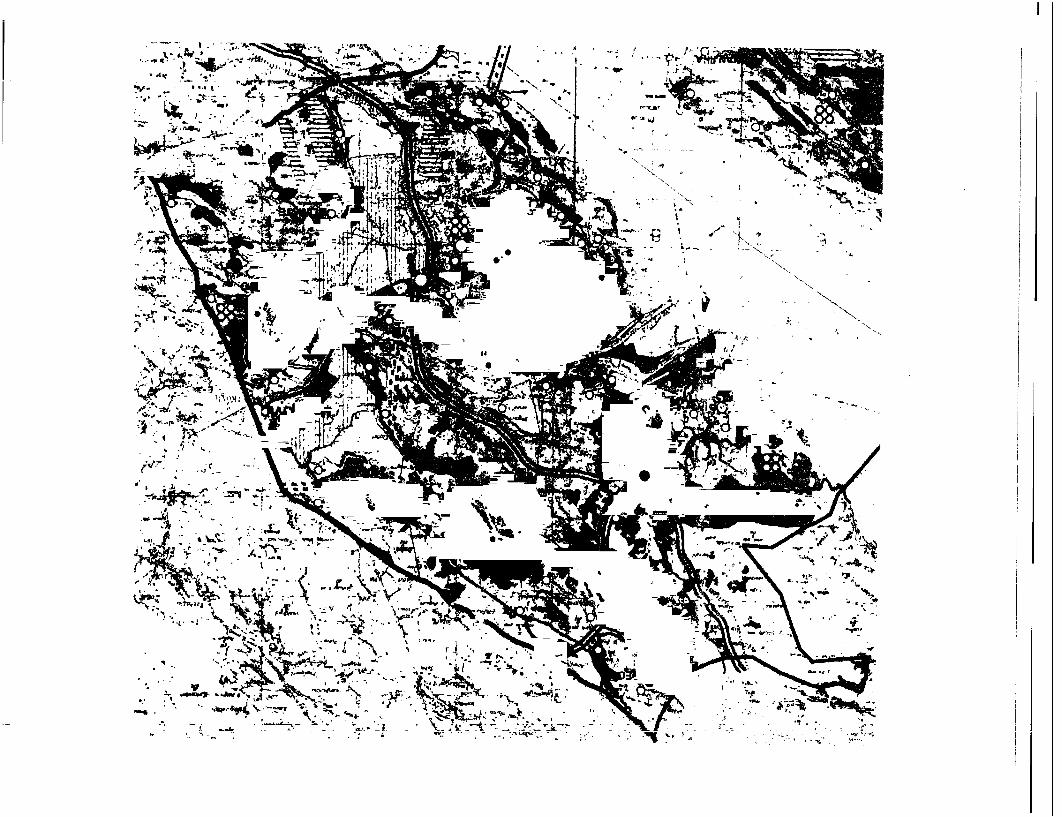
Figure 1-4: A map, use and purpose of space
Figure 2-1: Existing facilities at the Port of Ploce
Figure 2-2: Layout
Figure 2-3: Layout with ortophoto in background
Figure 2-4: Dredged material deposit
Figure 2-5: Water supply and drainage
Figure 2-6: Additional water supply from lake "Jezerina"
Figure 2-7: Equipment to be installed at the CBT Ploce
Figure 2-8: Hydraulic dredging - TSHD vessel
Figure 2-9: Mechanical dredging (crane/grab pontoon, back-hoe dredger)Figure 3-1: Protected areas in the project surroundings
Figure 3-2: Map of natural values
Figure 3-3: Map of identified marine communities
Figure 3-4: Annual course of air temperature in Plode
Figure 3-5: Annual course of precipitation for Ploce station
Figure 3-6: Annual course of precipitation and thunder days
Figure 3-7: Number of days with characteristic precipitation amountFigure 3-8: Time wind roses for Ploce and wind rose for all times togetherFigure 3-9: Average wind strengths for each direction
Figure 3-10: Locations of measuring stations
Figure 3-11: A trial borehole for the berth location with a bulk cargo storageFigure 3-12: A trial borehole for the location of the channel and entering partFigure 3-13: A surface layer of sandy and silt-like material at the berth location and
storage areas

Figure 3-14: A layer of silt-like sandy material at the locations of the berth and storageareas
Figure 3-15: A layer of gravel material at the locations of berth and storage areas
Figure 3-16: A surface layer of sandy and silt-like materials at the location of the channeland entering part
Figure 3-17: Location of sediment sampling
Figure 4.1.1-1: Impact on marine communities
Figure 4.1.2-1: Underwater noise emission level per 1/3 octave TSHD - a Taccola duringoperation (at 1m and at 1,pPa)
Figure 4.1.2-2: Change in pressure (underwater) during impact piling
Figure 4.1.2-3: Ground level emission of noise at different distances during dredging
Figure 4.1.2-4: Ground level emission of noise at different piling during piling
Figure 4.1.2-5: The worst possible case (ISO method)
Figure 4.1.2-6: The worst possible case (the Netherlands' method)
Figure 4.1.2-7: Imission level dependent on distance from the source (road) at 20 km/h
Figure 4.1.2-8: Imission level dependent on distance of the source (road) at 40 km/hFigure 4.1.2-9: Imission level dependent on distance of the source (road) at 60 km/h
Figure 4.2.1-1: Annual particulate emission from the New Cargo Bulk Terminal during thefacility operation
Figure 4.2.1-2: Maximum hourly concentration of particulate matter (PM-10) and totaldeposited matter (TDM)
Figure 4.2.1-3: Maximum hourly concentrations of fine particulate matter (PM-10) anddeposition when wind direction is between S and SSW carrying pollutiontowards the town of Ploce
Figure 4.2.1-4: Hourly concentrations of PM-1 0 for wind direction that causes the strongestimpact of the New Cargo Bulk Terminal in two locations in the town of Ploce
Figure 4.2.2-1: Noise map for the worst possible case (ISO method)Figure 4.2.2-2: Noise chart for actual situation (ISO model)Figure 4.2.2-3: Ground level emission of noise alongside the railway line

LIST OF TABLES
Table 0-1: Composition of sediments (main elements)
Table 0-2: Sound characteristics of construction machines
Table 0-3: Sound characteristics of hydraulic hammer for air
Table 0-4: Assumed noise emissions levels of equipment at the port terminal
Table 0-5: Noise emission levels for a bulk cargo terminal - calculated surface area of235 000 m3
Table 0-6: Maximum values obtained with ISCST3 model calculation
Table 1-1: Cargo traffic (in 000 t) via Port of Ploce from 1988 to 2004
Table 1-2: Projections of annual cargo traffic (in 000 t) for the period from 2000 to 2010
Table 2-1: Current facilities at the Port of Ploce
Table 3-1: Examples of some breeding species present in Neretva Delta listed in theAnnex I of the Bird Directive (NPL - protected by Nature Protection Law(Official Gazzete 70/05 of 27 June 2005) and by Ordinance for protection ofsome bird species (Aves) (Official Gazette 43/95 of 28 June 1995 amendedby O.G. 75/02 of 15 May 2002); EN - endangered; VU - vulnerable; NT -near threatened; LC - least concern; (bp) - breeding population)
Table 3-2: Examples of migrating and wintering species in Neretva Delta listed in theAnnex I of the Bird Directive (NPL - protected by Nature Protection Law(Official Gazzete 70/05 of 27 June 2005) and by Ordinance for protection ofsome bird species (Aves) (Official Gazette 43/95 of 28 June 1995 amendedby O.G. 75/02 of 15 May 2002); RE - regionally extinct; EN - endangered;NT - near threatened; (bp) - breeding population)
Table 3.2-1: Plant and animal species identified during the biological survey of the projectarea. Abundance: ccc - very numerous taxa; cc - very frequent taxa; c -frequent taxa; + - usually present taxa; r - rare taxa; rr - very rare taxa(according to Peres, J.-M. and H. Gamulin Brida, 1973)
Table 3.2-2: Identified marine communities
Table 3.4-1: Test results of total deposit matter (October 2005)
Table 3.4-2: Test results of total deposit matter (November 2005)
Table 3.4-3: Test results of total deposit matter (December 2005)
Table 3.5-1: Chemical composition of sediment (main elements)
Table 4.1.2-1: Sound characteristics of TSHD Taccola for water
Table 4.1.2-2: Sound characteristics of TSHD Taccola for air (A evaluated)
Table 4.1.2-3: Sound characteristics of construction machines
Table 4.1.2-4: Sound characteristics of a hydraulic hammer for air
Table 4.2.1-1: Limit and tolerable values of pollutant concentrations in ambient air relative tohuman health
Table 4.2.1-2: New Cargo Bulk Terminal emission parameters - ISCST3 model calculationinput data
Table 4.2-1-3: Maximum values obtained with ISCST3 model calculation
Table 4.2.1-4: The most important results of particulate (PM-10) concentration anddeposition calculation
Table 4.2.2-1: Assumed noise emission levels of equipment at the port terminal
Table 4.2.2-2: Noise emission levels for a bulk cargo terminal - calculated surface area of235 000 m2
Table 4.2.2-3: Maximum allowed evaluation levels of ground level emission of noise outdoor

PREFACE
Within the "Trade and Transportation Integration Project (TTI) Croatia", the project focused ondevelopment of the port of Ploce, the World Bank has been requested to participate in thefunding, among other items, of the construction of a new Bulk Cargo Terminal.
The Port of Ploce Authority (PPA), under the Ministry of Sea, Tourism, Transport and Development(MSTTD) of the Republic of Croatia, is acting as a Project implementation unit in this projectpreparation phase.
Prior to making the final funding decision, the WB has to be satisfied that:
1. the Project would not result in significant adverse environmental impacts,
2. the Project would include all necessary mitigation measures to minimise any adversechange in the environmental conditions in the marine, terrestrial and nature reservesurroundings of the project site,
3. elements of the investment programme, in particular the new Bulk Cargo Terminal,conform with national and EC legislation and international conventions in theenvironmental field
In order to ensure the to-be-financed project is environmentally sound and sustainable, and thusto improve decision making, the WB requires environmental assessment (EA) of the project tobe performed.
The WB has classified this project as "A" project, requiring Environmental Impact Assessment(EIA) Study, including Environmental Management Plan (EMP), and public consultation. TheEMP is presented as part of this EIA Study/Report, as well as a separate document.
An initial public consultation, as part of the WB-required process, was held in the town of Plocein October 2006. Additional public consultation on the EIA study and results will be part ofnational EIA process, to be initiated by the Croatian Ministry of Environmental Protection,Physical Planning and Construction according to national legislation in environmental field. TheEIA, written in Croatian language, is expected to be made available to the public inFebruary/March 2006, upon resolution of the specially appointed EIA Commission.
Developer of the EIA Study:
EKONERG, Energy and Environmental Protection Institute, Ltd.Zagreb, Croatia, January 2006

EA and EMP for New Cargo Bulk Terminal at the Port of Ploce EKONERG d.o.o.
0. EXECUTIVE SUMMARY
1. General
This document is a part of the Environmental Assessment Report developed for the World Bank(WB) to make an appraisal of the Cargo Bulk Terminal (CBT) Project in the area of Port ofPlo6e.
In addition to the environmental assessment (EA), the Investor, the Port Authority of Ploce, ispreparing also an Environmental Impact Assessment Study (EIAS) based on the Croatianlegislation. EIASs in Croatia are developed in accordance with the Environmental Protection Act(Gazette 82/94, 128/99) and the Ordinance on Environmental Impact Assessment (Gazette59/00, 136/04). When making an EIA Study also any other relevant Croatian laws, bylaws andregulations should be observed inclusive of applicable international agreements signed by theRepublic of Croatia. In spite of some differences in the contents of EA and EIAS, it is a questionof similar document. Consequently, this EA integrates the most relevant facts and results of theenvironmental impact assessment of CBT including also the measures for environmentalprotection and a monitoring plan.
The Port of Ploce is situated in the area of the south Croatian seaside along the arterial roadconnecting the towns of Split and Dubrovnik. It is some hundred kilometres away from thosetwo well know Croatian towns. This one of rare places where, beside good maritime conditionsand a natural bay, there is an exceptionally good lowland railway connection towards the inland.This means that Ploce has a potential large gravity area covering, in addition to Croatia, alsoBosnia and Herzegovina, Serbia and Monte Negro, and a substantial part of the Central andEaster European countries (a part of Austria, Hungary, Check Republic, Slovakia, Poland, andRomania) cf. Figure 1-3 in Chapter 1.
It was already at the end of 19th century when the railway Metkovic-Sarajevo was built thusopening the possibility of goods transport to hinterland. The port construction started in 1939and was commissioned after the World War II, in 1945. The port traffic was growing from year toyear and in 1988 it reached some 4.5 million tons. During the Croatian War of Independence,the traffic decreased to only 268,000 tons (1994). Pursuant to the decision by the Governmentof the Republic of Croatia of 13 February 1997, the Port Authority of Ploce was set up as apublic, non-profit organization responsible for construction, maintenance, management,protection and improvement of the port traffic. Since 1997 the Port of Ploce has beenreconstructing and repairing its obsolete and damaged port facilities, which helped it to increaseits traffic to some 2 million tons in 2004.
The terminal planned for bulk cargo is one of the projects that will additionally improve andincrease the traffic to some 5 million tons planned in 2010.
At the place of the present-day port, there were hardly any indigenous villages so the increasein the town of Ploce inhabitants took place along with the construction and increase in the Port
Executive summary, Page 1 / 18

EA and EMP for New Cargo Bulk Terminal at the Port of Ploce EKONERG d.o.o.
traffic. In terms of social-economic aspect, the lives of almost all inhabitants of Ploce are directlyor indirectly related to the Port.
This is the reason for relatively high tolerance to environmental impacts (dust and noiseemission, etc.) that are unavoidably generated by the Port. The inhabitants of Ploce are readyto endure adverse impacts of the Port far beyond the applicable standards.
Another important characteristic of the area is the vicinity of the Neretva River Delta ofexceptional local, regional, and even continental ecological importance. The spring of theNeretva River is at the foot of Zelengora Mountain in Bosnia and Herzegovina (BiH) 1095 ma.s.l. Its watercourse runs first in NE direction to Konjic and then turns southward forcing its waythrough the canyons and mountain-encircled valleys to the sea in the area of Ploce. Its totallength is 225 km of which 203 km in BiH and 22 km in the Republic of Croatia. Around Metkovi6,some twenty kilometres from its mouth, a wider area of the Neretva Delta starts - some 246 km2
surface area.
The Neretva Delta is the only Mediterranean wetland habitat in Croatia and one of the last in theMediterranean, which gives it also international importance.
Because of its natural values, the Neretva Delta is anticipated for protection in the nature parkcategory by the strategic documents (National Strategy and Action Plan for Biodiversity andLandscape Protection, Strategy of Physical Planning in the Republic of Croatia, and PhysicalPlan of Dubrovnik-Neretva County). It has also been included in the Ramsar List of wetlands ofinternational importance and in the Important Bird Areas Program implemented by the BirdLifeInternational.
As a result of favourable geographical characteristics, there are two very different areas in itsvicinity - the Port of Ploce and a very valuable ecological area.
Although no substantially adverse impacts of the Port of Ploce on the natural values of theNeretva Delta have been identified thus far (the impact of intensive farming in some parts ofDelta is much more serious), when making the environmental impact assessment of CBT,special attention should be paid to the Project impact on this ecologically valuable region.
Executive summary, Page 2/ 18

EA and EMP for New Cargo Bulk Terminal at the Port of Plo6e EKONERG d.o.o.
2. Proiect Description
The entire CBT Project is planned at the area that, pursuant to the applicable physical planningdocuments, is intended for development of the Port of Ploce. That area covers some 230hectares of which only its smaller part (c. 83 hectares) is used for the existing facilities:
Dry Bulk Cargo 9.35 haGeneral and Loose Cargo 11.42 haTimber Storing 8.64 haLiquid Cargo 17.68 haSpecial Cargo 20.00 haCooling Facilities 0.20 haMaintenance and Repair 2.24 haPassenger Terminal 1.50 haOffice Buildings 1.44 haGarages 2.96 haArea Built but not Used 7.29 ha
Total Built 82.72 haArea for future development 147.58 ha
TOTAL 230.30 ha
CBT area will cover below areas:
. Access channel to the CBT berth and the entering part of Vlaska Channel, which should bedredged to achieve depth of 16 m for 80,000 DWT ships;
. Zone 1: The main area of the terminal planned on the current onshore part of the Port ofPlo6e onto which material was dumped for years from dredging and maintaining the accesscanal and Vlaska channel for the needs of the existing terminal for liquid cargo (zone 1surface area of 190,000 M2).
. Zone 2: An area planned for construction of berth, storage area along the berth, and anew working area for the future expansion of the terminal. Zone 2 of 65,000 M2 will be fullydeveloped as land expansion to the current offshore zone, which requires backfilling of sea(reclamation) at depths to 4.80 metres;
. Zone 3: Onshore area of the Port of Ploce of 277,455 M2 provided for disposal of thematerial dredged;
. Zone 4: Offshore contained part of the Port of Plo6e of 115,200 m2 provided for disposalof the material dredged - maximum depth of 4.80 to 5.90 metres;
Figures 1-1, 1-2 (Chapter 1) and Figure 2-1 (Chapter 2) shows the area of the Port of Plocewith current facilities plotted in and the areas provided for construction of the CBT. Figures 2-2and 2-3 (Chapter 2) shows the terminal (CBT) and its main facilities.
Executive summary, Page 3 / 18

EA and EMP for New Cargo Bulk Terminal at the Port of Ploce EKONERG d.o.o.
Basic data on CBT:
* Import: 4.600.000 ton of coal, bauxite and iron ore per year* Storage Capacity: 700,000 ton (main storage area) plus 60,000 ton (storage area along the
berth for emergency use only)Average ship unloading rate: 35.000 ton per day (unloading from 80.000 DWT ships)Average wagon loading: 15.000 ton per day
* Approximately 78 port calls per year* Service time per call manoeuvring, hatch moving, etc: 8 hours per call* Total berth occupancy: 175 days (unloading from 80.000 DWT ships)* Up to 350 working days per year
New Bulk Cargo Terminal is designed to perform the following main operations:handling bulk cargo as coal, iron ore, bauxite from ocean going ships,load rail wagons for transhipment of those products to the hinterland,provide a strategic and operational stocks for the operations and
* provide auxiliary services such as weighing, sampling and quality control.
The Project planned covers:* deepening and broadening of access channel to CBT berth and to the Vlaska Channel
(dredging),* construction of the CBT berth and development of a new surface area by reclaiming the
sea area,* construction of storages (main storage area and outdoor storage alongside the berth that
will be used for emergency use only),* construction of supporting infrastructure, and* use of the Project, i.e., use and operation of the bulk cargo terminal
The layout of CBT has been determined after a few options had been analyzed. The locationchosen is almost fully drawn out of the Vlaska Channel thus eliminating the works within thenature park planned (left, i.e. south bank of the Vlaska Channel remains untouched) andconsiderably reducing the works on broadening the access navigable channel/waterway to theberth and terminal location.
To allow ships up to 80,000 DWT to come to the terminal, current navigable waterway shouldbe broadened and deepened (dredged). Current channel is dredged to approximately 11.0 to12.0 m below sea level. The required depth of the future channel is 16.0 m below sea level. Therequired bottom width of the future channel is 120 m. Slide slopes are assumed to have aninclination of 1:3 (in line with side slopes of the existing channel).
Two technical solutions for broadening and deepening of the access navigable waterway havebeen analyzed, which involves dredging of some 553,000 m3 of the material from the sea
Executive summary, Page 4/18
EA and EMP for New Cargo Bulk Terminal at the Port of Ploce EKONERG d.o.o.
bottom and its disposal at the Zone 3 and if need be also at the Zone 4, which, if utilized, will beconstructed as a confined disposal area1 .
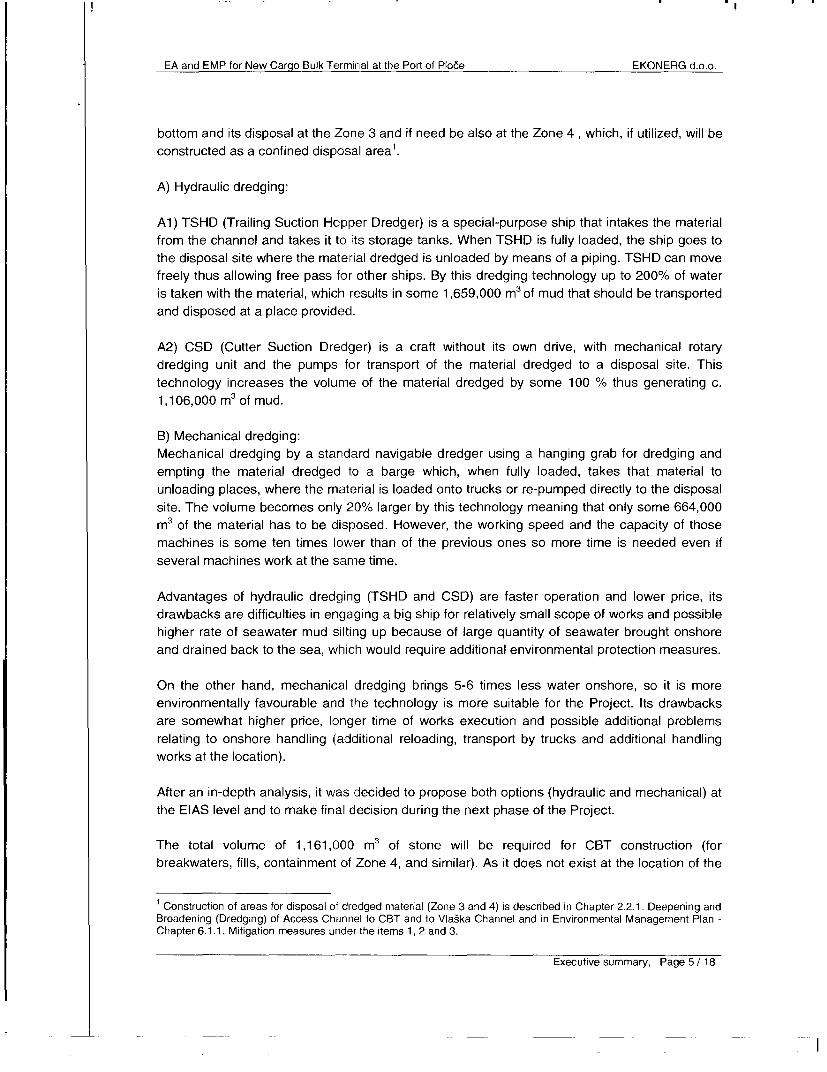
A) Hydraulic dredging:
Al) TSHD (Trailing Suction Hopper Dredger) is a special-purpose ship that intakes the materialfrom the channel and takes it to its storage tanks. When TSHD is fully loaded, the ship goes tothe disposal site where the material dredged is unloaded by means of a piping. TSHD can movefreely thus allowing free pass for other ships. By this dredging technology up to 200% of wateris taken with the material, which results in some 1,659,000 m3Of mud that should be transportedand disposed at a place provided.
A2) CSD (Cutter Suction Dredger) is a craft without its own drive, with mechanical rotarydredging unit and the pumps for transport of the material dredged to a disposal site. Thistechnology increases the volume of the material dredged by some 100 % thus generating c.1,106,000 m3 of mud.
B) Mechanical dredging:Mechanical dredging by a standard navigable dredger using a hanging grab for dredging andempting the material dredged to a barge which, when fully loaded, takes that material tounloading places, where the material is loaded onto trucks or re-pumped directly to the disposalsite. The volume becomes only 20% larger by this technology meaning that only some 664,000m3 of the material has to be disposed. However, the working speed and the capacity of thosemachines is some ten times lower than of the previous ones so more time is needed even ifseveral machines work at the same time.
Advantages of hydraulic dredging (TSHD and CSD) are faster operation and lower price, itsdrawbacks are difficulties in engaging a big ship for relatively small scope of works and possiblehigher rate of seawater mud silting up because of large quantity of seawater brought onshoreand drained back to the sea, which would require additional environmental protection measures.
On the other hand, mechanical dredging brings 5-6 times less water onshore, so it is moreenvironmentally favourable and the technology is more suitable for the Project. Its drawbacksare somewhat higher price, longer time of works execution and possible additional problemsrelating to onshore handling (additional reloading, transport by trucks and additional handlingworks at the location).
After an in-depth analysis, it was decided to propose both options (hydraulic and mechanical) atthe EIAS level and to make final decision during the next phase of the Project.
The total volume of 1,161,000 m3 of stone will be required for CBT construction (forbreakwaters, fills, containment of Zone 4, and similar). As it does not exist at the location of the
' Construction of areas for disposal of dredged material (Zone 3 and 4) is described in Chapter 2.2.1 .Deepening andBroadening (Dredging) of Access Channel to CBT and to Vlaska Channel and in Environmental Management Plan -Chapter 6.1.1. Mitigation measures under the items 1, 2 and 3.
Executive summary, Page 5/ 18

EA and EMP for New Cargo Bulk Terminal at the Port of Ploce EKONERG d.o.o.
Port of Ploce the stone material will be provided from excavations made for construction of anearby section of the Adriatic Highway.2
The construction of the new 7.5 km long access road for transport of reclamation-purpose andsoil-improvement stone to the CBT area, and an environmental impact assessment for thoseworks will be a subject matter of a separate EIA Study. The access road and highway section toPloce design and EIA preparation are in progress (financed by HAC, Croatian Highway Corp.).
Beside stone supplied from the places outside the location of the Port of Ploce, some freshwater will also be supplied for the needs of the CBT (wetting water to prevent dust emission,firewater, and similar). Water for those needs will be supplied by a separate water supplypipeline from a lake Jezerine at the foot of Veliki Trovro Mountain (Figure 2-6, Chapter 2).
3. Environmental Characteristics of Site and its Vicinity
Land Ecology
As already mentioned in the introduction, there are many valuable ecological regions - eitherprotected or recommended for protection. The natural values protected and the regionsforeseen for protection in the broader region of the Project location are showed on Figure EA-5.The closest to the port area are special ichthyological and ornithological preserves Parila Lakeand Neretva Mouth.
Because of its natural values, the Neretva Delta is anticipated for protection in the nature parkcategory by the strategic documents (National Strategy and Action Plan for Biodiversity andLandscape Protection, Strategy of Physical Planning in the Republic of Croatia, and PhysicalPlan of Dubrovnik--Neretva County). It has also been included in the Ramsar List of wetlandsof international importance and in the Important Bird Areas Program implemented by theBirdLife International.
Habitats in the area of the Neretva Delta could be grouped in several categories of which themost important ones from the nature protection point of view are the habitats of surface landwaters, wetland habitats, and the seacoast. In the Delta, there is the most developed area ofbrackish waters in Croatia with the most representative saltmarshes, shoals, and muddymarshes overgrown with halophytes (communities of glasswort, Salicornia Spp.), areas withreed-patches, and the lagoons of Vla§ka and Parila. Prominent also are Neretva current waterswith backwaters Desanka and Crna Rijeka, and Matica, then the lakes of Bacinska, Birina,Vlaska, Desne, and a number of water sources (Modro oko, Klokun, and others).
On the SE part of the Neretva mouth (some 2 km from the Project location), there is anichtyiological-ornithological reserve (Neretva mouth). The Physical plan of Dubrovadko-
2 Based on current and planned status of these activities, the licensing process (location permit, construction permit)and the construction of the access road and delivery of stone material to the Port area is expected to be largelyharmonized with the CBT Ploce planned schedule of licensing and development activities.
Executive summary, Page 6/ 18

EA and EMP for New Cargo Bulk Terminnal at the Port of Plo6e EKONERG d.o.o.
neretvanska County anticipates the area of Ploce-Parila near the Project location for isproposed for protection as an ichtyological and ornithological preserve. The Parila Lagoon isone of very few conserved lagoons and a very suitable place for fish spawning and feeding andgrowing of fish fry. There is a series of fish species breeding there - a few species of greys, seabass, sole, gilthead, and others. It is an important habitat of abundant population of chequeredcarpet shell (Tapes decussates) and vital for birds migration and wintering.
In the Delta area, there are three ornithological preserves, Pod Gredom (Vid, Prud (Metkovic),and Orepak (Kula Norinska), and an ichthyological-ornithological preserve the Neretva Mouthincluding a large area with glasswort at the very entrance of Neretva River into sea.Furthermore, there are surrounding shoals and lagoons important as a resting place during birdmigrations and for wintering and nesting of numerous bird species, as well as for fish spawning,and feeding and growing of fish fry.
At the very location of CBT, vegetation is meagre and grows on the material dredged from seawhen the Vlaska Channel was broadened. In terms of environmental protection, this area doesnot have either local or regional importance.
Marine ecology
For the EIAS purpose diving survey, during days and nights, to detect communities of the seabed and coast and the composition of flora and fauna in the area that will be dredged wasconducted. Results are displayed in:
* table of identified plant and animal species (Table 3.2-1 in Chapter 3)* table of identified marine biocenoses (Table 3.2-2 in Chapter 3)
map of marine biocenoses distribution (Figure 3-3 in Chapter 3)
In the project broader area fish population and population of other economically importantorganisms are still relatively rich and only partly affected by human activities. Some of theseorganisms inhabit this area permanently, either as a benthos or in pelagic zone, while otherscome occasionally to seek food, shelter or for spawning. Economically most importantorganisms are European eel (Anguilla anguilla), Mugil spp., diverse fish from familiy Sparidaeand Striped red mullet (Mullus surmuletus). Moreover, marine shrimps Crangon crangon,Penaeus keraturus (usually inhabit depths between 10 and 40 m) and Squilla mantis are alsoimportant for the local economy. There are numerous cephalopods such as squids Loligovigaris and L. media, Common cuttlefish (Sepia officinalis) and to a less extent Commonoctopus (Octopus vulgaris). Diverse cockles from genus Cardium and genus Venerupis are alsopresent.
Almost all mentioned species migrate through the Vlaska Channel. The largest is the migrationof adult eels toward the sea in the autumn. Before winter Gilthead seabream and soles migrateupwards through the channel for spawning. Moreover, diverse fish and molluscs come in theshallow waters in the autumn and spring. Daily migration is also important in the area, fish fromfamily Sparidae and genus Mullus and especially pelagic cephalopods come during night. Thus
Executive summary, Page 7 / 18

EA and EMP for New Cargo Bulk Terminal at the Port of Ploce EKONERG d.o.o.
"'small" fishery is developed in the area of Ploce City. Unfortunately, in the moment it is muchunorganized and illegal fishery prevails. Diverse fishing devices are being used but we willmention only the ones which are being used in the project area. Bivalves are harvested in theshallow sea and trawl lines are thrown in the Vlaska Channel during day. During nightnumerous fishing nets are being thrown and crustaceans are harvested. Moreover, duringdiving survey of area nearby the location of new CBT shells' remains of protected bivalve Pinnanobilis have been found but no living organisms were found.
Characteristics of Marine Sediments
The results of 28 off boreholes have been analyzed for the EIS which were made onshore andoffshore. Granulometric composition of sea bottom layers in the terminal area is illustrated onFigure 3-16 (Chapter 3) by a curve of maximum and minimum graduation.
It is obvious that analysed layers consist of fine particles (sand and silt) and that 60-90 percentof particles are smaller than 0.1 mm, and 10-45 percent of particles are smaller than 0.01 mm.
Sediment samples taken on two places on the sea bottom are from five sea depths. Onesample is taken close to the CBT at 10 m depth, and the other at 20 m depth at a distance ofsome 800 metres towards the high sea. The samples have been adequately processed andsubject to chemical analysis in a certified laboratory (ACME - Analytical Laboratories Ltd. 852 EHastings Street, Vancouver, BC, Canada). Forty one (41) off elements have been identified inthe samples. Following Table 0-1 shows the results for the main elements. The results arewithin the limits for fully clean areas taking into account local natural conditions.
Table 0-1: Composition of sediments (main elements):ELEMENT Mo Cu Pb Zn Ni Co Mn As Cd Ca P CrSAMPLES ppm ppm p p ppm ppm ppm .pp ppm % % ppm1 Om 5cm 0.6 20.5 21.1 71 41.2 10.7 507 14 0.3 11.7 0.054 59.6lom 10cm 1 19.4 21.3 72 38.8 10 515 13 0.2 11.56 0.053 59.71 Om 15cm 0.7 17.9 20.4 71 36.7 9.6 487 14 0.3 12.93 0.056 57.81 Om 20cm 0.8 14.4 17 60 31.6 8.7 472 11 0.1 12.54 0.049 50.810Om 25cm 0.8 14 16.1 60 30.6 9 453 9 0.2 12.6 0.046 47.820m 5cm 1.1 24.5 25.2 81 44.1 10.7 459 13 0.4 16.52 0.053 5720m 5cm R 1.3 27.8 26.6 88 49.1 12.7 439 15 0.5 15.9 0.056 61.620m 15cm 1.6 27.1 26.9 87 45.3 13.2 520 14 0.4 16.21 0.052 59.220m 25cm 1.4 25.4 27.6 89 48.3 13 524 13 0.4 17.03 0.055 53.220m 25cm R 1.5 29 30 94 50.7 12.3 515 15 0.4 17.06 0.057 57.7
Executive summary, Page 8/ 18

EA and EMP for New Cargo Bulk Terminal at the Port of Ploce EKONERG d.o.o.
Site Meteorology
Basic meteorological characteristics in the area of Ploce have been developed from the weatherstation Plo6e located on site at 2 m a.s.l. Data are available from the period 1978-1994.
The climate in the area of Dalmatian coast and also in the area of Plo6e is Mediterraneanclimate characterised by moderately warm and rainy winters and with hot and dry summers.
Maximum mean monthly air temperature is about 25 degC in July and August and minimummean air temperature is in about 6 degC in January.
Average annual relative humidity is some 63%, the lowest being in summer months and thehighest in October and November.
Total annual precipitation for Plo6e amounts 1100 mm on average. The precipitation amount isminimal in summer months and maximal in late fall (October and November).
Annual course of the number of days with precipitation and thunder is showed on Figure 3-6(Chapter 3). Two maxima could be noticed - one in the spring months (March, April) and theother in the fall (October, November, and December). On average there are about 100 days peryear with precipitation although the largest number of days with less than 1 litre/M2. The amountof precipitation in some 10% cases is larger than 10 litres per square metre and in some 5%cases it is larger than 20 litres per square metre, whereas there are only 3 days in a year whenvery heavy precipitation could be expected (50 litres per square metre and more).
Air quality
The time wind roses show that the flow direction from the north quadrant (N-E) prevails in themorning and in the evening, whereas during the day the air flow is from the west and south-westdirection. Considering all that (all three climatological observation times) in the area of Plocenorth winds prevail.
The most frequent wind is not at the same time the strongest by its intensity. The strongestwinds are related to south-east (SE) flow direction.
Five monitoring stations have been installed for the purpose of EIA Study to measure totaldeposited matter (TDM) and the following parameters in TDM: insoluble and soluble part; lead(Pb), cadmium (Cd), thallium (TI), aluminium (Al) and iron (Fe) in insoluble part; calcium (Ca2 ,),chlorides (Cl-) and sulphates (SO42-) in soluble part.
Monitoring started at 1st of October 2005 and three-months results show that concentrations oftotal deposits and the elements contained therein on all monitoring points are inside the limitvalues stipulated by the Regulations about limit values of pollutants in air (Gazette 133/05).
Executive summary, Page 9 / 18

EA and EMP for New Cargo Bulk Terminal at the Port of Plo6e EKONERG d.o.o.
4. Environmental impact assessment
It was assessed that possible significant environmental impacts are the following:
* Impact on sea water quality and on marine communities* Noise impact* Impact on the air quality* Waste production
Impact on sea water quality and on marine communities
The largest impact on sea water and marine communities during the construction of CBT isproduced by excavation/deepening of sea bed for the ship landing. Rising of sediment andincreased sedimentation of particles on the both sides of construction works will occur duringthis stage.
Due to shallow sea and large inflow of fresh water from the Bacinska Lakes, the Neretva Riverand other smaller sources most of the colloid particles will be kept in an upper layer with smallerdensity. Because of that dispersion of particles will be large and their sedimentation will occur ina large area thus with smaller amounts per area unit. Larger impacts on marine communitieswill appear only in the relatively small area near construction works. Any impact in areas moredistant than 400 m in all direction is not expected.Impacts in the excavation area, approximately 15 ha, is high because the upper layer ofsediment with all benthic organisms will be removed. Sedimentation of material will havenegative impact on benthic organisms only for a short period because they will return fast to thesediment surface. It can be assumed that the major negative impact will be on organisms whichlive on the sea bed and can not move e.g. sea grass from genus Posidonia and algae.
Due to construction of the Zone 2 and Zone 4 (if needed) of the terminal a part of the sea bedwill be covered including biologically important area with protected bivalve Pinna nobilis3 andthe sea grass. This is an important negative effect of the project. Although negative, the impactis of very limited range as important species located there are present in other areas in thevicinity and the percentage of destroyed population is almost negligible.
Noise impact
There is a noise impact both during construction and during the operation. Because of specialcharacteristics of some sources and their environmental impact, the noise impact during theterminal construction has been considered through three project phases:
- excavating of sea bed for ship approach to the CBT- construction works on the coast and its skirting part- berth construction - piling
3During diving survey no living organisms but only shells' remains have been found.
Executive summary, Page 10 / 18

EA and EMP for New Cargo Bulk Terminal at the Port of Ploce EKONERG d.o.o.
Excavating of sea bed Trailing Suction Hopper Dredger" was analysed in detail as a worsttechnology. Noise generated by TSHD, later in the document considered as one source, comesfrom several different components. Primary components are divided according to theenvironment to which they emit noise:
a) Noise to water: suction pipe, operating propeller, generators, gearbox, pumpsb) Noise to air: ship's engine, generators, ventilation systems, pumps
It is used the emission level generated by TSHD Taccola (Ref. Langworthy 2004, AnAssessment of the Underwater Noise Radiated by the Dredger Taccola, Report No. 614 R0205). The capacity of TSHD Taccola is 4400 m3, and the one foreseen by the technicalanalysis 5000 m3. They are both categorized as medium size TSHDs. Since the split up withinthe group is made according to the capacity, the ship selected could be consideredrepresentative.
Table 0-2 reviews the noise emission level by octaves for heavy-duty construction machinesused at the begging stage. Later on, this situation will be modelled as the worst possible case.Data have been taken from DEFRA, Update of Noise Database for Prediction of Noise onConstruction and Open Sites 2005.Table 0-2: Sound characteristics of construction machines
Noise Source Sound power per octaves, dB(A) Lw63 125 [ 250 500 1 k 2k 4k [8k dB(A)
Dumper 90 97 101.3 105.4 107.8 108 102.6 95 113Dozer 82.8 93.9 92.4 89.8 94 91.2 89 85.1 100.1Tracked
70.8 88.9 81.4 89.8 90 89.2 84 78.1 96excavator ILoader 88.3 89.2 90.5 94.7 99.1 98.5 90.1 78.2 103.4Generator 62.8 72.9 78.4 76.8 79 81.2 77 74.1 86.3Roller 73.8 78.9 88.4 88.8 87 83.2 75 67.1 93.6Pile driver 66.8 68.9 76.4 80.8 90 932 93 89. 1 97.8
The only technique still used for construction of berths and underwater piling is impact piling(hammer piling), which is also the noisiest method.
At this stage of design development, no specific piling equipment has been selected. On themarket, there are diesel, air, steam and hydraulically operated pile hammers. They are listedherein according to the noise emission level they radiate, from the most silent to the loudest.They also considerably differentiate according to the place of piling, under or above the waterlevel, which depends on the noise level radiated to air or water. When determining the noiseemission levels, the worst possible case will be considered - the noise emission level; the leastfavourable case for each medium.
Noise emission level to air will be taken according to DEFRA. For piling 0 600 mm piles, a 5 tonhydraulic hammer is sufficient. Below are its noise emission levels per octaves (Table 0-3).
Executive summary, Page 11/ 18

EA and EMP for New Cargo Bulk Terminal at the Port of Ploce EKONERG d.o.o.
Table 0-3: Sound characteristics of a hydraulic hammer for airNoise Source Sound power per octaves, dB(A) Lw
63 1125]250 500 1 k 2k 4k 8k dB(A)Hydr. hammer 75.8 85.9 93.4 105.8 103 99.2 96 9.1 108.7
Noise in Water
Theoretically, it is difficult to assume sound propagation in shallow coastal belt. Sometimes, thecalculations are made with cylindrical and sometimes with spherical divergence. Each methodgives better results at a certain distant area and a certain location.
British Petrol (BP) conducted a series of geological investigations on the south-east of Englandin a underwater area similar to that around Ploce (An Investigation Of Underwater SoundPropagation In Shallow Coastal Waters, by J. R. Nedwell (Subacoustech Ltd.), K. Needham(Subacoustech Ltd), A. W. H. Turnpenny (Fawley Aquatic Research Laboratories Ltd.) and R. M.H. Seaby (Fawley Aquatic Research Laboratories Ltd.)). The Port of Poole Bay, situated at theriver mouth has an average sea depth between 5 and 20 metres and shallow sea depth of 1 to5 metres. The sea bottom is sandy with gradual increase in depth. By mathematical calculationand calculation modelling for theoretically ideal sea surface, expected attenuation of sound ofsome 40log(R) was obtained, but actual measurements during rough sea showed soundattenuation between 21log(R) and 261og(R). Since underwater noise sources have the highestintensity at low frequencies similar to those used by so called "airgun" for geologicalinvestigations, the results of that investigation are used for predicting sound propagationattenuation in water.
Dredging - deepening and broadening of access channel to CBT berth and to the ViaskaChannel
For assumed noise emission level of 180.4 dB (1,pPa), below are the ground level emissionsdepending on the source distance (Figure 0-1).
Dredging200180160 -140 - -- - - - ~ -- - _
120 7 - -0 100 _ __ ___. = ~~~~~~~~~~~~21 log(R)0~100
m 80 V-2610g(R)80
, 60) 402 20 _
01< ,e p 4p , ,e es<og,e 0,, N .°t
Distance from the source [m]
Figure 0-1: Ground level noise intensity at different distances during dredging
Executivesummary, Page12/18

EA and EMP for New Cargo Bulk Terminal at the Port of Ploce EKONERG d.o.o.
Piling
According to above described theory of sound wave propagation in water/sea, below is ground-level emission depending on the distance from the source (Figure 0-2). The level of noiseradiated by a hydraulic hammer is 194 dB (1,u Pa).
Piling
200
al16°0gl140 _ X 120 X 21iog(R)
-261og(R)|E60
4 2022004 01 1 a 0N (N 0N 0N 04 N 04 0N 0N 0N 0404
Distance from the source [m]
Figure 0-2: Ground level noise intensity during piling
Noise during CBT construction
The calculation does not take into account meteorological correction. A coefficient of soilabsorption is 0 (zero) and land is assumed completely flat. The calculation parameters of soundattenuation due to air absorptions are:- Temperature 200C- Pressure 101.33 kPa- Relative humidity 60%
The situation was modelled according to ISO (described in document ISO 9613-2).
Noise emission during operation of CBT
Table 0-4 gives a review of assumed emission levels of ship unloader, trucks and cranes peroctaves.
Executive summary, Page 13/18

EA and EMP for New Cargo Bulk Terminal at the Port of Ploce EKONERG d.o.o.
Table 0-4: Assumed noise emission levels of equipment at the port terminalNoise Source Sound power per octaves, dB(A) Lw63 125 250 500 1 k 2k 4k 8k dB(A)
Gantry crane 82.9 92 95.5 99.9 103 105.3 100 88 109Conveyer belt 39 58.1 62.6 71 69.2 68.5 60.2 49.1 75 dB(A)/mStacker/reclaimer 75.8 84.9 88.4 92.8 96 98.2 93 85.9 102Loader 88.3 89.2 90.5 94.7 99.1 98.5 90.1 78.2 103.4Train loading station 82 101.1 105.6 114 112.2 111.4 103.2 92.1 118Truck 78.8 89.9 97.4 98.8 101 100.2 98 86.9 106.4Truck crane 80.8 85.9 89.4 90.8 91 88.2 81 70.9 96.7
Table 0-5 gives a review of noise emission level per octaves for a point source.
Table 0-5: Noise emission levels for a bulk cargo terminal - calculated surface area of 235 000m52
Noise source Sound power per octaves, dB(A) d)LwNoise souce 63 | 15 |250 |500 l k |2k |4k I 8k dB(A)Terminal 66.8 85.9 96.4 105.8 110 114.2 112 108.1 118.7
Two situations are modelled: the worst possible scenario and a scenario that best resemblingthe reality. Both understand 24-hour work time of the terminal when a ship arrives to the port. Itis assumed that all noise sources, except for auxiliary loaders and trucks, and auxiliary truckcrane, are continuous emitter of noise during that time.
In relation to noise impact it is concluded the following: By determining the noise impact a worst-case scenario is considered. Such includes the minimal construction time and therefore,development of more construction activities at the same time. Modelling was done according toISO 9613 standard, which is regulated by the Croatian Noise Protection Act (Official GazetteNo. 20/03)
According to the noise maps (Figures 4.2.2-1 and 4.2.2-2 in Chapter 4), it is obvious that thenoise from the CBT location does not influence the population areas of Ploce (Ordinance onhighest noise levels in areas where people live and work, Official Gazette No. 20/04).
As for the noise influence on marine species it is difficult to make a final conclusion. No countryin the world has regulations on that matter and since the monitored area is not from the specialinterest for the underwater world it is assumed that there would not be a significant impact.
The problem appears in the area of nature preserve in Delta of Neretva River. The regulation donot prescribe the permissible noise levels for this area, but in order to respect the generalrecommendations of the majority of European and world countries - related to noise influenceon birds - the necessary abatement measures should be carried out. The scope of measureswill depend on detailed monitoring which will be conducted during the later phases of Project.
Birds, except for owls, have hearing organs that cover the same range of sound frequenciesand level like people so generally the limits for the highest allowed levels of noise stipulated for
Executive summary, Page 14/18

EA and EMP for New Cargo Bulk Terminal at the Port of Ploce EKONERG d.o.o.
people are also appropriate for birds (EPA - Environment Protection Authority, Best PracticeEnvironmental Management - Guidelines for Dredging).
During the execution of the works, birds affected by the noise will leave the area and go to moresuitable places. They will probably return when the works are over.
When determining the optimum time for execution of the works, it should be taken into accountthat birds are extremely sensitive during migration. Birds leave the area affected by high noiseand this unnecessary use of energy could disturb their feeding process and resting duringmigration. The area of Neretva River estuary is an important rest place for the bird migration,mainly from the north of Europe to Africa, from the second half of August to the end of Octoberand from the end of March to July and as wintering site. Higher noise level is also a problem forthe birds during nesting, spring and summer, because parents could leave the nest permanentlyor, because of higher noise level, they could leave nests more often and for longer time thusexposing the nest, eggs and their young to predators and overheating. The area of the project isless important as a nesting than migration and wintering site.
Because of above-mentioned impact, the most suitable time that is the time of the lowest impacton bird fauna for execution of works would be summer period until the start of autumn migration.In that period there would be no impact on migratory birds thus they could feed and restnormally and on wintering birds.
Impact on the air guality
The major ambient air impact during operation of the bulk cargo terminal will be that fromfugitive emission from the bulk cargo handling and storage. Fugitive emissions are caused bythe bulk cargo unloading from the ships to the stockpile, wind erosion of material disposed onthe stockpile, and reloading from the stockpile into the bulk cargo wagons.
AP-42 methodology of the American Environmental Protection Agency (EPA) was used forcalculation of fugitive emissions. Figure 0-3 shows annual emission calculated for maximumuse of New Cargo Bulk Terminal capacity, and its annual capacity is 2,800,000 ton of coal,600,000 ton of bauxite and 1,200,000 of iron ore.
Executive summary, Page 15/18
EA and EMP for New Cargo Bulk Terrninal at the Port of Plo6e EKONERG d.o.o.
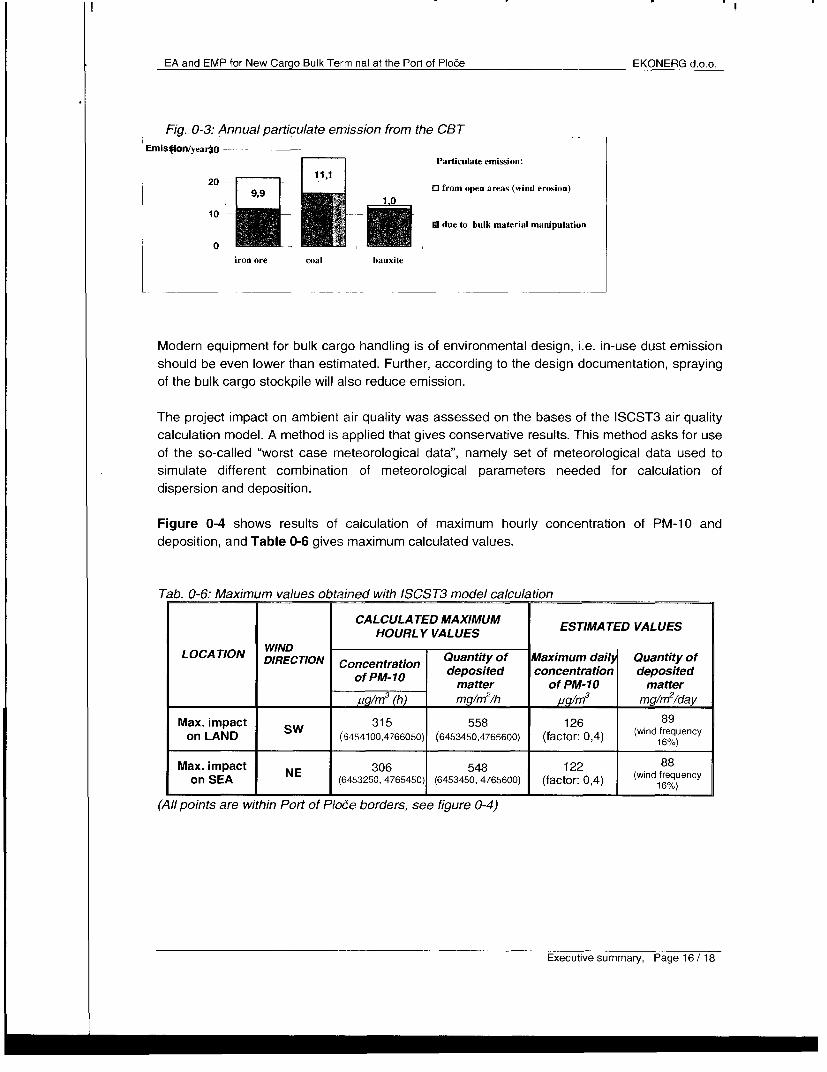
Fig. 0-3: Annual particulate emission from the CBTEmis4lon/year)o --
11is4Ion/yearO tParticulate emission:
20 -0_ _ _ fl a from open areas (wind erosion)
10 | | 18 _ S S due to bulk material manipulation
iron ore coal bauxite
Modern equipment for bulk cargo handling is of environmental design, i.e. in-use dust emissionshould be even lower than estimated. Further, according to the design documentation, sprayingof the bulk cargo stockpile will also reduce emission.
The project impact on ambient air quality was assessed on the bases of the ISCST3 air qualitycalculation model. A method is applied that gives conservative results. This method asks for useof the so-called "worst case meteorological data", namely set of meteorological data used tosimulate different combination of meteorological parameters needed for calculation ofdispersion and deposition.
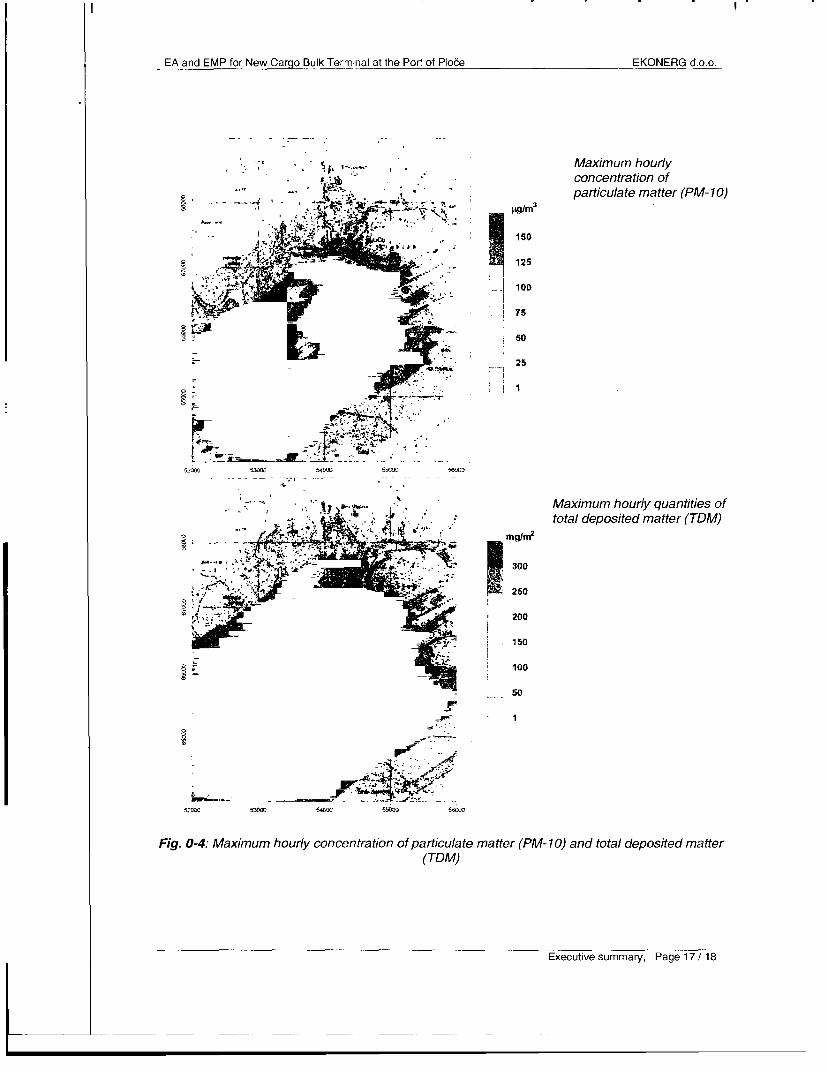
Figure 0-4 shows results of calculation of maximum hourly concentration of PM-10 anddeposition, and Table 0-6 gives maximum calculated values.
Tab. 0-6: Maximum values obtained with ISCST3 model calculation
CALCULA TED MAXIMUM ESTIMA TED VALUESHOURLY VALUES
LOCATION WDIRECTION Concentration Quantity of Maximum daily Quantity ofDIRETION Concntraion deposited concentration deposited
of PM-10 matter of PM-10 matteragg/m
3 (h) mg/m2/h M3 mg/m2/day
Max. impact SW 315 558 126 89on LAND (6454100,4766050) (6453450,4765600) (factor: 0,4) (wind frequency
Max. impact E 306 548 122 88on SEA (6453250, 4765450) (6453450, 4765600) (factor: 0,4) (wind frequency
(All points are within Port of Ploce borders, see figure 0-4)
Executivesummary, Page 16/18
EA and EMP for New Cargo Bulk Terminal at the Port of Ploce EKONERG d.o.o.
Maximum hourlyconcentration ofparticulate matter (PM-10)
t; \ ,, ! t ~~~~~~~~~~sos . - W vc Sr ~~~~~~~~~~~im. ,
150
o _ ~r. 125~60
25
520G 5230 540> 55WC 5>'3
Maximum hourly quantities oftotal deposited matter (TDM)
250
P . VW , Fs
f_ s. _
520DO ~530510 540(0 05503 50OCC
Fig. 0-4: Maximum hourly concentration of particulate matter (PM- 10) and total deposited matter(TDM)
Executivesummary, Page 17/18

EA and EMP for New Cargo Bulk Terminal at the Port of Ploce EKONERG d.o.o.
Based on the calculation results obtained by application of the dispersion model and informationon the climate characteristics, particularly the wind conditions at the town of Plo6e area, it canbe concluded that operation of the New Cargo Bulk Terminal will not cause degradation of thefirst category air quality4 due to the particulate concentration (PM-10) and deposition at the townof Plo6e area.
Waste management
Most of the waste produced during the Project operation will be the waste from ships. It willconsist of waste oil (hazardous waste) and oiled waste - oiled water, oiled materials (hazardouswaste), bilge water (hazardous waste), cargo residues, sewage water, and other waste such asfood leavings, food packaging material, etc.
Currently, the services for receiving liquid waste generated on board ships are solved on acontract basis with the company Pomorski servis - Luka Ploce ltd (concession holder), which isauthorized for collection of hazardous waste by the Ministry of Environmental Protection,Physical Planning and Construction. Following the opinion of the current concession holder,current system for receiving waste in the area of Ploce Port hardly meets the current situation.Below are the actions required before commissioning of the Project:
- Development of a Plan for reception and handling of waste from watercrafts and cargoresidue in the area of the Plo6e Port; according to the content defined in the By-lawstipulating conditions for port operation (Gazette 110/04).
- Installation of waste reception facilities for waste generated on board ships having sufficientcapacity for all types of waste. Provision of an adequate place for collecting and storing alltypes of waste generated during the Project operation that will satisfy the provisions of theLaw on Waste (Gazette 178/04) and other operational and supporting documents of thatLaw. If there is no possibility for adequate final treatment of waste at the Project location,treatment of single types of waste should be contracted with a legal entity registered forthat line of business.
- Types, quantities, place of origin, way and place of storing, treatment and disposal of wasteshall be duly recorded. Data on handling different types of waste shall be regularlysubmitted to competent authorities on stipulated forms and reporting sheets. Likewise,once a year, the competent authorities should be informed about the condition of receptionfacilities for waste and cargo residue. The Porth Authority of Ploce should berecommended to present a Waste Management Plan.
5. Mitigation Measures and Environmental Monitoring Plan
These parts are elaborated in the separately prepared Environmental Management Plan (EMP).
4First Category Air Quality - clean or slightly polluted air; the limit values (LV) are not exceeded for any pollutant(see, Chapter 4, Table 4.2.1-1).
Executive summary, Page 18/18

EA and EMP for New Cargo Bulk Terminal at the Port of Ploce EKONERG d.o.o.
1. POLICY, LEGAL AND ADMINISTRATIVE FRAMEWORKThe project addressed by this Environmental Impact Assessment Study (EIAS) involvesconstruction of a new bulk cargo terminal in the Port of Ploce.
The location of Port of Ploce and the Project location in the Port are illustrated on Figures 1-1and 1-2.
1.1. PURPOSE OF THE PROJECT
The Port of Ploce is situated on the southern Adriatic coast in a natural bay, north-west of theNeretva River estuary with a clearly defined large gravitational area covering NE part of Croatia,a part of Serbia and Monte Negro, Bosnia and Herzegovina, a part of Austria, Hungary, CzeckRepublic, Slovatia, Roumania, and Poland.
One the navigable waterway Bosanski Samac - Vukovar is constructed including as well pan-European road Vc - Budapest, Osijek, Sarajevo, Ploce, the Port of Ploce will becomeexceptionally important for combined traffic with all Danube-region countries. Central seaconnection and a natural extension of Vc corridor will connect also the southern regions of Italyvia the Port of Ploce with Central and East European countries in the most cost-efficient way.Geo - traffic location of the port of Ploce is illustrated on Figure 1-3.
The Port of Ploce performs most of its traffic with the partners from Bosnia and Herzegovina.Before the Croatian War of Independence, the bulk cargo traffic was some 3,5 million tons,primarily coal and iron ore for the needs of the ironworks in Zenica and the coke plant inLukavac. In 1989, the Port of Ploce, as a single company, signed a financing contract with RMKZenica, KHK Lukavac and BiH Railways for construction of a bulk cargo terminal in the Port ofPloce. The traffic planned was some 6.000.000 tons of bulk cargo, the bidding documents weredeveloped, and in 1990 the procedure of bid collection was carried out. However, the war brokein the former Yugoslavia and stopped the activities started, and the traffic in the Port of Ploce hitthe trough.
Following a traffic analysis in the Port of Plo6e in the period from 1988 to 2004 (Table 1-1) andthe projections of annual cargo traffic for the traffic from 2000 to 2010 (Table 1-2), and takinginto account the indications that large multinational companies intend to make considerableinvestment in BiH economy, the traffic of bulk cargo is expected to rise, with the partners fromBiH region in particular. Similarly, the project of construction of the new bulk cargo terminal inthe Port of Ploce also fits in a long-term development plan passed by the Parliament of theRepublic of Croatia following which the Port of Ploce must be capable of providing good-qualityservices for any potential user. That is why the construction of a bulk cargo terminal is one ofthe priority projects in the upcoming investment cycle.
Chapter 1, Page 1 / 10

EA and EMP for New Cargo Bulk Terminal at the Port of Ploce EKONERG d.o.o.
Table 1-1: Cargo traffic (in 000 t) via Port of Ploce from 1988 to 2004._____________ 1988 1991 1994 2000 2002 2003 2004
GENERAL CARGO 881 521 206 266 396 420 346BULK CARGO 3336 1356 39 417 474 675 1518LIQUID CARGO 360 360 360 360 360 360 167TOTAL 4577 2213 268 804 1063 1284 2031
Table 1-2: Projections of annual cargo traffic (in 000 t) for the period from 2000 to 20102001 2005 2010
GENERAL CARGO 455 1050 1140BULK CARGO 960 3520 3505LIQUID CARGO 185 350 450TOTAL 1600 [ 4928 5095
The obligation to make an Environmental Impact Assessment Study (EIAS) for the project ofconstruction of a bulk cargo terminal is based on the Law on Environmental Protection (Gazette82/94, 128/99) and By-law on Environmental Impact Assessment (59/100, 136/04) alsostipulating the contents of the Environmental Impact Assessment Study.
Chapter 1, Page 2/10
_______ I
EA and EMP for New Cargo Bulk Terminal at the Port of Ploce EKONERG d.o.o.
FIGURE 1-1
Chapter 1, Page 3/10
I=

EA and EMP for New Cargo Bulk Terminal at the Port of Ploce EKONERG d.o.o.
FIGURE 1-2
CHANGE:
ZONE4ISADDED !
Chapter 1, Page 4/ 10

EA and EMP for New Cargo Bulk Terminal at the Port of Ploce EKONERG d.o.o.
FIGURE 1-3
Chapterl, Page5/10

EA and EMP for New Cargo Bulk Terminal at the Port of Ploce EKONERG d.o.o.
1.2. DATA FROM THE PHYSICAL PLANNING DOCUMENTS
Physical planning documents referring to the project location:
* STRATEGY AND PROGRAM OF NATIONAL PHYSICAL PLANNING (GAZETTE 50/99)Ministry of Physical Planning, Construction and Housing, Physical Planning Institute,ZagrebPHYSICAL PLAN OF DUBROVACKO-NERETVANSKA COUNTY (PPZDN)County Institute of Physical Planning - Dubrovnik(Gazette of Dubrovacko-neretvanska County 6/03 and 3/05)PHYSICAL PLAND OF AREA DEVELOPMENT OF FORMER MUNICIPALITY OF PLOCE(KARDELJEVO)AMENDMENTS AND COMPLEMENTS OF THE PP OF FORMER MUNICIPALITY OFPLOCE (KARDELJEVO)Institute of Urban Development of Dalmacija - Split,(Gazette of former Municipality of Ploce (Kardeljevo) No. 11/87))GENERAL URBAN DEVELOPEMNT PLAN OF PLOCE (KARDELJEVO)AMENDMENTS AND COMPLEMENTS OF THE GENERAL URBAN DEVELOPMENTPLAN OF PLOCE (KARDELJEVO)Institute of Urban Development of Dalmacija - Split, 1987(Gazette of former Municipality of Ploce (Kardeljevo) No. 11/87)
Conclusions based on the physical planning documentation are as follows:
The project planned is in line with the provisions and guidelines for development segmentsidentified by the Strategy and Program of Physical Planning in the Republic of Croatia andparticularly in line with the scheduled development of the Port of Ploce as a large port ofinternational importance.
With regard to the Physical Plan of Dubrovacka - neretvanska County (PPZDN) and the spaceand land use and purpose, the project planned within the area verified by PPZDN covers theexisting zones planned for economic use of the Port of Ploce complex and it is in conformitywith PPZDN. The map from PPZDN showing the use and purpose of land (Scale 1:100.000) isgiven on Figure 1-4. The Physical Plan of Dubrovacko-neretvanska County identifies theobligation of development of new physical planning documents for area development of thetown of Plo6e (PPUG) and an Urban Development Plan of Ploce (UPU)1. Until they are made,
'Development of PPUG of Ploce and Amendments of and Complements to GUP of Ploce is in progress. Pursuant tothe Law, those plans should be harmonized with the physical plan of the County. PPUG Ploce is made on the basisof the Physical Plan of Dubrovacko-neretvanska County (PPZDN), assumed also for the project scheduled and inconformity with PPZDN.The purpose of the amendments of and complements to the General Urban Development Plan (GUP) is itsconformity with the Regulations of development and protection of protected coastal area (Gazette 128/04). Since theharmonization of PPZDN with that Rule Book has already been made, the Project is found in conformity with PPZDNand the Rule Book (Project Conformity Conclusion). However, during development of the plans, in view with theirharmonization with the Rule Book, the obligation of making physical planning documents for ZOP area should bereviewed in line with the provisions of the Rule Book (it refers particularly to the obligation to develop a detailed urbandevelopment plan for the complex of the Port of Ploce. Pursuant to the applicable GUP, it should be made before theproject realization.
Chapter1, Page6/10

EA and EMP for New Cargo Bulk Terrninal at the Port of Plo6e EKONERG d.o.o.
the Physical Plan of former municipality of Ploce (Kardeljevo - amendments and complementswill be in force for the area of local self-government unit of Town of Ploce. For the area of thetown centre of Ploce, a general urban development plan of Ploce (Kardeljevo) with itsamendments and complements is in force. They are both passed prior to the applicable Lqa onPhysical Planning. The Project planned is in conformity with the planning provisions of the plansin question, which are harmonized as defined by PPZDN (PPZDN provides that an area can bepermanently developed only on the basis of PPZDN provisions and those provisions of theexisting physical plans that are not contrary to PPZDN provisions).
CONCLUSION:The Project of construction of the bulk cargo terminal in the Port of Ploce is in conformity withthe physical planning documents.
Note: The Project planned is in conformity with the details in the segment of applicable physicalplanning documents. However, since the Project is planned in a contact area scheduled forevaluation by the system of natural heritage protection (nature part of Donja Neretva and aspecial reserve of Parila), the Project Realization (planning, construction and use) should beexecuted according to the most stringent criteria for environmental protection. When planningthe Project, any possible environmental impact should be analysed (with a special emphasis toconstruction and use of the Project) and in line therewith, the measures of environmentalprotection should be determined and systematically implemented fully in line with the segmentsand conclusions of this Study.
Chapterl, Page7/10

I
EA and EMP for New Cargo Bulk Terminal at the Port of Plo6e EKONERG d.o.o.
FIGURE 1-4
Chapter 1, Page 8/10

EA and EMP for New Cargo Bulk Terminal at the Port of Plo6e EKONERG d.o.o.
1.3. INTERNATIONAL TREATIES / AGREEMENTS RELEVANT FOR THE PROJECTPLANNED
International treaties/agreements relevant for the Project planned are:
Convention on Protection of World Cultural and Natural Heritage (Paris 1972)Published in Gazette - MU 12/93; the Republic of Croatia is a party to the Convention onthe basis of notification of succession dated 8 October 1991; came into operation for theRepublic of Croatia on 8 October 1991.
* Convention on marsh-land of international importance particularly as wading birds habitats(Ramsar 1971.)Published in Gazette - MU 12/93; the Republic of Croatia is a party to the Convention onthe basis of notification of succession dated 8 October 1991; came into operation for theRepublic of Croatia on 8 October 1991.
. Law on ratification of UN Convention of biological diversityPublished in Gazette - MU 6/96; the Convention came into operation for the Republic ofCroatia on 7 October 1996.
. Law on ratification of Protocol of biological Safety (Kartagen Protocol) to the Convention onBiological Diversity, (Montreal 2000)Published in Gazette - MU 7/02. The Republic of Croatia signed the Protocol in New Yorkin 2000.
Law on ratification of Convention on protection of European wild species and naturalhabitats (Bern Convention)Published in Gazette - MU 6/00. the Convention came into operation for the Republic ofCroatia on 1 November 2000.
* Law on ratification of Convention on protection of migratory species of wild animals (BonnConvention)Published in Gazette - MU 6/00. The Convention came into operation for the Republic ofCroatia on 1 October 2000.
* Law on ratification of Agreement of protection African-Euroasian migratory wading birds(AEWA)Published in Gazette - MU 6/00. Came into force for the Republic of Croatia on 1 October2000.
* Convention on protection of the Mediterranean Sea from Pollution (Barcelona 1976). Basedon the notification of succession the Republic of Croatia is a party to the Convention since8 October 1991 (Gazette - MU No. 12/93). Amendment of Barcelona Convention from 1995published in Gazette MU No. 17/98 came into force for the Republic of Croatia on 9 July2004 (this date published in Gazette MU No. 11/04).
Chapterl1, Page 9/10
EA and EMP for New Cargo Bulk Terminal at the Port of Ploce EKONERG d.o.o.
* Convention on prevention of sea pollution from ships, 1973, amended by Protocol from1978 (MARPOL 73/78). The Convention came into force on 2 October 1983. The Republicof Croatia is party to the Convention on the basis of the notification of succession dated 8October 1991. The Convention annexes are:Annex 1: Prevention of oil pollution - came into force on 12 October 1983Annex 2: Prevention of pollution by hazardous liquid substances transported in bulkcondition - came into force on 6 April 1987.Annex 3: Prevention of pollution by hazardous substances transported by sea in unpackedcondition - came into force on 1 July 1992Annex 4: Prevention of pollution by sewage water from ships - came into force on 27September 2003Annex 5: Prevention of pollution by waste dumped from ships - came into force on 31December 1998Annex 6: Prevention of pollution of air from ships - came into force on 19 May 2005.
• Convention on access to information of participation of the public in decision-making andaccess to the administration justice involving environmental matters (Aarhus 1998), theRepublic of Croatia signed the Convention in 1998.
Chapter 1, Page 10 / 10
ci(rS' .ci t; e-L en 1( ' ,,,7\ , . _ -. -Pa
l~~ ." .- K . -:,. Ser , >,
BLI P C.~ .- .t.}$ ^ - j a; 162; bY .. j. .. 1^_t
ova . ~~~--- '-------. 't- / 2 s\r25 /2Noi I N---%I~~~~~~~~~~~~~~~~~~~~~~~~~~~~~~IIl 0 t 4 t 2 t l i4j5 |.W g Q 3 Zr + X'1>}~~~~~~~~~~~~~~~~~J
. 1. _ < 7^ Wl;f~~~~~~/ - /-\
/ I~~~~~~~~~~~~~~~~~~~~~~~~~~~~~~~~~~~~~
14~~~
- -- ; 21:: ¢ \; - f i - -- - --- -- t - ; $ z~~~~~~---------
* S',..tIiiq Meda&.
:"~~InIL -l~\ . -l -f =7
ti A~~
~~~~~~~~.24 i rtj.7;h i7 4 ¢;l
52 7;~~~~~~~~~~~~A
N Gu m ana
24
28 ~~24 \2 1 'I=c;';-;r ' -...... !-s
6 6
-. 'Uice Nerer4e i' -- : -
taI)km km 7±K , 4 §,>,,_ " "X C, 5 ~ ~ ~ ~ ~ ~ ~ ~ ~ ~ ~ ~ ~ ~ ~~~
Port border (mainl'and_tPort bFrdOrFsea) - LCTO - - O I .OiE
Z7_ _ __ _ A ~~FIGURE 1-1: LOCATION OF PORT OF PLOCE
4w~~
40~ ~ 4
41 ~ ~ -
U -~~~~~~~~~~~~~~~~~~~~~~~~~o Buanlk barorder fnl-Rel
FIGURE 1-2: PROJECT LOCATION
r --- - - - - - - - - - 1 - -
4 rv- f1 N'; .A IS All Il&
LN HAAGlfN _
* I I ~~~~~WA .hA
Ix'
~ LU IOtM_OURG .' I 1'
: ~ ~ ~ ~ ~ K rf, i I !. .PARIS ' ;rJ iiN i.y" p
LJB A 4 .... j I-,vsf . !- .L;. o .;.' ... , ,t ' SI
'o Q, o .,<'; , ..
sit FiN ?;S SLJUBLJANi^
1N -. ;
IL,. ,. - HIM~~~~~~~~~~~~~~~~~~~~~~~~~~~~~~~~~~~~~~~~~~~~~~~~~~~~~~~~~~~~~~~~~~~
0 ~~~~~~~~~ ~ ~~~~~~~~~~~~~INAN,, '
FIGURE 1-3: GEO - TRAFFIC LOCATION OF THE PORT OF PLOCE
2
-alls~5t~
2mr~~~~~~~~2
v-p~~~~* IF ~ ~ ~ -- t%~n-_ Za.. -~.p A. -_-

A MAP Figure 1-41. USE AND PURPOSE OF SPACE
KEY TO PLAN SYMBOLSArea for physical planning Borders
and developmentArea for physicai planning Territorial and statistical borders
_w state borderand development in settlements - county border
A settl-ment building area -already built municipality/towl boarder on mainland
A settlement building area -not bu!ii Physical plan of the Natiouial Park "Mijet"A setleent uiling rea- not boith
0 Settlement Traffic
Area for physical planning Road Traffic
and development outside settlements Public Roads
economic use - production facilitiesmostly industry - II. crafts prevailing, 12 state road-highwayfood-processing prevailing, 13 state road - motorway (a corridor for research works)building trade prevailing (asphalt mixing planit). 14 state road - motorway
economi.; use -land for minirung minerals: stone E3, statc road - highway (a coriTdor for research works)sand E4, salt E5 other state roads
economuc use areas for cultivation of musseli county road(aquacalture 11I, fish farming in cages il2, fish local roadand mussel farming i13, research cratre IC other not public roads
econonic use - fishing except fbr traw rag 0 road crossing at two levels
economic use -- trawling F= road buildings -bridge
economic sea belt (continental shlf) - - - road buildings -tunnelconornic use fishingarea ("ludaLi "Zagoiilica" - - -
and `firu2Aia')Ral yTrfiecono;mic use fishimig-ground arua, fishing by sniall a ay Trafctra wl er s railroad along the Adnatic coast icomdor'routc)
.coinomsic use - business areaprevailing services KI, prevailing trade Ki2 railroad - I' classutility serv;cLs K3, prevailiug recycing K4, railway station passengers lintcrnational aolrmuxed zones prevailing business K S IcnCal trniilc)prevailing garages - office buildings Ko railway stop
i econoinic use - catering and tourisni,hotel 1 l tounsi complex T2, caipiaig site T3, tourist Maritime Traffic
villas F4. narina T5, berntung facilities P, mnted dzones prevailng for tounsm T6, pre,ailing catenrng 5 sea pon for public traffic -special
*' fiicilities T7, reserve T' intemational inmortancespon and recreation assignment golf fields RI, sp,ris t sea port for public traffic - county importancchall R4I sporn grounds R5, swinusrlig, zones Rsbathini h,aLi si por for pubhc traffic local imponance
agnluitural ian ) special-purpose sea port -national importarcepariiluli aluablc arable land Pl 'coveed with torzm PIlo military lv, industrial LI, siupbuilding Lfi,
agrivcultural land nalitical tourtsm lN, srnort I S. other iLO'aluabic arabic land P2,cuvyerd ,ith lorest P?(J special-parpose sea port counits importance
,iglicultuoal land special-purpose sea poll l(cal ir,pornanccsalutable rabIe land P2 researcb arcsa to larid impriernmelt berh
-| agricultural land - - -agncultural land - ~~~~~~navigable waterway- internationalotlii arabic land P3'co,red aith iircisi I3i nals gable waterwav - iiitcrnal
k rest, cconorrincandprotcctisrt;I
_ tersth spcal and for recreatiunr3 Air Traffic,th,r" ag'culturfl land, forests and forest latid PS, rockv l and bare rockl land t internatiorial aniport
dller ales V watercourses lakhs ind sea othir 34ir0r-L,
rctcim,itn b,sins i * helipuil
'pe.1;l Purpose N ' ' '- Jall Corridor - Intemaritonal u,d i, liesi IC ltrull-,llCCi,l purpose N -- air comd,r - dmestic tratlfc
area', i nll-astruclurc ,sterrn, IS waste I reatinent, Storing
il-i~ ;ckllet.ir% K alid Disposal
Pins er S)Sterllt * hazardous waste siorage buildinig
Electrical PoWer - Generation Facilities 0 haztatreatum itbulldiongbuiidl-Wk traLmnd thermldn
lNsdricctritc powerplan HE biological and thcrmal treatmen- waste trcatmenit buildiug -
wUtL,Loig ailtlics- substatioib o trOatraeni if 1cmelsnolgical rnon-hazardo,.s wae
P' rI-atl alar ro-locatins for w ldi t- , waste disposal sitc_' -il,ll - iscm t,' OK ren ws, i)
v,Cf - tleaa - --

EA and EMP for New Cargo Bulk Terminal at the Port of Ploce EKONERG d.o.o.
2. PROJECT DESCRIPTION2.1. BASIC DATA ON LOCATION AND THE PROJECT SITE
According to the Ordinance on classification of ports open for public traffic in the area ofDubrovacko-neretvanska County (Gazette 96/96) the Port of Plo6e has been classified as a portof particular international economic importance for the Republic of Croatia.
The Port of Ploce is situated on the southern part of the Croatian Adriatic Coast at 43'03'N and1726'E. Thanks to its location it is of exceptional importance for the economy of neighbouringBosnia and Herzegovina and also the partners from the Republic of Serbia and Montenegro,Hungary and other Central European countries (see Figure 1-3 in Chapter 1).
Under the decision on establishment of the Port Authorities of Ploce (Gazette 19/97, 139/97,18/99) the mainland and sea borders of the port have been determined (see Figure 1-1 inChapter 1).
Port surface area (mainland) is 2.340.000 m2
Port surface area (sea):Port sea basin: 1,166,430 m2
Vlaska Channel - sea: 240.000 m2
The project location is situated in the area of Port of Plo6e. The Bulk Cargo Terminal will belocated at the west-south area of the peninsula within the port at the mouth / entrance area ofVlaska Channel. In close proximity, on the south-east part of peninsula, alongside VlaskaChannel the existing oil terminal is located. The new bulk cargo terminal will be mostly locatedon the existing land (on-shore), while the area that will have a new berth and adjacent storagearea alongside the berth will be located off shore (after reclamation works). The Project locationis illustrated on Figure 1-2 in Chapter 1.
In the area of Port of Ploce (Plo6e basin), currently there are facilities stated in Table 2-1 andshowed on Figure 2-1.
Chapter 2, Page 1 /18

EA and EMP for New Cargo Bulk Terminal at the Port of Ploce EKONERG d.o.o.
Table 2-1: Current facilities at the Port of Ploce:General Cargo Storage Outdoor storage: 153,925 m2
Indoor storage: 35,834 m2
Dry Bulk Cargo Storagea) Storage on pier No. 5 (will be closed after Storing capacity: 300,000 t
Opening of New Cargo Bulk Terminal) Unload/reload capacity: 10,000 fVdayb) Cereals storage Storing capacity: 35,000 t
Unload/reload capacity: 300 t/dayTerminal for alumina and petrol cokea) Alumina silo Storing capacity: 20,000 t
Unload/reload capacity: 800 t/hb) Petrol coke storage Storing capacity: 10,000 t
Unload/reload capacity: 260 t/hTimber transmit terminal Storing capacity: 50,000 m3
_ Terminal surface area: 46,464 m2Liquid cargo terminal (Operator: Energopetrol Plo6e d.d.):a) Heavy fuel oil Storing capacity: 20,000 m3
Unloading capacity (ship - terminal): 700 - 1000 t/hDespatch (terminal -wagon): 300 t/hDespatch (terminal - truck): 80 t/h
b) White products (D-2, petrol) Storing capacity: 60,000 m3
Unloading capacity (ship - terminal): 200 - 500 t/hDespatch (terminal - wagon): 50 - 150 tVh
Liquid cargo terminal Storage capacity (petrol, diesel fuel, kerosene, vegetable(Operator: "Luka Plo6e Trgovina" d.o.o.) oil): 32.565 m3 (total)Refrigeration facilities in the Port of Ploce Storing capacity: 920 t(Operator: "Hladnjaca Ploce" d.o.o.) Warehouse surface area: 2,000 m2
Passenger traffic terminal Two ramps/platforms:International traffic ships (LOA: 120m, breadth: 20 m,sea depth: 8.0 m)Local, inland traffic ships (LOA: 65m, breadth: 14 m, seadepth: 5.0 m)
Office buildings and terminal surface areas depth:_ _ _ __m_
Chapter 2, Page 2/18

EA and EMP for New Cargo Bulk TermTinal at the Port of Plo6e EKONERG d.o.o.
Figure 2-1: Existing facilities atthe Port of Ploce
1 Dry bulk cargo berth and XIstorage 2 9 3
2 General cargo storage 2 Xx 23 Grain warehouse -4 Petrol coke storage /-5 Refrigeration warehouse / 'N>.
6 Liquid cargo terminal - EP /7 Liquid cargo terminal - LPT L I
8 Timber transmit terminal _ /9 Passenger terminal X10 Alumina silo ,9 6 rf1 l11 Service area ,.'__ / = = - _100 a 100 200 xanali -AJ'L jti12 Port of Ploce Authority - fe e sz
___Headquarters
The area of the Port of Ploce is directly connected with the following traffic possibilities:
Road TrafficThe backbone of road connections is:o The Adriatic Highway running from Trieste via Rijeka to Split and on to the end point of the
Republic of Croatia. This traffic direction is a part of the European road network and ismarked as E-65.
o Main road Hungary - Osijek - B.Samac - Zenica - Sarajevo - Mostar - Metkovi6 - Plocemarked as E-73 and is the shortest and the most favourable traffic connection between theBaltic and Adriatic Sea.
Railway TrafficIn north-south direction there is a railway line Sarajevo - Ploce (195 km) which is a part of therailway route of the branch C (Budapest - Osijek - B.Samac - Sarajevo - Ploce of 809 km) of theFifth pan-European corridor (Venice - Trieste - Budapest - Uzgorod - Lvov ) thus making thePort of Ploce a maritime port of that traffic branch.
Maritime TrafficThe position of the Port of Ploce enables good seaborne connection to the towns on the AdriaticCoast of Croatia and Italy and to the ports all over the world. A special quality of the Port hasbeen achieved by setting up a weekly feeder line connecting the Port of Ploce with Malta andGioa Taur.
Air TrafficIn the Port of Ploce there is an airport for small airplanes (recently not in use, currently timberstorage). The closest international airports in Split (127 km) and Dubrovnik (120 km) enable airconnection with other airports in the world.
Chapter 2, Page 3 /18
EA and EMP for New Cargo Bulk Terminal at the Port of Plo6e EKONERG d.o.o.
2.2. PROJECT BASIC DATA
* Import: 4.600.000 ton of coal, bauxite and iron ore per year* Storage Capacity: 700,000 ton (main storage area)
+ 60,000 ton (storage area along the CBT berth to be used foremergency use only)
Average ship unloading rate: 35.000 ton per day (unloading from 80.000 DWT ships)Average wagon loading: 15.000 ton per dayApproximately 78 port calls per year
* Service time per call manoeuvring, hatch moving, etc: 8 hours per callTotal berth occupancy: 175 days (unloading from 80.000 DWT ships)Up to 350 working days per year
New Bulk Cargo Terminal is designed to perform the following main operations:handling bulk cargo as coal, iron ore, bauxite from ocean going ships,load rail wagons for transhipment of those products to the hinterland,provide a strategic and operational stocks for the operations and
* provide auxiliary services such as weighing, sampling and quality control.
The Project planned covers:deepening and broadening of access channel to CBT berth and to the Vlaska Channel(dredging),construction of a berth and development of a new surface area by reclaiming the sea area,construction of storages (main storage area and outdoor storage alongside the berth thatwill be used for emergency use only),construction of supporting infrastructure, anduse of the Project i.e. use and operation of the bulk cargo terminal
A plan view of the Project is given on Figures 2-2 and 2-3.
2.2.1. Deepening and Broadening (Dredging) of Access Channel to CBT and toVlaska Channel
The current channel is dredged to approximately 11.0 to 12.0 m below sea level.The required depth of the future access channel is 16.0 m below sea level.The required bottom width of the future access channel is 120 m.Slide slopes are assumed to have an inclination of 1:3 (in line with side slopes of the existingchannel)Borders of the access channel broadening are illustrated on Figure 1-2, Chapter 1.An estimate of the material (stones) required to stabilize the slopes is 17,250 m3.The length of the access channel is approximately 750 m measured from the -16.0 m depthcontour in the Adriatic Sea and ending at the dry bulk terminal (CBT).The channel is designed for one-way traffic. The channel is routed and designed without bendsfor reasons of maritime safety and ease of navigation.
Chapter 2, Page 4/18

EA and EMP for New Cargo Bulk Terminal at the Port of Ploce EKONERG d.o.o.
Dredging technoloag and equiPment:
For dredging of access channel the two dredging technologies, incl. equipment and processes,their operating characteristics and environmental impacts, were analysed:a. hydraulic dredging (namely TSHD and CSD), see Figure 2-8b. mechanical dredging (namely crane-grab pontoon and backhoe dredger), see Figure 2-9
a. Hydraulic dredging
Trailing suction hopper dredge (TSHD), as a preferred hydraulic dredging technique, is a self-propelled vessel, loading the material in its own hopper. Once the TSHD is fully loaded, it sailsto a shore connection and by means of pipelines the material is pumped to the deposit area.Estimated volume of dredged material in situ: 553.000 m3
Estimated volume of dredged material for disposal: 1.330.000 m3
.t.~~~~~~~~~~~~~~~~~~
S ide v i e
Figure 2-8: Hydraulic dredging - TSHD vessel
Dredged material will be disposed in the area of the ZONE 3 and ZONE 4 which are within thearea of the Port of Ploce - Ploce basin according to the Decision of establishment of the PortAuthority of Ploce (Gazettes 19/97, 139/97, 18/99). Area of the ZONE 3 and ZONE 4 are shownon Figure 1-2 in Chapter 1.
ZONE 3 (on-shore area): Surface of this area is 277.455 mi2. The area will be divided in twoparts along the line of the existing drainage canal to allow development of two independentareas. While one part will be filling up with load the leaking of deposit material will occur on theother. Dikes (bund walls) and drainage system will be built to prevent dispersion of the disposedmaterial into the sea and to allow collection of water from the material piled in the ZONE 3.Dikes will be built of stone covered with geo-textile and sand, thereby preventing that disbursedmaterial would course increased turbidity in the Sea during dredging operations. Figure 2-4shows a characteristic cross-section (conceptual design) of a dredged material disposal site
Chapter 2, Page 5 / 18
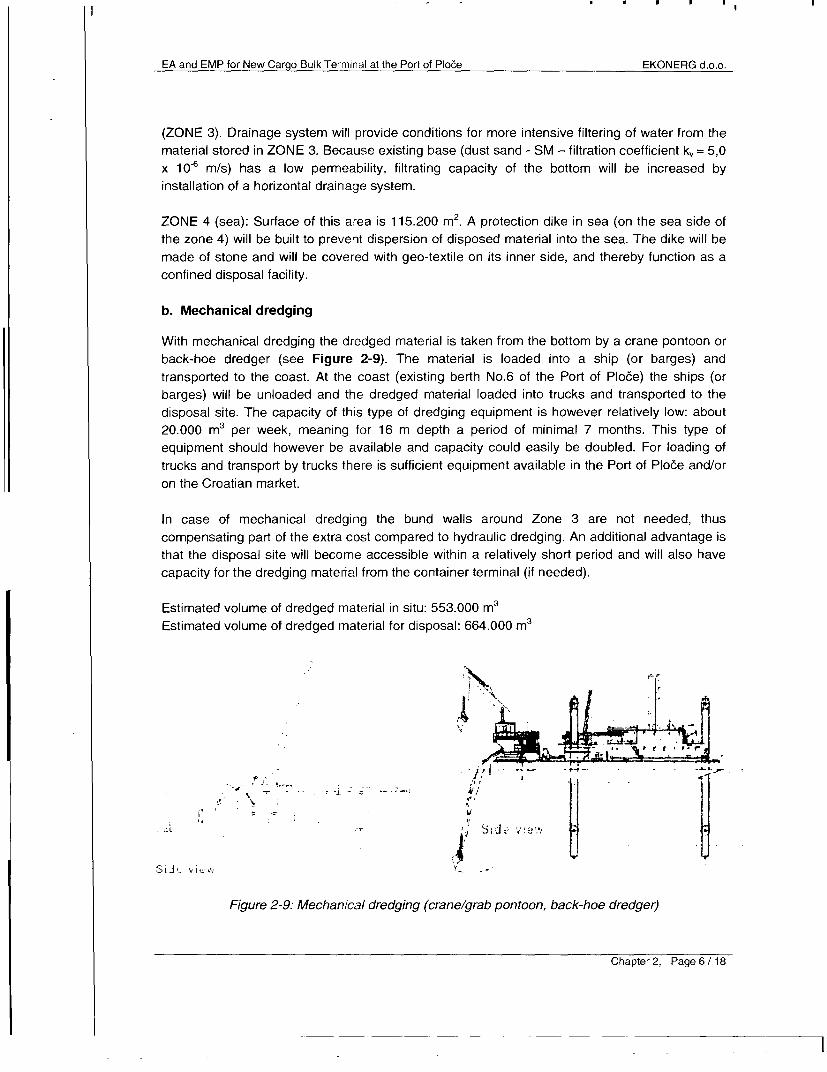
EA and EMP for New Cargo Bulk Terminal at the Port of Ploce EKONERG d.o.o.
(ZONE 3). Drainage system will provide conditions for more intensive filtering of water from thematerial stored in ZONE 3. Because existing base (dust sand - SM - filtration coefficient k,= 5,0x 10⁻⁶ m/s) has a low permeability, filtrating capacity of the bottom will be increased byinstallation of a horizontal drainage system.
ZONE 4 (sea): Surface of this area is 115.200 m2 . A protection dike in sea (on the sea side ofthe zone 4) will be built to prevent dispersion of disposed material into the sea. The dike will bemade of stone and will be covered with geo-textile on its inner side, and thereby function as aconfined disposal facility.
b. Mechanical dredging
With mechanical dredging the dredged material is taken from the bottom by a crane pontoon orback-hoe dredger (see Figure 2-9). The material is loaded into a ship (or barges) andtransported to the coast. At the coast (existing berth No.6 of the Port of Plo6e) the ships (orbarges) will be unloaded and the dredged material loaded into trucks and transported to thedisposal site. The capacity of this type of dredging equipment is however relatively low: about20.000 m3 per week, meaning for 16 m depth a period of minimal 7 months. This type ofequipment should however be available and capacity could easily be doubled. For loading oftrucks and transport by trucks there is sufficient equipment available in the Port of Ploce and/oron the Croatian market.
In case of mechanical dredging the bund walls around Zone 3 are not needed, thuscompensating part of the extra cost compared to hydraulic dredging. An additional advantage isthat the disposal site will become accessible within a relatively short period and will also havecapacity for the dredging material from the container terminal (if needed).
Estimated volume of dredged material in situ: 553.000 m3
Estimated volume of dredged material for disposal: 664.000 m3
* j+ eF'S >1
Gi -w- 1;ll S;Jv /, ! - -1
SiJz vi_w _ .
Figure 2-9: Mechanical dredging (crane/grab pontoon, back-hoe dredger)
Chapter 2, Page 6 /18

EA and EMP for New Cargo Bulk Terminal at the Port of Ploce EKONERG d.o.o.
Advantages of hydraulic dredging (TSHD and CSD) are faster operation and lower price, itsdrawbacks are difficulties in engaging a big ship for relatively small scope of works and possiblehigher rate of seawater mud silting up because of large quantity of seawater brought onshoreand drained back to the sea, which would require additional environmental protection measures,which are described above.
On the other hand, mechanical dredging brings 5-6 times less water onshore, so it is moreenvironmentally favourable and the technology is more suitable for the Project. Its drawbacksare somewhat higher price, longer time of works execution and possible additional problemsrelating to onshore handling (additional reloading, transport by trucks and additional handlingworks at the location).
After an in-depth analysis, it was decided to propose and analyze both dredqing options(hydraulic and mechanical) at this EIAS level and issuing a Location Permit for the CBT. Finaldecision would be made during the next phase of the Project development, i.e., additional siteinvestigations, main design documentation for Construction Permit, and tendering (or EOI) fordredging works.
2.2.2. Construction of berth and development of sea reclaimed area
Construction of a berth will be executed on the northern part of the access channel to theVlaska Channel parallel to the channel axis and vertical to the existing coastline. A part of theberth area will be on the existing land and a part will be obtained by land reclamation (sea depthat the most distant part of berth is maximum 5 meters).
Berth length: 350 m (minimum).Berth design: Combiwall type construction with a concrete relieving platform.
Berth construction1. Filling to the level of 1 m above the water level2. installation of vertical drainage3. preloading4. subsoil consolidation5. adaptation of land level to +3.0 m6. installation of piles7. construction of anchorage system8. construction (in situ) of concrete beams9. additional filling to +3,0 m10. floor construction11. excavation of access canal12. finishing works
When the berth is finished, protection embankments will be built covering the area of ZONE 2.The entire area will be filled with crushed stone of different size. A coast protection embankmentwill be built. This is how the sea area will be reclaimed.
Chapter 2, Page 7 / 18

EA and EMP for New Cargo Bulk Terminal at the Port of Ploce EKONERG d.o.o.
Quantities of stone material required:* slope protection: 11,800 m3
reclamation: 214,500 m3
* filling in the area of berth: 71,188 m3
2.2.3. Construction of storage area
Two types of storages will be made at the terminal:
1) Outdoor storage alongside the berth to be used for emergency needs only:Available capacity: 60,000 m3
Storing surface area: 240 m x 32 mMaximum height of bulk cargo: 15 mThis storage will be built within the zone 2 of the bulk cargo terminal (Figure 1-2, Chapter 1)
2) Main storage area:Available capacity (total): 700,000 m3
Main storage area is divided to three storing surfaces.Capacity of the central storage area: 400,000 m3
Size of the central storage area: 500 m x 90 mCapacity of peripheral storing areas: 2 x 150,.000 m3
Size of peripheral storing areas: 500 m x 45 mThis storage area will be made in the zone 1 of the bulk cargo terminal (Figure 1-2,Chapter 1).This storage area will be made on the existing mainland already with large quantities offilled material (mostly from dredging the access channel to the CBT berth and VlaskaChannel).
Construction of this storage area will cover:1) cleaning the land from bushes, vegetation and waste2) excavation of the existing land to the level of 1.5 m below the sea level to fill it by
crushed stones.3) filling the depression zone (deeper than 1.5 metre) with excavation material4) compacting5) filling in layers (crushed stone from highway construction)6) installation of a central drainage line and a layer of gravel with a geomembrane7) construction of lateral drainage lines8) installation of collecting drainage pipes outside the storage area9) construction of collection settlement basins for drainage water (for the area of storage
area / road runoff)10) levelling the inclination of the warehouse floor by compacting (upper layer with sand,
total average thickness of layer: 25 cm).
Quantity of material required for the works: 255,000 m3 (crushed stone) and 100,000 m3 ofgravel.
Chapter 2, Page 8 / 18

EA and EMP for New Cargo Bulk Terminal at the Port of Ploce EKONERG d.o.o.
Figure 2-2
Chapter 2, Page 9 / 18

EA and EMP for New Cargo Bulk Terminal at the Port of Plode EKONERG d.o.o.
Figure 2-3
Chapter 2, Page 10/18
_ 1

__ I - - -l
EA and EMP for New Cargo Bulk Terminal at the Port of Ploce EKONERG d.o.o.
Figure 2-4
Chapter 2, Page 11 / 18

EA and EMP for New Cargo Bulk Terminal at the Port of Ploce EKONERG d.o.o.
2.2.4. Equipment facilities and infrastructure necessaryfor operation of port terminal
EQUIPMENT FOR TERMINAL OPERATIONS:
(A list of equipment required for operation of port terminal including the data on quantities andcapacities of equipment is given in the following sub-sections).
OBJECTS (FACILITIES)* Administration building (with offices for terminal management, communication and
monitoring)* Workshop building (with warehousing, and laboratory for sampling and quality control
INFRASTRUCTURE:
Electric Power Infrastructure: Six new substations of 20/0.4 kV (SS1 to SS6) have beenprovided for power supply of users at the new bulk cargo terminal. Medium voltage powersupply of the existing power users and the substations 10/0.4 kV in the Port of Ploce is done bya 10 kV power grid from 35/10 kV Vranjak Substation. The substation Vranjak (35/10 kV) andthe cable lines from the Vranjak substation to the existing Port switchgear (10(29) kV do nothave sufficient reserve for the power supply of new terminals (container terminal and bulk cargoterminal). Consequently, MV power supply and connection of the new 20/0.4 kV substation forthe new bulk cargo terminal will be done from the HEP's distribution grid at 20 kV voltage levelfrom the new substation 110/10(20) kV Ploce scheduled for construction in the town of Ploce.
Drainaqe: At the part of the port area considered, there is no system for drainage of sanitarywaste water and storm water. Therefore, a special system for drainage of water in the portterminal area will be built. In future, all waste water could be re-pumped to a single port systemwhen it is built.
Sanitary wastewater drainage: Sanitary waste water will be treated in a locally installed facilities- a biological pit.
Storm water drainage: A separate drainage system is planned for the berth area and a separatedrainage system for the storing areas.
Berth area drainage: Operational quay of the berth will be constructed of concrete so it will haveto be provided with drains and separators before discharge to sea. Because of its size, 75 mwide and 300 m long, two separators should be foreseen. The capacity of each separatorshould be 15 m3 (6.0x2.Oxl.25 m) to ensure at least 3 minutes retain time and velocity lowerthan 0.05 m/s. The size (capacity) of the drainage system and separators was defined by thefollowing input data: the rainfall intensity of 0.020 I/s_m 2, which corresponds to a 10-minute rainof a 10-year recurrence interval and maximum daily precipitation of 100 mm. Storm waterdrainage separators will enable settling of solid particles and skimming of oil impurities before
Chapter 2, Page 12/18

EA and EMP for New Cargo Bulk Terminal at the Port of Ploce EKONERG d.o.o.
the appropriately clean water is discharged into the sea (discharged water quality will beprescribed by Croatian Waters Corp. in the Location Permit licensing process).
Storage area drainage: There will be no impermeable base at the storage areas for bulk cargo,so it can be expected that most of precipitation, those of smaller intensity in particular, will sinkinto the ground. However because of the surface colmation (clogging), and in case of heavierrains sinking will be slower and surface water could occur. A sunken storage area could preventwater flow across the roads to the sea. To avoid too long staying of water at the storage areas,the skirts of the storage areas will be provided with built-in drains from which water would becollected and discharged by three collectors (east, central and west). In such a way,precipitation will leak through the material stored and a sand base and it will be filtrated beforegoing to drainage canals. The quality of this water could be considered satisfactory and couldbe discharged to the sea directly without keeping it in the settling tanks. Some water from thecollectors will be collected and kept in special basins of 160 m3 and 80 m3. The basin of 160 m3
capacity will be supplied with water from the central and west collector and the basin of 80 m3
will get water from the east collector. Water from these basins could be used for the wateringsystem for belt conveyors and for the material in the storage area to prevent dust emission.
Run-off from the main internal roads will be taken to a drainage system by means of catchbasins (drains) with separators and will be discharged in the same way as precipitation from thestorage areas.
A drainage system is given in Figure 2-5.
Water SuPPIV: Water supply to the bulk cargo terminal is planned by two separate systems, adrinking water supply system and a system for watering stored material and fire protection.
Drinking Water System: Supply of drinking water to sanitary facilities will be made by water-metered connections from the public water supply system.
Fire System and Storage Watering: A system for watering the material stored is necessary toprotect the environment from dust emission from the storage area during unloading and bulkcargo handling and carrying away of bulk material during strong wind. Watering will be carriedby fresh water because the use of sea (brackish) water from the Vlaska Channel would result intoo high concentration of chlorides on the material stored. Alongside the storage area a pipewatering system of 0 200 mm will be installed. The watering system will be provided with firehydrants and connections for spraying nozzles. Water to this system will be supplied by pumpswith automatic switching (booster pumping system) accommodated in buried storage tanks forcollection of rain water (tank capacity 160 m3 and 80 m3 (see Drainage). In periods ofinsufficient inflow of rainwater, the storage tanks will be filled with fresh water from the"Jezerine" Lake by means of a pumping station and 4 km long supply piping. That system couldalso be used for fire protection of storage areas. The water supply system is illustrated inFigures 2-5 and 2-6. Tank cars of adequate capacity are provided for regular maintenance ofinternal roads in the port terminal area.
Chapter 2, Page 13 / 18

EA and EMP for New Cargo Bulk Terminal at the Port of Ploce EKONERG d.o.o.
Internal road network: The new Bulk Cargo terminal has access by road for cars of employeesand trucks with consumables. The access road will also be used to deliver equipment during thebuilding of the terminal. On the terminal normal asphalt roads are foreseen to inspect theterminal. There are no special features for the roads, except for the normal issues like lightingand water drains.
Terminal railway system: The railway freight cars (wagons) will be fed by the train loadingstation. This rail wagon loading system consists of two bunkers. The top bunker will becontinuously fed by the reclaimer with a capacity of maximum 1000 tVh. Beneath the top bunkeris a weighing bunker of 58 ton. The weighing bunker will be filled up to this maximum rail wagoncontents of 58 ton and then discharged into the rail wagon. For this several chutes might benecessary for good filling results, depending on the length of the train. The internal railwaysystem is based on the following starting points:
the northern track will be used for the delivery of empty compositions, on the northern trackno compositions will be parked,on the southern track, within the fence of the terminal, 2 empty compositions can beparked,
* on the southern track, outside the fence of the terminal, 2 full compositions can be parked.
SUPPLY OF CONSTRUCTION STONE FOR CBT
The volume of 1,161,000 m3 of stone will be required for CBT construction (for breakwaters,fills, reclamation and similar) which does not exist at the location of the Port of Ploce. Stone willbe provided from excavations made for construction of a nearby section of the Adriatic Highway.
The construction of the new 7.5 km long access road for transport of construction stone (forreclamation and soil-improvement purposes) to the CBT area, and an environmental impactassessment for those works will be a subject matter of a separate EIA Study.
Designing of the port access road and Adriatic Highway section to Plo6e, as well as the EIASpreparation thereof, are in progress (financed by HAC, Croatian Highway Corp.). Based oncurrent and planned status of these activities, the licensing process (location permit,construction permit) and later on the construction of the access road and delivery of stone to thePort area, is expected to be largely harmonized with the CBT Ploce planned schedule oflicensing and development activities.
Chapter 2, Page 14 / 18

EA and EMP for New Cargo Bulk Terminal at the Port of Ploce EKONERG d.o.o.
Figure 2-5
Chapter2, Page15/18
EA and EMP for New Cargo Bulk Terminal at the Port of Ploce EKONERG d.o.o.
Figure 2-6
Chapter 2, Page 16 / 18
_

EA and EMP for New Cargo Bulk Terminal at the Port of Ploce EKONERG d.o.o.
2.2.5. Use of the Project
Operation of the port terminal includes, unloading of ships, bulk cargo handling and loadingwagons. Daily capacity of ship unloading is 35,000 tVday and daily capacity of wagon loading is15,000 t/day. In a year, 78 arrivals of ships of 80,000 DWT are planned.
Equipment required for terminal operation includes (Figure 2-7):2 x 30 t Gantry cranes with grab 1500 t/h2 x Boom stacker 3000 t/h
* 2 x Scraper reclaimer with 2 booms 1000 t/h* Train loading station 1000 t/h
Quay belt conveyor 1500 t/hQuay belt conveyor 1500 t/hDistribution belt conveyor 1500 t/hDistribution belt conveyor 1500 t/hStockyard belt conveyor 3000 t/hStockyard belt conveyor 3000 t/hTrain loading belt conveyor 1000 tVhTrain loading belt conveyor 1000 t/h2 x Wheel loaderDump trucks
Equ,ipment Overview tail wagon buffer tx trainloadrg statsn
i _ 3000 trh bett conveyor
mm_* 1500 til beR conveyor
1000 tAh beRt conveyor tia,Sf slabon [ s abon
rra,ioter ~ ~ .t_ trtionslbo
note!2x wheelloader for cleating
transfer soation
transfer slabon
apion stoamge
I AL I I ansfer statn Quay
ao ganlty crane 30t
Figure 2-7: Equipment to be installed at the CBT Ploce
Chapter 2, Page 17 /18

EA and EMP for New Cargo Bulk Terminal at the Port of Ploce EKONERG d.o.o.
Bulk cargo is unloaded from ships by gantry cranes. Cranes can unload the cargo to the quaybelt conveyor or, if necessary, onto an outdoor storage alongside the berth. Belt conveyors ofadequate capacity carry transportation of bulk cargo from the unloading place to the place ofloading.
Boom stackers are used for shifting bulk cargo from the belt conveyor to a place in the storingarea whereas the scraper/reclaimers are used to transfer bulk cargo from the storage to the beltconveyor going to the station for loading wagons.
A system for loading wagons consists of two bunkers. A belt conveyor of 1000 t/h maximumcapacity continuously fills top bunker. Underneath this bunker, there is a 58 t weighing bunker.The weighing bunker will be filled up to this maximum rail wagon content of 58 t and thendischarged into the rail wagon.
Outline of selected Mitigation Measures considering sea and air protection during projectoperation (excerpt from the EMP - Chapter 6):
To reduce particulate emission to air due to bulk cargo handling and dispersion of bulk cargo bywind during the Project operation, following measures will be implemented:
- Construction of a system for spraying/wetting bulk cargo and unloading/reloading places(transfer points);
- Unloading / reloading places (transfer points) on the belt conveyor line will be designedclosed;
- Obligatory usage of a spraying / wetting system;- If necessary, polyelectrolytes for spraying of the material stored at the terminal shall be
used.- Maintenance of internal roads is required;- A green belt will be planted on all places that will not interfere with the terminal
operation.
To mitigate the impact of wastewater generated during the Project operation on the seawaterquality and indirectly on marine communities (biocenoses), the following measures will beimplemented:
- A system for drainage and treatment of rainfall (storm waters) from the terminal area toachieve the quality of water for discharge into the sea (discharged water quality will beprescribed by Croatian Waters Corp. in the Location Permit licensing process) will beconstructed;
- A system for collection and treatment of sanitary wastewater from the terminal area willbe constructed;
- Also regular maintenance of these systems is required.
Chapter 2, Page 18 / 18
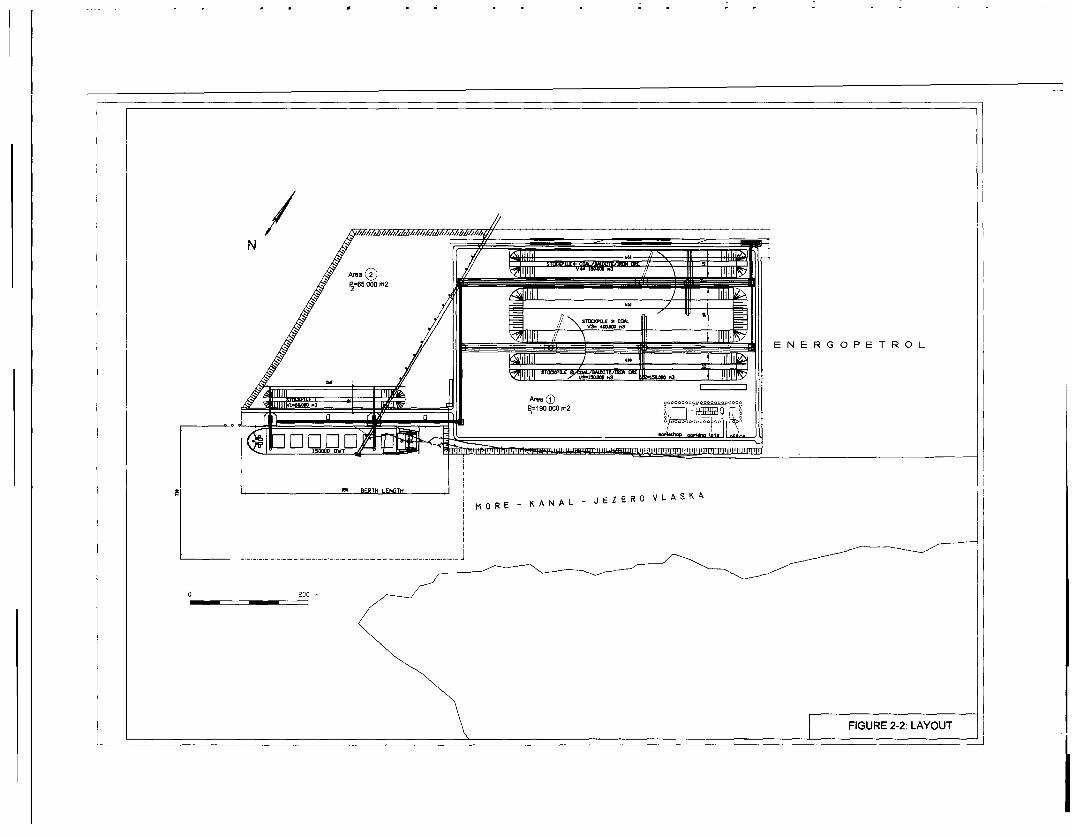
/ < 0 - H H j - 0 S~~~~~~~~~ NE G O P E T R O L
p1~~~~~~~~~~~~~~~~~~~~~m 1
X~~~~~~~~~~~~~~~~~~~ 0 E K -1 A N A L -J Z
o~ ~ ~ ~ ~ ~~~~... ...-..... ...........
f~~~~~~~~~~~~~~~~~~~~~~~~~~~~~~~FGR 2___, LAYOUT

FLgE~~~~~~~~~~~~~~~~~~~~~~~~~~~~~~~~~~~~~~~~~~~~d
-. C F~~~~~~~~~~~~~~~~~~~~~X 1
1 - 1 | S . ~~~ORTOPHOTO IN BACKGROUNDI
t11:1 11_~~~~~~~~~~~~~~~~~~~~~~~~~~~~~~~~~~~~~~~~~~~~

DREDGED MATERIAL DEPOSITCROSS SECTION
1 ~~4 m/ Dredged material deposit +.3 m
+1.3 ni existing s iLjvel, / ' 4" ,
I ........ .. ., , ........ .. . ,, ...... . .. . .l~~~~~~~~~~~~I horizontal drain pipe. . . .. . .Sand -6 . covered with ieotextileI : : i Geotextile - . Soil (k=5x10 m/s). and sand maFerial .
Excavated material
FIGURE 2-4: DREDGED MATERIAL DEPOSIT

[ v .... .. - = _ _ ._ .. _ .- _ _ _ _ -, .... .0 , .__ _ _ _ ........._,,~ ........ _. : Ex,sng aler supply e
/1 ~ ~ ~ ~ ~ ~ ~ ~ 7
*L r. - _ 4 ; .
; < e * -t " gr ------- - - ----
20 ....................... drainage for storm water and leachatex ~ig ~aIr SuEA-1 I~fl
-~~ ~ ~ ~~~~~ Ii .e.- - -_ -. - --- --- e ' - -'--L-------- .-'-....__ :,, ,-l
storm water and leachate collectors
[ storm water separator
fire and storage water linespotable and sanitary water lines
0-> fire and storage water systemFIGURE 2-5: WATER SUPPLY AND DRAINAGE

17 -;¢- (9 _/8! r -;sVllI \ - j<>,z5zyr.i-ixlfX -- &Xo & v /t?-'A g *l - 4 __<,+ 42 i,', C \ (, T*s_ 0 0 ~~~~~~~~~~~~~~~~~~~~~~~~~~~~~t 9--
. . ) _ + : rS Crd n*,r 4 1 [ [ *> ? | _ - -2 . - ,) - .nS rt> .,. .Z
s S tl} S I _ fl ie Jf w_ _ _ _JE - I . o Z a -;b, d,e 4 > kg----- A
i ; - lr'? [liara:efa § fn3,, 1.St * -> z ;->-- X 191t ~ s ';,. e
?~~~~2 ' "° j'9 -ljial 71>.e St,;.d.1.,_9nje tw
i t! s := .e755s -4k ? ;1.-
0 . f k @1 (il * ' 4 10 '-14
ff to_ 0' r 1'1;S],. v _s 3 g~~~~~~~~~~~~~uk
i . A 1 ;9E ~~~~~~~~~~~: - 1f-= 254,.,
fca~~ Jez.a A/I 100a
4 ,.t.-.=_+-1.4--- -~~L -- I- ---., \, 2 t\\-"--2-i-\;63°--tt-0 sh-- ! tn ;R; 1 04~~~~~~~~~~~~Veil(
. l J \ ll;y, ' S | , ',.'14 4._,1,';-- <4 wS .PA/ItAK04,?
E W mProjec~t sit > v 61-~! 171 '~ IGR -:ADTONLWTRSPL
= 1 - ---- is-- X t- ------- ---- -- FROM LAKE "JEZERINA"~~~~~~~~~~ e ze r
19~~~~~~~~~~~~~~~~~~~~~~~~~~~~~~~~~~~~~~~~~~~~~~~~~~~~~~~~~~~~~~~~~~~~~~~~~~~~~~~

EA and EMP for New Cargo Bulk Terminal at the Port of Plo6e EKONERG d.o.o.
3. BASELINE DATA
Considering the estimated main environmental impacts of the planned process (see Chapter 4),a summarised review of the area characteristics important for the planned process have beengiven hereafter:
. Description of biological land characteristics of the surrounding area together with thereview of protected natural values and areas specified for protection (Chapter 3.1)
. Description of marine communities in the narrower area of Project location (Chapter 3.2). Climatological characteristics (Chapter 3.3). Air quality (Chapter 3.4.)* Characteristics of marine sediment (Chapter 3.5). Vision of development of the town of Ploce (Chapter 3.6.)
There is no systematic testing of sea quality in the narrower area of the Project location.Sanitary sea quality on the beaches in the area of Ploce City is being examined according to theCounty Program of establishing sea quality on the beaches. In the area of Ploce, examination isbeing performed on two locations: The New Town Beach and The Estuary Ploce. Theexaminations include determining the basic physical, chemical and bacteriologic characteristicsof sea-waters. Bacteriologic parameters are the most significant indicators of sea contaminationby sanitary effluents. According to the Sea Quality Report made on sea beaches in theDubrovnik - Neretva County in 2004, the sea on the New Town Beach has been classified ascategory III (sea under influence of occasional contaminations). The sea on the EstuaryTerminal Ploce has been classified as category 11 (suitable for swimming). The report for theyear 2005 has not been officially established yet.
Chapter 3, Page 1 / 31

EA and EMP for New Cargo Bulk Terminal at the Port of Plo6e EKONERG d.o.o.
3.1. DELTA OF NERETVA RIVER
Delta of the Neretva River is a specific area on the Adriatic coast characterized by floodplain,formed by sediment deposition and intersected with numerous side branches and channels,costal area and karst hills on the north side. The delta represents the most importantMediterranean swamp area in Croatia and is one of a few remaining habitats of this type left inEurope. Due to extensive melioration numerous swamp areas, lakes and lagoons were dried.However, from biodiversity and landscape aspect this is still one of the most valuable areas inCroatia.
Landscape and biological diversity of the area depend mainly on the regime of the NeretvaRiver. Delta Neretva has been included in the List of Wetlands of International Importance of theConvention on Wetlands of International Importance especially as Waterfowl Habitat (RamsarConvention). The site map of the area with site boundaries has not been submitted to theRamsar Convention Secretariat, which is the obligation of Contracting Party i.e. Croatianinstitutions. The delta is also included in the programme Important Bird Areas conducted by theBirdLife International. Moreover, it is proposed for protection as a nature park. At the moment inthe area there are three ornithological reserves, Pod Gredom (Vid), Prud (Metkovic) and Orepak(Kula Norinska), and the ichthyological-ornithological reserve Us6e Neretve on the left side ofthe rivermouth. Area Ploce-Parila on the right side of the rivermouth and Lake Kuti are proposedfor the protection as ornithological reserves. In addition, Modro oko and Lake Desne areprotected in the category of significant landscapes. The Bacinska Lakes are situated northwardfrom the Ploce Port. They represent a karst depression with maximum depth of 31 meters andhave high landscape value. Visnjica Hill, categorized as valuable area, with forest vegetation islocated opposite to the Port of Plo6e (approximately 1.5 km distance). The Malostonski Baywhich is important for shell cultivation is located south-eastward from the port (approximately 40km distance).
Protected natural heritage and areas proposed for protection in the project surroundings areshown on Figure 3-1.
The delta is located in conifer eumediterranean zone in border area to deciduoussubmediterranean zone of mediterranean vegetation region. Due to large anthropogenicinfluence forest vegetation is mostly degraded and the soil is eroded. Forest vegetation hasbeen replaced with different degraded vegetation forms which are present in the areasurrounding the floodplain. Freshwater and slightly brackish plant communities are present inthe floodplain while plant communities Juncetum maritimo-acuti and Salicornietum fruticosae ofthe costal areas and brackish swamps are present in the area closer to the sea.
Due to geographic location and diverse habitats the delta is also characterized by rich birdfauna. 310 bird species, including 115 which nest here, have been recorded in the literature.Reed beds and other fluvial habitats are important nesting, migration and winter sites. Brackishzone near the rivermouth is important as a resting place during migration periods from secondhalf of August till end of December and from March till July, and as a winter site due to its mildclimate.
Chapter 3, Page 2 / 31

EA and EMP for New Cargo Bulk Terminal at the Port of Plode EKONERG d.o.o.
In Table 3-1 are given the examples of some breeding species present in Neretva Delta listed inthe Annex I (bird species which shall be the subject of special conservation measuresconcerning their habitat in order to ensure their survival and reproduction in their area ofdistribution) of the Bird Directive and in Table 3-2 are given the examples of migrating andwintering species in Neretva Delta listed in the Annex I of the Bird Directive.
The area also has rich fish fauna due to diversity of habitats and abundant nutrients brought bythe river. In the delta around 150 fish species, including marine and 35 freshwater species, havebeen recorded. Prior to drying of lakes and lagoons an area near the rivermouth was veryimportant as a fish spawning and fry nursery area. Thus preserved lagoons, such as Parila andVlaska, represent important areas for fish and crabs which spend rest of their life in fresh watersor in the sea.
17 reptile and 6 amphibian species have been recorded in the delta. Bat species and the otterare important representatives of mammalian fauna.
34 species of diurnal butterflies (Rhapalocera), with protected species Papilo machaon andIphiclides podalirius, and 101 species of moths (Heterocera) have been found in the NeretvaDelta. Some of recorded moths, such as hygrophilic species Archanara sparganii, Nonagriatyphe, Phragmataecia castaneae, Rhyparioides metelkana, are very rare in Croatia. Moreover,migration species, e.g. Colias crocea, Vanessa cardui, Agrius convolvuli, Trichplusia ni etc.,which migrate from Africa, Asia and North America come in the area every year.
Chapter 3, Page 3/ 31

EA and EMP for New Cargo Bulk Terninal at the Port of Ploce EKONERG d.o.o.
Table 3-1: Examples of some breeding species present in Neretva Delta listed in the Annex I ofthe Bird Directive (NPL - protected by Nature Protection Law (Official Gazzete 70/05 of 27 June2005) and by Ordinance for protection of some bird species (Aves) (Official Gazette 43/95 of 28June 1995 amended by O.G. 75/02 of 15 May 2002); EN - endangered; VU - vulnerable; NT -near threatened; LC - least concern; (bp) - breeding population)
CR0 BIRDSCIENTIFIC NAME ENGLISH NAME FAMILY PROTECTION Status DIRECTIVEStatus Annex
Ardea purpurea Purple Heron Ardeidae NPL VU (bp) 1Ardeola ralloides Squacco Heron Ardeidae NPL EN (bp) 1Botaurus stellaris Bittern Ardeidae NPL EN (bp) 1Egretta garzetta Little Egret Ardeidae NPL VU (bp) 1
Ixobrychus minutus Little Bittern Ardeidae NPL NT (bp) 1Nycticorax nycticorax Night Heron Ardeidae NPL NT (bp) 1
Phalacrocoraxpygmaeus Pygmy Cormorant Phalacrocoracidae NPL CR (bp) 1Charadrius dubius Little Ringed Charadriidae NPL NT (bp) 1PloverMerops apiaster Bee-eater Meropidae NPL LC (bp) 1
Podiceps cristatus Great Crested Podicipedidae NPL LC (bp) 1GrebeIIRiparia riparia Sand Martin Hirundinidae NPL NT (bp) 1
Table 3-2: Examples of migrating and wintering species in Neretva Delta listed in the Annex I ofthe Bird Directive (NPL - protected by Nature Protection Law (Official Gazzete 70/05 of 27 June2005) and by Ordinance for protection of some bird species (Aves) (Official Gazette 43/95 of 28June 1995 amended by O.G. 75/02 of 15 May 2002); RE - regionally extinct; EN - endangered;NT - near threatened; (bp) - breeding population)
CRO BIRDSCIENTIFIC NAME ENGLISH NAME FAMILY PROTECTION Status DIRECTIVEStatus Annex
Chlidonias niger Black Tern Sternidae NPL RE (bp) 1 migrationGelochelidon nilotica Gull-billed Tern Sternidae NPL RE (bp) 1 migrationGlareola pratincola Collared Pratincole Glareolidae NPL 1 migrationHydroprogne caspia Caspian Tern Sternidae NPL 1 migrationPhalaropus lobatus Red-necked Scolopacidae NPL 1 migrationPhalarope _ _ _ _ _ _ _
Recurvirostra avosetta Avocet Recurvirostridae NPL 1 migrationSterna albifrons Little Tern Sternidae NPL EN (bp) 1 migrationSterna hirundo Common Tern Sternidae NPL NT (bp) 1 migrationPodiceps auritus Slavonian Grebe Podicipedidae NPL 1 wintering
Chapter 3, Page 4/31

EA and EMP for New Cargo Bulk Terminal at the Port of Ploce EKONERG d.o.o.
FIGURE 3-1
Chapter 3, Page 5 / 31

EA and EMP for New Cargo Bulk Terminal at the Port of Ploce EKONERG d.o.o.
3.2. MARINE COMMUNITIES
Diving survey, by days and nights, to detect communities of the sea bed and coast and thecomposition of flora and fauna in the project area was conducted. Results are displayed in:
. table of identified plant and animal species (Table 3.2-1)
. table of identified marine communities (Table 3.2-2) with their classification according toconventions ratified by Croatia
. map of natural values (Figure 3-2)
. map of identified marine communities (Figure 3-3)
Marine specimens were identified in situ by standard observation method. Some specimenswere conserved and identified in a laboratory according to taxonomical guides. Taxaabundances were detected by the method for density estimation according to Peres, J.-M. andH. Gamulin Brida (1973). Sea bed communities were identified according to Peres, J.-M. and H.Gamulin Brida (1973), Bellan-Santini, D., J.-C. Lacaze and C. Poizat (1994) and new CroatianNational Habitat Classification (Alegro A., Antonic O., Bakran-Petricioli T., Gottstein-Matocec S.,Kusan V., Peternel H. and Tkalcec Z., 2004).
Table 3.2-1 Plant and animal species identified during the biological survey of the project area.Abundance: ccc - very numerous taxa; cc - very frequent taxa; c - frequent taxa; + - usuallypresent taxa; r - rare taxa; rr - very rare taxa (according to P6res, J. -M. and H. Gamulin Brida,1973)
TAXA (if existsH ABUNDANCE COMMENTS
Algae - algae
Codium adhaerens (Cabrera) Agardh r Small specimensCorralina sp. C On concrete docks of inner part
_______________________ _o__ f the portUlva sp. Sea lattuce + Inner part of the portSmall, unidentified algae + On lower parts of docksPlantae - plants cCymodocea nodosa (Ucria) Ascherson C On several localities by the
channel mouthZostera nana Small eel-grass c Within community of C. nodosaZostera marina Individual specimens withinEel-grass r community of C. nodosaPorifera - sponges
Cnidaria -cnidariansBunodeopsis strumosa Andres 1881 On plants' leaves, can be seen
only during nightnemona sulcata Snake lochs
Eudendrium sp. + Only in a fouling
Chapter 3, Page 6 / 31

EA and EMP for New Cargo Bulk Terminal at the Port of Ploce EKONERG d.o.o.
TAXA ENGLISH NAME ABUNDANCE COMMENTS(if exists)Mollusca -molluscansArcac nzoae L. Noah's ark On concrete docks ot the port_______________________________ _ a_ _L._Noah _s_ark _rand across the port
Acanthocardia tuberculata (L.) cockle c Dense populationsBittium reticulatum (da Costa) ? Only shells have been foundCerastoderma edule (L.) Common cockle c Buried in sediment, only shells
have been foundChama sp. +Chiton sp. Chiton +Gibbula sp. rGourmia rupestre Risso Cornet +Hexaplex trunculus (L.) Apple murex +Loligo vulgaris Sqiud c Can be seen only during nightMactra corallina (L.) Mactra surf clamModiolus barbatus (L.) Bearded horse
mussellrMonodonta turbinata (Born) Turban shell c Small specimensMytllus galloprovincialis Lam. Common mussell c The most common taxa in a
foulingNassarius reticulatus (L.)
Octopus vulgarls Cuv. octopuss ?Ostrea edulis L. Common oyster +Ozaena moschata (Lam.) Musky octopus ?Patella caerulea (L.) Limpet +Pholas dactylus L. Common pidock + In shallow waters on harder
____ ___ ____ ___ sedimentSepia off/cinalis L. Common cuttlefish Only eggs have been seenSepiola rondeleti Steenstrup few specimens have been
Little cutle c seen during night, they are buried_______________in sand during daytime
Tapes decussata (L.) Calico clam c Numerous, edible, collected byple
Thracia papyracea (Poli) cTurritella communis Risso Screw shell ? buriedCrustacea -crustaceans
Balanus sp. Common barnacle c On concrete part of docksChthamalus stellatus (Poli) c On the limestone parts of the
ccoastEthusa mascarone (Herbst) ? Only one specimens have been
_ _ _ _ _ _ _ _ _ _ _ _ _ _ _ _ _ _ _ _ _ _ _ _ _ _ _ _ _ _ _ _ _ _ _ _ _ _ _ _ _ _ _ _ s e e nMaja squinado (Herbst) Spider crab c Small specimensMysidae gen. sp. r Small groups
Relatively small specimens,Pachygrapsus marmoratus (Fabr.) r found only in the inner parts of
________________ ~ocksPaguridae gen. sp. +Pagurus sp. +Sqilla mantis Mantis crab + In holes in the sediment
Chapter 3, Page 7 / 31

EA and EMP for New Cargo Bulk Terminal at the Port of Ploce EKONERG d.o.o.
TAXA ENGLISH NAME ABUNDANCE COMMENTS(if exists) _ _ _ _ _ _ _ _ _ _ _ _ _ _ _ _
Polychaeta - polychaetes
Sabella pavonina rPomatoceros triqueter cSabella spallanzanii (Viviani) c n a hard substrate - solid
_ Irva~~~~~~~~~stesEchinodermata - echinodermsHolothuria tubulosa Common sea r
cucumberParacentrotus lividus Lam. Common urchin r Only by solid wasteOchnus planci rBryozoa - bryozoans
Schizobrachiella sanguinea (Normanj + In a foulingTunicata - ascidians
Phallusia mammilata (Cuvier) White ascidian r In a foulingPisces - f ish
Anguilla anguilla Common eel Main specie in a catch, migrateshrough the channel, only holes
c in a sediment where it lives havebeen seen
Atherina boyeri Risso Silverside c In warm part of the seasonBlennius sanguinolentus Pall Red-speckled +
blennyBlennius gattorugine Brunn. Tompot blenny +Boops boops (L.) Bogue ? Small specimensBoops salpa (L.) Salema cCallionymus dracunculus Spotted dragonet cCharax puntazzo (L.) Sheepshead bream +Congerconger(L.) Conger eel r In the port, beneath docksCoris julis (L.) Raibow wrasse c Small specimensCrenilabrus tinca (Brunn.) Peacock wrasse cDiplodus annularis (L.) Annular bream cDiplodus vulgaris (Geoffroy Saint-Hilaire) Two- banded Solitary, not in a haul
breamDicentrarchus labrax (L.) Sea bass ?Gobius jozo (L.) Black gobby cGobius sp. +Lithognatus mormyrus Stripped breamMullus surmuletus (L.) Stripped mullet c Small specimens, numerousMugdi cephalus Cuv. Grey mullet +Mugil labeo Cuv. Harbour grey mullet cMugilidae gen. sp. Mullets c Important for fisheryMyliobatis aqiula (L.) Eagle ray ? Can be caught with a trawl-linePagellus erythrinus Pandora Specie important for fisheryPomatomus saltatrix Sea arrow c Specie more and more important
. in fishery
Chapter 3, Page 8 / 31

EA and EMP for New Cargo Bulk Terminal at the Port of Ploce EKONERG d.o.o.
TAXA ENGLISH NAME ABUNDANCE COMMENTS(if exists)Serranellus hepatus (L.) Brown comber cSolea solea Common sole +Sparus aurata Gilt-head bream + Uses the area for spawningSpicara maena Low-body picarel cSygnatus acus Pipe fish rTracthinus draco Greater weewer Only one specimens have been
Trachurus trachurus (L.) ? In pelagic zone
Chapter 3, Page 9 / 31

EA and EMP for New Cargo Bulk Termirnal at the Port of Ploce EKONERG d.o.o.
Table 3.2-2: Identified marine communitiesMarine communities Community Community
No. according to Croatian code according code according Comments and communityNo. National Habitat to Barcelona to EUNIS location
Classification Convention Convention1 F.1.1.1.1. Mediterranean Encompasses sandy and muddy parts
glassword swards of the coast above upper levels of highA2.6513 tide. Present in the whole area,
especially on the west part of thecoastline opposite to the terminal.
2 (F.5.1. Anthropogenic Encompasses all constructed dockshabitats on a sea coast) for small and large vessels in the innerF.5.1.2.1. Constructed parts and outer parts of Ploce Portof a coast
3 F.4.2. 1. Biocenosis of It can be found on all lime parts of thesupralittoral rocks coast (middle part of the port which
1.4.1. - has not been built yet, all west coastand coastline of small islands in thearea)
4 G.1.1.2.1. Aquatorium of a Includes sea area as far as outer partport of the bulky cargo terminal. Outside of
this area the aquatorium is almost_________________ natural.
5 G.2.1.1. Biocenosis of Encompasses parts of the coast withmediolittoral muddy sands sediment in the zone between highand muds and low tides. Occurs in protected
parts of channel Vlaska and lakeParila.
6 G.2.4.1. Biocenosis of Encompasses rocky zone above theupper mediolittoral rocks average sea level to upper level of
high tide. In all places occurs below11.4.1. A1 .13 biocenosis of supralittoral rocks -
approximately 20 cm high zone. It ispartly modified, degraded and hasfewer taxa due to decreased salinity inthe area.
7 G.2.4.2. Biocenosis of lower Encompasses rocky zone bellow themediolittoral rocks 11.4.2. A1 .14 average sea level to lower level of low
tide. It contains decreased number oftaxa and specimens.
8 G.2.5.2. Mediolittoral Encompasses zone between high andbiocenosis on a hard low tide in constructed parts of Plocesubstrate with Port. Number of taxa and theiranthropogenic influence specimens is very small.
9 G.3.1.1. Euryhaline and Encompasses major part of the seaeurythermal biocenosis l 1 1111 A4.41 bed with sediment above wave base. It
eury.hermalbiocenosi 11.1 . A4.41 is best developed in Lake Parile,outside of the influence of the project.
10 G.3.2.1. Biocenosis of fine Encompasses areas with larger wavesands in shallow waters 111.2.1. A4.22 influence down to 2 m depth. It is
. . . . ~~~~nicely developed in the shallow sea onthe right coast of the channel mouth.
11 G.3.8.2. Anthropogenic Encompasses the zone bellow lowerinfralittoral biocenosis on a level of high tide on alreadyhard substrate constructed parts of the coast of the
bulk cargo terminal. It also covers harditems thrown from the port
12 G.3.2.3. Biocenosis of Encompasses all other areas of themuddy sands in shelterd 111.2.3. A4.33 sea bed with sediment bellow waveareas of the coast base (deeper than 2 m)
Chapter 3. Page 10 / 31

EA and EMP for New Cargo Bulk Terrminal at the Port of Ploce EKONERG d.o.o.
Figure 3-2
Chapter 3, Page 11/31
lI

EA and EMP for New Cargo Bulk Terminal at the Port of Ploce EKONERG d.o.o.
Fish population and other economically important organisms
In the project broader area fish population and population of other economically importantorganisms are still relatively rich and only partly affected by human activities. Some of theseorganisms inhabit this area permanently, either as a benthos or in pelagic zone, while otherscome occasionally to seek food, shelter or for spawning. Economically most importantorganisms are European eel (Anguilla anguilla), Mugil spp., diverse fish from familiy Sparidaeand Striped red mullet (Mullus surmuletus). Moreover, marine shrimps Crangon crangon,Penaeus keraturus (usually inhabit depths between 10 and 40 m) and Squilla mantis are alsoimportant for the local economy. There are numerous cephalopods such as squids Loligovigaris and L. media, Common cuttlefish (Sepia officinalis) and to a less extent Commonoctopus (Octopus vulgaris). Diverse cockles from genus Cardium and genus Venerupis are alsopresent.
Almost all mentioned species migrate through the Vlaska Channel. The largest is the migrationof adult eels toward the sea in the autumn. Before winter Gilthead seabream and soles migrateupwards through the channel for spawning. Moreover, diverse fish and molluscs come in theshallow waters in the autumn and spring. Daily migration is also important in the area, fish fromfamily Sparidae and genus Mullus and especially pelagic cephalopods come during night. Thus"small" fishery is developed in the area of Ploce City. Unfortunately, in the moment it isunorganized and illegal fishery prevails. Diverse fishing devices are being used but only theones which are being used in the project area will be mentioned. Bivalves are harvested in theshallow sea and trawl lines are thrown in the Vlaska Channel during day. During nightnumerous fishing nets are being thrown and crustaceans are harvested. Moreover, protectedbivalve Pinna nobilis have been dived during nights so its population is largely reduced.
Chapter 3, Page 13 / 31

EA and EMP for New Cargo Bulk Terminal at the Port of Plo6e EKONERG d.o.o.
3.3. CLIMATOLOGICAL CHARACTERISTICS
Basic climatological characteristics of the area of Ploce City have been obtained from theweather station data from three climatological observation times - 7 a.m., 2 p.m. and 9 p.m. Theweather station is located at 2 m a.s.l. and its coordinates are: 4302' latitude and 17°25'longitude. Data used for the analysis are from the period 1978-1994.
According to Koppen Classification Map, the climate in the area of Dalmatian coast and also inthe area of Ploce is moderately warm and rainy with hot and dry summers (marked Csa). Thistype of climate is more known as Mediterranean climate. The position on the Adriatic Sea coastand the Neretva River valley has an important role in the climate formation.
Annual course of average monthly air temperatures is given on Figure 3-4 showing hotsummers and mild winters in the area of Plo6e.
Mean annual cloudiness is 4.3 tenths (of 1.9 tenths in August to 5.5 tenths in March and April).Total number of cloudy days (cloudiness larger than eighth tenths) is some 22% days in a yearwhereas clear days (cloudiness less than two tenths) account for almost 38%.
Average annual relative humidity is some 63%, the lowest being in summer months and thehighest in October and November. However, maximum moisture at 2 p.m. (middle-dayobservation time) is characteristic for summer months (July and August) when the airtemperatures and evaporation from the water surface are the highest. At the same time, meandaily moisture and the number of days with the moisture lower than 30% are the lowest in thosemonths.
Total annual precipitation for Ploce amounts 1100 mm on average. The precipitation amount isminimal in summer months and maximal in late fall (October and November). Annual course ofprecipitation is showed on Figure 3-5.
55
45- C.) 35U) 250
7~ 15- _1
° -5 1 -* Maximum valueAverage value
-, v -5 ^ Minimum value
1 2 3 4 5 6 7 8 9 10 11 12month
Figure 3-4: Annual course of air temperature in Ploce
Chapter 3, Page 14 31

EA and EMP for New Cargo Bulk Terminal at the Port of Ploce EKONERG d.o.o.
350--------- -A aerae --------------
! 300 -- -- - ----- - i-mkxintiln- -250 --- -- ------ fi mivi initin -----
% >00 -- - - - - - - - - - - - - -
t 5 /-. .- = -51 0 .... . ... .... . ... .... . C.-. L.. . t~.. . .
1 2 3 4 5 6 7 8 9 10 11 12month
Figure 3-5: Annual course of precipitation for Ploce station
Annual course of the number of days with precipitation and thunder is showed on Figure 3-6.Two maxima could be noticed - one in the spring months (March, April) and the other in the fall(October, November, and December). On average, it is a question of some 100 days with thelargest number of days with 0.5 and 1 litre/m3 of precipitation. Figure 3-7 shows the number ofdays with the amount of precipitation. The amount of precipitation in some 10% cases is largerthan 10 litres per cubic metre and in some 5% cases it is larger than 20 litres per cubic metre,whereas there are only 3 days in a year when very heavy precipitation could be expected (50litres per cubic metre and more).
days12
-- Thunder10 ' j. t Percipitation
6- 6x,I
2 4 ~ - *. iN
1 2 3 4 5 6 7 8 9 10 11 12
month
Figure 3-6: Annual course of precipitation and thunder days
Chapter 3, Page 15 /31

EA and EMP for New Cargo Bulk Terminal at the Port of Ploce EKONERG d.o.o.
Number of days120
io
80
60
40
20
0>0.1 rrm >0.5 nmr >lrmi >5 rrn >10 mn >20 rrrn >50 rrn
Precipitaton
Figure 3-7: Number of days with characteristic precipitation amount
Characteristics of the wind regime in the area of Ploce are determined according to windobservation at climatological observation times. Basic data obtained by observations are winddirection (16 directions) and wind strength/speed in Beauforts. Figure 3-8 shows the frequencyof different wind directions at three climatological observation times and total for all three times.The time wind roses show that the flow direction from the north quadrant (N-E) prevails in themorning and in the evening, whereas during the day the air flow is from the west and south-westdirection. Considering all that (all three climatological observation times) in the area of Plocenorth winds prevail.
14 NNNW 20 44E NNW 16 % NNE
WV 16 NW 12 NE12
WNW 8 ErE NNW 8 ENE
W - . E W E
Wsw ESE A/SW ESE14 hSW SE SW SE r- 7 h SW SE
SSW SSE 021 h SSW SSE 137,14,21 hs S
Figure 3-8: Time wind roses for Ploce and wind rose for all times together
Chapter 3, Page 16/31
EA and EMP for New Cargo Bulk Terminal at the Port of Plode EKONERG d.o.o.
3.4. AIR QUALITY
Five measuring stations have been set up for the purpose of this Study (Figure 3-10) tomeasure total deposited matter (TDM). Sampling and testing of total deposits started in October2005 and was conducted by the Public Health Institute of Splitsko-dalmatinska County. Theamount of total deposits in the samples collected has been identified; insoluble matter in water;lead (Pb), cadmium (Cd), thallium (TI), aluminium (Al), iron (Fe) and soluble matter in water;calcium (Ca2+), chlorides (Cl-) and sulphates (SO42-).
Tables 3.4-1 to 3.4-3 contain preliminary test results and limit values of total deposited matterlevels and the metal content stipulated by the Regulations about limit values of pollutants in air(Gazette 133/05). Limit values of all parameters have been approximated on one-year basis.Because of too short period available for measurements at the weather stations in thesurrounding of Port of Plo6e, the results in the table can be considered preliminary, and the airquality evaluation cannot be given on that basis. However, when the test results are comparedwith the stipulated limit values, all tested values of total deposits and the elements containedtherein (lead, cadmium and thallium) are found lower than the limit values. The limit values ofthe elements tested (aluminium and iron) have not been stipulated but they have been testedbecause of type of bulk cargo to be stored at the new terminal).
Chapter 3, Page 18/ 31
EA and EMP for New Cargo Bulk Terminal at the Port of Ploce EKONERG d.o.o.
FIGURE 3-10
Chapter 3, Page 19 / 31
-i -~

EA and EMP for New Cargo Bulk Terminal at the Port of Ploce EKONERG d.o.o.
Table 3.4-1: Test results of total deposit matter (October2005)
Total Insoluble matter Soluble matterMEASURING depositedSTATION pH matter Total Insoluble Pb Cd TI () Al Fe Total Solublemg/m 2/d insolumble matters 2 M2 Pg/M2 Pg/M2 soluble matters Ca Cl so42,_________M /M2/d % pagIm Id p./md pglm2ld jgm/d agm 2 d (2)
Ploce -
alongthe 5.85 106 37 35 5.599 0.2975 9113.56 514.37 69 65 1.32 11.85 8.75runwaYTech. Establ. 6.57 187 99 53 9.741 0.5932 8819.8 760.85 88 47 4.91 14.31 13.13Medical 6.82 215 100 47 11.034 0.0395 12821.5 1165.11 115 53 10.20 14.98 16.12CentreIIWeather 5.99 103 51 50 6.086 0.0589 4979.9 627.81 52 50 8.5 10.37 8.75Station
_ _ _ _ _ _ _
Cou "Izvor" 5.74 74 22 30 5.364 0.330 6645.00 462,6 52 63 7.08 16.85 14.74Limit values(Official 350 100 2 2Gazette 133/05) _ I(1) Thallium concentration at all measuring station were lower than 1.071 pg/l (instrument detection limit)(2) October was very rainy that results in wash out of atmosphere and therefore high percentage of soluble matter in water.
Chapter 3, Page 20 / 31

EA and EMP for New Cargo Bulk Terminal at the Port of Ploce EKONERG d.o.o.
Table 3.4-2: Test results of total deposit matter (November 2005)
Total Insoluble matter Soluble matterMEASURING depositedSTATION pH matter Total Insouble Pb Cd T Al Fe Total Solublemg/m2/d insoluble matters 2 d 1g/M2 ( g/M2 M2 soluble matters Cat 2 Ci' S042_____________ ~~~Mq/M2/d % p.g/m /d pag!m 2/d jgm/d /aI2 d pglm2 d (2)
Plo6e -Terminal along 6,13 93 37 40 7,306 0,0306 5265,9 610,96 56 60 7,44 20,73 9,93the runway I I I_I_ITech. Establ. 6,10 121 56 46 8,777 0,1373 7348,4 494,3 65 54 10,45 19,65 8,21Medical 6,25 219 120 55 11,004 0,1350 5745,5 790,22 99 45 15,22 24,62 18,03Weather 5,99 103 51 50 6.086 0,0589 4979,9 627,81 52 50 8,50 10,37 2,85Station
I__ _ __ _ _ _
Public Utility 5,74 74 22 30 5,364 0,330 6645,00 462,60 52 70 7,08 16,85 2,80Co. "lzvor"_ _ _ _ _ _ _ _ _ _ _ _ _
Limit values(Official 350 100 2 2Gazette 133/05) l
(1) Thallium concentration at all measuring station were lower than 1.071 jig/I (instrument detection limit)
Chapter 3, Page 21 / 31

EA and EMP for New Cargo Bulk Terminal at the Port of Ploce EKONERG d.o.o.
Table 3.4-3: Test results of total deposit matter (December 2005)
Total Insoluble matter Soluble matterMEASURING depositedSTATION matter Total Insoluble Pb Cd TI (1) Al Fe Total Soluble
mg/m2 /d insoluble matters M2 Pg/M2 Pg/M2 soluble matters Cat2 Cir so42
_________mg/m2/d % pglm2ld lag/m 2Id pgm/d ~gm/d /.gI2 d (2)
Plo6e -Terminal 6,33 194 63 32 10,945 0,0790 11311 1055,07 131 68 19,23 49,88 28,50runway . .Tech. Establ. 3,67 104 61 59 14,257 0.1517 10673,5 992,87 43 41 19,65 25,49 17,20Medical 6,43 183 72 39 18,472 0,1743 11103,0 1110,86 111 61 28,20 42,08 33,78C e n tre I_ _ _ _ _ _ _ _ _ _ _ _ _ _ _ _ _ _ _ _ _ _ _ _ _ _ _ _ _ _ _ _ _Weather 6,41 129 47 36 20,068. 0,1057 11036,9 1118,80 82 64 18,60 32,35 23,80Station
_ _ _ _ _ _ _ _ _ _ _ _ _ _ _ _ _
Public Utility 6,30 145 37 26 25,271 0,0975 9630,5 887,93 52 70 14,27 30,7 21,5C o. "lzvor' _ _ _ _ _ _ _ __ _ _ _ _ _ _ _ _ _Limit values(Official 350 100 2 2Gazette 133/05) _ I(1) Thallium concentration at all measuring station were lower than 1.071 pg/l (instrument detection limit)
Chapter 3, Page 22/ 31

EA and EMP for New Cargo Bulk Terminal at the Port of Ploce EKONERG d.o.o.
3.5. CHARACTERISTICS OF MARINE SEDIMENT
3.5.1. GEOTEHNICAL CHARACTERISTICS
All together 28 off boreholes have been made for construction of the project, on the mainlandand in the sea, and at the Vlaska Channel location. A synthesis of the results from all theboreholes at the berth location and the bulk cargo storage area is illustrated by a trial boreholeon Figure 3-11, and at the Vlaska Channel location on Figure 3-12.
It is obvious that it is a question of small size material (sand and silt) and that 60-90 percent ofparticulates smaller than 0.1 mm, and 10-45 percent of particulates is smaller than 0.01 mm.
t O,00 (2 200 m)
sand, silt-like (SM), loose to medium compactness
5-22 AH= 5-22 m5-9
silt, sandy (ML), medium consistency
18-21 AH= 9014 m5-22 ,-X
/Z clay (CLICH), medium c-onsistency
2/ AH= 13-26 m/<,- silt-like sandy to sandy-silt-like material (ML/SM),
33,5-36 " solid consistency to medium compactnessJ7-39 ru AH= 2-5 m
385-39 5 clay (CH/OH), soft consistency -H=0-1,5m38,5-39,5 :
U '11gravel (GP/GM), very good compactness
52-55 '<cJ H= 13-235m52-55 / 3,,z% clay (CH), medium consistency
60-62 / AH= 6-9 m60-62 :.c G
k- gAiavel (GP/GM), very good compactness
6 8 - - - - - - - - - - - - - - - -
KEY:5-9- starting depth of layer spreading
WH= 9-14 m layer thickness
18-21- . ending depth of layer spreading
Figure 3-11 A trial borehole for the berth location with a bulk cargo storage
Chapter 3, Page 23/ 31
-I
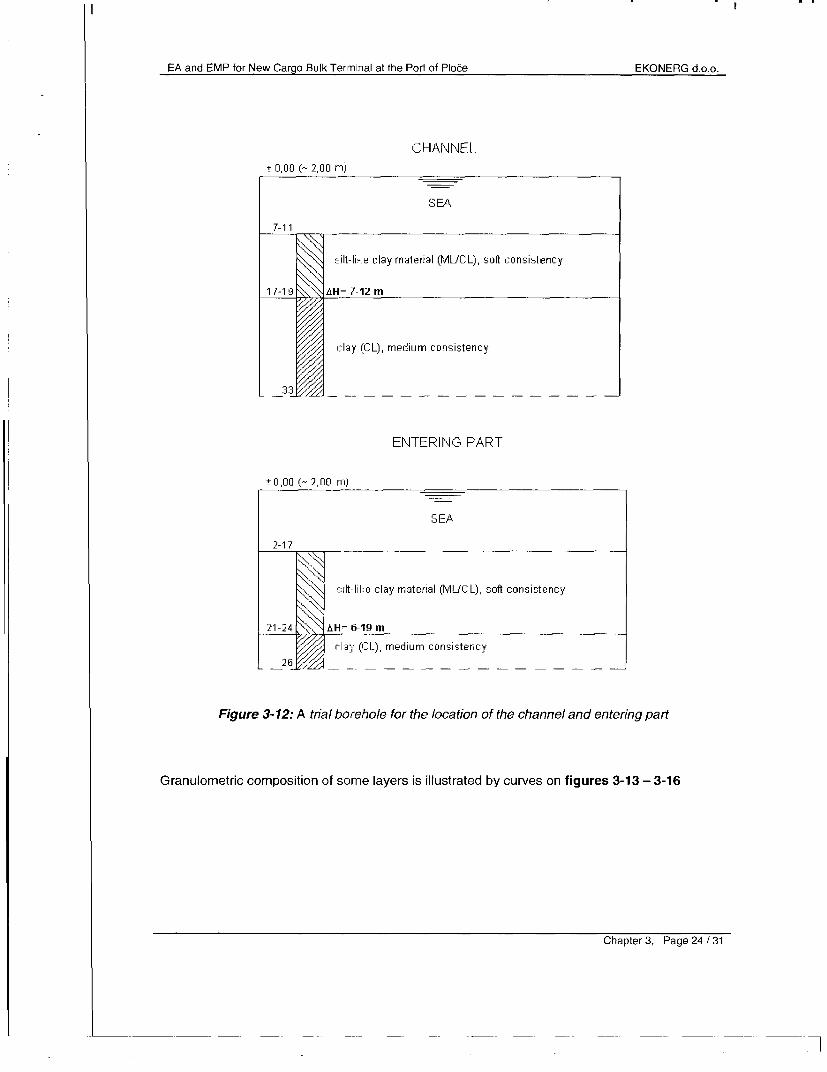
EA and EMP for New Cargo Bulk Terminal at the Port of Plo6e EKONERG d.o.o.
CHANNEL+ 0,00 ( 2, 00 rri)
SEA
7-11
silt-like clay material (MUCL), soft consistency
17-19 AH= 7-12 m
clay (CL), medium consistency
ENTERING PART
+0,00 (2,00 m)
SEA
2-17
silt-like clay material (MUCL), soft consistency
21-24 AH= 6-19 mClay (C>L), medium consistency
Figure 3-12: A trial borehole for the location of the channel and entering part
Granulometric composition of some layers is illustrated by curves on figures 3-13 - 3-16
Chapter 3, Page 24/ 31

EA and EMP for New Cargo Bulk Terminal at the Port of Plo6e EKONERG d.o.o.
2'ROCK :2 :GRAVEL ISANGD : SILT CLAY
Ito ~~~~~~~. - -, -~~~~- 77
so
A' r r - - - r r , ,
10~~~~~~~~~~~~~~~~~~~I.
a!~~~~~~~ra
C~~~~~~~~~~~~~~~~~~hpe ,Pg 5/3

m
Cb ~~~~~~~~~~~~~~mpassing percentage, %
g a s S s l; us s s
* * -i 1-------; --- -
'S, k i 011 k i - C)
(2 _t- O
X~~~ m
----- - --- - -------- -- - -- -- --- - - - - - --- - --- --
S ~ ~ ~ ~ ~ ~ ~ ~ ~~~ ~---- --- -
----- ------------ ~~- -
(D~~~~~~~~~~~~~~~~~~~~~~~ (D
au X~~~ 2~~~~- - - ---- ------ - - -- - - -- -- -- - - - - - - - - - -- - -0'
V - - - - -D--- -- - -- -- -- -
CD~~~~~~~~~~~~~~~~~~~~~(2 ~ ~ ~ ~ ------- 1 __- - - ----- - -- -- --- ------ -----
z. s~~~~~~~~~~~~~~C-)~~~~~~~~~~~~~~~~~~~~~~~~~~~~C
CD Sb~~~~~~~~~~~~~~~~~- S
N) PD~~~~~~~~~~~2

EA and EMP for New Cargo Bulk Terminal at the Port of Ploce EKONERG d.o.o.
ROCK GRAVEL SAND SILT ' CLAY
71
HI!iii I II I I I lii,il I lI!ii1l I li 111 1 i 1111111 i,, Ill II 11111 1111 I ll, ll Ill I 11111 IllI l111 li I
4.
I 1 111 I 11 I 11211 1 I Ill I , , ll r 111 I,, 111 I 1111 1 11 I1111I 111 1 1 11 I 111I 11 1111 1 1 I 111 II 1111,111 1 I 1 111 1,
.11111 11 1 ll I I I ,,, ,,.,11111 111111 I II I IIII I 1111 11 11 1 11111111~~ I 111 I I i 111 11111 I i1111, , i 111 1 ,, I ,i
11111 I 1111,, I 1 l ,,,1111 2111 I111 I 111121 ll I 1 1 1111 111111 I
111111 I 1111 , II III11 111111 II, I Ill11 I 1111111 21111111,
111111 1 'lII I . 811111.. 1| I I 11 '''1111 1.111 I 11111 1 11 1 11 1 1
1111111 I III Ill I l 111 I 1111 Ill I ll Il I 1111 11111111111111 I 111I1\11 111 1111111ll '' I 111 I 1 I 1111111' 1111 111 I
Cl 1111 1 , 1 ' ' 111 I11l 11111 11 I 11 I' l
46
30
1UV.ooOo IW0(0 '.o.oooo -o,0oo i0oirno O,O1(o O010 goegoiparticle size, rrn
Figure 3-15:- A layer of gravel material at the locations of berth and storage areas
Chapter 3, Page, 27 /31

EA and EMP for New Cargo Bulk Terminiral at the Port of Plode EKONERG d.o.o.
i!~~ IZOCK GRAVEL SAND SILT CLAY
so0 -- 4 -L
70
CL
1 0~
20~~~~~.
* I
particho size.,ru
Figure 3-16: A surface layer of sandy and silt-like materials at the location of the channel andentering part
Based on the explorations made, the composition of some soii layers at the project location is:
* Channel and entering part location- surface layer made of silt-like and clay material:
clay 0 -18 %silt 52 -67 %sand 15 -46 %gravel 0 -2 %
* Berth location and bulk cargo storage areas:- a surface layer of sandy and silt-like materials: clay 2 - 8 %
silt 5 -44 %sand 48 -87 %g ravel 0 -5 %
- a layer of silt-like sandy material: clay 3 - 10 %silt 71 -80 %sand 10 -29 %
- a layer of gravel material: silt 2 - 16 %sand 4 -24 %g ravel 60 -86 %rock 0 -8 %
Chapter 3, Page 28/ 31

EA and EMP for New Cargo Bulk Terminal at the Port of Ploce EKONERG d.o.o.
3.5.2. CHEMICAL ANALYSIS OF SEDIMENT SAMPLES
The sea sediment is a sensitive indicator for monitoring of sea environment pollution andpresents the main "dump " of steady toxic substances released into the sea environment fromdifferent sources. Here are the vestigial elements that become accumulated in the sediment,and may come from urban and industrial effluents, precipitation waters, sedimenting from theatmosphere, etc.
Sediment samples have been taken on two places on the sea bottom. One sample is takenclose to the CBT at 10 m depth, and the other at 20 m depth at a distance of some 800 metrestowards the high sea (Figure 3-17). Samples have been divided to 5 parts: 0-5cm, 5-10 cm, 10-15 cm, 15-20 cm and 20 - 25 cm) and have been adequately processed and subject to chemicalanalysis in a certified laboratory (ACME - Analytical Laboratories Ltd., 852 Eest Hastings, St.Vancouver British Columbia, Canada). Forty one (41) off elements have been identified in thesamples. Table 3.5-1 shows the results for the main elements.
The results are within the limits for fully clean areas taking into account local natural conditions.
Table 3.5-1: Chemical composition of sediment (main elements)ELEMENT Mo Cu Pb Zn Ni Co Mn As Cd Ca P CrSAMPLES ppm ppm pp ppm ppm ppm ppm ppm ppm % % ppm1Om 5cm 0.6 20.5 21.1 71 41.2 10.7 507 14 0.3 11.7 0.054 59.61Om 10cm 1 19.4 21.3 72 38.8 10 515 13 0.2 11.56 0.053 59.71 Om 15cm 0.7 17.9 20.4 71 36.7 9.6 487 14 0.3 12.93 0.056 57.81 Om 20cm 0.8 14.4 17 60 31.6 8.7 472 11 0.1 12.54 0.049 50.81Om 25cm 0.8 14 16.1 60 30.6 9 453 9 0.2 12.6 0.046 47.820m 5cm 1.1 24.5 25.2 81 44.1 10.7 459 13 0.4 16.52 0.053 5720m 5cm R 1.3 27.8 26.6 88 49.1 12.7 439 15 0.5 15.9 0.056 61.620m 15cm 1.6 27.1 26.9 87 45.3 13.2 520 14 0.4 16.21 0.052 59.220m 25cm 1.4 25.4 27.6 89 48.3 13 524 13 0.4 17.03 0.055 53.220m 25cm R 1.5 29 30 94 50.7 12.3 515 15 0.4 17.06 0.057 57.7
Chapter 3, Page 29 /31

EA and EMP for New Cargo Bulk Terminal at the Port of Ploce EKONERG d.o.o.
N < -i- ?;ri;/ G u m a n ac-
21 12!~~~~i j.; -I,......... i! --------- ' -
28 X i .1 $ ¢ . -ix . A~~~~~ / 21 I -o= iil-
--7
0 17 } p#. iMANiAc | 1 - 5 Vlaska Channel (10 m depth)
_,_ _;__*__ _ _ ,,
'; ~ ,* e. teS . '- -. ,. ;O'
23 6- 10 Referent point (20 m depth)
X ! ~~~~~~~~ ~- *.049 >14~~~~~~~~~~~~~~~~~~~~~
200 0 200 400 600 '¢/letefsS~~~~~~~~ ~ ._ --- I ,. fG> '*}4
Figure 3-17: Location of sediment sampling
Chapter 3, Page 30 /31

.,c 3un w -]S4-L
/+h -- ,..a=: oMu < ,
¢ -> /a n -- O -u, "^,.,
v f fi " k . 1 V E 383 N V 113d jO B 3 W a3 1 3 3 1 0 8d~~"w i " W I -
a d sq e u ~ g ^ &N UI I sI p j * ; ...... ..
N t I I t t I * t ( t I t t [ t | l l l 1*i
41 VA.i3&iN vLVaa JO SV3HV UC3L31OHId
eAe)&kA~
VA *~~~~~~~~~~~~~~~~~~~~~~~~~~~~~~V
I I I I I I I I I I~~~~~~~~~OUOO

KyAe~~~~~~
41 _ _ ,I-m _-,, -- ,_4 ~. '.- ol -L )6 ui1 ,w
I t:.,w, g C: @ , , i " ' rise 0 0 - ) g~~~~~~
i ' '^ l 1~~~~~4 1 ., 3 -- ----__ 7l+
; - -- i - ~~~~~~~~~JF7 PARt |- =I .LA
:0, ,t,, I ' -- - wC g,.._ _,,
t ^-;;-> - iF -e°r-- i_--=-, 76.-,'7s- ' -----,.,,,6A
^ ' 2; ~~~~~We Nerer i*; D -
MEASURING STATIONS:1. Public Utility Company2. Weather Station3. Medical Centre4. People's Open Teaching Establishment5. Terminal - near the runway
|FIGURE 3-1 0|

Map of natural values
a ts zf At I' ' imotn
, i , ,Ae- ..
I and threatenedorganis ms
SI 32
! - I ___________
. I w~~~~~~~~~~~~~
- . FT -X;. 1 - I, ' .'maieNomuite
_ < ! ~~~~~~~~ - ~~andtreatofnimportant sm
.~~~~~~~~~~~~~~~~~~ rawt rtce, rar
Floure 3-2

EA and EMP for New Cargo Bulk Terminal at the Port of Ploce EKONERG d.o.o.
4. MAIN ENVIRONMENTAL IMPACTS
During environmental assessmenit analysis following impacts can be considered: impact on theair, ground, water, plants and wildlife, noise impact, influence of the Project on landscape,waste generation, environmental accidents and whether the realisation of the Project demandsa change of purpose of certain elements in space.
The possible environment impacts can in terms of time be divided into the influence duringProject construction, during its usage and after.
After screening and scoping process as the part of EIA process for the planned project (newcargo bulk terminal) it was assessed that possible significant environmental impacts arefollowing:
During Project construction (Chapter 4.1):Impact on marine communitiesNoise impactImpact on ornithofaunaWaste
During Project usage (Chapter 4.2):Impact on the airNoise impactImpact on sea and marine communitiesImpact on ornithofaunaWasteAccidents
The end of Project usage has not been predicted, however, if it comes to that, theenvironmental impacts and environmental protection measures shall be regulated by the specialsurvey within preparatory activities for the end and / or the removal of the Project.
Chapter 4, Page 1 /50

EA and EMP for New Cargo Bulk Terminal at the Port of Plo6e EKONERG d.o.o.
4.1. IMPACTS DURING PROJECT CONSTRUCTION
4.1.1. MARINE COMMUNITIES
Impacts on the sea i.e. marine communities of the bulk cargo terminal in Ploce Port can berelatively well assessed according to technical documentation made by Tebodin (Chapter 7).
The largest impact on marine communities during the construction is excavation/deepening ofaccess channel to the CBT berth and Vlaska Channel. Rising of sediment and increasedsedimentation of particles on the both sides of construction works will occur during this stage.
Due to shallow sea and large inflow of fresh water from the Bacinska Lakes, the Neretva Riverand other smaller sources most of the colloid particles will be kept in an upper layer with smallerdensity. Because of that dispersion of particles will be large and their sedimentation will occur ina large area thus with smaller amounts per area unit. Larger impacts on marine communitieswill appear only in the relatively small area near construction works. Any impact in areas moredistant than 400 m in all direction is not expected (see Figure 4.1.1-1)
Impacts in the excavation area, approximately 20 ha, is high because the upper layer ofsediment with all benthic organisms will be removed. Sedimentation of material will havenegative impact on benthic organisms only for a short period because they will return to thesediment surface. It can be assumed that the major negative impact will be on organisms whichlive on the sea bed and cannot move, e.g. sea grass from genus Posedonia and algae.
Due to construction of the Zone 2 of the terminal a part of the sea bed will be covered i.e.biologically important area with protected bivalve Pinna nobilis' and the sea grass will disappear(Figure 3-2). This is an important negative effect of the project. Although negative, the impact isof limited range and these organisms are present in near surroundings. Moreover, due to theuse of Zone 4 for disposal of dredged material some biologically significant localities will bedestroyed.
The negative impact on the mariculture in the Malostonski Bay is not expected because thearea is distant, sea currents in the area of the port are directed in the opposite direction andlarge amount of sediment is continuously been brought by the Neretva River.
During diving survey no living organisms but only shells' remains of this taxa have been found.
Chapter 4, Page 2 / 50

EA and EMP for New Cargo Bulk Terminal at the Port of Ploce EKONERG d.o.o.
FIGURE4.1.1.-1
Chapter 4, Page 3/50

EA and EMP for New Cargo Bulk Terminal at the Port of Ploce EKONERG d.o.o.
4.1.2. NOISE IMPACT
Because of special characteristics of some sources and their environmental impact, the noiseimpact during the CBT construction will be considered through three project phases:
- deepening and broadening of access channel to the CBT berth and to Vlaska Channel- construction works on the coast and its skirting part- berth construction - piling
The reason for the split up is some noise sources in air generating the noise also in water/sea.
4.1.2.1. Noise Sources
Since at this stage the design company does not provide noise levels for construction and othermachinery, it is necessary to determine them approximately according to technical studies andanalyses. At the same time, emission levels of noise to air will also be identified including theirpossible impact on underwater noise for water/sea.
At this design stage the dredging technology and equipment have not been chosen yet due topossible problems with on shore material settlement. Mechanical and hydraulically dredging arebeing considered as two possible solutions. Equipement used for hydraulically dredging isaccording to the measurements from DGMR experts producing higher noise emission levelsand thus will be used for assessing noise impact as the worst case scenario.
4.1.2.1.1. Deepening and broadening of access channel to the CBT berthand to Vlaska Channel
To make the access channel to the CBT berth and to Vlaska Channel deeper, the so-called"Trailing suction hopper dredger" was selected (hereinafter referred to as TSDH). Since it is aquestion a special-purpose ship, it is obvious that she generates emissions to water/sea. Noisegenerated by TSHD, later in the document considered as one source, comes from severaldifferent components. Primary components are divided according to the environment to whichthey emit noise:
1 Noise in water:. suction pipe. operating propeller. generators. gearbox. pumps
2 Noise in air:. ship's engine. generators. ventilation systems. pumps
Chapter 4, Page 4/ 50

EA and EMP for New Cargo Bulk Terminal at the Port of Ploce EKONERG d.o.o.
There are also other components that are other individual sources of noise such as the noisecaused by water circulation around the ship hull, etc. However, they will not be discussed indetail because, as already mentioned, the ship (TSHD) will be considered as one source.
Since no specific type of TSHD has been mentioned in the technical study, or her emissionlevels, we used in the study the emission level generated by TSHD Taccola (Langworthy 2004,An Assessment of the Underwater Noise Radiated by the Dredger Taccola, Report No. 614 R0205). The capacity of TSHD Taccola is 4400 m3, and the one foreseen by the technicalanalysis 5000 m3 . They are both categorized as medium size TSHDs. Since the split up withinthe group is made according to the capacity, the ship selected could be consideredrepresentative. Figure 4.1.2-1 illustrates underwater noise level per 1/3 octave radiated byTSHD Taccola to water/sea. Table 4.1.2-1 contains the sound characteristics of TSHD Taccolafor water.
aoo IS --- .
m 180
140 -
Frequency [Hz]
Figure 4.1.2-1: Underwater noise emission level per 1/3 octave TSHD - a Taccola duringoperation (at 1 m and at 1 pPa).
Table 4.1.2-1 Sound characteristics of TSHD Taccola for waterNoise Source I63 Sound power per octaves, dB(1 pPa) Lw
|63 1125 |250 00 I1 k I2k I 4k I 8k dB(lpPa)TSHDTaccola 161 161 | 157 157 | 157 | 160 | 168 | 161 180.4
Total sound level radiated by TSHD to sea/water is 180.4 dB (1pPa). Since there are nomeasurements of the sound level radiated to air, they will be calculated approximately fromthose for water. They are obtained for air by deducting 62 dB from those for water. In air, thereference level of sound pressure is 20 pPa, whereas in water it is 1 pPa. Consequently thedifference is 26 dB; dB = 20 log (20/lpPa) = 20 log (20) = + 26 dB, and the remaining 36 dB ofdifference results from the sound impedance of water being 3600 times higher than the soundimpedance of air; 10 log (3600) = 36 dB, which gives total difference of 62 dB. The sound
Chapter 4, Page 5 /50

EA and EMP for New Cargo Bulk Terminal at the Port of Ploce EKONERG d.o.o.
impedance is a product of multiplication of media density and sound velocity in it. Thus, we getA - evaluated sound characteristic of TSHD Taccola for air (Table 4.1.2-2).
Table 4.1.2-2 Sound characteristics of TSHD Taccola for air (A evaluated)Noise Source Sound power per octaves, dB(A) Lw
I63I125 250 500 1 k 2k 4k 8kTSHD Taccola 72.8 82.9 86.4 91.8 95 99.2 107 100.1 108.7
In the study made by Basssett Acoustics addressing underwater excavation in the port ofMelbourne (Report No. AA0172/DC/EO1) there are empirical data according to which themaximum sound level for TSHD, irrespective of her size and manufacturer is 123 dB(A). Thestudy also states the data on usual and more likely intensity of 116 dB(A). Since the calculationresult for that particular TSHD Taccolla, of almost the same size as selected for the Port ofPloce Project, was 109 dB(A), the sound level of 116 dB(A) could be considered representative.In other words, it will be used for modelling as the worst possible case. Total of 116 dB(A) isobtained if 7 dB is added to each octave thus maintaining the spectra and increasing theintensity.
4.1.2.1.2. Construction Works on the coast and its skirting part
They include:1. Filling the coast skirting part by stones for erosion protection2. Filling to enlarge the coast3. Stripping of existing soil to the level of -1.5 m from design zero (+3 m from the sea level)4. Installation of drainage pipes5. Filling the terminal area by stone from the location of future highway Split-Dubrovnik6. Piling7. Other civil works
There are a number of studies addressing the noise impact on building sites and thesurrounding area so there are well developed databases on noise emission levels for somemachines. Because of that, not every source will be described separately but only its soundcharacteristics will be given. Noise occurring at this stage is the highest at the beginning of theworks, site preparation. Table 4.1.2-3 reviews the noise emission level by octaves for heavy-duty construction machines used at the begging stage. Later on, this situation will be modelledas the worst possible case. Data have been taken from DEFRA, Update of Noise Database forPrediction of Noise on Construction and Open Sites 2005. A simplified recalculation of noiselevels from 10 metres to 1 metre has been annulled by selecting a machine stronger thannecessary. Noise emission levels for the dumper and for the loader have been taken from theDGMR database (ALARA/BAT).
Chapter 4, Page 6/50
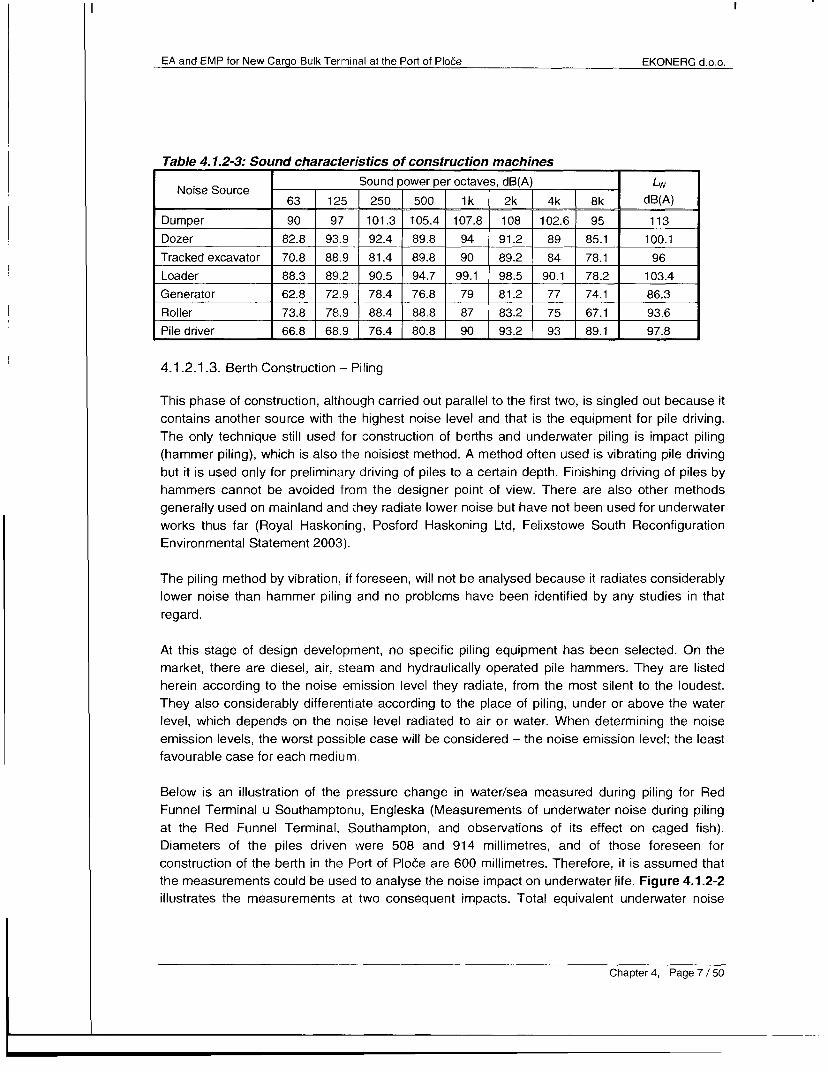
EA and EMP for New Cargo Bulk Terminal at the Port of Ploce EKONERG d.o.o.
Table 4.1.2-3: Sound characteristics of construction machinesNoise_ Source Sound power per octaves, dB(A) | LwNoise Source 63 1 l
63 125 250 500 1 k 2k 4k 8k dB(A)Dumper 90 97 101.3 105.4 107.8 108 102.6 95 113Dozer 82.8 93.9 92.4 89.8 94 91.2 89 85.1 100.1Tracked excavator 70.8 88.9 81.4 89.8 90 89.2 84 78.1 96Loader 88.3 89.2 90.5 94.7 99.1 98.5 90.1 78.2 103.4Generator 62.8 72.9 78.4 76.8 79 81.2 77 74.1 86.3Roller 73.8 78.9 88.4 88.8 87 83.2 75 67.1 93.6Pile driver 66.8 68.9 76.4 80.8 90 93.2 93 89.1 97.8
4.1.2.1.3. Berth Construction - Piling
This phase of construction, although carried out parallel to the first two, is singled out because itcontains another source with the highest noise level and that is the equipment for pile driving.The only technique still used for construction of berths and underwater piling is impact piling(hammer piling), which is also the noisiest method. A method often used is vibrating pile drivingbut it is used only for preliminary driving of piles to a certain depth. Finishing driving of piles byhammers cannot be avoided from the designer point of view. There are also other methodsgenerally used on mainland and they radiate lower noise but have not been used for underwaterworks thus far (Royal Haskoning, Posford Haskoning Ltd, Felixstowe South ReconfigurationEnvironmental Statement 2003).
The piling method by vibration, if foreseen, will not be analysed because it radiates considerablylower noise than hammer piling and no problems have been identified by any studies in thatregard.
At this stage of design development, no specific piling equipment has been selected. On themarket, there are diesel, air, steam and hydraulically operated pile hammers. They are listedherein according to the noise emission level they radiate, from the most silent to the loudest.They also considerably differentiate according to the place of piling, under or above the waterlevel, which depends on the noise level radiated to air or water. When determining the noiseemission levels, the worst possible case will be considered - the noise emission level; the leastfavourable case for each medium.
Below is an illustration of the pressure change in water/sea measured during piling for RedFunnel Terminal u Southamptonu, Engleska (Measurements of underwater noise during pilingat the Red Funnel Terminal, Southampton, and observations of its effect on caged fish).Diameters of the piles driven were 508 and 914 millimetres, and of those foreseen forconstruction of the berth in the Port of Ploce are 600 millimetres. Therefore, it is assumed thatthe measurements could be used to analyse the noise impact on underwater life. Figure 4.1.2-2illustrates the measurements at two consequent impacts. Total equivalent underwater noise
Chapter 4, Page 7 /50

A,I>3EUF L. EIal -h3F cri I:f F I,E :A\:K i2.
II i3 iU ~4 If C. 5 dIr3 r mxI 1 i KtI L 1 ;) Ii[tcIr-
A I If i:3 133 i cr f c E to IF (I II E kc r .330.0 or Ii: IE V ~A. F c i ii-ig r1 i p. I ?s 3 )
I' E~~~U I: I, i l v- :i r~~~~~~~~~) E;~ I) -E III: I l -A t s (T, e 1
1-1 ) Ft Arir , c ~it. :p,j i Ii. CI:I[¶w? 103
I .1, E rn r .3 3_~I 5
II~~~~~~~
:iljlJrEIk1. 4.1.2 -2 G I;- I I'l rij I ir i )r?3 ir, ( rinicl 1VIF;I u Ev r cnicr t[IIrIi Irilaro ,ct rFIiII ii%i
I.. .2. A cisa i 1i lii tier
Stll()II I t3~1 Jad oi) :;(i amiic' TJB -i..c to ini Ip 1Jc f 33) st)-n I arid ~b1 OIII f Ic FaLctoDrs
ilo e airq toierrajertar 2 r; ic,3~si h o)sE hly e iE
* :3a l mfi,lit )i c 13 Nefti r 03~r (E
- i,Ict r ~q. icCe~i
Soon: lrmi;no:v~~~~~~~~~~~~~~~~~~~~~~~~~~C PEr 1:Ie3 ~
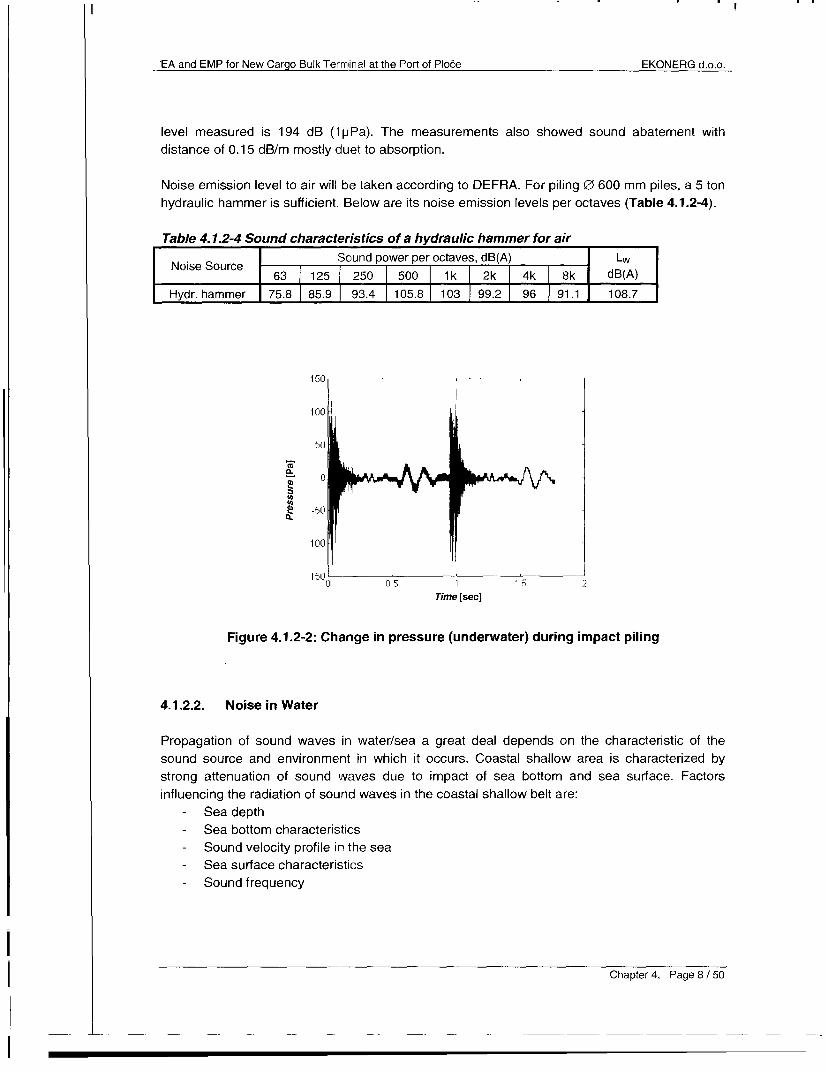
EA and EMP for New Cargo Bulk Terminal at the Port of Ploce EKONERG d.o.o.
level measured is 194 dB (1pPa). The measurements also showed sound abatement withdistance of 0.15 dB/m mostly duet to absorption.
Noise emission level to air will be taken according to DEFRA. For piling 0 600 mm piles, a 5 tonhydraulic hammer is sufficient. Below are its noise emission levels per octaves (Table 4.1.2-4).
Table 4.1.2-4 Sound characteristics of a hydraulic hammer for airNoise Source I 63 I 125 Sound power per octaves, dB(A) LwNoise ource 63 |125 |250 |500 | 1k |2k |4k |8k dB(A)Hydr. hammer 75.8 85.9 93.4 105.8 103 99.2 96 91.1 108.7
150
100
0.
10
1500 10 Q ns 1 15 2Time [sec]
Figure 4.1.2-2: Change in pressure (underwater) during impact piling
4.1.2.2. Noise in Water
Propagation of sound waves in water/sea a great deal depends on the characteristic of thesound source and environment in which it occurs. Coastal shallow area is characterized bystrong attenuation of sound waves due to impact of sea bottom and sea surface. Factorsinfluencing the radiation of sound waves in the coastal shallow belt are:
- Sea depth- Sea bottom characteristics- Sound velocity profile in the sea- Sea surface characteristics- Sound frequency
Chapter 4, Page 8/ 50

EA and EMP for New Cargo Bulk Terminal at the Port of Ploce EKONERG d.o.o.
The reason for the sea bottom surface and sea surface have higher impact on propagation ofsound waves in shallow sea than in deep sea is more frequent reflection of sound wavesagainst those surfaces, whereas in deep sea the sound wave can travel at much larger distancebefore getting in contact with one of those surfaces. Hard sea bottoms e.g. those made mostlyor fully of rocks, reflects more energy of sound wave that hit it back to sea than soft sea bottomse.g. muddy sea bottom. Consequently, we get better propagation of sound waves at largerdistances in shallow belts with harder than with soft bottom. The situation in shallow belts iseven more complex in case of low frequency sounds usual for industrial activities. In that case,there are conditions that can result in good or bad sound conductivity that could be forecast bycomplex numerical models only.
Theoretically, it is difficult to assume sound propagation in shallow coastal belt. Sometimes, thecalculations are made with cylindrical and sometimes with spherical divergence. Each methodgives better results at a certain distant area and a certain location.
British Petrol (BP) conducted a series of geological investigations on the south-east of Englandin a underwater area similar to that around Ploce (An Investigation Of Underwater SoundPropagation In Shallow Coastal Waters, by J. R. Nedwell (Subacoustech Ltd.), K. Needham(Subacoustech Ltd), A. W H. Turnpenny (Fawley Aquatic Research Laboratories Ltd.) and R. M.H. Seaby (Fawley Aquatic Research Laboratories Ltd.)). The Port of Poole Bay, situated at theriver mouth has an average sea depth between 5 and 20 metres and shallow sea depth of 1 to5 metres. The sea bottom is sandy with gradual increase in depth. By mathematical calculationand calculation modelling for theoretically ideal sea surface, expected attenuation of sound ofsome 40log(R) was obtained, but actual measurements during rough sea showed soundattenuation between 21log(R) and 261og(R). Since underwater noise sources have the highestintensity at low frequencies similar to those used by so called "airgun" for geologicalinvestigations, the results of that investigation could be used for predicting sound propagationattenuation in water.
4.1.2.2.1. Dredging of access channel to the CBT berth and to the Vlaska Channel
For assumed noise emission level of 180.4 dB (1pPa), below are the ground level emissionsdepending on the source distance (Figure 4.1.2-3).
Dredging200180160140 _
* 120 -- 21iog(R)~* 100
O j - ~~~~~~~~~~~~~~~26 og(R)*~806040
a20 20
Distance from the source [m]
Figure 4.1.2-3: Ground level emission of noise at different distances during dredging
Chapter 4, Page 9/ 50
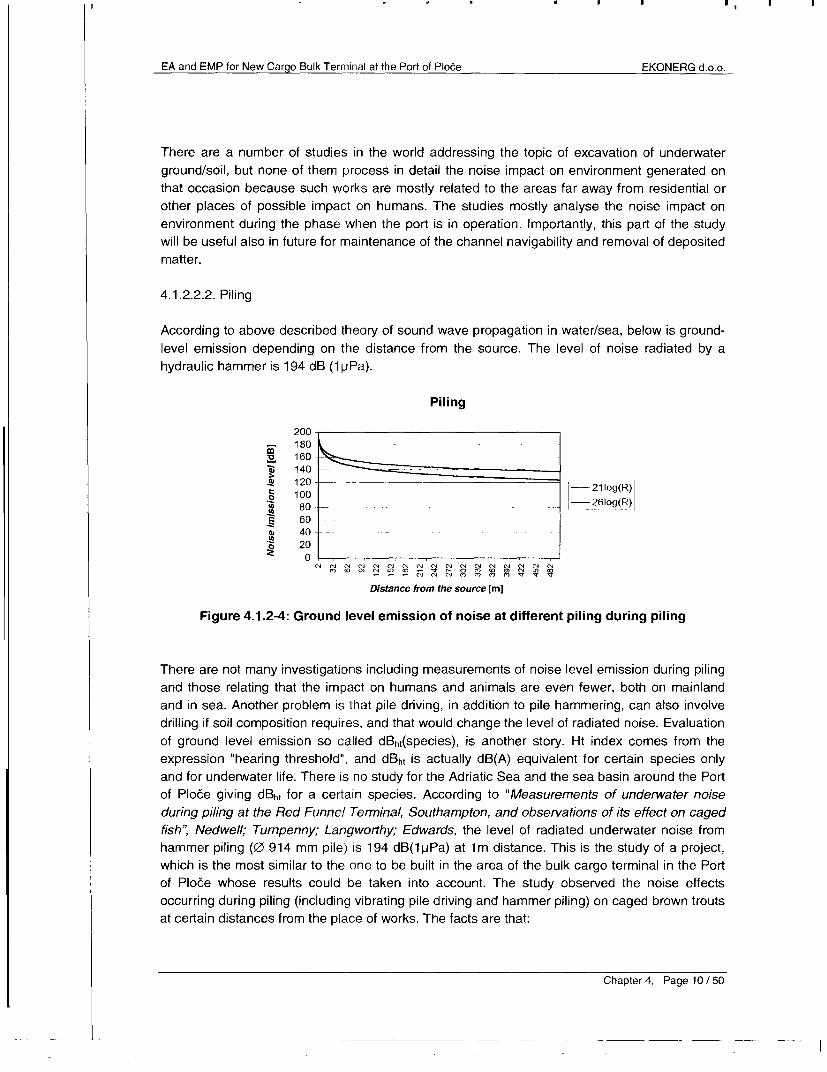
EA and EMP for New Cargo Bulk Terminal at the Port of Plo6e EKONERG d.o.o.
There are a number of studies in the world addressing the topic of excavation of underwaterground/soil, but none of them process in detail the noise impact on environment generated onthat occasion because such works are mostly related to the areas far away from residential orother places of possible impact on humans. The studies mostly analyse the noise impact onenvironment during the phase when the port is in operation. Importantly, this part of the studywill be useful also in future for maintenance of the channel navigability and removal of depositedmatter.
4.1.2.2.2. Piling
According to above described theory of sound wave propagation in water/sea, below is ground-level emission depending on the distance from the source. The level of noise radiated by ahydraulic hammer is 194 dB (1pPa).
Piling
200180
2. 160X 140 .aS 120 -21 log(R)
100 -21gR
E 80-- -261og(R)60
o 40G 20
04 N'4 N N ~1N N N N N NNNNNNNeN N 4 04 (N 10J tl:) ( 'tJ (NJ ON (N (N 0 (> N U 0) (0
Distance from the source [m]
Figure 4.1.2-4: Ground level emission of noise at different piling during piling
There are not many investigations including measurements of noise level emission during pilingand those relating that the impact on humans and animals are even fewer, both on mainlandand in sea. Another problem is that pile driving, in addition to pile hammering, can also involvedrilling if soil composition requires, and that would change the level of radiated noise. Evaluationof ground level emission so called dBht(species), is another story. Ht index comes from theexpression "hearing threshold", and dBht is actually dB(A) equivalent for certain species onlyand for underwater life. There is no study for the Adriatic Sea and the sea basin around the Portof Ploce giving dBht for a certain species. According to "Measurements of underwater noiseduring piling at the Red Funnel Terminal, Southampton, and observations of its effect on cagedfish" Nedwell; Turnpenny; Langworthy; Edwards, the level of radiated underwater noise fromhammer piling (0 914 mm pile) is 194 dB(lpPa) at lm distance. This is the study of a project,which is the most similar to the one to be built in the area of the bulk cargo terminal in the Portof Plo6e whose results could be taken into account. The study observed the noise effectsoccurring during piling (including vibrating pile driving and hammer piling) on caged brown troutsat certain distances from the place of works. The facts are that:
Chapter 4, Page 10/ 50

EA and EMP for New Cargo Bulk Terminal at the Port of Ploce EKONERG d.o.o.
4.1.2.3. Noise through Air
Although the sources during construction were described separately, especially because ofthem radiate noise also in water/sea, their effect on noise in air will be monitoredsimultaneously. The worst possible situation with minimum construction time will be modelled.In addition to the noise chart for the case described, also the noise along the truck route fordelivery of filling stones will be analysed.
4.1.2.3.1. Noise from the terminal building site
The calculation does not take into account meteorological correction. A coefficient of soilabsorption is 0 (zero) and land is assumed completely flat. The calculation parameters of soundattenuation due to air absorptions are:- temperature 200C- pressure 101.33 kPa- humidity 60%
The situation was modelled according to ISO (described in document ISO 9613-2) andaccording to Netherlands method described further bellow. Noise chart for ISO model is givenon Figure 4.1.2-5.
Chapter 4, Page 12/ 50

EA and EMP for New Cargo Bulk Terminal at the Port of Plo6e EKONERG d.o.o.
~O00000500d0(A)I ~ ~ ~~~~~~I 45 00 - 00dB(A)
-. - ~~~~~~~~~~~~~~~ ~~50.00 -53(00 AurAlT*1l ;i < . = 4 6_0dB AA
=- _' - CS 'Tad-l A)th
'r -Yz ~ ~ ~ ~ ~ .
0-w
'-.
Figure 4.1.2-5 The worst possible case (ISO method)
Chapter 4, Page 13 /50

EA and EMP for New Cargo Bulk Terininal at the Port of Ploce EKONERG d.o.o.
The Netherlands' method is here only used for comparison so it can be sure that the modellingwas done correctly. This is expected to be true because the two methods have differentapproaches. According to Netherlands' method, noise emission level per square meter for aconstruction site is 65 dB(A)/m2 and terminal area of 235 000 square meters gives total amountof 118.7 dB(A). The nearest dwelling location marked as Lokacija 1 from picture will be used asa reference point for result comparison (noise monitoring program during construction, seeEMP). To determine the noise imission at this location using Netherlands' method the terminalarea with sound power level per sqare meter should be replaced with four point sources withsound power levels of Lw = 65 + 1 Olog(S/N) each where S is area given in square meters and Nis number of sources. So in this case 235 000 is the area and 4 is the number of point sourceswhich gives 112.7 dB(A) for each point source. The number of point sources used for terminalapproximation depends on terminal size and the vicinity of receiver points. Also the position oftheses points is dependent upon the same reasons and for the each receiver point is thenumber and the position of source points different.
- tl ti i; VL f I i . _ I f i it ia&-k . -
'I In I i a
F. * +nJ .
-~ ~~~~~ .7 . s :.
Figure 4.1.2-6: The worst possible case (the Netherlands' method)
For the aforementioned comparison location the Netherlands' method gives 38.1 dB(A) and theISO method gives 42.4 dB(A). Both values represent the equivalent noise imission for day andnight period as it is presumed that construction activities are taking place 24 hours a day.
Chapter 4, Page 14/ 50

EA and EMP for New Cargo Bulk Terminal at the Port of Ploce EKONERG d.o.o.
4.1.2.3.2. Noise along the route for delivering filling material (stone)
Several cases have been modelled and dependence of ground level emission is given withregard to the distance from the route. The calculation was made with a soil absorption factor of0 (zero) and at completely flat land. Meteorological correction has not been taken into account.The calculation parameters of sound attenuation due to air absorption are:
- temperature 200C- pressure 101.33 kPa- moisture 60%
Below figures show the levels of imission dependent on truck speed and the number of truckspassing in one hour.
Noise imission level at 20 km/h- 75 i
SO 70 Q
R 65 ik |-4 voz/sat° 60 m -8 voz/sat42 55r -12 vozlsat
16 voz/sai|
( 45 Vehicles40 per hour
1U2 28 44 60 76 92 108 124 140
Distance from the road [m]
Figure 4.1.2-7: Imission level dependent on distance from the source (road) at 20 km/h
Noise imission level at 40 km/h
75 V 70
i 65 W , |-~~~~~~~~~~~~4 voz/satc 60 <> -- 8 vozlsatzo55 -- ; -----. |-12 voz/sat
50 16 voz!sat~
o 45-----. Vehicles40 -rI-T r- _ _ Ti per hour
1 2 28 44 60 76 92 108 124 140Distance from the road [m]
Figure 4.1.2-8: Imission level dependent on distance of the source (road) at 40 km/h
Chapter 4, Page 15 /50

EA and EMP for New Cargo Bulk Terminal at the Port of Ploce EKONERG d.o.o.
Noise imission level at 60 km/h
70_
ci65 &: -4 voz/satx~ 60 <- 5-8 voz/sat
55 -12 voz/sat50 16 voz/sat2 45~-~ ~ Vehicles40 - --. ,,Eper hour
12 28 44 60 76 92 108 124 140Distance from the road [m]
Figure 4.1.2-9: Imission level dependent on distance of the source (road) at 60 km/h
CONCLUSION:
By determining the noise imission levels in the construction phase a worst-case scenario wasbeing considered. Such includes the minimal construction time and therefore, development ofmore construction activities at the same time. Modelling was done according to ISO 9613standard, which is regulated by the Croatian Noise Protection Act (Official Gazette No. 20 / 03 -see Legislation in Chapter 4.2.2.) and according to the Netherlands method (Figure 4.1.2-5 and4.1.2-6). The second method was used for verification and for the reference comparison pointwhich refers to nearest dwelling location, the two methods deviate in 4 dB(A). ISO method giveshigher values because higher noise emission levels then expected were used for modelling as aworse case scenario and because the period with all possible construction activities takingplace was considered. The Netherlands' method doesn't take this into account. With regard tonoise imission levels from both methods being lower then allowed by the Ordinance on highestnoise levels in areas where people live and work, Official Gazette No. 20/04, the deviation isconsidered to be small enough and the calculated noise map is valid for interpretation of noiseimpact during construction phase.
According to the noise maps, it is obvious that the noise from the terminal location duringconstruction does not influence the areas with highest noise levels allowed (Ordinance onhighest noise levels in areas where people live and work, Official Gazette No. 20/04).
The problem appears with the slip-road which will transport the strewing stone from the locationof future Split - Dubrovnik motorway. Since that route has not been yet exactly determined bythe technical survey and needs to be subsequently made, the abatement measures werespecified in the chapter Mitigation measures (Chapter 6 - EMP), in order to reduce noise impacton the environment and respect the regulations.
The problem also appears to be the area of ornithological reserve alongside whose boundaryline the dredging is to be performed, deepening the access channel to Vlaska Channel. Theregulations do not regulate the allowed noise levels for this area, but in order to respect thegeneral recommendations of the majority of European and world countries - related to noise
Chapter 4, Page 16 /50

EA and EMP for New Cargo Bulk Terminal at the Port of Ploce EKONERG d.o.o.
influence on birds - the necessary abatement measures, regulated in the chapter (Mitigationmeasures, EMP), are to be carried out. The scope of measures being taken will depend uponmonitoring which will be conducted during construction. Also it must be noted that theassessment was done for hydraulic dredging and that in case a mechanical dredging will takeplace instead, the potential impact will be reduced to some extent.
As for the noise influence on underwater world throughout the construction, it is difficult to makea final conclusion. No country in the world has legislative regulations on that matter, and sincethe monitored area is not of the special interest for the underwater world (btw, the list ofendangered fish species in Croatia consists only of fresh-water fish), we can assume that therewould not be a significant influence.
Chapter 4, Page 17 /50

EA and EMP for New Cargo Bulk Terminal at the Port of Plo6e EKONERG d.o.o.
4.1.3. IMPACTS ON ORNITHOFAUNA
During construction of the bulk cargo terminal, the most important works, in terms of impact inthe Parila Bay area (the area proposed for protection in the category of ornithological reserve) isexcavation/deepening of the access channel to the CBT berth and to Vlaska channel. Thisconstruction activity would generate diverse levels of noise depending on the position of atrailing suction hopper dredger. During the execution of the works, birds affected by the noisewill leave the area and fly to more suitable places. They will probably return when the works areover.
When determining the time for execution of the works, it should be taken into account that birdsare extremely sensitive during migration. Birds leave the area affected by high noise and thisunnecessary use of energy could disturb their feeding process and resting during migration. Thearea of Neretva River estuary is an important rest place for the bird migration, mainly from thenorth of Europe to Africa, from the second half of August to the end of October and from the endof March to July and as wintering site. Higher noise level is also a problem for the birds duringnesting, spring and summer, because parents could leave the nest permanently or, because ofhigher noise level, they could leave nests more often and for longer time thus exposing the nest,eggs and their young to predators and overheating. The area of the project is less important asa nesting than migration and wintering site.
Because of above-mentioned impact, the most suitable time that is the time of the lowest impacton bird fauna for execution of works would be summer period until the start of autumn migration.In that period there would be no impact on migratory and wintering birds thus they could feedand rest.
Chapter 4, Page 18/50

EA and EMP for New Cargo Bulk Terminal at the Port of Plo6e EKONERG d.o.o.
4.2. IMAPCTS DURING PROJECT USAGE
4.2.1. AIR QUALITY IMPACTS
Air Emissions
The major ambient air impact during operation of the bulk cargo terminal will be that fromfugitive emission from the bulk cargo handling and storage. Fugitive emissions are caused bythe bulk cargo unloading from the ships to the stockpile, wind erosion of material disposed onthe stockpile, and reloading from the stockpile into the bulk cargo wagons.
AP-42 methodology of the American Environmental Protection Agency (EPA) was used forcalculation of fugitive emissions. Figure 4.2.1-1 shows annual emission calculated for maximumuse of New Cargo Bulk Terminal capacity, and its annual capacity is 2,800,000 ton of coal,600,000 ton of bauxite and 1,200,000 of iron ore.
30 -PARTICLE EMISSIONz 2o 20 1 FROM OPEN AREAS
tj- 10
U DUE TO BULK MATERIALtr C ° t MANIPULATION
a t IRON ORE COAL BAUXITE
Figure 4.2.1-1: Annual particulate emission from the New Cargo Bulk Terminal during thefacility operation
Translation for Figure 4.2.1-1:Emisija cestica - PM emission (ton/year)Zeljezna rudaca - Iron oreUgljen - CoalBoksit - BauxiteSa otvorenih skladisnih povrsina (Erozija vjetra) = from open storage area (wind erosion)Zbog manipulacije rasutim teretom = from bulk cargo handling
Particulate matter emission from bulk cargo handling includes emission during unloading fromvessels to stockpiles and reloading into wagons. The calculation parameters on which emissiondepends include material moisture content, wind speed, and particle size. Considering climatecharacteristics, mean wind speed is taken of 4 m/s. For material moisture content, the lowesttypical values are taken from the AP-42 guidelines, i.e. 1.6% for iron ore, 2.7 % for coal, and 5% for bauxite ore.
Wind erosion causes particulate emissions from the bulk cargo stockpile. According to the AP-42 methodology, the emission depends on silt content and climatic factors: wind force over 3
Chapter 4, Page 20 / 50

EA and EMP for New Cargo Bulk Terminal at the Port of Ploce EKONERG d.o.o.
Beaufort and daily precipitation over 25 mm. As regards silt content, the highest typical valuesare taken from the AP-42 guide, and according to the climate characteristics, annually about 20% of winds are 4 Beaufort and over, while 20 days have precipitation over 25 mm. The stockpilesurface area is taken from the Tebodin Design Documentation, Document 7, Section 4.2. Thestockpiles for bauxite and iron ore are of equal area, 6,750 m2 each, and the coal stockpile areais 38,250 m2. Annual emission is conservatively estimated, assuming the stockpiles are fullthroughout a year.
Modern equipment for bulk cargo handling is of environmental design, i.e. in-use dust emissionis minimum, and therefore the emission should be even lower than estimated. Further,according to the design documentation, spraying of the bulk cargo stockpile will also reduceemission.
Air Particulate Matter Concentration and Deposition
LEGAL GROUNDS
The Croatian legislation regulating air quality analysis:- Clean Air Act (Official Gazette 178/04)- Regulation on Limit Values of Air Pollutants (Official Gazette 133/05), hereinafter
Regulation.
The Clean Air Act defines:- limit value (LV) is the limit level of pollution; according to scientific research results,
values lower than this value do not cause or cause minimum risk and detrimental impacton the human health and/or environment as a whole; once this value is reached it mustnot be exceeded.
- tolerable value (TV) is a limit value increased for margin of tolerance, where the marginof tolerance is expressed as a percentage of limit value by which this value may beexceeded subject to the conditions laid down.
The Regulation stipulates values and frequency of allowable exceeded values for limit/tolerablevalues of different pollutants. Further, the deadlines are set for gradual decrease in pollutantlevels in the ambient air. Table 4.2.1-1 give LV and TV for ambient air pollution which might becaused by operation of the bulk cargo terminal in the Ploce Port, and these are: concentration offine particulate matter (PM10 or PM-10) and quantity of deposited matter.
Chapter 4, Page 21 / 50

EA and EMP for New Cargo Bulk Terminal at the Port of Ploce EKONERG d.o.o.
Table 4.2.1-1: Limit and tolerable values of pollutant concentrations in ambient air relative tohuman health
Frequency of NumericalP Averaging Limit value allowable Tolerable value table olv L reachaluPollutant time (LV) exceeded (TV) tolerable level reachtei
LV not to be 75 pg/mr TV notexceeded more to be exceeded 7 //2
PM-10 24 hours 50 pg/m than 35 times more than 35 (N -2006) 1/12/2010Phase I. during a times during acalendar year calendar year
1 year 40 pg/M 3- 60 pg/m 60- 4 31/12/2010pg/rn3 N - 2006) _____
LV not to be 50 pg/rm3 TV notexceeded more to be exceeded
PM-10 24 hours 50 pg/mr than 7 times more than 35 - 31/12/2015Phase II. (2) during a times during acalendar year calendar year
1 year 20 pg/r 3 30 pg/N - 201 31/12/2015
TDM 1 year 350 - 31/12/2010
~'for phase L. PM,, for year Nfrom period 2006-2010for phase 11. PM, 0 for year N from period 2011-2015
(21 indicative limit values to be reviewed based on future information on the impact on human health and the environment, ontechnical availability and experience with application of limit values from the first phase.
The Clean Air Act, considering levels of pollution and with regard to the stipulated limit valuesand tolerable values, determines the following air quality categories:
- first category air quality - clean or slightly polluted air: the limit value (LV) not exceededfor any pollutant,
- second category air quality - moderately polluted air: limit values (LV) exceeded for oneor more pollutants, but tolerable values (TV) not exceeded for any pollutant,
- third category air quality - excessively polluted air: tolerable values (TO exceeded forone or more pollutants.
Article 42, Clean Air Act stipulates: "In the area of the first and second quality air category, newproject in the environment or reconstruction of the existing air pollution sources from Article 8,para. 2 herein must not threaten the existing air quality category".
CALCULATION METHOD
Based on background information on the nature of emissions, this being a fugitive emissionfrom near-ground area sources it may be assumed that the impact will be limited to a range ofseveral kilometers from the source.
The project impact on ambient air quality was assessed on the bases of the ISCST3 air qualitycalculation model. This is a Gaussian model developed by the American Environmental
Chapter 4, Page 22 /50

EA and EMP for New Cargo Bulk Terminal at the Port of Ploce EKONERG d.o.o.
Protection Agency (US EPA), and it enables calculation of dispersion of gases and particles asparticulate deposition. Use of screening calculation method gives conservative results. Thismethod asks for use of the so-called "worst case meteorological data", namely set ofmeteorological data used to simulate different combination of meteorological parametersneeded for calculation of dispersion and deposition.
Input data for air quality model include:- emission data,- meteorological data,- receptor grid.
Meteorological inputs were prepared in accordance with guidelines from the literature (NWSEPA, 2001). The data consist of a set of hourly values: wind direction and speed, airtemperature, atmospheric stability, Monin-Obukh length, surface roughness height and mixedlayer height. Surface roughness height is a parameter that depends on the surface over whichthe air flows, so it is used for parameterization of barrier impact (e.g. vegetation, buildings, hills)on the wind. To prepare the "worst case meteorological data", following values were used:
- air temperature is constant, so mean annual value of 15CC was taken,- surface roughness height depends on type of surface, so in case of sea-to-land wind the
assumed value is 40 cm as a characteristic value for flat ground and areas with lowbuildings, and in case of land-to-sea wind the surface roughness height is 0.1 mm.
The dispersion calculation takes that the area emission sources cover the area of coal, bauxiteand iron ore stockpiles. Size and position of the three bulk cargo stockpiles (i.e. the "stockyardstorage") are determined from the Tebodin design documentation.
Specific emissions are calculated from annual emission, so they include emission from loadhandling and wind erosion, and the assumed emission release height above ground is 10 m.When handling bulk cargo or when emission is arising from stockpiles, fine particles prone todispersion i.e. particulate matter smaller than 10 micron (PM-10) in diameter account forapproximately half of above given particulate emissions. Particulate matter larger than 30micron in diameter are prone to gravitational settling, so they will deposit inside several hundredmeters from the source. Therefore, the dispersion and deposition calculations done withdifferent emission or specific emission values for the deposition calculation were approximatelytwice higher. Parameters used in calculation based on ISCST3 model for the characteristics ofthe New Cargo Bulk Terminal emission sources are given in Table 4.2.1-2.
Table 4.2.1-2: New Cargo Bulk Terminal emission parameters - ISCST3 model calculationinput data
ource S o Specific emission for Specific emission for(by load type) Source size deposition calculation dispersion calculation
COAL 400 m x 90 m 2.3 * 1 0- gls/m2 0.9 * 10-5 g/S/m2
IRON ORE 400 m x 45 m 3.5 *1 0- lsIm2 1.4 * 10- gIsfm2
BAUXITE 400 m x 45 m 2.2 * 10 -5 g/S/m 21.1 * 10-
5 g/s/m2
Chapter 4, Page 23/50

EA and EMP for New Cargo Bulk Terminal at the Port of Ploce EKONERG d.o.o.
Point grid (receptors used to calculate concentrations and deposition covers an area of 4 x 5km, receptor density 50 x 50 meter.
Results of screening using the ISCST3 calculation model are maximum hourly values ofconcentration of PM-10 and gravitational settling of particles. It should be mentioned that valuesin receptors are not obtained for the same combination of meteorological parameters, somaximums correspond with different <<moments,> namely meteorological conditions.
Calculation by screening method gives maximum hourly concentrations, so the statisticalparameters from the Regulation are assessed as follows:
- Maximum daily concentrations of PM-10 were obtained by multiplying maximum hourlyvalues by factor 0.4 according to instructions from literature (Air Quality ModelingGuidelines, 2000).
- Annual quantity of total deposited matter (TDM) was obtained by multiplying maximumhourly values by frequency of wind direction for which this value was obtained.(Multiplying by annual number of hours of wind gives total quantity of deposited matterduring a year, so this quantity is divided by 365 since the TDM unit is mg/m2/day).
CALCULATION RESULTS
Figure 4.2.1-2 shows results of calculation of maximum hourly concentration of PM-10 anddeposition, and Table 4.2.1-3 gives maximum calculated values. Spatial distribution ofconcentrations and particulate matter deposition reflects shape and orientation of the source,i.e. storage area. Since surface roughness heights are different, values of the deposition abovesea are actually lower than those shown in Figure 4.2.1-2. Table B.4.2.1-3 shows the "actual"values, i.e. maximum hourly values of deposition for a set of meteorological data obtained forthe surface roughness height 0.1 mm.
Chapter 4, Page 24/50

EA and EMP for New Cargo Bulk Terminal at the Port of Ploce EKONERG d.o.o.
Maximum hourlyconcentration ofparticulate matter (PM- 10)
100
50
, - 25
5ez>c s30 54s ss ooMaximum hourly quantities of* - ----- -' - - total deposited matter (TDM)
I ., -@~~~
150
100150
10
I! 4
52JOZ 53140.W0550
Figure 4.2.1-2: Maximum hourly concentration of particulate matter (PM- 10) and total depositedmatter (TDM)
Chapter 4, Page 25 / 50

EA and EMP for New Cargo Bulk Terminal at the Port of Plode EKONERG d.o.o.
Table 4.2-1-3: Maximum values obtained with ISCST3 model calculation
CALCULA TED MAXIMUM ESTIMA TED VALUESHOURLY VALUES
LOCATION WDIRECTION Cncentration Quantity of Maximum daily Quantity ofDIECIO Cncnto n deposited concentration deposited
of PM-10 maffer of PM-1O matter
_gIM/3 (h) mg/rn12/he 1g/rn mg/m3/day
Max. impact 315 558 126 89LAND SW (6454100,4766050) (6453450,4765600) (factor: 04) (wind frequencyonfLAN 65104600 65404660 fco:04 16%)
Max. impact 306 548 122 88on SEA (6453250,4765450) (6453450,4765600) (factor: 0,4) (wind frequency
Figure 4.2.1-3 shows calculated maximum hourly concentrations of particulate matter anddeposition for wind direction between S and SSW (10 wind directions ranging from 180° to202), which transports dust towards the town of PI oce. Rectangles in the figure show three bulkcargo storage areas i.e. mark the particulate emission sources.
For area sources of particulate emission, concentration and deposition are considerablydependent on wind direction related to the source orientation centerline. By varying the winddirection by 20, maximum values of PM-10 concentrations and TDM were obtained for theplanned Terminal site. Therefore, Figure B.4.2.1-3 shows maximum transitory impact onambient air in the town of Ploce area during the most intensive activities at the New Cargo BulkTerminal while the south wind (sirocco) is blowing.
Table 4.2.1-4 shows results of calculation using dispersion model for several selected locations.The annual quantity of total deposited matter is obtained by multiplying maximum hourly valuesby frequency of S direction wind (-3 %).
Table 4.2.1-4: The most important results of particulate (PM-10) concentration and depositioncalculation
CALCULA TED MAXIMUM ESTIMA TED VALUESLOCATION HOURLY VALUES
(Gauss-Krugger Concentration Quantity of Maximum daily Annual quantity ofcoordinate) of PM-10 deposited concentration of deposited matter
matter PM-10eoiedmteai/rm
3 (sat) mrg/n 2/sat g/lrn3 mr/m2 /dayDOM ZDRAVLJA
Monitoring station 3 108 41 43 1,2( - 6454200 4767400)PUCKO OTVORENO
UCILISTE 75 27 30 0,8Monitoring station 4 7 73 ,(__6454200,4768300)
Chapter 4, Page 26 50
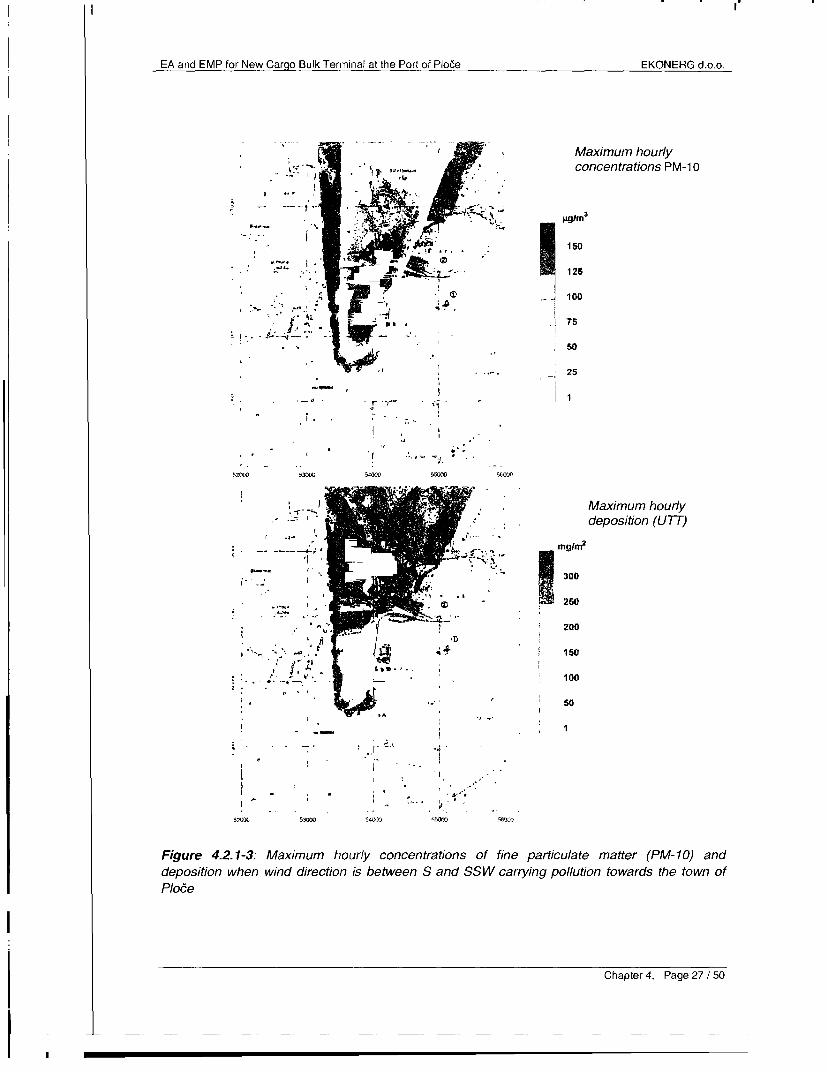
EA and EMP for New Cargo Bulk Ter-ninal at the Port of Ploce EKONERG d.o.o.
Maximum hourly* -/ija - ;i iF: concentrations PM-1 0
* .' '-<S; , S P JIF t _ ;- 125
* ~~~~~~~~~~~~~~100- 75
I 8, s j _._z__., __ _ - | 50
25
I.
52500 53"5 40 500006
Maximum hourlydeposition (UTT)
300
200
100
* l - - _ .
.. .
5200C 5300 04000 0000 5600
Figure 4.2.1-3:. Maximum hourly concentrations of fine particulate matter (PM-10) anddeposition when wind direction is be(UTeen S and SW carrying pollution towards the town ofPlo6e
Chapter 4, Page 27/50

EA and EMP for New Cargo Bulk Terminal at the Port of Ploce EKONERG d.o.o.
Maximum concentrations of PM-1 0, shown in Table 4.2.1-4, were obtained for meteorologicalconditions of stable atmosphere (atmospheric stability class E and F) and very weak wind(speed about 1 m/s). In the coastal area, such conditions in atmosphere usually happen duringnight, when the NE quadrant winds blow in the town of Ploce area. South winds blow in thetown of Ploce area during day, when the atmosphere is mostly neutral or instable.
How much lower are the PM-1 0 concentrations obtained by the calculation using ISCST3 modelin cases of neutral and instable atmosphere is best shown by diagrams in Figure 4.2.1-4. ThePM-10 concentrations obtained for different combinations of wind speed and atmosphericstability of winds of SSW direction are shown for two locations in the Ploce residential area.Diagrams show the wind direction in degrees for which the given values are obtained. Mean Sand SSW wind speed during day is about 4 m/s which means that dispersion is higher andconcentrations lower. So maximum hourly concentrations of PM-10 in the residential areas oftown of Ploce (monitoring stations 3 and 4) will be below limit value for 24-hour concentration ofPM-1 0 which is 50 Pg/M 3.
Since the south winds of S and SSW direction, which can transport the dust from the terminalarea towards the town of Plo6e, blow during about 10 % of time, mean annual concentration ofPM-10 will be less than 10 % of maximum hourly concentration. As can be estimated on thebasis of the calculations, contribution of TRT Ploce Terminal to increase in mean annualconcentrations in the Ploce residential area (monitoring stations 3 and 4) will be less than 10[tg/m3 , therefore several times less than the limit value of the mean annual concentration of PM-10, which is 40 gig/m 3 .
Based on estimated annual values, annual quantity of total deposited matter in the town ofPloce residential area (monitoring stations 3 and 4) should be at least hundred times lower thanthe limit value of TDM, which is 350 mg/m2 /day.
PM-10 PM-10(Rglgm ) Lokacija: DOM ZDRAVLJA (m 3) Lokacija:PUCKOOTVRE O120im3
80IJLSTReceptor: 6454200, 4767400 * -
* * Smjer vjetra: 1960 70 Receptor: 6454200, 4768300l00 60 Smier vietra: 1900
80 580 A A,B,c A A,B,C
60 a a D 40 * D00F I O ODF* * E,F 30 * EF|
40 0* * U ~~~~~~~~~20
20 | ~AA 10A*0 t t A t A
I I 0~~~~~~~~~~~~~~~~~0 2 4 6 8 10 0 2 4 6 8 10
brzina vjetra (mis) brzina vjetra (m/s)
Fig. 4.2.1-4: Hourly concentrations of PM- 10 for wind direction that causes the strongest impactof the New Cargo Bulk Terminal in two locations in the town of Ploce
Chapter 4, Page 28/50

EA and EMP for New Cargo Bulk Terminal at the Port of Plo6e EKONERG d.o.o.
CONCLUSION
Based on the calculation results obtained by application of the dispersion model and informationon the climate characteristics, particularly the wind conditions at the town of Ploce area, it canbe concluded that operation of the New Cargo Bulk Terminal will not cause degradation of thefirst category air quality2 due to the particulate concentration (PM-10) and depositing at the townof Ploce area.
Even the estimated impact on air is not significant following mitigation measures will beimplemented: spraying (wetting) system for bulk cargo und unloading/reloading places (transferpoints) will be constructed, also if it will be necessary, polyelectrolytes for spraying of thematerial stored at the terminal shall be used. All transfer points on the belt conveyor line will beconstructed enclosed and to reduce particle emission maintenance of internal roads is required.
2 As defined by the Croatian air quality legislation (Off.Gaz. 178/04, 133/05) - clean or slightly pollutedair: the limit value (LV) not exceeded for any pollutant.
Chapter 4, Page 29/50

EA and EMP for New Cargo Bulk Terminal at the Port of Ploce EKONERG d.o.o.
4.2.2. NOISE IMPACTS
BASELINE
According to Ministry of Environmental Protection, Physical Planning and Construction Decisionfor New Container Terminal in Port of Ploce from lth. March 2005. noise testing was preformedto determine baseline condition. Result are given in table below:
noise 2 measurement points in daytime working condition The existing noise level out of port at Btzone of "Port of Ploce" (B2 during port activity during daytime does not(testing performed in and B3) and 1 measurement exceed permitted value.
2005) point in outer area in point B1nearby port basin in daytime Measured noise levels within port at pointsand night time working B2 and B3 do not exceed permitted values.conditions Night time working The existing external noise level out of port
conditions at B1 without port activity during nighttimedoes not exceed permitted value.Measured noise levels within port at pointsB2 and B3 do not exceed permitted
_ _ _ _ _ _ _ _ _ _ _ _ _ _ _ _ _ ____ ____ ____ ____ ____ ___ ____ ____ ____ ____ ____ v a lu e s -
NOISE IMPACT - NEW CARGO BULK TERMINAL
Since at this stage of design development the type of equipment and its noise emission levelare not precisely determined, they should be estimated on the basis of characteristics used forcapacity calculation. If at a later stage more precise data on noise emission levels for a singlesource happen to be higher than the assumed, it will be necessary to take noise levelattenuation under the chapter Measures for environmental protection to reduce actual emissionlevel to the ones assumed. In that case only will the conclusions of this study be valid. Below isan assessment of the noise emission level for each machine according to the order of bulkcargo handling, from unloading ship to loading wagons.
4.2.2.1. Noise Sources
For ship unloading, two gantry cranes with grabs are used, each of 1500 t/h capacity with eachgrab net capacity of 30 tons. According to the DGMR database which consists ofmeasurements for the last 10 years, the noise emission levels are expected to be from 104dB(A) for loaded grab moving up and down up to 112 dB(A) during trolley moving forward andbackward. The assumption will be made that the equivalent noise emission level of 109 dB(A)will give the same amount of noise as these combined over 24 hours. Table 4.2.2-1 gives areview of assumed levels of noise emission by crane per octaves.
After that, bulk cargo is taken to an outdoor storage area by a belt conveyor. Alongside theberth, there are parallel belt conveyors, of 1500 t/h capacity each, for each crane. By means oftransfer station it changes its travelling direction twice and the cargo goes to one of two last bestconveyors before the storage area. Their capacity is 3000 t/h each, and each of them isprovided with one stacker and one reclaimer. Capacity of the belt conveyor from the storagearea to the station for loading wagons is 1000 t/h. As a worse case scenario, sound power levelof a 1000 t/h belt conveyor will be assumed equal as for 3000 t/h belt conveyor. According to
Chapter 4, Page 30/50

EA and EMP for New Cargo Bulk Terminal at the Port of Ploce EKONERG d.o.o.
DGMR, sound pover level for belt conveyors will be assumed 75 dB(A)/m. The spectra will bequalitatively assumed according to the measurement in the study Wal0344 ERMP4 BauxiteTransport Final, May 2005, for 3200 t/h belt conveyor of total sound level of 82 dB(A). Table 5gives a review of assumed noise emission levels of belt conveyor per octaves.
Bulk material is stacked at the storage by means of two stackers, 3000 t/h capacity each, andfrom the storage it is reclaimed by two reclaimers, 1000 t/h capacity each. Their noise emissionlevel will be assumed to be equal as for the coresponding belt conveyor. 500 meters of beltconveyor between the stockpiles result in overal sound power level of 102 dB(A). According toArmy Transformation EIS, Appendix H2 - Construction Noise Analyses, United States Army thespectra will be qualitatively assumed. Table 4.2.2-1 gives a review of assumed noise level forstacker / reclaimer per octaves.
Bulk cargo handling at the terminal ends up in the wagon loading station. Noise from the loadingstation depends greately upon the wagon wall thickness because the unloading operation itselfproduce greatest noise. Based on the experience from the DGMR's experts this noise isexpected to be 118 dB(A). For modeling purposes, 20 seconds unloading time will be assumedwhich is 15% of the time over 24 hours. The spectra will be taken the same as for the beltconveyors. Table 4.2.2-1 gives a review of assumed noise level for stacker / reclaimer peroctaves.
The noise caused by the system for watering the storage area reduce dust emission is alsocovered by the noise of belt conveyors.
Since the reclaimer cannot technically reach all the material at the storage site, it will benecessary to use mobile loaders and trucks to handle those small remaining out-of-reachquantities of the material. For that purpose, three off already existing loaders, 5 m3 each, will beused and two off trucks, 20 m3 each. The noise level for those machines is taken according toDEFRA, Update of Noise Database for Prediction of Noise on Construction and Open Sites2005. According to the table, noise emission level for a 5 m3 loader, equivalent to 13.5 tons forthe heaviest material i.e. iron ore, was taken for a 23 ton loader as the worst possible case.Noise emission levels for a 20 m3 truck (equivalent to 54 tons) were selected from the table for a90 t truck, which is the worst possible case.
A new mobile crane of 63 tons will be used at the port terminal. Its emission levels are alsotaken according to DEFRA for an 80-ton crane.
Since DEFRA provides the emission level at 10 metre distance, they should be corrected to astandard of 1 m from the source. Because the safety factors selected from the database foreach machine were higher factors, the correction could be simplified and made only forgeometrical divergence; existing emissions per octaves should be added 20 dB (20logR), andthan total A evaluated emission level should be calculated. Table 4.2.2-1 gives a review ofassumed emission levels of ship unloader, trucks and cranes per octaves.
Chapter 4, Page 31 /50

EA and EMP for New Cargo Bulk Terminal at the Port of Ploce EKONERG d.o.o.
Table 4.2.2-1: Assumed noise emission levels of equipment at the port terminalNoise_Source___ Sound power per octaves, dB(A) I_LwNoise Source 63 125 [ 250 500 1 k | 2k [ 4k [ 8k dB(A)
Gantry crane 82.9 92 95.5 99.9 103 105.3 100 88 109Conveyor belt 39 58.1 62.6 71 69.2 68.5 60.2 49.1 75 dB(A)/mStacker/ reclaimer 75.8 84.9 88.4 92.8 96 98.2 93 85.9 102Loader 88.3 89.2 90.5 94.7 99.1 98.5 90.1 78.2 103.4Train loading station 82 101.1 105.6 114 112.2 111.4 103.2 92.1 118Truck 78.8 89.9 97.4 98.8 101 100.2 98 86.9 106.4Truck crane 80.8 85.9 89.4 90.8 91 88.2 81 1 70.9 96.7
Since the critical areas are far away, it is possible, when determining their ground levelemission, to use the same method as used in the Netherlands. DEFRA mentions the samemethod as well and concludes that its application is possible in England after detailedmeasurements and determination of emission levels for terminals in England. This is a reliablemethod for determination of ground level emissions for sufficiently distant areas observed sothey will be used here only as a check of the previous model. The port terminal for sufficientlydistant areas is approximated by point sources in the model and its emission levels aredetermined according to the expression:
Lw = 65 + 10log(S), where S means total surface area of the terminal in m2, and 65 is specificemission level per square metre of terminal for bulk cargo (dB/m2). Table 4.2.2-2 gives a reviewof noise emission level per octaves for a point source.
Table 4.2.2-2: Noise emission levels for a bulk cargo terminal - calculated surface area of235 000 m2
Noise source Sound power per octaves, dB(A) dB(A)63 1 125 250 500 |lk 2k |4k 8k dLW
Terminal 66.8 85.9 96.4 105.8 110 114.2 112 108.1 118.7
4.2.2.2. Noise Charts
4.2.2.2.1. Noise radiated by Port Terminal
Two situations will be modelled: the worst possible case and a case best resembling the reality.Both understand 24-hour work time of the terminal when a ship arrives to the port. It is assumedthat all noise sources, except for auxiliary loaders and trucks, and auxiliary truck crane, arecontinuous emitter of noise during that time.
The first two cases will be modelled according to ISO - and then a model and noise charts willbe made according to the Netherlands' model and they will be compared with the one for theworst possible case modelled according to ISO.
Meteorological correction is not taken into account, and the space showed on the chart isassumed completely flat with an absorption coefficient of zero - full reflection.
Chapter 4, Page 32 / 50

EA and EMP for New Cargo Bulk Terminal at the Port of Plo6e EKONERG d.o.o.
*/ - lO~~~~~~45N 0.0dB(A)
,,,' ',00 - XJ 0)A)* tl X *-. _ r #A G =s 8 1W) a a a * E _-- e ----x, 'N '.' 1 . -
I . I. . H I * *
Fiur.2-: Nos chrtfoaculsttin(Smde)
l4~ 4 -_--
A ~ ~ ~ ~ ~ ~ ~ ~~~' 1
4~~~~~~~~~~~4
40~~~.~6 dft'WVO~
J¶
Figure 4.2.2-2. Noise chart for actual situation (ISO model).
Chapter 4, Page 35/50

EA and EMP for New Cargo Bulk Terminal at the Port of Ploce EKONERG d.o.o.
The Netherlands' method uses the same values for sound power level per square meter forconstruction site as for the dry bulk cargo terminal (65 dB(A)/m2). Because of this, the resultsfrom noise analysis from construction phase can be considered again and comparison can bemade with the ISO method. The same location as for the construction phase will be considered:for this the Netherlands' method gives sound imission level of 38.1 dB(A) and the ISO methodgives 37.2 dB(A). Both values are valid and equal for day and night period because ofpresumed 24 hour operation of terminal.
Chapter 4, Page 36!/ 50

EA and EMP for New Cargo Bulk Terminal at the Port of Ploce EKONERG d.o.o.
4.2.2.2.2. Noise by Transport (railway)
According to recommendation of EU Directive 2002/EC END, noise alongside the railway line iscalculated according to the Netherlands' method RLM2.
Maximum capacity of the wagon loading station is 15,000 ton/day. If a net capacity of a 58-tonwagon is taken into account, and a train of 17 wagons, we shall get 16 railway trains a dayleaving the terminal i.e. altogether 32 trains leaving/coming to the terminal. Recalculated, itmeans 1.33 train/h.
Input data for the model according to the method mentioned is the number of units per hour pereach category. The category 4 (cargo wagons) stipulates 5 wagons per unit which gives total of4.5 unit/hour.
Absorption coefficient of soil is zero. It is assumed that the railway line foundation is made ofconcrete blocks.
Below figure shows ground level emission dependent on distance from the railway line and trainspeed.
Railway noise
70
X600 -7 0 km/hBE505 =-E0 k /h
45 -40l- - ,,--,--T
10 50 90 130 170 210 250
Distance from the railtracks [m]
Figure 4.2.2-3: Ground level emission of noise alongside the railway line
4.2.2.2.3. Noise by ships
Noise radiated by ships will not be analysed separately because the area of possible impact isalready used as a navigable waterway for liquid cargo terminal. Maximum deadweight cargo ofships transporting liquid cargo is 40000 DWT. Ships transporting bulk cargo will come to theport with assistance of tugboats thus assuming that there will be no increase in ground levelemissions.
Chapter 4, Page 37 /50

EA and EMP for New Cargo Bulk Terminal at the Port of Ploce EKONERG d.o.o.
CONCLUSION:
The worst-case scenario regarding noise impact on the environment consists of the realisticsituation of 24 hours working time of the terminal when a ship lands into the port. Thementioned case was modelled according to ISO 9613 standard, which is regulated by theCroatian Noise Protection Act (Official Gazette No. 20 / 03) and according to the Netherlandsmethod, Figures 4.2.2-1 and 4.2.2-2. The other method is used for verification and generallygives good results on larger distances from the terminal.
The difference between the noise imission levels at the referent comparison location for the twomethods is 0.9 dB(A) so it is presumed that modelling is accurate. According to the noise mapsfrom the aforementioned pictures it is obvious that the only possible noise impacted area is oneon the opposite side of channel Vlaska, alongside ornithological reserve. Here, the predictednoise imission levels are slightly above recommended and the monitoring which will beconducted during the construction phase will show if some mitigation measures will be needed.
As for the noise influence on underwater world because of the shipping activities, it is difficult tomake a final conclusion. This area is already used for sea traffic and presumption is that theincrease in traffic will be negligible as far as noise impact on the environment is concern Nocountry in the world has legislative regulations on that matter and since the monitored area isnot from the special interest for the underwater world (btw, the list of endangered fish species inCroatia consists only of fresh-water fish), we can assume that there would not be a significantinfluence.
Chapter 4, Page 38/50

EA and EMP for New Cargo Bulk Terminal at the Port of Plode EKONERG d.o.o.
LEGISLATION
1. Laws Applicable in the Republic of Croatia
The noise law currently in force, Gazette 20/03, stipulates the measures for noise protection onmainland, in water and in air. The by-law on the highest allowed noise levels in the environmentwhere people work and live, Gazette 20/04 stipulates those levels.
According to the last County's plan for use of surfaces, the area foreseen for construction of thebulk cargo terminal is defined as a port and industrial complex. The by-law classified that areaas Zone 5.
Table 4.2.2-3: Maximum allowed evaluation levels of ground level emission of noiseoutdoor
Noise Maximum allowed evaluation levels of ground level emission ofzone Space purpose noise
day time (Lday) night time (Lnight)Zone intended for resting,
1. recovery and medical 50 40treatments
2. Zone intended for living and 55 40working only
3. Mixed zone for 55 45predominantly for living
4. Mixed zone predominantly 65 50for business and living
5. Economic zone, production, - On the border of a building plot within the zone, noiseindustry, storages, services) must not exceed 80 dB(A)
- On the border of this zone, noise must not exceed the noiseallowed in the zone its borders.
Knowing that there are no noise charts for the location observed, the law and by-lawparagraphs concerning noise from the bulk cargo terminal in the Port of Plo6e are:
1. According to the by-law, allowed evaluation continuous noise levels on the border withZone 3 must not exceed the values of 55 dB(A) in daytime and 45 dB(A) in night time.
2. On the border of a building plot within the zone, noise must not exceed 80 dB(A).3. Noise on the border of the road corridor planned must not exceed equivalent noise level
of 65 dB(A) in day time and 50 dB(A) in night time.4. Each short peak values of noise in the Zone 5 must not be exceeded by 25 dB(A) in
daytime and by 15 dB(A) in night time, and in the zones 1-4 by 20 dB(A) in daytime andby 10 dB(A) in night time.
5. Regardless of the zone, during construction works in daytime, allowed equivalent noiselevel is 65 dB(A). From 8 a.m. to 6 p.m., the value could be exceed by further 5 dB(A).When executing works at nights, the noise level must not exceed the values stipulated inthe table.
Chapter 4, Page 39 / 50

EA and EMP for New Cargo Bulk Terminal at the Port of Ploce EKONERG d.o.o.
2. Recommended Values
NOISE IN WATER/SEA
Croatia, same as any other country in the world, has not passed any legislation concerningnoise in water/sea. Below are only some general recommendations and conclusions of thestudies:
Most studies addressing noise impact on underwater life does not refer to a human so it canaffect it only when diving. US Navy (U.S. Federal Register, 2002) has demonstrated by someinvestigations that constant noise to 145 dB (re 1pPa) has no significant impact on divers, eithermilitary of sport divers. Since by-laws in Croatia do not address the noise issue in water/sea,that value could be considered as a reference value.
Studies addressing the impact of anthropogenic noise on underwater animal life are mostlybased on underwater geological investigations because of already mentioned "air guns", themost intensive underwater sources of noise whose levels are to 250 dB (re 1pPa). Differenteffects of those noise levels have been noticed, such as:
- Lower catch of fish per unit - fishing boat (Pearson& Skalski, 1992)- Change in distribution and quantity of fish in the area surveyed (Engas, 1995)- Reduced survival of fry and eggs (Banner and Hyatt, 1973)- Disturbance of communication at some species (Chapman and Hawkins, 1973), etc.
Only some general impacts have been mentioned herein but there are many other characteristicimpacts for certain areas and certain special and sources. It not possible to apply theexperience from those studies to the location of the Port of Ploce and make a concreteconclusion. The situation is made even more difficult by the fact that in Croatia there are nostudies addressing that topic. Some foreign scientists recommend maximum level of underwaternoise of 150 dB in the areas with higher concentration of fish (Croll, 1999).
NOISE IMPACT ON BIRDS
Birds, except for owls, have hearing organs that cover the same range of sound frequenciesand level like people so generally the limits for the highest allowed levels of noise stipulated forpeople are also appropriate for birds (EPA - Environment Protection Authority, Best PracticeEnvironmental Management - Guidelines for Dredging).
Chapter 4, Page 40/50
EA and EMP for New Cargo Bulk Terninal at the Port of Ploce EKONERG d.o.o.
4.2.3. SEA AND MARINE COMMUNITIES
4.2.3.1. Impacts on the sea water circulation in the Vlaska Channel and in Ploceaquatorium and on migration of organisms
Large vessels (vessels up to 80 000 DWT and with draught of up to 14 m are planned) willreduce the rate of water circulation through the Vlaska Channel. This reduction will not causechanges in composition of living organisms in the area upstream from the project location. It isplanned that vessels will stay on berths up to 180 days per year. Seawater circulation will beobstructed during the stay of vessels but there will be enough space for seawater circulation inthe lower layer and for circulation of brackish water in the upper layer (Study of dynamical andthermohaline characteristics in the broader area of the Ploce Port). Steep banks of the channeland broad "entrance" with a stone slope (planned gradient of the slope is 1:3) will enable goodtransfer of seawater in the area. High and low tides, inflow of freshwater with the accompanyingentrance of the sea water in the opposite direction and movements caused by winds alsobenefit to seawater circulation. Nektonic organisms (fish and cephalopods) during theirseasonal migrations can pass by vessels almost without any obstruction. Planktonic organisms(crustaceans, fish larvae and bivalves' eggs and larvae) will be transported upstream in thelower layer (seawater) as until now. Occasional operation of tugboats' and cargo vessels'propellers will obstruct this transport but this will mostly occur in the upper, brackish layer(draught of tugboats are up to 4 m) which is not so important for the entrance of planktonic seaorganisms.
4.2.3.2. Marine communities
After ending of the construction work, sea organisms will colonize "new" areas below and abovethe sea surface. Primary biofilm composed of bacteria and benthic diatoms will develop onrocks of slopes and on parts of concrete docks below the sea level in just a few days.Colonization of the larvae of other, larger organisms will occur afterwards. Numerous bivalves(by weight and numerosity will prevail mussels, approximately 80%, and oysters, approximately15%) and serpulids will colonize rocks and concrete parts after a few months because of highproductivity of the sea. Appearance of the algae and vagile crustaceans is also possible.Approximately a year after, the docks near the sea surface will be overgrown by numerousmussels (Mytilus galoprovincialis) and oysters (Ostrea edulis) while in the deeper sea a fewalgae will occur.
Sciafilic organisms, sponges from genus Sycon, diverse bryozoans e.g. Shisobranchiellasanguinea, organisms from subphylum Tunicata e.g. Polycarpa sp. and Microcosmus sp.,bivalves e.g. Chama sp., Lima lima and serpulids e.g. Serpula sp., Spirographis spallanzani willdevelop in shaded areas while algae will not be present.
Composition of benthic organisms will stabilize after a few years. Communities in the projectsurroundings will be similar to those already seen in the Plo6e Port. Various benthic algae andanimals, large in populations and size, will develop. It can be assumed that all species listed in
Chapter 4, Page 411/50

EA and EMP for New Cargo Bulk Terminal at the Port of Ploce EKONERG d.o.o.
the Table 3.2-1 (see Chapter 3) will reappear and possibly some other will colonize areasbetween large rocks of channel slopes which represent a new habitat type.
Organisms living on and in the seabed sediment will only partially reappear because digging willcontinue due to the maintenance of the channel.
4.2.3.3. Sea quality
Construction of:- system for drainage and treatment of rainfall (storm waters) - see Chapter 2- system for collection and treatment of sanitary wastewater - see Chapter 2- adequate waste facility - see Chapter 4.2.5
will ensure that influence of Project on sea quality will be minimized.
4.2.3.4. Invasive species
On the new bulk cargo terminal at Port of Ploce only debarkation will occur. Thus the problemwith ballast waters with non-native species will be minimized because vessels will not have tocarry seawater from other seas to be able to float because they will carry cargo which will bedebarked in the Ploce Port.
Tropical green algae, Caulerpa taxifolia and C. racemosa do not have natural enemies in theAdriatic Sea thus they can easily spread which causes drastic decrease of biological andecological biodiversity of sea bed. Both species appear from shallow waters to depths of morethan 50 meters, both in clean and polluted waters. During summer algae grow intensively anddevelop a dense canopy of creeping stolons. They overgrow, shade and smother other sessileorganisms, increase sedimentation and cause anoxic conditions. In anoxic conditions, bacterialsulphate reduction produces H2S which can be toxic to the most of the benthic organisms.
C. taxifolia was accidentally liberated into the Mediterranean Sea from the tropical aquarium ofthe Oceanographic Museum in Monaco in 1984, but it was from 1991 onwards that it began tospread rapidly. In the Mediterranean it propagates only vegetatively, by torn pieces of thalli andtheir rooting. The alga is mostly spread by anchors and fishing nets and in certain conditions(dark, 180C and 95 % humidity) it can survive up to ten days out of a sea. Spread of the algalparts by hydrodinamism is limited to an area of a few hundred meters because pieces of thethalii sink. In the Adriatic Sea it has been found on three localities, the Starogradski Gulf onHvar Island, in Malinska Town on Krk Island and in the Barbatski. Channel between islands Raband Barbata, where it has probably been brought by yachts.
C. racemosa spreads faster and forms denser populations than C. taxifolia thus it represents alarger threat to the biodiversity of the Adriatic Sea. At first C. racemosa was detected near thecoasts of Libya, Israel, Syria and Egypt where it came through the Suez Canal. Until 90s it wasscarce and spread only in the south and south-east Mediterranean, but since 1991 it showsinvasive characteristics and has spread in the whole Mediterranean. In Croatia it has beenfound on 33 localities from Cavtat Town to Vis Island, and on one locality near Vrsar in the
Chapter 4, Page 42 /50

EA and EMP for New Cargo Bulk Terminal at the Port of Ploce EKONERG d.o.o.
northern Adriatic Sea. These localities are not usual places where vessels anchor thus thespreading of the alga is probably happening due to sea movements. In the Mediterranean SaeC. racemosa probably, also, reproduce sexually which enables its spreading to farther areas.However, it has not been documented that this way of reproduction occurs in the Adriatic Sea.
The main vector in the spreading of the alga C. taxifolia are probably yachts with small anchorsand fishing nets while C. racemosa can be spread by sea movements. Thus the impact ofvessels which will arrive into the port should not increase the risk of algae's spreading.
Chapter 4, Page 43 / 50

EA and EMP for New Cargo Bulk Terniinal at the Port of Ploce EKONERG d.o.o.
4.2.4. IMPACTS ON ORNITHOFAUNA
4.2.4.1. Noise impact
Noise sources during the terminal operation are ship loaders, trucks and mobile cranes. Thenoise impact on bird behaviour has not been clarified enough and it has been mainly analysedin terms of personal watercrafts, road traffic and airplane noise. It should be underlined thatdifferent bird species are differently sensitive to noise so it is not possible to generalize thenoise level and its impact on birds. Rodgers (2000; 2002) studies the impact of pleasure boatsto different bird species (Pelicaniformes, Ciconiiformes, Falconiformes, Charadriiformes) on thecoast of Florida, and concluded that the impact zone is from 100 to 200 m for different birdspecies, which would be, if other impacts are neglected, e.g. visual impact of ships that isalmost impossible to isolate frorn the noise impact under natural conditions, between 50 and 60dB. Reijen et al. (1995) analyzed impact of road traffic on forest population of birds anddetected the decrease of population density for 26 out of 43 surveyed species. As the maincause they identified the impact of noise. Moreover, they stated that the impact of noise oncertain bird species starts from < 23 to 56 dB and it varies for different species. Other authorshave tried to identify the distance at which certain human activities affect certain bird species(Korschen and Dahlgren, 1992). For example, Burger (1998) concluded that personalwatercrafts with a 100 m radius disturb red-billed tern (Sterna hirundo) during nesting makingthem to leave unattended nest. Butler (1992), for instance, suggests a protection zone with nohuman activities of 300 m in the nesting area of blue egret (Ardea herodrias). In turn, there is anopinion that birds could adapt to the life in the areas with higher noise level e.g. birds alongairport runways and birds in towns. Meunier et al. (2000) and Peris and Pescador (2003) statethat investigated predatory birds and passerine species could adapt to the road traffic noise andproceed with their activities. Trimper et al. (1998) investigated the impact of airplane noise twicea day with the median values of 89 dB to nesting of osprey (Pandion haliaetus) and concludedthat their behaviour did not differentiate much from the controlled group.
Croatian laws and the laws of other countries do not contain provisions for the noise level in theprotected areas but they generally stipulate the noise level in the areas where people live andwork or they just state the maximum noise level allowed for planes or cars. Recently, one canfind the provisions aimed at controlling the noise level outside the urban areas. For instance,New South West EPA's Industrial Noise Policy recommends an acceptable noise level to 50 dBand maximum of 55 dB in the national parks.
Higher noise level during the terminal operation will last almost the whole day and in some partsof the proposed ornithological reserve, it will be up to 60 dB (predicted by noise modelling - seechapter 4.2.3.). Such noise level may have negative impact on birds communication becausebirds, except for awls, have hearing organs that cover the same frequency range and intensityof sounds like people (normal speaking level of people is 45 dB).
Due to the importance of the area near the project locality, survey of the noise impact on thebird population will be conducted with aim to detect maximum noise levels which must beconsidered in equipment selection. With adequate equipment selection and the implementation
Chapter 4, Page 44 /50

EA and EMP for New Cargo Bulk Terminal at the Port of Ploce EKONERG d.o.o.
of all noise mitigation measures (see EMP) it is expected that all possible technical measureswill be conducted to reduce noise impact on ornithofauna.
4.2.4.2. Light Impact
Birds possess various senses to determine their spatial orientation. They use a variety oforientational cues, including the position of the sun, the Earth's magnetic field, the patterns ofthe stars, the moon and topographical features. The orientation and navigation mechanisms ofnocturnal migrants are of particular interest, since it is these species which are predominantlyaffected by fatal entrapment by lighted structures. While evidence suggests that nocturnallymigrating birds make use of magnetic cues, there is much evidence that cues based on visionare at least as important as, and maybe more important than, magnetic cues. Visual cuesderived either from the celestial cues above or from the ground bellow, which is probably moreimportant, are necessary for the correct nocturnal orientation of birds.
Experimental work suggests that birds get entrapment by light sources, such as light-houses,floodlit obstacles, ceilometers, communication tower, or lighted buildings. They are apparentlynot attracted from a distance but rather enter the lighted area by chance and are then trappedby the artificial light. The light obliterates any background and consequently all birds can see isthe light so they lose all visual cues. Once inside a beam of light, birds are reluctant to fly out ofthe lighted area into the dark probably because they can not find a suitable path out ofilluminated area. They often continue to flap around in the beam of light until they collide withlighted obstructions or with each other or they get hurt from secondary causes such asexhaustion, predation and starvation.
The largest numbers of nocturnally migrating birds are affected under overcast or foggy weatherconditions or late at night when they tend to fly lower even though accidents occur consistentlyon clear nights as well. On foggy or overcast nights, minute moisture droplets refract light,greatly increasing the effective illuminated area and therefore arresting more migrants.Moreover, fledglings are probably more vulnerable to these situations due to inexperience.
Simple solutions exists which probably can reduce this problem. For example, Reed et al.(1985) have shown experimentally that the light shielding decreases the attraction of Newell'ssherwaters by nearly 40%. Jones and Francis (2003) state that narrower and less powerfulbeam brought about a drastic reduction in avian mortality brought by a lighthouse. They alsosuggest replacement of fixed or rotating beam systems to a flashing, intermittent or strobelights. The interruption of the light appears to allow the birds to disperse from the beam.
Much of the outdoor lighting waste energy in the following three ways: by excessive illumination,by unshielded or misaligned light fixtures and by inefficient lamp sources. With quality designsusing modern fixtures, light pollution can be considerably reduced, but the huge amounts oflighting required in some situations will always lead to some adverse impacts, even with thebest design. The reduction of light pollution is best accomplished with lamps with small andcontrolled light sources. Metal halide lamps have high efficiency and good colour rendering.
Chapter 4, Page 45/ 50

EA and EMP for New Cargo Bulk Terminal at the Port of Ploce EKONERG d.o.o.
High pressure sodium is widely used for outdoor and industrial applications. Its higher efficiencymakes it a better choice than metal halide for these applications, especially when good colourrendering is not priority. Low pressure sodium lamps are most efficacious light sources, but theyproduce poorer quality light and are less effective in directing and controlling a light beam.
All lights must be directed on the ground in the area where they are needed and fully shieldedwhich means that all light emitted is projected below the horizontal i.e. there is no up-light.Lights must be designed in a way to reduce light trespass to the protected area important forbird population. These measures will minimize light trespass and sky glow which affect birds,but also elimination of wasted light will save money, energy and resources.
Chapter 4, Page 46 /50

EA and EMP for New Cargo Bulk Terminal at the Port of Plo6e EKONERG d.o.o.
4.2.5. WASTE
Most of the waste produced during the Project operation will be the waste from ships. It willconsist of waste oil (hazardous waste) and oiled waste - oiled water, oiled materials (hazardouswaste), bilge water (hazardous waste), cargo residue, sewage water, and other waste such asfood leavings, food packaging material, etc. At the bulk cargo terminal itself oil-contaminatedwaste from machine maintenance is also expected, as well as other types of waste.
Pursuant to the By-law on Port Operation (Gazette 110/04), the port must have facilities forreceiving waste from ships. Likewise, according to the Law on Waste (Gazette 178/04 andsupporting legislation, each type of waste should be collected separately and should beadequately handled (collection in containers preventing scattering of waste, leakage, orevaporation of waste; containers with hazardous waste must be placed at a watertight andsheltered area provided with a drainage system and the like). The Port Authority can contractthose services with a legal entity (authorized concessionaire) which meets all the regulationsstipulated for collection and possibly pre-treatment of some types of waste at the location.
Currently, the services for receiving liquid waste generated on board ships are solved on acontract basis with the company Pomorski servis - Luka Ploce ltd (concession holder), which isauthorized for collection of hazardous waste by the Ministry of Environmental Protection,Physical Planning and Construction. Following the opinion of the current concession holder,current system for receiving waste in the area of Plo6e Port hardly meets the current situation.Below are the actions required before commissioning of the Project:
- Development of a Plan for reception and handling of waste from watercrafts and cargoresidue in the area of the Ploce Port; According to the By-law stipulating conditions for portoperation (Gazette 110/04), the Plan should contain the following:1. Assessment of the Port's need for waste receiving facilities with regard to the ships
regularly coming to the Port;2. Description of type and capacity of waste reception facilities in the Port;3. Instructions for use of waste reception facilities;4. Description of waste collection system;5. Procedure of reporting on inadequate operation of waste reception facilities;6. Procedure of consulting services to the port users, waste contractors, operators at the
port terminal, and other persons involved;7. Type and quantity of waste and cargo residue collected and treated from watercrafts;8. Summary of the relevant legislation and formalities for delivery;9. List of people responsible for the Plan implementation;10. Description of equipment for pre-testing (if any);11. Description of data storing method relating to actual use of waste reception facilities in
the Port, and12. Description of a method for disposal of waste and cargo residue from watercrafts.
- Installation of waste reception facilities for waste generated on board ships having sufficientcapacity for all types of waste. Provision of an adequate place for piling all types of waste
Chapter 4, Page 47 / 50

NA~, \- , - 3 e N
_ - ,, * ...:1
_ i, .v. ,ssessed imact durin
- t-t pjt constuct_, : .. a' -
imm !2 r
-. i. u,re
6 -t '-~~~~ AsesdApcdrn
the project construction ,_ . ____ 500m
4:.
Fiaure 4 .1.1-1-

II
6. ENVIRONMENTAL MANAGEMENT PLAN
i
EA and EMP for New Cargo Bulk Terminal at the Port of Plo6e EKONERG d.o.o.
16. The means and equipment for prevention of sea pollution and remedy of the pollutionconsequences shall be regularly maintained and completed.
17. Training and occasional check up of the employees' competence for application of themeasures stipulated by the maritime study and the contingency plan for environmentalprotection is required.
1.6. GENERAL MITIGATION MEASURES FOR ENVIRONMENTAL PROTECTION
18. Regular implementation of the environment monitoring program (see Section 6.2.)19. Regular reporting to the competent authorities (see Section 6.5.)
3. RESPONSIBILITY FOR IMPLEMENTATION OF MITIGATION MEASURES DURING THEPROJECT USAGE
- When negotiating the contract for the concession right for performance of some portactivities, any mitigation measures for environmental protection during the Project usageshall be included in the contractual obligation of the concession holder(s).
- The Port Authority of Ploce shall be responsible for control and supervision ofimplementation of contractual obligations of contractors during the Project usage.
4. COST OF MITIGATION MEASURES DURING THE PROJECT USAGE
- The price for setting up and/or implementation of the mitigation measures shall bedetermined at the later phases of design development.
5. CONTROL OF IMPLEMENTATION OF MITIGATION MEASURES DURING THEPROJECT USAGE
- According to the Article 64, Par. 2 of the Law on Environmental Protection (Gazette 82/94,128/99), the Inspection Office with the Ministry of Environmental Protection, PhysicalPlanning and Construction (Environmental Inspection) shall be responsible for control ofimplementation of mitigation measures identified during the environmental impactassessment process.
6.1.3. MITIGATION MEASURES FOR DECOMMISSIONING
Decommissioning of the Project usage is not foreseen. Effects on and mitigation measures forenvironmental protection in case of stopping the Project usage and/or removal of the Project willbe stipulated by a special study within the preliminary activities for stopping the Project usageand/or its removal.
Chapter 6, 6 / 15
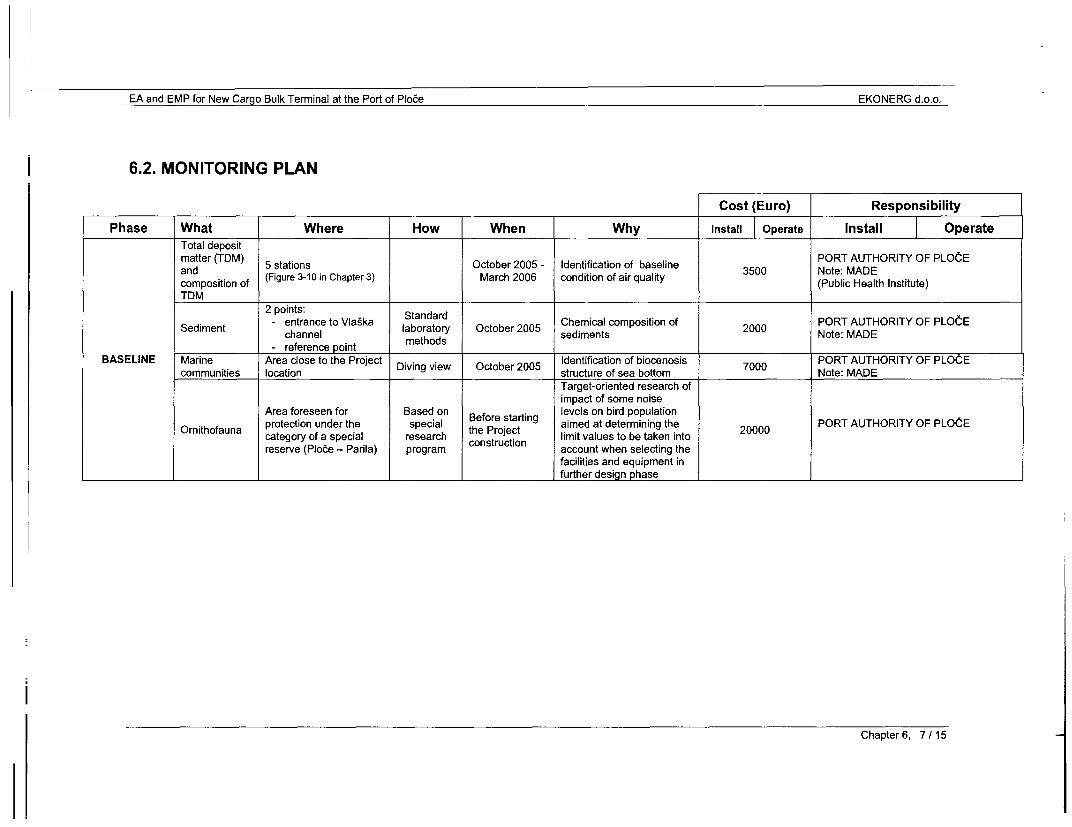
EA and EMP for New Cargo Bulk Terminal at the Port of Plode EKONERG d.o.o.
6.2. MONITORING PLAN
Cost (Euro) ResponsibilityPhase What Where How When Why Install |Operate Install Operate
Total depositmatter (TDM) 5 stations October 2005 - Identification of baseline PORT AUTHORITY OF PLOCEcomposition of (Figure 3-10 in Chapter 3) March 2006 condition of air quality 3500(Pubic Health Institute)TDM
2 points: StandardSediment - entrance to Vlaska laboratory October 2005 Chemical composition of2000 PORT AUTHORITY OF PLOCEchannel methods Octobert Note: MADE
- reference point methodsBASELINE Marine Area close to the Project Diving view October 2005 Identification of biocenosis 7000 PORT AUTHORITY OF PLOCEcommunities location Diigve coe 05 structure of sea bottom 700Note: MADE
Target-oriented research ofimpact of some noise
Area foreseen for Based on Before starting levels on bird populationOrnithofauna protection under the special the srting aimed at determining the 20000 PORT AUTHORITY OF PLOCEcategory of a special research the Project limit values to be taken Intocategry o a secia resarch construction accout whlen t seltaetingthereserve (Ploce - Parila) program account when selectng the
facilities and equipment inI further design phase
Chapter 6, 7 / 15

EA and EMP for New Cargo Bulk Terminal at the Port of Plote EKONERG d.o.o.
Cost (Euro) Res onsibilityPhase What Where How When Why Install Operate Install I Operate
-It depends on contractualTotal deposit matter (TDM) 5 stations Once a month obligations of contractors (someand composition of TDM (Figure 3-10 in Chapter 3) throughout the Air quality 7000 a year parts of the monitoring program canyear be included under the contractual
obligations of some contractors thusTotal suspended matter Once a month making them responsible for theirz (Suspended particles in Check points close to the zone 4 -j_ E throughout the Seawater quality 6000 a year implementation).o sea) year - The Port Authority of Plo6e will be
(.) ~~~~~~~~~~~~~~~~~~~~~~~~~~~~~~~~~~~~~~~~responsible for implementation ofN some parts of the monitoring
it Noise Check points .- Once every six Identification of actual noise 4000 program not contractually assignedc , X month level during construction to the contractors of some parts ofo o6 = construction.U . - Inspection office with the MEPPPCc will control the implementation of the
monitoring program determinedOrnithofauna Ploce -Parila Dunng Monitoring the impact of . 13000 during the environmental impactconstruction construction on orinthofauna assessment process.
- Qualified Institutions will conductmonitoring plan
Total deposit matter (TDM) 5 stations Once a month - It depends on contractualand composition of TDM (Figure 3-10 in Chapter 3) year obligations of contractors (someTotal suspended matter parts of the monitoring program can.D Acc. to the Water(Suspended particles in Check points close to the zone 4 License conditions Seawater quality 5000 a year be included under the contractualsea) C obligations of some contractors thuswU 2 points co Chemical composition of making them responsible for their( Sediment - entrance to Vlaska channel a Once in two years sediments 2000 implementation).mi - reference point _ Seawater quality - The Port Authority of Plo.e will be
.- C Once in the first Monitoring the imatof the responsiblefoimlenaonfZ OrnithfaunaProject usage on on itho fauna = 20000 some parts of the monitoring
usage ~~~~~~~~~~~~~~~~~program not contractually assignedWastewater quality 6 3000/ per to the contractors of some parts of(Parameters to be Ac otewtrsto osrcinu] stipulated by Water Discharge points o lcense ntin Seawater quality set of constrction.IL stipulated by Water 0 license conditions ~~~~~~~~~~~~measure Inspection office with the MEPPPCO License) -ments will control the implementation of the
Noise (chestnuckin poinits ined byogrm t Once in the first Included in monitoring ornitho- monitoring program determinedNoise(~contrctio moinitordeingd program year of the Project fauudd na moit n-rnth during the environmental impactbefrconstructiondmonitoringprogramusagefauaassessment process.before construction) - - Qualified Institutions will conduct
Marine biocenosis Area close to the Project location Diving view Once in three Identification of bio-Genosis 7000 monitoring plan.yearsCstructure of sea bottom
Chapter 6, 8 /15
EA and EMP for New Cargo Bulk Terminal at the Port of Plode EKONERG d.o.o.
6.3. INSTITUTIONAL STRENGTHENINGLegal entity responsible for operation of the bulk cargo terminal shall entrust the jobs ofenvironmental protection related to the bulk cargo terminal to a legal or physical entityunderlining the following, but basically it is the obligation of the Port Authority of Ploce to ensurethe following:- monitoring and collection at one place of the data relating to the mitigation measures for
environmental protection and implementation of the environmental monitoring programirrespective of who is responsible for implementation of the mitigation measures forenvironmental protection and the monitoring program, is the Port Authority of Ploce orauthorized concession holder(s),
- control of submission of data from the environmental monitoring program to the competentauthorities,
- organization and supervision of development of documentation relating to environmentalprotection and protection of nature,
- observance of legislations from the field of environmental protection and protection ofnature.
EQUIPMENT PROCUREMENT:
Selection of facilities and equipment for environmental protection will be carried out duringfurther phases of the Project. All mitigation measures for environmental protection shall beobserved when selecting the equipment and facilities.
TRAINING / STUDY TOURS:
A) If the legal entity operating the bulk cargo terminal engages another legal entity for theactivities relating to environmental protection at the bulk cargo terminal, the legal entity musthave an agreement for those activities issued by the Ministry of Environmental Protection,Physical Planning and Construction.The price of the environment-related activities: variable
B) If the legal entity operating the bulk cargo terminal engages a physical person for theactivities that involve environmental protection at the bulk cargo terminal (employee of the legalentity operating the bulk cargo terminal), such person should be additionally trained for the jobsrelating to the protection of the environment and nature by- seminars and workshops organized by the Ministry of Environmental Protection, Physical
Planning and Construction;- target-oriented seminars relating to environmental protection and port activities:Price: variable
CONSULTANCY SERVICES:
If necessary (assuming a physical person - an employee of the legal entity operating the bulkcargo terminal - performs the jobs of environmental protection). Price: variable
SPECIAL STUDIES:
If need be. Price: variable
Chapter 6, 9 / '15

EA and EMP for New Cargo Bulk Terminal at the Port of Plote EKONERG d.o.o.
6.4. SCHEDULE
MITIGATION MEASURES FOR ENVIRONMENTAL PROTECTION:
- The mitigation measures during the Project construction are carried out during the veryconstruction of the Project (operational part and establishment of the environmentalprotection system) and in the further phases of the Project (selection of facilities andequipment) in line with the Project Schedule of execution.
- The mitigation measures during the Project usage are carried out in accordance with theProject Schedule adapted to the requirements of each technological process requiringapplication of certain mitigation measures.
MONITORING PROGRAM FOR THE ENVIRONMENT CONDITION:
I Starting date Ending date FrequencyBASELINE (PRIOR TO THE PROJECT CONSTRUCTIONTotal deposit matter (TDM) and composition Stan er Prjc Ben of PsrojctingT Once a month
of TDM construction cntuto
Chemical composition of sediments Made in December 2005Identification of biocenosis structure of ea Made in October 2005bottom In vicinity of the Project location
Ornithofauna Prior to development of the mainin since iprot takesI _approximteye y
PROJECT CONSTRUCTIONTotal deposit matter (TDM) and composition Starting the Project End of Project Once a monthof TDM construction constructonTotal suspended matter Starting the Project End of the Project Inle withnth(Suspended particles in sea) construction construction ce ont
One implementation ofSediment Starting the Project End of the Project the monitoring programOrnithofau na construction construction since it takes
WasteaIerqualty usge Frthe approximately one year.Noise Once during construction
OPERATION (PROJECT USAGE)Total deposit matter (TDM) and composition Starting the Project Further Once i thof TDM usage FrhrOc ot
Up to 5 years frombthe binning of the
Total suspended matter Starting the Project Project usgen g oathe In line with the Water(Suspended particles in sea) usage concluseniong onf h License conditions
investigation duringthe first 5 years.
Sediment Starting the Project Further Once in two yearsusageOrnithofauna Once in the first year of the terminal operation
Wastewate qualityStarting the Projec |Frte In line with the WaterWastewater quality ~~~usage Iute License conditionsNoise Once in the first year of operation inclusive of monitoring ornithofaunaIdentification of biocenosis structure of sea Starting the Project Further Once in three yearsbottom In vicinity of the Project location usage
Chapter 6, 10 /15

EA and EMP for New Cargo Bulk Terminal at the Port of Plote EKONERG d.o.o.
6.5. INSTITUTIONAL ARRANGEMENTS
RESPONSIBILITIES FOR MITIGATION AND MONITORING:
- When negotiating a contract for development of design documentation and construction ofthe Project, all mitigation measures for environmental protection during construction shallbe included in the contractors' contractual obligations.
- The Port Authority of Plode will be responsible for control and supervision of contractualobligations of the contractors relating to the mitigation measures for environmentalprotection during the Project construction.
- When negotiating the contract for the concession for performance of some port activities,all mitigation measures for environmental protection during the Project usage shall beincluded in the contractual obligations of the concession holder(s).
- The Port Authority of Ploe will be responsible for control and supervision of contractualobligations of the concession holder(s) relating to the mitigation measures forenvironmental protection during the Project usage.
- The Port Authority of Plo6e will be responsible for Baseline Monitoring- Contractor(s) of each part of Project construction (for the part of the monitoring program
assumed by the contractor under the contract) and the Port Authorities of Ploce (for thepart of the monitoring program not contractually assigned to the contractors) will beresponsible for the monitoring program of environmental protection during the Projectconstruction.
- Concession holder(s) (for the part of the monitoring program assumed by the concessionholder under the contract) and the Port Authorities of Plo6e (for the part of the monitoringprogram not contractually assigned to the concession holder) will be responsible for themonitoring program of environmental protection during the Project usage.
ENVIRONMENTAL INFORMATION FLOW:
Responsibility for data submission:
- Data on the baseline monitoring program to the competent authority for environmentalprotection in the Dubrovadko-neretvanska County is submitted by the Port Authority ofPlo6e (after the EIA process).
- Data on the monitoring program during the Project construction is submitted by the legalentity competent for implementation of the monitoring program during construction(contractor and/or Port Authority of Plo6e) to the competent authority for environmentalprotection in the in the Dubrovadko-neretvanska County.
- Data on the monitoring program during the Project usage is submitted by the legal entitycompetent for implementation of the monitoring program during the usage (concessionholder(s) and/or Port Authority of Plode) to the competent authority for environmentalprotection in the in the Dubrovatko-neretvanska County.
Chapter 6, 111/15

EA and EMP for New Cargo Bulk Terminal at the Port of Plo6e EKONERG d.o.o.
ADDITIONAL:
Waste:- Once a year, the Port Authority of Ploce or the concession holder shall submit the data on
types and quantities of waste collected to the Government Office with the Dubrovacko-neretvanska County.
- Once a year, the Port Authority of Ploce or the concession holder shall inform the Ministryof Sea, Tourism, Traffic and Development about the condition of the facilities for waste andcargo residue reception from ships.
Accidents:- In case of an accident and in line with the provisions of the Contingency Plan for Accidental
Marine Pollution in the Republic of Croatia, Gazette 8/97, those who cause pollution ornotice an accident possibly causing pollution shall forthwith inform the County ReportingCenter, competent Port Authority Office, or the nearest police station about that event.
DECISION-MAKING CHAIN OF COMMAND FOR ENVIRONMENTAL MANAGEMENT(TAKING ACTIONS, AUTHORIZING EXPENDITURES, SHUTTING DOWN, ETC.):
- Pursuant to Article 64, par. 2 of the Law on Environmental Protection (Gazette 82/94,128/99) the inspection office with the Ministry of Environmental Protection, PhysicalPlanning and Construction is responsible for control of implementation of the mitigationmeasures determined by the environmental impact assessment process.
AIR:
- Pursuant to Article 43 of the Law on Air (Gazette 178/04), when the air quality of thesecond category is involved, a town council makes a plan of mitigation measures for airpollution. It is called a Plan of Mitigation Measures based on the air quality assessment(identification of places and exceeding the pollution levels, their duration and reasons forexceeding the pollution levels, general information about the area, types and assessmentof pollution, origin of pollution, and analysis of factors that caused exceeding of emissionlevels). The content of the Mitigation Plan is defined by the par. 2 of Article 43.The funds for development of the Mitigation Plan and implementation of the measures foremission mitigation from group sources are provided by the town budget. Polluter(stationary sources) is responsible for implementation and for financing the measures formitigation of pollutant emission to air stipulated by the Plan of Mitigation Measures.
- Pursuant to Article 44 of the Law on Air (Gazette 178/04), when the air quality of thirdcategory is involved, a town council makes a decision on development of a sanationprogram for a stationary source' and the time for making the program. Polluter isresponsible for development of the this program within the time stipulated in par. 2 of Article44. The representative body of the local self-government unit must approve the Polluter'ssanation program.
=Plan for air quality improvment
Chapter 6, 12/ 15

EA and EMP for New Cargo Bulk Terminal at the Port of Plote EKONERG d.o.o.
- Pursuant to Article 45 of the Law on Air (Gazette 178/04) referring to the area in which theair quality of third category is the consequence of emission from group sources (such astraffic, home furnaces and similar), an integral sanation program is developed. The towncouncil determines development and implementation of the integral sanation program andthe order of priority of its implementation. The funds for implementation of the sanationprogram are provided by the town budget.
WASTEWATERS:
- Pursuant to Article 184 of the Law on Waters (Gazette 107/95), if the water inspectoratefinds that the provisions of the Law on Waters or regulations based thereon are violated,the water inspector shall make a written report of the irregularities and deficiencies anddetermine the measures and time for their remedy.
NOISE:
- Pursuant to Article 23 of the Law on Noise Protection (Gazette 20/03), sanitary inspectorsof the Government Office in the counties and the sanitary inspectors of the Ministry ofHealth in line with their competence based on the Law on Sanitary Inspection areresponsible for controlling implementation of this Law and the regulations based thereon.The inspectors of the State Inspectorate are responsible for controlling implementation ofthe Law provisions referring to the noise in working premises in which noise is generatedduring the work process and the provisions of the Law referring to traffic of machines,means of transport, and equipment and devices with no data on acoustic power emittedunder certain conditions of use.
- Pursuant to Article 25 of the Law on Noise Protection (Gazette 20/03), competentinspection bodies from Article 23 of the Law are authorized for taking immediate measuresfrom Article 25, par. 1, items 4 and 5 of the Law if noise imission exceeds the highest levelsallowed on the basis of the measurement results by a sound meter of Class I according toHRN EN 60804.Competent inspection bodies can issue an order by which a legal or physical entity istemporarily restricted or prohibited to perform some activity for a period of maximum 8days. Competent inspection bodies can execute the order forthwith by sealing theequipment, devices, and premises or in some other adequate way if the noisemeasurement shows that the noise levels are exceeded.
- Article 25: In performing its inspection activities, the competent bodies from Article 23 ofthat Law are authorized
1. to order acoustic measurements in the premises of legal and physical entities using thenoise sources in the area where people live and work;
2. to order taking measures stipulated for protection against noise;3. to prohibit the use of constructed or reconstructed building if the measures of protection
against noise have not been implemented until they are implemented.
Chapter 6, 13/ 15

EA and EMP for New Cargo Bulk Terminal at the Port of Plode EKONERG d.o.o.
4. to prohibit the use of a noise source until the measures for protection against noise aretaken.
5. to prohibit performance of business and other activities whose noise disturbs rest period andnight peace if that cannot be achieved by the measures from item 4 of this Article.
6. to prohibit the use of machines, means of transport, devices and equipment with no data onacoustic power they emit under certain conditions of use.
7. to prohibit performance of business and other activities if they were started without adecision issued by a competent authority confirming that the measures for noise protectionhave been implemented.
The bodies from Article 23, par. 2 of that Law are authorized to take measures according to aspecial regulation.
Chapter 6, 14 /15

EA and EMP for New Cargo Bulk Terminal at the Port of Ploce EKONERG d.o.o.
7. REFERENCES
1. New Bulk Cargo Terminal at Port of Ploce, Volume Cl, Technological Elaborate; Tebodin,2005.
2. New Bulk Cargo Terminal at Port of Ploce, Volume C3, Maritime Elaborate; Tebodin, 2005.3. New Bulk Cargo Terminal at Port of Ploce, Volume C5, Sea Traffic / Structures; Tebodin,
2005.4. New Bulk Cargo Terminal at Port of Ploce, Volume C6, Berth; Tebodin, 2005.5. New Bulk Cargo Terminal at Port of Ploce, Volume C7, Storage Area, Roads, Railway;
Tebodin, 2005.6. 40 CFR Part 51 Requirements for Preparation, Adoption, and Submittal of State
Implementation Plans (Guideline on Air Quality Models); Proposed Rule, EPA, 2001.7. "Approved Methods and Guidance For the Modelling and Assessment of Air Pollutants in
New South Wales", NSW Environment Protection Authority, NSW EPA, 2001.8. Air Quality Modeling Guidelines, South Carolina Dept. Of Health & Environmental Control,
Bureau Of Air Quality, 2000.9. Brotons, L., S. Herrando (2001) Reduced bird occurence in pine forest fragments associated
with road proximity in a Mediterranean agricultural area. Landscape and Urban Planning 57,77-89.
10. Burger, J. (1998) Effects of motorboats and personal watercraft on flight behaviour over acolony of common terns (Sterna hirundo). The Condor 100, 528-534.
11. Butler, R.W. (1992) Great Blue Heron. No. 25 in A. Poole, P. Stettenheim, and F. Gill (eds.).The Birds of North America. American Ornithologists Union and Academy of NaturalScience, Philadelphia, Pennsylvania, USA.
12. Horus Wildlife Consultants. An avifaunal impact assessment for the proposed N21 (R300)Cape Town Ring Road Toll Project.
13. Meunier, F.D., C. Verheyden, P.Jouventin (2000) Use of roadsides by diurnal raptors inagricultural landscapes. Biological Conservation 92, 291-298.
14. Peris, S.J., M. Pescador (2004) Effects of traffic noise on passerine populations inMediterranean wooded pastures. Applied Acoustic 65, 357-366.
15. Reijnen, R., R. Foppen, C.T. Braak, J. Thissen (1995) The effects of car traffic on breedingbird populations in woodland. Ill. Reduction of density in relation to the proximity of mainroads. Journal of Applied Ecology 32, 187-202.
16. Rodgers, J. A. Jr. (2000) Buffer zone distances to protect foraging and loafing waterbirdsfrom disturbance by personal watercraft in Florida. Annual Report, Bureau of WildlifeDiversity Conservation.
17. Rodgers, J. A. Jr., S. T. Schwikert (2002) Buffer-zone distances to protect foraging andloafing waterbirds from disturbance by personal watercraft and outboard-powered boats.Conservation Biology 16, 1, 216-224.
18. Trimper P.G., N.M. Standen, L.M. Lye, D. Lemons, T.E. Chubbs, G.W. Humphries (1998)Journal of Applied Ecology, 35, 122-130.
19. Future noise policy - European Commission Green Paper, COM(96) 540, November 1996htto:l/euroDa.eu .int/en/record/areen/aP961 1 /noise.htm
Chapter 7, 1 / 4

ANNEX 1: ANALYSIS OF ALTERNATIVE TERMINAL OPTIONS
Master plan options
For the study, five options have been generated and considered:option 1: berth along the Vlaska channel, terminal on existing land;option 2.A: berth along the reclaimed land at the extension of the Vlaska channel;
* option 2.B: berth along the seaward side of the reclaimed land;* option 3: jetty with berthing line at 20 metre depth contour and long trestle bridge;
option 4: reclaimed area with enclosed port basin;* option 5: as option, 1, reduced areaAll options are presented in attachment.

OPTION 1:BERTH ALONG THE VLASKA CHANNEL
OPTION I
The first option is a terminal which is projected entirely on the existing land area and with thequayside along the Vlaska channel. This option is largely in line with options indicated by theClient during the kick-off meeting in Croatia albeit that the direction of the stockpiles has beenturned in view of the required length thereof. As a result of the great length of the stockpiles, theterminal area will cover the greater part of the area (called Dra6a) and its northern boundarycomes close to the area for which plans for a container terminal have been developed.
To avoid collisions between bulk vessels for the dry bulk terminal and liquid bulk vessels whichmoor at the jetty of the Energopetrol terminal, the berth is set back into the land. There is noland reclaiming involved in this option, but, even though the existing level is roughly equal to thelevel required for the terminal, a fill layer will be required to compensate for the settlements dueto the future loads.
On the other hand, dredging must be carried out to deepen and widen the existing channel toprovide safe access to the 150,000 DTW vessels (circa 20 metre). Because the dredgedmaterial is not suitable as fill material, it shall be disposed elsewhere at an approved location.
The berth is situated inshore and is therefore relatively sheltered against waves and currents. Inthis option the berth is adjacent to the nature reserve at the other site of the Vlaska channelwhat may cause environmental difficulties.

OPTION 2.A:BERTH ALONG THE RECLAIMED LAND AT THE EXTENSION OF THE VLASKA CHANNEL
UhugepX,O,, JU - 9
0NE0000 CNMUL Z71]Vo i = X , OGOn
OPTION 2A _
Compared with the previous option, in option 2A the stockpiles of the various types of dry bulkmaterial are projected parallel with the Vlaska channel in accordance with the options indicatedby the Client during the kick-off meeting in Croatia. However, due to the length required for thestockpiles, the land area between the Energopetrol premises and the existing coast line doesnot provide sufficient space and the terminal is partly located on land reclaimed from the sea.Sandy fill material will be required to create the new land and to heighten the existing land area.
Dredging works shall be carried out to deepen and widen the existing approach channel and tocreate the berthing pocket for the 150,000 DTW vessels. The dredged material shall bedisposed elsewhere at an approved location.
Due to the seaward shift of the berth location, the protection against waves and currents will beslightly less.

OPTION 2.B:BERTH ALONG THE SEAWARD SIDE OF THE RECLAIMED LAND
P// ~EXTEISMR Ard/t'A
TWNHIN COUCLE
GED CHAMMEL
0 500E OPTION 2B _ _ _
The major difference between option 2.A and option 2.B is that the quay wall in option 2.B isshifted seawards. The main reason to that is the increase of the safety of navigation becausethe liquid bulk carriers do not have to sail along the dry bulk carriers within a confined channel.The berth location is not protected against waves and tides.

OPTION 3:JETTY WITH BERTHING LINE AT 20 METRES DEPTH CONTOUR AND LONG TRESTLEBRIDGE
orrio 3_
As opposed to dredging, it is also an option to bring "berth to the (existing/natural) depth of 20metres". This can be done by building a jetty close to the 20 m depth contour as well as a trestlebridge to connect this jetty to the shore where the storage yard is situated. In this option, thecapital dredging for creating sufficient water depth for the berth of the bulk terminal as well asthe periodic maintenance dredging will be avoided.
However, this option also has insurmountable disadvantages. The relatively narrow jetty offersno possibility for direct transfer of unloaded cargo to an area directly behind the (quay) crane.Such storage option would mainly be required in case of emergencies. It is also impossible tobring the existing equipment into action at the quayside. The system is less flexible because ofthe long transport distance from the jetty to the hinterland and the trestle bridge forms a physicbarrier in the waterway. Because the jetty is sticking out quite far into the sea, the chance ofoperational downtime because of the exposed location increases.
During the visit to the Netherlands, the Client indicated that especially the 'emergency storage'and the input of existing equipment are regarded as essential operational requirements. It hastherefore been decided that this option will not be worked out and considered any further.

OPTION 4:RECLAIMED AREA WITH BERTH ALONG THE NORTHERN SIDE
/VI
- -~ ~ ~~~ ___.11,_,
-Ci5L
OPTION 4
This option resembles options 2.A and 2.B but in this case the berth is situated along thenorthern side of the terminal area. The basic idea behind this option is that a future portextension could be projected north of the dry bulk terminal in a similar manner as the dry bulkterminal so that a port basin is created. The basin provides somewhat more shelter againstwaves and currents and is possibly less affected by sedimentation.
Besides the basin, also a channel to connect the basin to sufficiently deep water shall bedredged for the 150,000 DWT vessels.

OPTION 5:BERTH AND STACK ALONG THE VLASKA CHANNEL
OPTION 5
This option was proposed by the clients and is similar to option 1 however with a different stackorientation. The advantages of this option is the more technologically compact solution, bettertaffic connections, less endangering of the area aimed for the development of other projects.
To meet the requirements for the storage in tonnes, different stackers and reclaimers arenecessary in this option to realize a more compact and higher storage volume on a smallerarea. Bigger stackers results in wider stacks and thus in a more efficient use of the availablespace. The type of equipment and effect on the costs will be worked out in phase B.
The bulk terminal is situated closer to the liquid bulk terminal than in the other options.

FEASIBILITY REPORT
1. INTRODUCTION
In the following, the options will be compared by means of a multi-criteria analysis. Because ofmajor operational drawbacks, option 3 will not be included in this evaluation. The criteria havebeen selected such that they are (as far as possible) independent from each other so thatcertain influences are not covered via more than one criterion. Option 5 has the sameevaluation criteria as option 1. Difference is in the stack layout, which is at this stage of theproject not of influence in the costs.
2. EVALUATION OF FOUR REMAINING OPTIONS
2.1. General
In the table at the end of this section, the various options have been given a qualitative score foreach criterion. In the following the scores per aspect will be broadly explained.
2.2. Background of the scores
Investments
The investments are largely deternined by three components:* dredging works: all options require dredging works, however, options 1, 2.A and 4 require
dredging works which are in the same order of magnitude (1.8 million m3, 1.2 million m3 and1.4 million m3 respectively) whereas for option 2.B the volume of dredging will exceed 3million m3 . The (relative) score of option 4 is therefore lower than for the other three.
* equipment: the bulk handling equipment will be similar for all options;* civil structures: the investments can be divided over two civil components, viz. the quay wall
and the stockyard. It is expected that the quay wall will cost more or less the same for alloptions because the retaining height and the topside loads will be the same and thefoundation level of the piles will be the same. The preparation of the stockyard will require fillmaterial: because option 1 will be constructed at the existing land without reclamation, it willrequire less fill material and less efforts to control the settlements (e.g. vertical drainage,pre-loading, etc.).
Logistics
* storage connection : in case of option 1 and 2B the connections to the storage yard areexcellent and short. From the quay conveyor a direct connection is made to the conveyorsbelt systems in the storage yard. In the other options 2A and 4 larger quay conveyors areused. This however offers advantages with respect to storage of product on the quay.Overall the score for the various alternatives is equal.
* flexibility / extension of stockyard: in case op option 1, there is limited space left forstockyard extension on the existing land so that an extension will almost immediately

require reclamation works. Options 2.A and 2.B can be extended by constructing asufficiently wide strip at the northern side of the first terminal development. This strip will belocated partly on existing land and partly in the sea. In case of option 4 a northwardextension like for the options 2 is not possible as this will interfere with the quay. Extensionpossibilities for option 4 are therefore a bit troublesome.extension of berths: in case of option 1, a second berth will surely require a seawardextension. To add a second berth in option 2.A will be relatively easy as there is still spacealong the terminal area further inward the Vlaska channel. A second berth in option 2.B willalso require an extension of the terminal area in northerly direction or, alternatively, a berthat the same location as in option 4, however, a continuous berth line provides moreflexibility and is therefore preferable. The same applies to option 4 where a second berthcould be added at the position of the berth in option 2.B, however, apart from theoperational restrictions, also a considerable investment shall be made in the dredgingworks.rail connections: in all options a full length train of 234 meters can be unloaded on the quayarea. Further more enough length and space are available for train loading. All optionsscore equal.
Environmental and nautical conditions
* downtime: in the case of option 1 the berth is situated along the banks of the VlaskaChannel and is well-sheltered. In both of the options 2.A and 2.B there is virtually noprotection of the berth location, however, because the wave climate and the currents aremoderate and bulk handling is not very sensitive to some vessel movements, the score ofthese two options is still neutral (0). The berth location of option 4 offers some protectionagainst waves and currents from southerly directions but is still exposed to westerlyinfluences. Waves from the west will however not have a big influence on the mooredvessel because the wave direction and the orientation of the vessel's longitudinal axis arethe same.
* safety: the score of options 1 and 2.A is negative because the liquid bulk tankers have topass by the moored dry bulk carriers. Even if the appropriate safety distances will beapplied, the risk remains. In option 2.B the berth is located farther away from the route ofthe tankers and in option 4 the berth is at a safe distance from the liquid bulk operations.
. dust emission: option 1 and 2A the discharge of product from the ships takes place at thechannel opposite the natural area located on the other side. In the other options moredistance is present between unloading and the preserved area. However in option 1 thedust emission to this area from the storage yard will be less than with the other options.This due to the prevailing wind direction and the small exposed front area of the stock yard.Overall options 1, 2B and 4 score equal (0) and option 2A a minus
. cut and fill balance (dredging/fill): because the dredged material cannot be used for filling ofthe site, sand shall be brought from another source and cut and fill balance cannot beachieved. Because the required amount of fill material in case of option 1 is smaller than forthe other three options (which comprise a reclamation) and because the dredging volume isrelatively small, option 1 scores slightly better than the rest on this criterion.

Operational costs
maintenance dredging: even though a prediction of the sedimentation volumes is hard tomake with the available information, it is to be expected that the option with the largestvolume of capital dredging will also generate the largest volume of maintenance dredging.Option 2.B therefore has a lower score than the other three (in line with the score for thecriterion 'investments: dredging').maintenance civil structures: the residual settlements when the terminal is located at theexisting land area (option 1) are expected to be less than when the terminal is (partly) at areclamation. Furthermore, differential settlements are likely to occur betwee the termialsection at the reclamation and the terminal section at the existing land. Settlements areexpected to require maintenance the more since the quay are will be supported by pilesand will not settle. Therefore, option 1 scores (relatively) higher than the other options.maintenance equipment: in option 2A, 2B and 4 the storage yard and its equipment isplaced largely on new land with fill material. Settlement of the storage yard and itsequipment can be expected over a long period. This means that for instance supports forconveyors and rails for stackers should be readjusted more often. Maintenance costs willcertainly be higher with these options and option 1 is to be preferred.
Construction schedule
time until completion: the Client has expressed that the dry bulk terminal shall be operational,as soon as possible'. Therefore, the option that can be realized in the shortest time span, ispreferable. In this case, option 1 scores best because the existing land can be prepared forfurther construction works in the shortest time span because the volume of fill material issmallest, all preparations can immediately be made onshore (and do not have to wait formobilisation of floating equipment, the construction of bund walls, etc.), and the settlementscan be achieved fastest.
2.3. Evaluation of alternatives
Conclusions
From Table 1 it can be cocluded that option 1 (and 5) results as the most attractive options.
* Option 1 less dredging compared to option 2, therefore the preferred alternative of these 2.* Option 4 is not economic compared to 1 en 2, therefore no advised.
Option 5 has the same evaluation criteria as option 1.
Remarks
The safety of navigation ion Vlaska Channel will be further addressed, by evaluating the variousambient conditions, arrival and departure procedures, the required aids to navigaion, vicinity ofthe nature reserve, etc. Another issue is the application of measured to minimize the dustemission during transhipment and all terminal operations.
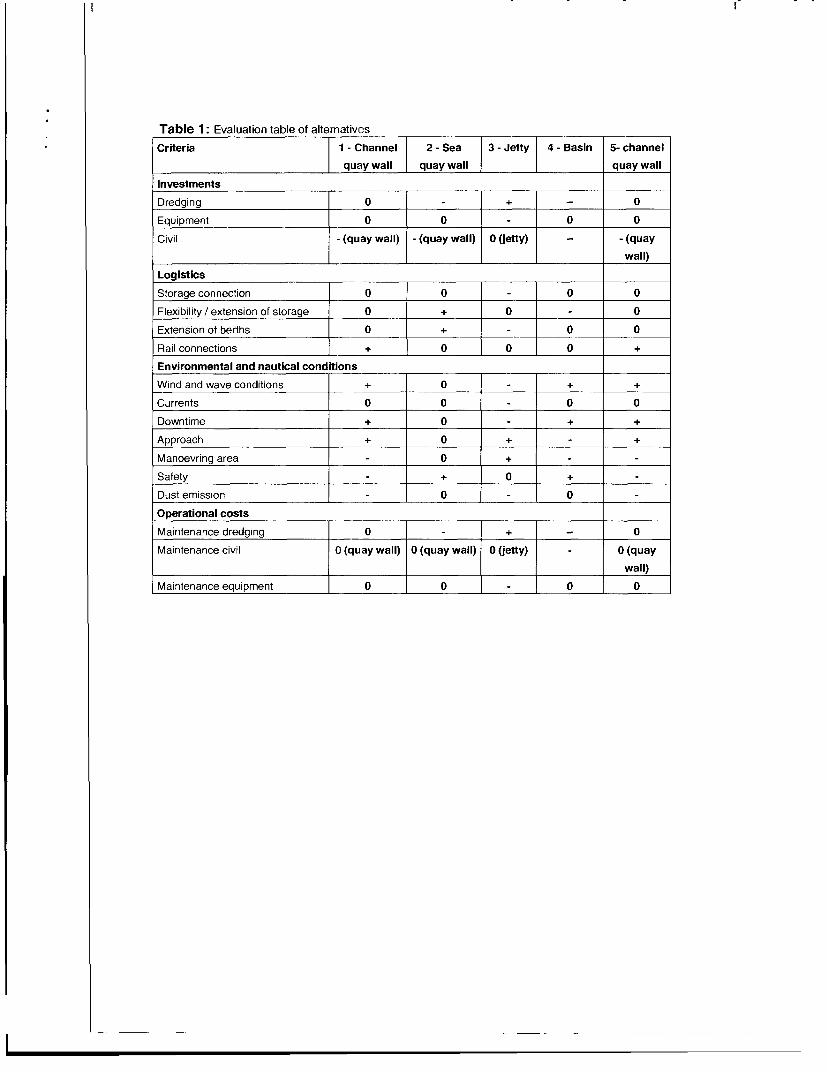
Table 1: Evaluation table of alternativesCriteria 1 - Channel 2 - Sea 3 - Jetty 4 - Basin 5- channel
quay wall quay wall quay wallInvestmentsDredging 0 - + -- 0Equipment 0 0 0 0Civil - (quay wall) - (quay wall) 0 (jetty) -- - (quay
wall)LogisticsStorage connection 0 0 - 0 0Flexibility/ extension of storage 0 + 0 0Extension of berths 0 + - 0 0Rail connections +O 0 0 L +Environmental and nautical conditionsWind and wave conditions + 0 - + +Currents 0 0 0 0Downtime + 0 + +Approach + 0 + +Manoevring area 0 +Safety + 0 +Dust emission - 0 0 -
Operational costsMaintenance dredging 0 - + - 0Maintenance civil 0 (quay wall) 0 (quay wall) 0 (jetty) 0 (quay
wall)Maintenance equipment 0 0 0 0