EJTIR Issue 17(3), 2017 ISSN: 1567-7141 faculteit/Afdelingen... · EJTIR Issue 17(3), 2017 pp....
27
EJTIR Issue 17(3), 2017 pp. 384-410 ISSN: 1567-7141 tlo.tbm.tudelft.nl/ejtir Findings from measuring door-to-door travellers’ travel satisfaction with traditional and smartphone app survey methods in eight European cities Yusak O. Susilo 1, Roberto Abenoza 2 KTH Royal Institute of Technology, Stockholm, Sweden Andree Woodcock 3 Coventry University, Coventry, United Fotis Liotopoulos 4 SBOING, Thessaloniki, Greece Andre Duarte 5 VTM - Consultores em engenharia e planeamento lda, Lisboa, Portugal Jane Osmond 6 Coventry University, Coventry, United Apostolos Georgiadis 7 SBOING, Thessaloniki, Greece Gabriela Rodica Hrin 8 Integral Consulting R&D, Bucharest, Romania Patricia Bellver 9 ITENE- Instituto Tecnológico del Embalaje, Transporte y Logí stica, Valencia, Spain Federico Fornari 10 Eurokleis S.R.L., Rome, Italy Virginie Tolio 11 FIA – Federation Internationale de I’Automobile, Brussels, Belgium Eileen O’Connell 12 Interactions Ltd, Dublin, Ireland Ieva Markucevičiūtė 13 Smart Continent Ltd, Vilnius, Lithuania Marco Diana 14 Politecnico di Torino, Torino, Italy 1 Teknikringen 72, 100 44 Stockholm, Sweden. T: +46(0) 8790 9635 F: +46(0) 8790 7002 E: [email protected] 2 Teknikringen 72, 100 44 Stockholm, Sweden. T: +46(0) 8790 6848 F: +46(0) 8790 7002 E: [email protected] 3 Puma Way, CV1 2TT Coventry, UK. T: +44 (0) 24 7663 8349 E: [email protected] 4 Karamanli 124, 57008 Diavata, Thessaloniki, Greece T: +30 2310 784608 E: [email protected] 5 Av.25 de Abril 23, 2795197 Linda-a-velha, Portugal T: +351 21 415 9600 F: +351 21 415 96 08 E: [email protected] 6 Priority St., CV1 5FB Coventry, UK. T: + 44 (0) 24 7765 7688 E: [email protected] 7 K. Karamanli 124, 57008 Diavata, Thessaloniki, Greece T: +30 2310 784608 E: [email protected] 8 Popa Soare 16, Bucharest, Romania T: +40 02 1210 0303 F: +40 02 1211 4589 E: [email protected] 9 Albert Einstein 1, 46980 Paterna, Spain T: +34 961 820 000 F: +34 961 820 001 E: [email protected] 10 Via Romeo Romei, 27, 00136 Roma, Italy T: +39 06 4425 4074 E: [email protected] 11 Rue de la science 41, 1040 Brussels, Belgium. T: +32 2235 0721 E: [email protected] 12 Beach Court, Kilcoole, Ireland. T: +353 (01) 6461 671 E: [email protected] 13 Kareiviu street 19,09133 Vilnius, Lithuania T:+370 52196679 E: [email protected] 14 C.so Duca degli Abruzzi 24, 10129 Torino, Italy. T: +39 0110905638 E: [email protected]
Transcript of EJTIR Issue 17(3), 2017 ISSN: 1567-7141 faculteit/Afdelingen... · EJTIR Issue 17(3), 2017 pp....

EJTIR Issue 17(3), 2017
pp. 384-410 ISSN: 1567-7141
tlo.tbm.tudelft.nl/ejtir
Findings from measuring door-to-door travellers’ travel satisfaction with traditional and smartphone app survey
methods in eight European cities
Yusak O. Susilo1, Roberto Abenoza2
KTH Royal Institute of Technology, Stockholm, Sweden Andree Woodcock3
Coventry University, Coventry, United Fotis Liotopoulos4
SBOING, Thessaloniki, Greece Andre Duarte5
VTM - Consultores em engenharia e planeamento lda, Lisboa, Portugal Jane Osmond6
Coventry University, Coventry, United Apostolos Georgiadis7
SBOING, Thessaloniki, Greece Gabriela Rodica Hrin8
Integral Consulting R&D, Bucharest, Romania Patricia Bellver9
ITENE- Instituto Tecnológico del Embalaje, Transporte y Logística, Valencia, Spain Federico Fornari10
Eurokleis S.R.L., Rome, Italy Virginie Tolio11
FIA – Federation Internationale de I’Automobile, Brussels, Belgium Eileen O’Connell12
Interactions Ltd, Dublin, Ireland Ieva Markucevičiūtė13
Smart Continent Ltd, Vilnius, Lithuania Marco Diana14
Politecnico di Torino, Torino, Italy
1 Teknikringen 72, 100 44 Stockholm, Sweden. T: +46(0) 8790 9635 F: +46(0) 8790 7002 E: [email protected] 2 Teknikringen 72, 100 44 Stockholm, Sweden. T: +46(0) 8790 6848 F: +46(0) 8790 7002 E: [email protected] 3 Puma Way, CV1 2TT Coventry, UK. T: +44 (0) 24 7663 8349 E: [email protected] 4 Karamanli 124, 57008 Diavata, Thessaloniki, Greece T: +30 2310 784608 E: [email protected] 5 Av.25 de Abril 23, 2795197 Linda-a-velha, Portugal T: +351 21 415 9600 F: +351 21 415 96 08 E: [email protected] 6 Priority St., CV1 5FB Coventry, UK. T: + 44 (0) 24 7765 7688 E: [email protected] 7 K. Karamanli 124, 57008 Diavata, Thessaloniki, Greece T: +30 2310 784608 E: [email protected] 8 Popa Soare 16, Bucharest, Romania T: +40 02 1210 0303 F: +40 02 1211 4589 E: [email protected] 9 Albert Einstein 1, 46980 Paterna, Spain T: +34 961 820 000 F: +34 961 820 001 E: [email protected] 10 Via Romeo Romei, 27, 00136 Roma, Italy T: +39 06 4425 4074 E: [email protected] 11 Rue de la science 41, 1040 Brussels, Belgium. T: +32 2235 0721 E: [email protected] 12 Beach Court, Kilcoole, Ireland. T: +353 (01) 6461 671 E: [email protected] 13Kareiviu street 19,09133 Vilnius, Lithuania T:+370 52196679 E: [email protected] 14 C.so Duca degli Abruzzi 24, 10129 Torino, Italy. T: +39 0110905638 E: [email protected]

EJTIR 17(3), 2017, pp.384-410 385 Susilo et al. Findings from measuring door-to-door travellers’ travel satisfaction with traditional and smartphone app survey methods in eight European cities
This study investigates how different travel satisfaction survey methods influence the reported
level of door-to-door travel satisfaction among travellers. The travel satisfaction measurement survey tools tested consisted of two types of smartphone applications (a satellite navigation app and a game app), an on-line survey, a paper-based semi-structured questionnaire and a focus group. Each of the measurement tools comprised of a similar set of questions, but in different formats, aimed at exploring the pros and cons of each tool among different group of travellers. In total, 5,275 valid responses were collected during the survey period from eight European cities and five FIA (Federation Internationale de I’Automobile) national motorist networks. The analysis results, with ordered logit model of travellers’ reported overall satisfaction, showed that the travel satisfaction reported by different survey methods and different travel modes and user groups, correlated with distinct groups of key determinants. The relationship between and within these key determinants, however, was far from straight forward. Some were more complex than others. Some issues, such as parking availability and security, that are mostly discussed by policy makers and users may not be the ones that directly correlate with the users’ overall travel satisfactions. Consistent with previous studies, the travellers’ mood and previous experience influenced the reported overall journey satisfaction.
Keywords: Door-to-door journey, travel satisfaction, multimodal measurement, smartphone app survey, on-line survey, paper-based survey.
1. Introduction
Providing an accessible and inclusive transport service for all is important to ensure that people are not excluded from reaching places of employment, health, education and leisure services, and – simultaneously - ensuring equal life opportunities for diverse communities. However, different travellers have different needs and priorities and these influence their satisfaction relating to various quality factors of provided services. In order to provide a transport service that meets individual travel needs, it is important to understand the factors that underlie travel satisfaction for different individuals. Thus, in the last decade there have been a surge of studies which investigate various aspects of passenger travel experience (e.g. Friman and Gärling, 2001; Stradling et al., 2007; Diana, 2008; Páez and Whalen, 2010, Susilo et al., 2012; Susilo and Cats, 2014; Cats et al., 2015; Abenoza et al., 2016).
Stradling et al. (2007), for example, found that non-instrumental variables such as cleanliness, privacy, safety, convenience, stress, social interaction and scenery play a significant role in influencing traveller satisfaction with journeys. Also, punctuality and reliability are likely to be at the top of a commuter’s priority list (DfT, 2011), while safety, reliability and service frequency are particularly important for women (Tranter, 1995). Although adults on a low income will share the same broad travel needs as the general population, previous studies show that this group are associated with a lower level of car-ownership (e.g. Giuliano and Narayan, 2003; Hine and Mitchell, 2003), more walking and frequent use of public transport, and are less likely to chain non-work trips to their commute trips than their higher socio-economic group counterparts (Clifton, 2003; BMRB, 2004, etc.). For older people, mobility is much more closely connected with health and well-being (Banister and Bowling, 2004): mobility and the ability to get out of the home are essential to their quality of life (Farquhar, 1995; Andrews et al., 2012). Further, being unable to drive/travel independently is one of the strongest predictors of increased symptoms of depression among older people (Marottoli et al., 1997), and an individual’s ability to use the transportation system freely has long been defined as one of the seven important areas in the Instrumental Activities of Daily Living (IADL) of the elderly (Fillenbaum, 1985).
Despite the complexities that underlie an individual’s activity-travel participation and the travel satisfactions that relate to them, previous studies have focused on a particular travel mode
EJTIR 17(3), 2017, pp.384-410 386 Susilo et al. Findings from measuring door-to-door travellers’ travel satisfaction with traditional and smartphone app survey methods in eight European cities
and/or at a particular trip purpose, and have often ignored the impact of access and egress legs on overall journey satisfaction. This may lead to an inaccurate evaluation of service provision by public transport operators (and authorities) and can undermine the quality of interchanges and last-mile facilities on passenger overall travel satisfaction. Eurobarometer (2013) shows, among railways travellers in 26 EU member states, that the relationship between railway journey satisfaction and the passengers’ satisfaction with the railway station is not linear. Often stations are simply regarded as change points - places where passengers have to change as quickly and efficiently as possible from one mode of transport to another. However, some authorities, such as Netherlands Railways, have the view that stations are places that need to be transformed into dynamic urban portals that not only facilitate a speedy transfer but also make the stay at the station more enjoyable (van Hagen, 2015). Thus, while passengers want travel to be safe, frequent, and reliable, Iseki et al. (2007) found that security and interchange design and maintenance (such as visibility, the absence of graffiti, and the presence of a seating area, restroom, and shelter) significantly influence passengers’ travel satisfaction. Muconsult (2003, cited by van Hagen, 2015) estimated that passenger satisfaction towards stations determines about 25% of the score awarded to the total train journey satisfaction.
Beside the lack of comprehensiveness in measuring journey satisfaction, there is also a lack of knowledge on how different travel satisfaction method measurements influence the reported level of satisfaction. Susilo and Cats (2014), for example, found that there is a systematic tendency to report higher satisfaction levels immediately after the completion of a public transport or cycling trip stage when compared with a retrospective satisfaction report. This is consistent with findings based on a similar question asked years after a trip occurred (Pedersen et al., 2011). Similarly private car travellers reported significantly lower travel satisfaction levels in retrospective reports.
Therefore, from the above discussion it is deduced that the data collected by different survey methods may yield distinct answers. The fact that the method used can affect the quality of the responses and bring about some other bias (response rate, non-response bias, etc.) associated with the characteristics of the data collection tool, makes it difficult to define the ground of truth. Wiersma (2003) noted other biases such as coverage (for online), low response rates (for online and phone surveys), interviewer effects (for phone and in-person surveys), display effects (for online surveys). Recent research has compared the external and internal validity of the most technologically advanced survey methods - online, sms- with the most conventional methods - paper based, face-to-face, phone. However, the results of these studies cannot be generalized (van De Looij-Jansen and de Wilde, 2008) and found that the survey methods have a negligible effect on the results (Wells, 2014; Belisario, 2015). Nevertheless, the influence of very novel tools such as smartphone apps has not yet been studied.
In order to contribute to this research gap, this study aimed to investigate how different travel satisfaction survey methods (during and post-trip) influence the reported level of door-to-door travel satisfaction among travellers. The travel satisfaction measurement survey tools tested consisted of two types of smartphone applications (a satellite navigation app and a game app), an on-line survey, a paper-based semi-structured questionnaire, and a focus group. Each of the measurement tools comprised of a similar set of questions, but in different formats, aimed at exploring the pros and cons of each tool among different group of travellers.
In the next section, we will describe the survey and the tool design and the data collection activities. The descriptive and correlation analyses of the collected datasets from 8 different cities and five FIA’s national networks are then presented. This is followed by multivariate analyses which are employed to measure the impacts of different survey methods towards the overall travel satisfaction reported. The article closes with a summary section.

EJTIR 17(3), 2017, pp.384-410 387 Susilo et al. Findings from measuring door-to-door travellers’ travel satisfaction with traditional and smartphone app survey methods in eight European cities
2. METPEX project and survey description
This study was part of METPEX FP7 EU project (www.metpex.eu, METPEX, 2012), which aimed to develop a Pan-European standardised measurement tool to measure passenger experience across whole journeys, whilst taking into account wider human socio-economic, cultural, geographic and environmental factors.
The early stage of the research comprised desktop research, stakeholder consultation and a small size experiment among approximately 550 respondents across 8 different European cities. The results were used to identify the variables that could be used to better monitor and evaluate the passenger experience during journeys by public and active forms of terrestrial transport, with special attention toward the needs of vulnerable groups, such as older people, lower income groups, rural dwellers, children and those with both physical and cognitive disabilities (METPEX, 2013; Cats et al., 2014; Susilo et al., 2015, 2017; Susilo and Cats, 2014). Based on this, a set of questionnaires were developed and consisted of the five following sections:
• Individual attributes (i.e. socio-demographic, mobility behaviour)
• Attitudes (i.e. travel preferences, mobility-related opinions)
• Contextual variables (i.e. temporal, weather conditions, trip purpose, subjective well-being indices)
• Specific user groups and travel modes specific questionnaires
• Travel experience factors (e.g. availability, travel time components, information provision, reliability, way-finding, comfort, appeal, safety and security, customer care, price, connectivity, etc.)
The questionnaire was then translated into 5 different survey methods: 1. Paper-and-pencil 2. On-line questionnaire 3. Real-time questionnaire, embedded in the route navigation (SbNavi) app for IOS and
Android (Figure 1). 4. Real-time questionnaire, embedded in specially dedicated Android Game app (Figure 1) 5. Focus group
The detailed content descriptions and design considerations of these five tools can be seen in METPEX (2014), Susilo et al., (2017) and Tovey et al. (2017). These five different tools have their own advantages and disadvantages in terms of different target groups and technological support systems. All measurement tools consisted of a similar set of questions (with the focus groups asking fewer but more detailed questions relating to specific user groups, whereas the game app did not ask the specific questions related to the user groups and travel modes). For each specific user group and travel mode combination, each respondent was required to answer 50-75 questions, which required an individual to spend approximately 20-30 minutes to complete the whole questionnaire. The survey tools were available in 10 different languages - English, French, German, Spanish, Italian, Greek, Swedish, Lithuanian, Polish and Romanian.

EJTIR 17(3), 2017, pp.384-410 388 Susilo et al. Findings from measuring door-to-door travellers’ travel satisfaction with traditional and smartphone app survey methods in eight European cities
Figure 1. a) Snapshot of navigation app interface b) Snapshot of Game app interface
The data collection was carried out in eight different European cities - Bucharest, Coventry, Dublin, Grevena, Rome, Stockholm, Valencia and Vilnius, and five FIA motorist networks (Germany, Poland, France, Spain and the United Kingdom), between September and November 2014. The trial sites included five capital cities with a municipal population size ranging from 0.5 (Vilnius) to 2.8 million (Rome), a large (Valencia – 0.8mill.) and medium (Coventry 0.3mill.) city and a small rural town (Grevena 15.000 inhab.). All the capital and large cities have a good public transport system served by bus, tram or trolleybus, commuter train and even metro (Rome, Stockholm, Valencia) and boat (Stockholm). The most poorly covered are Coventry served by bus and train while Grevena had one urban bus and inter-city buses.
The recruitment method varied depending on the city and the collection method. The size and proportion of the target groups were calculated based on the socio-demographic and travel mode distribution of those groups in each city. The standard random number generator method with the following parameters was adopted: confidence level (95%), confidence interval (3-5%), % picking a choice (p=50%). In some cities, economic incentives were offered to attract more respondents, for example, Stockholm offered a cinema ticket whilst Coventry offered free coffee and chance to win an iPad. In other cities, stakeholders’ and membership networks (e.g. FIA, Bucharest, Dublin) were used to promote the survey. There were also cities which developed a strong media campaign to encourage online survey participation (e.g. Valencia). Others received strong support from their local stakeholders and were able to carry out surveys on board or in stakeholders’ premises - for example, Dublin carried out on-board surveys and Coventry was allowed to set up a stand on a main railway station and coffee shop.
In total, 6,360 completed responses were collected during the survey period. After the data had been cleaned and double checked for consistency and reliability across different sections, the total number of valid samples was 5,275 (See Table 1 below). The results were 984 responses from the paper-and-pencil survey, 3,395 responses from the on-line web survey, 231 responses from the SbNavi app, 414 responses from the game app and 251 responses from the focus group method.
As can be seen from Table 1, the traditional on-line (64%) and the paper-and-pencil (19%) methods attracted the highest number of respondents (total 83%), whilst the more technologically driven methods; game app (8%) and SbNavi (5%), attracted the lowest response rates. This low response rate, however, varied in different countries, and it is important to note that the Game app contained a fewer number of questions, which were less complex and thus more user friendly, than the SbNavi app. This may be why the former attracted a higher number of respondents than the latter. Overall, although there was a consistent agreement among respondents and surveyors that the tools were attractive, the questionnaire was found to be too Table 1. Summary of valid number of respondents, by used survey methods

EJTIR 17(3), 2017, pp.384-410 389 Susilo et al. Findings from measuring door-to-door travellers’ travel satisfaction with traditional and smartphone app survey methods in eight European cities
City Number of
collected response
Paper and Pencil Web On-line Survey
SbNavi App
Game App
Focus Group
Bucharest 411 51 281 9 46 24 Coventry 336 207 86 6 28 9 Dublin 467 146 284 8 29 0 Grevena 267 124 57 3 2 81 Rome 729 143 501 0 22 63 Stockholm 842 144 226 176 222 74 Valencia 501 17 430 13 41 0 Vilnius 247 152 55 16 24 0 FIA networks 1475 0 1475 0 0 0 TOTAL 5275 984 3395 231 414 251
long and complicated. It was also apparent from the survey feedback that - despite a surge in technology adoption and penetration in Europe in terms of smartphones in the last several years - the acceptance of a smartphone app as a survey tool was low. There were also significant privacy and data protection concerns expressed among potential respondents (e.g. Rome) in terms of installing an unknown app. In addition, a number of causes related (intrinsic) and unrelated (external) to the apps were behind the limited number of responses collected via smartphones. The intrinsic causes include: low internet speed in some sites that affected the app’s functioning; app crashes due to different reasons; difficulties in filling the survey given the higher complexity of the Sbnavi app; the design of the games which needed buy in from a large number of users to be fully functional; low penetration rate of smartphones in some trial sites (Greece and Lithuania 43% Vs Sweden and Spain with about 73%). In turn, the external causes include: a lower targeted number of samples by smartphones stated on the survey plan of each city; a delay in the release date of some versions of the apps (2 weeks delay for the Game app and 5 weeks delay for the Sbnavi for Android); the platform in which the apps were released could be regarded as an issue (the Sbnavi for Android was only available the final week of the survey and the Game app was never available for iOS) and; the limited access to high-speed internet in some trial sites which hindered the downloading and use of the apps. The interested reader can read more about the possible reasons why the apps only received modest results on METPEX (2014) and Susilo et al. (2017).
The distribution of the respondents among different socio-demographic groups and travel modes can be seen in Table 2 and Table 3 respectively. In the recruitment stage, the respondents were sampled according to the socio-demographic and travel mode distributions in each respective city. However, few of the cities managed their socio-demographic and travel mode targets. For example, mobility restricted and elderly groups proved to be more difficult to recruit than other traveller groups, especially in Rome, Valencia and Bucharest. Presumably this is because, at some cities, these traveller groups are not travelling as frequently as other groups. Pedestrians and cyclists were also more difficult to capture than rail-based travellers. This latter is probably because many of the recruitment processes focused on the main interchanges where the travellers’ main travel modes were rail/road based public transport. It is also important to note that it is very difficult, if not impossible, for pedestrians, cyclists and car drivers to participate in real-time survey (e.g. using the apps) whilst travelling.
Table 2. Distribution of valid respondents, by socio-demographic characteristics15 15 The total number of respondents by different UG (user groups, Table 2) and TM (travel modes, Table 3) are different with the total number of samples (Table 1) since the Game app did not record specific detailed questions for different UG.

EJTIR 17(3), 2017, pp.384-410 390 Susilo et al. Findings from measuring door-to-door travellers’ travel satisfaction with traditional and smartphone app survey methods in eight European cities
City
Co
mm
.
Imp
air
ed
Co
mm
ute
rs
Lo
w I
nco
me
Mo
bil
ity
Res
tric
ted
Eld
erly
Ru
ral
dw
elle
rs
Tra
vel
lin
g
wit
h
chil
dre
n
Tra
vel
lin
g
wit
h
dep
end
ent
Un
der
24
Vis
ito
rs
Wo
men
Bucharest 11 76 49 19 21 21 20 2 32 31 83
Coventry 9 67 11 5 16 16 7 1 58 44 74
Dublin 8 209 40 9 10 24 5 3 45 7 78
Grevena 2 8 35 12 38 28 31 0 56 20 35
Rome 8 165 115 22 40 44 4 5 143 32 129
Stockholm 9 110 76 55 31 13 54 3 109 9 151
Valencia 9 62 113 19 49 4 14 2 32 29 127
Vilnius 9 33 31 9 20 3 15 1 22 4 76
FIA networks
150 221 197 57 44 133 29 25 106 157 356
TOTAL 215 951 667 207 269 286 179 42 603 333 1109
Table 3. Distribution of valid respondents by travel mode15
City Private
vehicle PT Road
PT Rail (Tram, Rail, Underground)
Pedestrian and Bike
PT Waterborne
Demand Responsive Transit
Mobility Vehicles
Bucharest 58 104 153 30 0 18 2
Coventry 87 82 87 44 0 8 0
Dublin 22 310 91 13 1 1 0
Grevena 68 133 8 50 5 1 0
Rome 182 171 328 20 1 0 5
Stockholm 131 129 286 55 3 16 0
Valencia 131 107 60 162 0 0 0
Vilnius 46 133 3 36 0 4 1
FIA networks
540 293 422 130 20 17 53
TOTAL 1265 1462 1438 540 30 65 61
Further distribution analysis of the survey results of each city are described in Section 3. Comprehensive multivariate analysis to explore the unique behaviour across different survey methods and travel modes are described in Section 4.
3. Descriptive analysis
As shown in Table 4, overall, there was a fair distribution of gender across different test sites, with Coventry having the lowest and FIA network having the highest proportion of women amongst their samples. The majority of respondents were less than 55 years old, high school (or less) educated, full time employed and lived in urban areas. Stockholm respondents had the
Table 4. Distribution of sample by test sites
Variable Category Min Max Average
Gender1 (%) Male 34.5 (Coventry) 56.7 (FIA) 46.7
Age2 (Years)
18-24 14.0 (Valencia) 33.6 (Coventry) 21.8
25-34 12.6 (Valencia) 34.5 (Bucharest) 23.9

EJTIR 17(3), 2017, pp.384-410 391 Susilo et al. Findings from measuring door-to-door travellers’ travel satisfaction with traditional and smartphone app survey methods in eight European cities
35-44 12.2 (Coventry) 23.6 (Grevena) 20.2
45-44 9.5 (Bucharest) 21.0 (Valencia) 15.5
55-64 5.2 (Stockholm) 11.7 (Vilnius) 8.6
65-74 3.0 (FIA) 13.9 (Grevena) 6.4
>75 0.1 (FIA) 10.2 (Valencia) 2.1
Education (%)
Less than high school 1.7 (Bucharest) 31.5 (Valencia) 10.5
High school 29.6 (Bucharest) 54.3 (Rome) 44.9
Bachelor degree 13.5 (Valencia) 45.0 (Bucharest) 28.4
Postgraduate qualifications 1.60 (Valencia) 30.0 (Dublin) 16.3
Occupation3
(%) Full time employment 15.0 (Grevena) 55.7 (Bucharest) 44.1
Part-time employment 4.1 (Grevena) 13.4 (Rome) 10.1
Unemployment 2.4 (Coventry) 17.6 (Valencia) 6.7
Student 7.3 (Vilnius) 27.4 (Stockholm) 15.2
Pensioner 4.1 (Dublin) 23.4 (Valencia) 9.6
Income4
(%) Under average 26.5 (FIA) 66.9 (Valencia) 40.0
Above average 5.4 (Valencia) 21.4 (Dublin) 16.6
Disability Yes 8.6 (Rome) 27.5 (FIA) 17.8
Type of disability
(%)
Mobility impairment 15.3 (Dublin) 51.9 (Grevena) 24.7
Hearing impairment 3.7 (Grevena) 18.6 (Dublin) 13.2
Visual impairment 3.7 (Grevena) 48 (Bucharest) 28.6
Learning disability 0 (Grevena, Rome) 28 (Coventry) 6.1
Serious long term illness 5.6 (Bucharest) 40.7 (Grevena) 21.0
Area of residence
(%)
Rather urban or urban 46.8 (Grevena) 92.6 (Valencia) 66.3
Neither rural nor urban 3.4 (Bucharest) 34.5 (Grevena) 17.5
Type of building5
(%)
Terraced house 2.2 (Grevena) 27.1 (Coventry) 11.8
Detached/semi det. House 2.6 (Valencia) 63.2 (Dublin) 24.4
Medium or large building (>5 hh)
13.1 (Coventry) 92.2 (Valencia) 54.4
Living with6
(%) Single 14 (Valencia) 30.9 (Stockholm) 22.0
Partner/ married 22.4 (Stockholm) 32.1 (Bucharest) 26.8
Partner/married 1 or > children 13.1 (Dublin) 34.8 (Grevena) 25.3
Shared household 1.6 (Valencia) 27.2 (Dublin) 13.6
Cars (units) Number in HH 0.8 (Stockholm) 1.5 (FIA) 1.2
1 Not showing the categories Female and Non-disclosed. 2 Not showing <17 age years old 3 Not showing Self-employed, Working student, Housewife/Husband and Other 4 Not showing Average income 5 Not showing Small building apartments
6 Not showing Single with 1 or more children
Table 4. Distribution of sample by test sites (continued) Variable Category Min Max Average
Trip purpose7
(%)
Commuting to work 5.8 (Grevena) 33.6 (Dublin) 24.2
Commuting back home 0.6 (Valencia) 24.9 (Dublin) 9.4
Work related 5 (Valencia) 13.3 (Grevena) 10.0
Education 6.4 (Valencia) 17.9 (Grevena) 10.8

EJTIR 17(3), 2017, pp.384-410 392 Susilo et al. Findings from measuring door-to-door travellers’ travel satisfaction with traditional and smartphone app survey methods in eight European cities
Shopping 4.1 (Rome) 13.2 (Vilnius) 9.6
Leisure 9.9 (Rome) 32.5 (Grevena) 19.3
Visiting the city-Tourism 1.9 (Dublin) 15.7 (FIA) 8.8
Frequency
(%)
Daily 19.9 (Grevena) 65.5 (Valencia) 38.3
Weekly 17.0 (Bucharest) 35.9 (Stockholm) 24.5
Monthly 1.6 (Valencia) 12.7 (Grevena) 6.3
Occasionally 9.2 (Valencia) 43.8 (FIA) 28.8
Duration
(minutes)
<10 min 1.5 (Bucharest) 14.4 (Valencia) 6.1
11-30 15.4 (Dublin) 59.1 (Valencia) 27.4
31-60 17.4 (FIA) 45.5 (Bucharest) 29.9
61-120 5.8 (Valencia) 34.0 (Dublin) 15.2
>2h until 4h 2.4 (Valencia) 17.2 (Grevena) 8.8
>6 hours 1 (Valencia) 30.4 (FIA) 11.7
Legs (number) Avg. number 1.7 (FIA) 2.5 (Dublin) 2.0
Modes all legs8
(%)
Bicycle 0.2 (Grevena) 4.1 (FIA) 2.1
Pedestrian 13.4 (FIA) 66.4 (Valencia) 32.2
Private vehicle 8.2 (Bucharest) 29.7 (FIA) 17.4
PT Rail 0.6 (Valencia) 20.3 (Coventry) 11.0
PT Road 11.5 (Valencia) 39.6 (Dublin) 23.0
PT Metro+Tram 0.5 (Vilnius) 23.3 (Bucharest) 11.4
Other 0.2 (Valencia) 6.5 (FIA) 2.7
Mode main legs8
(%)
Bicycle 0 (Grevena) 4.5 (FIA) 3.0
Pedestrian 1.7 (Rome) 32 (Valencia) 8.3
Private vehicle 5.5 (Dublin) 36.6 (FIA) 26.0
PT Rail 1.1 (Valencia) 28.6 (Rome) 17.5
PT Road 19.9 (FIA) 70.8 (Dublin) 30.2
PT Metro+Tram 0 (Vilnius) 31.8 (Bucharest) 11.8
Other 0 (Valencia) 6.1 (FIA) 3.2
Disruption? (%) Yes 1.1 (Grevena) 41.8 (Rome) 19.0
7 Not showing Escorting dependents, Escorting children and Medical/social care appointments. 8 The group ”other” is composed by Waterborne, Mobility vehicle and Demand responsive
lowest car ownership rate, whilst the FIA respondents had the highest. Experiencing disruption was very common amongst Rome travellers (which had the highest share of railway users), whilst Grevena travellers experienced the least. Overall, Dublin had the highest share of public transport road users, whilst FIA motorists had the highest proportion of private car and bicycle use. Respondents from Valencia had the highest proportion of pedestrians.
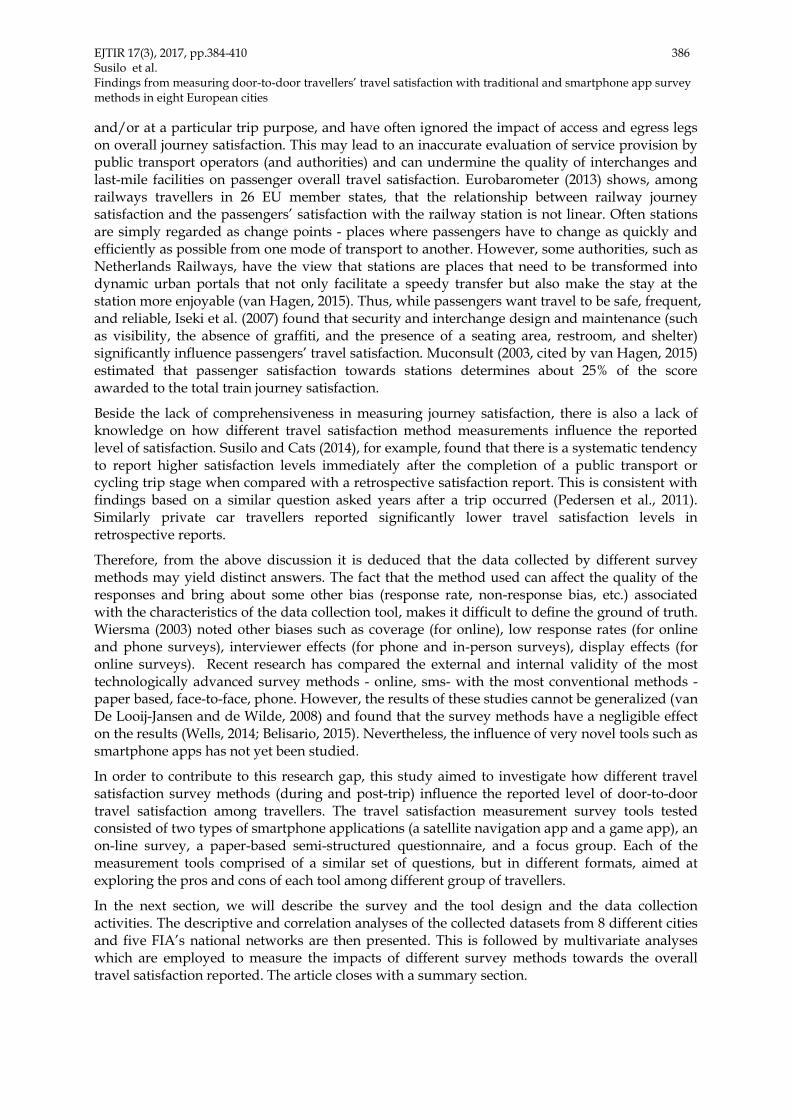
As can be seen from Figure 2, Dublin travellers reported the most complex journey patterns, i.e. a higher number of trip legs per journey (on average 2.54 trip legs per journey), whilst FIA motorists respondents reported the lowest (on average 1.65 trip legs per journey). Overall, the respondents made an average of 1.96 trip legs per journey which may indicate that some of the respondents underreported their journey, perhaps not considering walking as a separate leg.
EJTIR 17(3), 2017, pp.384-410 393 Susilo et al. Findings from measuring door-to-door travellers’ travel satisfaction with traditional and smartphone app survey methods in eight European cities
Figure 2. Distribution of reported trip stages by trial sites
In terms of reported overall travel satisfaction, on average, communication impaired, visitors and the elderly reported the highest travel satisfaction, whilst commuters, younger travellers and rural dwellers were least satisfied (see Figure 3a). However, across different survey methods, this only applied among respondents who participated in paper based and on-line surveys (the majority of the respondents). Surprisingly, low income travellers reported the highest travel satisfaction via the sbNavi app, whilst travellers with children and the rural dwellers reported the lowest travel satisfactions. Those with communication impairments significantly reported higher travel satisfaction (via focus group methods) than commuters, rural dwellers and women (who reported the lowest).
Interestingly, when comparing travel satisfaction for different travel modes when they are the main mode (Figure 3b) and when the travel modes can be in any trip legs (Figure 3c), the rank order of satisfaction is similar. The main travel modes, waterborne, private vehicle and demand responsive were reported as providing the highest travel satisfaction, whilst public transport rail, public transport road and underground modes were reported as providing the lowest travel satisfaction. Meanwhile in terms of the whole door-to-door journey trip legs, the main differences are that pedestrian legs were reported to have amongst the highest travel satisfaction, while PT tram were reported as amongst the least satisfying among all other travel modes. This difference highlights the importance of understanding and measuring the dynamic of an individual’s travel satisfaction from door-to-door, and not only focus on the main trip leg, which most NGOs and authorities tend to do. Consistent with previous graphs, different survey methods in conjunction with the influence of different sample characteristics resulted in differences in the order of travel satisfaction across different travel modes.
0.0
0.5
1.0
1.5
2.0
2.5
3.0
0
10
20
30
40
50
60
70
Nu
mb
er
of
leg
s
% o
f n
um
ber
of
leg
s
1 leg 2 legs 3 legs
4 legs 5 legs 6 legs
7 or more Avg legs site Avg.legs all sites

EJTIR 17(3), 2017, pp.384-410 394 Susilo et al. Findings from measuring door-to-door travellers’ travel satisfaction with traditional and smartphone app survey methods in eight European cities
(a) Reported overall travel satisfaction by user groups and survey methods
(b) Reported overall travel satisfaction by main travel mode and survey methods
(c) Reported overall travel satisfaction by travel modes, regardless whether the given mode were used as the main travel modes, and survey methods Figure 3. Overall travel satisfaction by user groups, travel modes and survey methods
1
1.5
2
2.5
3
3.5
4
4.5
5 Avg.Sat.per UG in allmethods
Avg.Sat.SbNavi
Avg.Sat.Paper Based
Avg.Sat.Web-Online
Avg.Sat.Focus Group
Average Sat.allUG&methods
1.0
1.5
2.0
2.5
3.0
3.5
4.0
4.5
5.0 Avg.Sat.per modeall methods
Avg.Sat.SbNavi
Avg.Sat.Paperbased
Avg.Sat.Webonline
Avg.Sat.FocusGroup
Avg.Sat.allmethods&modes
1
1.5
2
2.5
3
3.5
4
4.5
5
Avg.Sat.per mode allmethods
Avg.Sat.SbNavi
Avg.Sat.Paper based
Avg.Sat.Web online
Avg.Sat.Focus Group
Avg.Sat.Allmethods/modes

EJTIR 17(3), 2017, pp.384-410 395 Susilo et al. Findings from measuring door-to-door travellers’ travel satisfaction with traditional and smartphone app survey methods in eight European cities
Previous studies (e.g. Ory and Mokhtarian, 2005; Cantwell et al., 2009) reported that the level of travel satisfaction is a function of travel distance; the longer one travels, the less satisfied one becomes. However, as can be seen from Figure 4 below, this relationship only appeared to apply until 90 minutes of travel. Once the trip became longer than 90 minutes, the level of satisfaction increased and was relatively steady for longer trip durations. This is due to the purpose of longer trips – (leisure and tourist trips are increasingly important, representing a 43% in for trips between 91-120min. and 89% for trips over 6 hours) perhaps geared up for leisure and other special trips - travelers will have prepared themselves for a longer amount of travel time. However, these results should be taken with caution since other factors may influence the relationship between duration and satisfaction. Therefore, duration of the journey will be further studied in the multivariate analysis.
Figure 4. Overall travel satisfaction by trip duration
4.2 Cross-correlation by travel mode and survey methods A correlation matrix was constructed in order to identify the travel experience aspects that were most strongly correlated to overall trip satisfaction, as well as the extent to which various travel experience aspects were inter-correlated. Figures 5 and 6 present cross-correlation matrices for different travel modes and survey methods, with each aspect of experience represented as a node and the correlation between two items illustrated by a link. The cross-correlation graphs were visualized using the NodeXL excel add-in and offered an intuitive glimpse of the relationships between the various factors. The line thickness corresponds to the degree of correlation. Correlations with the overall journey satisfaction are highlighted using red solid lines. Correlations among other sub/categories are displayed in blue. Correlations above 0.7 are shown with a solid line and those between 0.5 and 0.7 with a dashed line. The correlation coefficients are always positive with the exceptions of OS-Regret and Regret-Loyalty.
As can be seen from Figure 5, the overall travel satisfaction of different travel modes significantly correlate with different service attributes. Whilst the road based public transport users’ travel satisfaction correlated with punctuality and reliability factors (Figure 5b), the railway users’ overall travel satisfaction correlated (correlation > 0.5) with punctuality, accessibility in terms of reaching the station (public transport proximity), and air temperature and ventilation inside vehicles (air comfort on-board) (Figure 5a). Tram users, on the other hand, also appreciated the cleanliness of the vehicle (Figure 5c), whilst the overall travel satisfaction of underground users did not correlated with any factor. In contrast, the overall travel satisfaction of waterborne public transport users (Figure 5i) significantly correlated with timetable information provision and also
1.0
1.5
2.0
2.5
3.0
3.5
4.0
4.5
5.0
0%
10%
20%
30%
40%
50%
60%
70%
80%
90%
100%
<5m
inute
s
6-1
0 m
in
11-2
0 m
in
21-3
0 m
in
31-4
0 m
in
41-6
0 m
in
61-9
0 m
in
91-1
20 m
in
Mo
re tha
n 2
hours
…
Mo
re tha
n 3
hours
…
Mo
re tha
n 4
hours
…
>6 h
ours
Very satisfied
Rather satisfied
Neither satisfied nordissatisfied
Rather dissatisfied
Very dissatisfied
Avg.sat.all
Level of sat.(1-5)
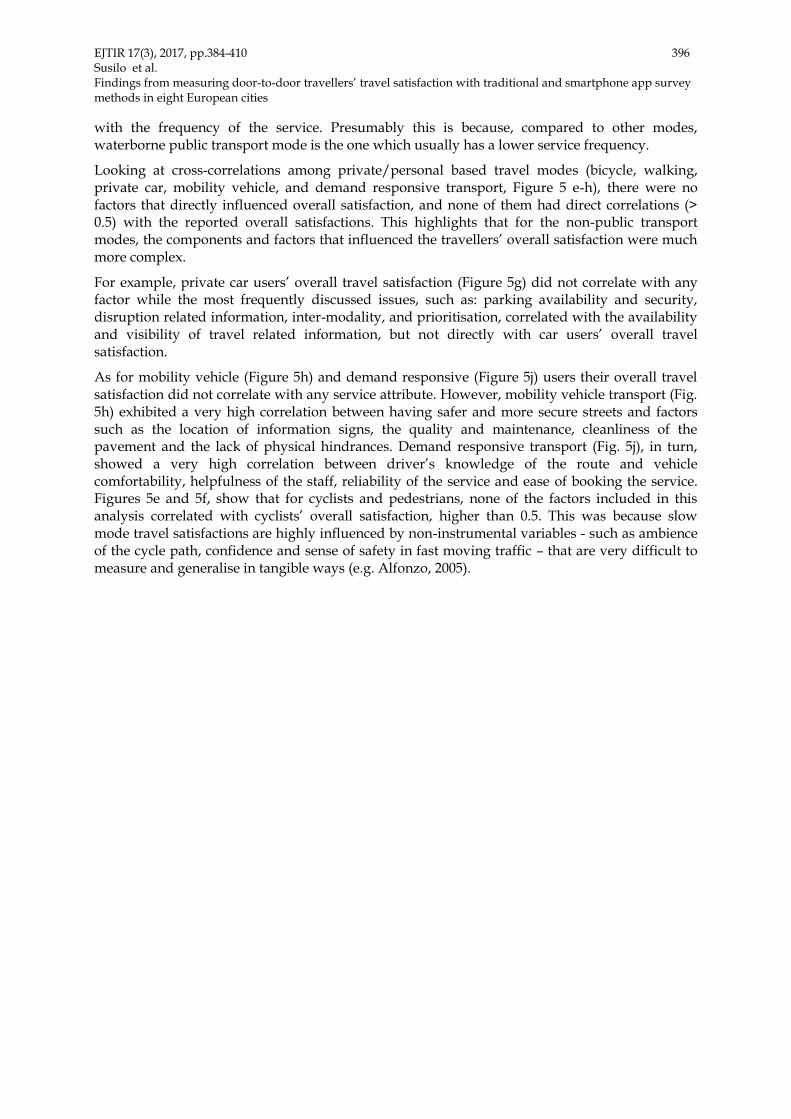
EJTIR 17(3), 2017, pp.384-410 396 Susilo et al. Findings from measuring door-to-door travellers’ travel satisfaction with traditional and smartphone app survey methods in eight European cities
with the frequency of the service. Presumably this is because, compared to other modes, waterborne public transport mode is the one which usually has a lower service frequency.
Looking at cross-correlations among private/personal based travel modes (bicycle, walking, private car, mobility vehicle, and demand responsive transport, Figure 5 e-h), there were no factors that directly influenced overall satisfaction, and none of them had direct correlations (> 0.5) with the reported overall satisfactions. This highlights that for the non-public transport modes, the components and factors that influenced the travellers’ overall satisfaction were much more complex.
For example, private car users’ overall travel satisfaction (Figure 5g) did not correlate with any factor while the most frequently discussed issues, such as: parking availability and security, disruption related information, inter-modality, and prioritisation, correlated with the availability and visibility of travel related information, but not directly with car users’ overall travel satisfaction.
As for mobility vehicle (Figure 5h) and demand responsive (Figure 5j) users their overall travel satisfaction did not correlate with any service attribute. However, mobility vehicle transport (Fig. 5h) exhibited a very high correlation between having safer and more secure streets and factors such as the location of information signs, the quality and maintenance, cleanliness of the pavement and the lack of physical hindrances. Demand responsive transport (Fig. 5j), in turn, showed a very high correlation between driver’s knowledge of the route and vehicle comfortability, helpfulness of the staff, reliability of the service and ease of booking the service. Figures 5e and 5f, show that for cyclists and pedestrians, none of the factors included in this analysis correlated with cyclists’ overall satisfaction, higher than 0.5. This was because slow mode travel satisfactions are highly influenced by non-instrumental variables - such as ambience of the cycle path, confidence and sense of safety in fast moving traffic – that are very difficult to measure and generalise in tangible ways (e.g. Alfonzo, 2005).

EJTIR 17(3), 2017, pp.384-410 397 Susilo et al. Findings from measuring door-to-door travellers’ travel satisfaction with traditional and smartphone app survey methods in eight European cities
(a) PT Rail (b) PT Road
(c) PT Tram (d) PT Underground
Correlations: Solid line (> 0.7) and dotted line (0.5 to 0.7) In red (with overall travel satisfaction) and in blue (between other variables)
Figure 5. Cross-correlations among travel experience aspects and overall satisfaction on trip stages for different travel modes.

EJTIR 17(3), 2017, pp.384-410 398 Susilo et al. Findings from measuring door-to-door travellers’ travel satisfaction with traditional and smartphone app survey methods in eight European cities
(e) Bicycle (f) Pedestrian
(g) Private vehicle (h) Mobility vehicle Correlations: Solid line (> 0.7) and dotted line (0.5 to 0.7) In red (with overall travel satisfaction) and in blue (between other variables)
Figure 5. Cross-correlations among travel experience aspects and overall satisfaction on trip stages for different travel modes (continued)

EJTIR 17(3), 2017, pp.384-410 399 Susilo et al. Findings from measuring door-to-door travellers’ travel satisfaction with traditional and smartphone app survey methods in eight European cities
(i) Waterborne (j) Demand Responsive Transport Correlations: Solid line (> 0.7) and dotted line (0.5 to 0.7) In red (with overall travel satisfaction) and in blue (between other variables) Figure 5. Cross-correlations among travel experience aspects and overall satisfaction on trip stages for different travel modes (continued)
Across different survey methods, as can be seen from Figure 6, the respondents’ overall travel satisfaction which was measured using different survey methods correlated with different factors. Most of the subjective well-being factors consistently correlated (at 0.3) with the reported overall travel satisfaction, despite the survey methods used. The overall travel satisfaction reported via the sbNavi correlated (>0.5) with travellers’ satisfactions towards their main and previous trip legs, whilst the overall travel satisfaction reported via the game app survey method correlated with users’ loyalty16 towards certain modes. The overall travel satisfaction reported via the on-line survey highly correlated (>0.5) with users’ loyalty toward a particular mode, their satisfaction towards the main and subsequent trip legs, whilst the overall travel satisfaction reported via the paper-and-pencil methods were only highly correlated with their loyalty towards particular travel methods.
Different correlations towards different combination of trip legs may also be influenced by the nature of the survey tools. The sbNavi app allowed travellers to report travel satisfaction whist travelling, in real time. This allowed the respondents to evaluate their travel and also their previous trip legs. In contrast, the on-line survey respondents completed the survey post-trip. Thus, real-time surveys may make travellers more focused on not only their main trip leg, but also subsequent trip legs, until they reach their final destination. The paper-and-pencil method, however, were mostly distributed in the main interchanges, where people were in a hurry and so may only result on a focus on the (most recent) trip legs. Focus group respondents retrospectively evaluated trips in a group discussion, thus detached from, and with more time to evaluate, each trip leg.
16 'Mode loyalty’ in here refers to the unconditional preference that an individual may have towards a certain travel mode. This was inferred based on the agreement with the following statement: ”I will travel with my current travel mode in any case, no matter what the conditions are”

EJTIR 17(3), 2017, pp.384-410 400 Susilo et al. Findings from measuring door-to-door travellers’ travel satisfaction with traditional and smartphone app survey methods in eight European cities
(a) All survey methods (b) SbNavi (c) Game App
(d) Paper based (e) Web online (f) Focus Groups Figure 6. Relationships between overall journey satisfaction and satisfaction with various trip stages, subjective well-being spectrums, past experience and related trip appreciation factors, by different survey methods

EJTIR 17(3), 2017, pp.384-410 401 Susilo et al. Findings from measuring door-to-door travellers’ travel satisfaction with traditional and smartphone app survey methods in eight European cities
As for the game app, like also with other methods, the reported passengers travel satisfaction is strongly correlated with travellers’ loyalty towards a particular mode. This loyalty towards a particular travel mode could be interpreted as cognitive dissonance - where one aims to reassure or reconfirm his or her choices (Steg, 2005; Jakobsson-Bergstad et al. 2011; Susilo and Cats, 2014).
Nevertheless, it is also important to take into account that these discrepancies in correlations across different factors may also be due to the different proportion of main travel mode users across different survey methods. Thus, to analyse this further, multivariate analysis (an ordered logit model) was used to analyse the factors that correlated with the reported individual’s travel satisfaction.
4. Multivariate analysis
The previous analysis showed that within the trial site cities, survey methods and groups of travellers with different trip purposes reported different level of satisfactions. This is presumably because travellers have different needs and interests, thus they would display a different appreciation towards different determinant service attributes. To understand and to measure the impacts of each determinant factor in a more tangible and systematic way, multivariate analysis approach was adopted in this study.
A simple regression cannot be used in this case because the dependent variable, the overall journey satisfaction, is not a continuous variable. Multinomial logit and Ordered Logit models are the two most common models used to analyse individual selection over a specific set of choices. Multinomial logit assumes the probability of an individual choosing different choices following logistic distribution assumption but without any specific sequence/order, whilst ordered logit model assumes that the individual selection will follow a certain order. In this specific analysis ordered logit regression model is used. Given the fact that overall travel satisfaction is an ordinal variable, ranging from 1 (very unsatisfied) to 5 (very satisfied), ordered logit models was felt to be the most appropriate.
The reported “overall travel satisfaction” was used as the dependent variable. The explanatory variables used in the models reflect a combination of subjective well-being indices, travel modes and user groups, individual socio-demographics and the impact of different survey methods and location (as dummy variables of different cities).
It is important to remember that data gathered via smartphone applications was not identical with that collected via paper-and-pencil and on-line survey. The game app did not record travellers’ socio-demographic and travel mode specific questions. The SbNavi app did record travel mode related questions, but it did not specifically ask individuals to identify themselves to which group of traveller they belonged to, but automatically assigned them with a specific questionnaire, based on the information provided. Consequently, in order to analyse the impact of individual socio-demographic, user groups, travel modes, subjective well-being and survey methods in terms of travel satisfaction, two different models were developed. The first model (M1) focused on analysing the influence of an individual’s socio-demographic, travel duration, subjective well-being and chosen travel modes and user groups towards their overall travel satisfaction, and the second model (M2) focused on examining the impact of different survey methods, including the same variables as for Model 1 but, due to the data limitations, without individual travel mode and user group information17. Table 5 presents the estimation results of M1 and table 6 those of M2.
17 Given the differences in the data collection techniques and variables controlled in different survey methods, there is most likely significant scale heterogeneity across data sources. It is immensely important to control the scale heterogeneity in the modelling methods. Thus, we applied the generalized ordered logit model (e.g. Yasmin

EJTIR 17(3), 2017, pp.384-410 402 Susilo et al. Findings from measuring door-to-door travellers’ travel satisfaction with traditional and smartphone app survey methods in eight European cities
As can be seen from Table 5, in most cases gender, age, income, employment status and level of education were found insignificant in influencing the reported overall travel satisfaction of the respondents. FIA respondents were the exception with males more likely to report a lower satisfaction rate, and travellers above 65 years reporting a higher level of travel satisfaction compared to other age groups. The Vilnius younger travellers (24 years old or below) also reported a lower travel satisfaction than travellers from other age groups, while in Grevena, those aged between 45-64 years old reported higher.
In Dublin, lower income travellers reported higher travel satisfaction, whilst in Coventry and Vilnius, the highest educated (postgraduate, the reference group) travellers were the most dissatisfied.
The correlations between travel distance and trip frequency in terms of reported travel satisfaction were not clear. In Bucharest, Stockholm and Valencia, travel distance and trip frequency were not found significant. In other cities, there were tendencies toward a longer travel distance correlating with a lower reported travel satisfaction, except for longer (2-3 hours) trips in Coventry. Presumably this is due to the nature of the travel - more likely related to leisure trips, which have different time and mood constraints. Dublin, FIA, Grevena and Rome travellers reported lower travel satisfaction towards their route/daily travels, and experience of a disruption during journeys also negatively correlated with reported travel satisfaction.
In line with previous studies (Ettema et al., 2012; Friman et al., 2013), subjective well-being factors significantly correlated with the reported overall travel satisfaction. For example, being happy and satisfied with one’s life positively correlates with reported travel satisfaction. Being awake corresponds with a lower travel satisfaction in Coventry and Grevena, but in Bucharest and Stockholm, it correlated with a higher travel satisfaction. Presumably this is because the differences in the local culture in terms of expectation, perceptions and mood consequences. Further investigation on this matter would be a possible future research direction of this study.
There were tendencies showing that the public transport modes correlated with a lower reported travel satisfaction than with other travel modes, although this was not consistent throughout the different trial sites. Tourists/visitors seemed to report a higher travel satisfaction, compared with other groups of travellers, except for tourists/visitors in Rome.
and Eluru, 2013) to the whole dataset. The estimated indicators, however, show that it is not advised to apply a Generalized Ordered response model for our rich model specification and to the city-specific models, M1 and M2, since the sample for each city-specific models are not large enough. Therefore we only refer to the ordered logit regression model estimation results.
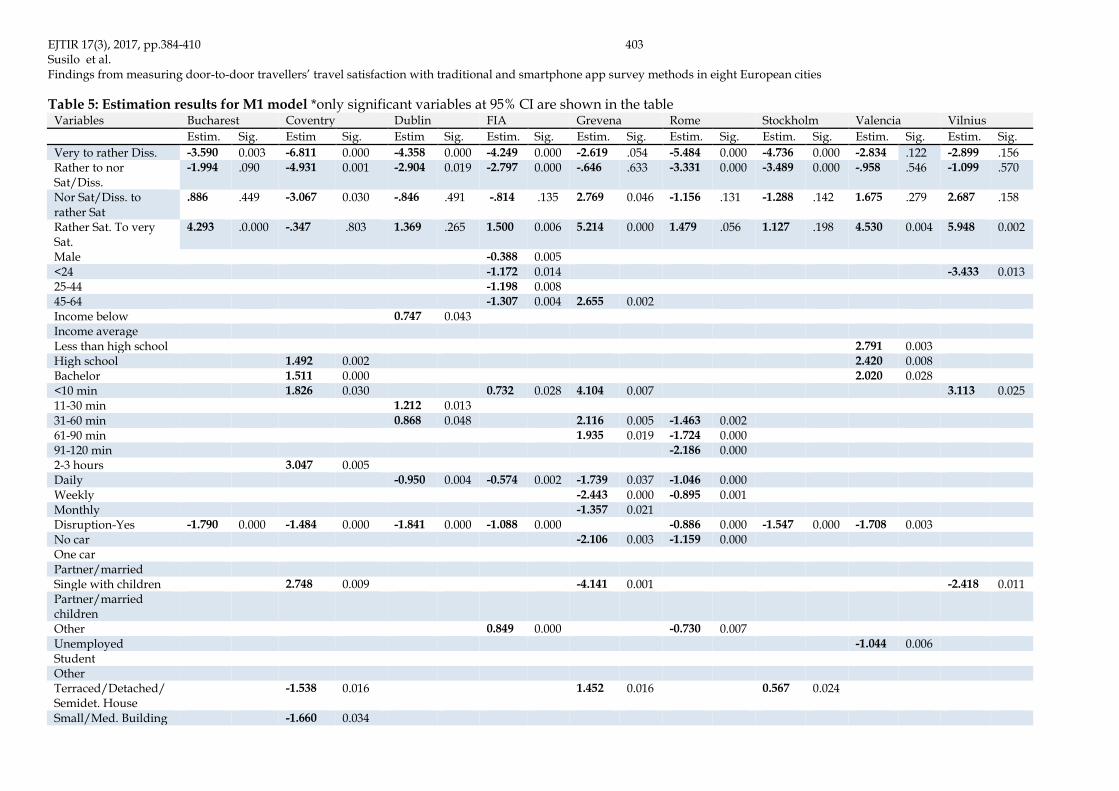
EJTIR 17(3), 2017, pp.384-410 403 Susilo et al. Findings from measuring door-to-door travellers’ travel satisfaction with traditional and smartphone app survey methods in eight European cities
Table 5: Estimation results for M1 model *only significant variables at 95% CI are shown in the table Variables Bucharest Coventry Dublin FIA Grevena Rome Stockholm Valencia Vilnius
Estim. Sig. Estim Sig. Estim Sig. Estim. Sig. Estim. Sig. Estim. Sig. Estim. Sig. Estim. Sig. Estim. Sig.
Very to rather Diss. -3.590 0.003 -6.811 0.000 -4.358 0.000 -4.249 0.000 -2.619 .054 -5.484 0.000 -4.736 0.000 -2.834 .122 -2.899 .156 Rather to nor Sat/Diss.
-1.994 .090 -4.931 0.001 -2.904 0.019 -2.797 0.000 -.646 .633 -3.331 0.000 -3.489 0.000 -.958 .546 -1.099 .570
Nor Sat/Diss. to rather Sat
.886 .449 -3.067 0.030 -.846 .491 -.814 .135 2.769 0.046 -1.156 .131 -1.288 .142 1.675 .279 2.687 .158
Rather Sat. To very Sat.
4.293 .0.000 -.347 .803 1.369 .265 1.500 0.006 5.214 0.000 1.479 .056 1.127 .198 4.530 0.004 5.948 0.002
Male -0.388 0.005 <24 -1.172 0.014 -3.433 0.013 25-44 -1.198 0.008 45-64 -1.307 0.004 2.655 0.002 Income below 0.747 0.043 Income average Less than high school 2.791 0.003 High school 1.492 0.002 2.420 0.008 Bachelor 1.511 0.000 2.020 0.028 <10 min 1.826 0.030 0.732 0.028 4.104 0.007 3.113 0.025 11-30 min 1.212 0.013 31-60 min 0.868 0.048 2.116 0.005 -1.463 0.002 61-90 min 1.935 0.019 -1.724 0.000 91-120 min -2.186 0.000 2-3 hours 3.047 0.005 Daily -0.950 0.004 -0.574 0.002 -1.739 0.037 -1.046 0.000 Weekly -2.443 0.000 -0.895 0.001 Monthly -1.357 0.021 Disruption-Yes -1.790 0.000 -1.484 0.000 -1.841 0.000 -1.088 0.000 -0.886 0.000 -1.547 0.000 -1.708 0.003 No car -2.106 0.003 -1.159 0.000 One car Partner/married Single with children 2.748 0.009 -4.141 0.001 -2.418 0.011 Partner/married children
Other 0.849 0.000 -0.730 0.007 Unemployed -1.044 0.006 Student Other Terraced/Detached/ Semidet. House
-1.538 0.016 1.452 0.016 0.567 0.024
Small/Med. Building -1.660 0.034

EJTIR 17(3), 2017, pp.384-410 404 Susilo et al. Findings from measuring door-to-door travellers’ travel satisfaction with traditional and smartphone app survey methods in eight European cities
Table 5: Estimation results for M1 model (continued) Variables Bucharest Coventry Dublin FIA Grevena Rome Stockholm Valencia Vilnius
Estim. Sig. Esti. Sig. Estim Sig. Estim. Sig. Estim. Sig. Estim. Sig. Estim. Sig. Estim. Sig. Estim.
Happy 1.543 0.000 0.674 0.014 0.710 0.000 0.846 0.000 0.733 0.050 Satisfied 1.255 0.000 0.550 0.000 0.917 0.000 0.681 0.006 2.279 Active 1.430 0.000 0.292 0.027 0.500 0.009 Alert 0.361 0.005 1.491 0.007 0.948 Joyful -0.974 0.003 1.480 0.028 0.813 0.028 Awake 0.643 0.043 -0.894 0.026 -1.130 0.039 0.495 0.031 Start- Workplaces 0.498 0.042 0.315 0.023 Finish- Workplaces -0.839 0.024 0.407 0.001 -0.773 0.001 Area Live- Urban 1.267 0.021 0.458 0.000 1.865 0.009 1.096 0.018 1.544 TM Soft modes -1.595 0.041
TM PT Rail -0.406 0.004 -0.651 0.002 -0.780 0.009
TM PT Road -1.286 0.017 -0.448 0.004 -1.088 0.000 -0.727 0.019
TM Other -1.306 0.010 -3.138 0.038 3.008
UG Comm.Imp
UG Low income
UG Over 64 2.611 0.009 -3.037
UG Rural Dwellers 2.932 0.001 -0.869 0.019
UG Visitors 2.277 0.001 1.241 0.036 -0.894 0.039 1.078 0.048
UG Commuters -0.788 0.033
UG Under 24
UG Other -1.518
-2 Log Likelihood 617.10 480.81 916.76 3051.35 390.42 1593.39 1099.89 812.84 313.75
Df 51 51 51 51 51 51 51 51 51
Pearson Chi-square 1422.76 940.27 1412.63 6202.54 785.08 4403.89 2129.70 1321.72 763.88
McFadden Ps. R2 0.230 0.274 0.262 0.143 0.283 0.187 0.132 0.125 0.320
N 320 243 398 1324 220 678 489 452 189
*Only significant variables at 95% CI are shown in the table

EJTIR 17(3), 2017, pp.384-410 405 Susilo et al. Findings from measuring door-to-door travellers’ travel satisfaction with traditional and smartphone app survey methods in eight European cities
Table 6: Estimation results for M2 model Variables Bucharest Coventry Dublin Grevena Rome Stockholm Valencia Vilnius
Estim. Sig. Estim Sig. Estim Sig. Estim. Sig. Estim. Sig. Estim. Sig. Estim. Sig. Estim. Sig.
Very to rather Diss. -5.664 0.000 -7.008 0.000 -4.348 0.000 -4.468 0.001 -4.770 0.000 -4.621 0.000 -4.215 0.009 -1.394 0.373
Rather to nor Sat/Diss.
-3.989 0.000 -4.679 0.000 -2.856 0.003 -2.734 0.044 -2.553 0.000 -3.232 0.000 -2.072 0.139 0.105 0.943
Nor Sat/Diss. to rather Sat
-1.002 0.324 -2.713 0.024 -0.825 0.379 0.370 0.783 -0.432 0.532 -0.700 0.358 0.665 0.629 3.546 0.015
Rather to very Sat. 2.167 0.035 0.162 0.891 1.343 0.153 2.677 0.048 2.139 0.002 1.728 0.024 3.411 0.014 6.605 0.000
Male
<24 -1.871 0.016
25-44 -1.821 0.014 -1.228 0.046
45-64 -1.557 0.038
Income below -1.393 0.046
Income average
< high school 0.747 0.045
High school 1.190 0.008
Bachelor 1.140 0.004
<10 min 2.061 0.004 2.749 0.006 2.576 0.022
11-30 min 0.976 0.037
31-60 min -1.370 0.003
61-90 min -1.692 0.000 -1.132 0.039
91-120 min -2.244 0.000
2-3 hours 2.907 0.005
Daily -0.819 0.012 -0.905 0.000
Weekly -1.571 0.011 -0.716 0.006
Monthly -1.324 0.035 -1.176 0.028
Disruption-Yes -1.752 0.000 -1.599 0.000 -1.964 0.000 -1.196 0.000 -1.596 0.000 -1.672 0.003
No car -0.915 0.027 -2.003 0.002 -1.469 0.000 One car Partner/married Single with children 2.249 0.024 -1.769 0.039 -3.228 0.008 Partner/married children
Other -0.887 0.001 Unemployed -0.643 0.049 Student Other 0.408 0.047 Terraced/Detached/ Semidet. House
-1.564 0.012 1.236 0.030 0.799 0.001
Small/Med Building -1.822 0.015
*Only significant variables at 95% CI are shown in the table

EJTIR 17(3), 2017, pp.384-410 406 Susilo et al. Findings from measuring door-to-door travellers’ travel satisfaction with traditional and smartphone app survey methods in eight European cities
Table 6: Estimation results for M2 model (continued) Variables Bucharest Coventry Dublin Grevena Rome Stockholm Valencia Vilnius
Estim. Sig. Estim Sig. Estim Sig. Estim. Sig. Estim. Sig. Estim. Sig. Estim. Sig. Estim. Sig.
Happy 1.424 0 0.654 0.015 0.953 0 0.48 0.047 0.81 0.022 0.753 0.039 Satisfied 1.173 0 0.861 0 0.729 0.002 1.673 0 Active 1.162 0.002 0.419 0.027 Alert 1.405 0.007 0.818 0.032 Joyful -0.817 0.009 0.789 0.028 Awake -0.878 0.019 -1.161 0.023 0.456 0.032 1.12 0.003 Start_Workplaces Finish_Workplaces -0.624 0.035 -0.613 0.08 0.458 0.039 0.436 0.3 -0.348 0.045 -0.823 0 Area Live Urban 0.891 0.025 0.965 0.023 SatNav 3.076 0.012 -0.556 0.014 Game app -1.901 0.014 -1.893 0.005 -2.844 0 -1.296 0 -2.622 0 Paper-based 0.77 0.045 1.849 0 0.771 0.003 Focus groups -1.915 0.002 -1.274 0
-2 Log Likelihood 645.09 504.51 948.73 418.55 1639.96 1275.07 871.14 374.47 Df 43 43 42 42 42 43 42 41 Pearson Chi-square
1270.01 870.11 1416.36 736.25 4267.71 2401.62 1646.41 609.86
McFadden Pseudo R-square
0.213 0.305 0.251 0.237 0.188 0.158 0.126 0.276
N 329 261 406 220 697 575 472 212
*Only significant variables at 95% CI are shown in the table

EJTIR 17(3), 2017, pp.384-410 407 Susilo et al. Findings from measuring door-to-door travellers’ travel satisfaction with traditional and smartphone app survey methods in eight European cities
In terms of survey methods, only Stockholm, Bucharest and Coventry had valid samples for all five survey methods (see Table 6). Overall, responses collected via the game app (and sbNavi in Stockholm) reported a significantly lower travel satisfaction than other survey methods. At the same time, paper-and-pencil methods responses reported higher travel satisfaction in Bucharest, Coventry, Dublin, and Rome. Survey methods were not found significant in influencing the reported travel satisfaction in Vilnius and Grevena. This may be due to the small sample size from these two sites. Focus group participants in Rome and Bucharest, however, reported a lower travel satisfaction than their fellow respondents.
5. Discussion and conclusion
Using 5,275 valid responses from eight European cities and five FIA national networks, this study examined factors that underlie travellers’ door-to-door travel satisfaction and how different survey methods may influence the reported level of satisfaction among diverse groups of travellers. The travel satisfaction measurement survey tools tested consisted of two types of smartphone applications (a satellite navigation app and a game app), an on-line survey, a paper-based semi-structured questionnaire and a focus group.
The results showed that the travel satisfaction reported by different survey methods and different ‘travel mode users’ correlate with different key determinants. The relationship between and within these key determinants, however, was far from straight forward. For example, many policy makers believe that parking provision is important for the satisfaction of the door-to-door journey of car travellers. But the results show that private car users’ overall travel satisfaction was more directly correlated with the availability and visibility of travel related information. Thus, the most frequently discussed issues, such as parking availability, security, and disruption-related information correlated with the availability and visibility of travel related information, but not directly with the car users’ overall travel satisfaction.
The results also showed that the chosen survey method does influence the reported level of travel satisfaction. Furthermore, the satisfaction that was gathered on the main trip leg does not necessarily correspond with overall satisfaction of the door-to-door journey. This highlights the need for more consideration when using national journey travel satisfaction (e.g. Swedish public transport annual barometer, Passenger Focus’ annual satisfaction report, etc.) which mostly focus on specific (often single) travel modes and trip legs. In the age of privatisation, these reports were used to evaluate the performance of the public transport provider, thus an incomplete picture of the passenger travel satisfaction may lead to unfair judgment of the operator’s performances. The results also showed that travellers’ experience in interchanges and with infrastructure systems, in most cases, matter more than the ride quality on the main trip leg.
Surveying door-to-door travel satisfaction with different survey methods, however, was not without concerns. In addition to the complexity of measuring and analysing dynamic, door-to-door, multimodal, travel satisfaction, without asking the travellers to validate their data, it became hard to define the ground of truth (which devices/methods would be referred as the truth). On the other hand, using various different methods opened up different opportunities, e.g. measuring the impacts of multimodal and interchanges planning and design, in real time, towards the users’ appreciations and needs, which would be very difficult with traditional paper-and-pencil surveys. Nevertheless, special needs travellers were more receptive towards focus group-like methods. Real-time measurements, such as those provided by the game app and sbNavi, require a consistent data connection and high end technology which for some countries are still luxuries. It was apparent from the survey feedback that - despite a surge in technology adoption and penetration in Europe in terms of smartphones in the last several years - the acceptance of a smartphone app as a survey tool is still very low and uneven between user groups and countries. There were also significant privacy and data protection concerns among
EJTIR 17(3), 2017, pp.384-410 408 Susilo et al. Findings from measuring door-to-door travellers’ travel satisfaction with traditional and smartphone app survey methods in eight European cities
potential respondents (e.g. in Rome) in terms of installing an app coming from an unknown source.
The next step will involve further detailed examination of the impact of trip leg complexity, and an investigation of familiarity and uncertainty in relation to trip satisfaction. Structural equation modelling will be used to examine traveller satisfaction for each trip leg, the nature of the trip purpose and also the experience of access and egress during trip legs. Further analyses on the focus groups results, especially among various groups of travellers with special needs, will also be a future step of this study.
Acknowledgements
This study was conducted as part of the METPEX (MEasurement Tool to determine the quality of the Passenger EXperience) project (www.metpex.eu), which was funded under the European Union’s Seventh Framework Programme for research, technological development and demonstration under grant agreement no 314354. An earlier version of this paper was presented at the 14th International Conference on Travel Behaviour Research (IATBR), London, UK, 2015. The authors thank Chengxi Liu’s help in estimating the Generalized Ordered Response model as an alternative model to explore the behaviours.
References
Abenoza R.F., Cats O. and Susilo Y.O. (2017) Travel satisfaction with public transport: determinants, user classes, regional disparities and their evolution. Transportation Research Part A: Policy and Practice, 95, 64-84.
Alfonzo, M.A., (2005) To Walk or Not to Walk? The Hierarchy of Walking Needs. Environment and Behavior, 37 (6), 808-836.
Andrews, G., Parkhurst, G., Susilo, Y.O. and Shaw, J. (2012) ‘The Grey Escape’: How and why are older people using their free bus passes? Journal of Transport Planning and Technology, 35 (1), 3-15.
Banister, D. and Bowling, A. (2004) Quality of life for the elderly: the transport dimension. Transport Policy, 11, 105–115.
Belisario, M., Jamsek, J., Huckvale, K., O D́onoghe, J., Morrison, C.P., Car, J. (2015) Comparison of self-administered survey questionnaire responses collected using mobile apps versus other methods. Cochrane database of systematic reviews, Vol 7: MR000042.
BMRB Social Research (2004) Department for Transport Omnibus Survey - October 2003. Department
for Transport.
Cantwell, M., Caulfield, B. and O'Mahony, M. (2009) Examining the Factors that Impact upon Public Transport Commuting Satisfaction. Journal of Public Transportation, 12 (2), 1-22.
Cats, O., Abenoza, R.F., Liu, C. and Susilo, Y.O. (2015) Evolution of Satisfaction with Public Transport
and Its Determinants in Sweden: Identifying Priority Areas. Transportation Research Record, 2538, 86–95.
Cats, O., Susilo, Y.O., Hrin, R., Woodcock, A., Diana, M., Speicytee, E., O’Connell, E., Di Majo, C., Tolio, V., Bellver, P. and Hoppe, M. (2014) An Integrated Approach to Measuring the Whole Journey Traveller Experience. Transport Research Arena 2014, Paris.
Clifton, K.J. (2003) Examining Travel Choices Of Low-Income Populations: Issues, Methods, and New
Approaches, paper presented at the 10th International Conference on Travel Behaviour Research, Lucerne,
August 2003.

EJTIR 17(3), 2017, pp.384-410 409 Susilo et al. Findings from measuring door-to-door travellers’ travel satisfaction with traditional and smartphone app survey methods in eight European cities
DfT. Department for Transport (2011) Personal Travel Factsheet: Commuting and Business Travel. UK Department for Transport, London.
Diana, M. (2008) Making the “primary utility of travel” concept operational: a measurement model for the assessment of the intrinsic utility of reported trips, Transportation Research Part A, 42, 455-474.
Ettema, D.F., Friman, M., Gärling, T., Olsson, L.E. and Fujii, S. (2012) How in-vehicle activities affect work commuters’ satisfaction with public transport. Journal of Transport Geography, 24, 215-222.
Eurobarometer (2013) Europeans’ Satisfaction with Rail Services, Flash Eurobarometer 382a, TNS Political and Social, European Commission, December 2013.
Farquhar, M. (1995) Elderly people’s definitions of quality of life. Social Science and Medicine, 41, 1439–1446.
Fillenbaum, J.E. (1985) Screening the elderly: a brief instrumental activities of daily living measure.
Journal of the American Geriatrics, 33, 698-706.
Friman, M., Fujii, S., Ettema, D., Gärling, T., and Olsson L. E. (2013) Psychometric analysis of the satisfaction with travel scale. Transportation Research Part A, 48, 132-145.
Friman, M., Gärling, T. (2001) Frequency of negative critical incidents and satisfaction with public transport services. II. Journal of Retailing and Consumer Services, 8, 105–114.
Giuliano, G. and Narayan, D. (2003). Another look at travel patterns and urban form: The US and Great
Britain. Carfax Publishing.
Hine, J. and Mitchell F. (2003) Transport Disadvantage and Social Exclusion, Exclusionary Mechanisms, in Transport in Urban Scotland, Ashgate Publishing Limited, England.
Iseki, H., Ringler, A., Taylor, B.D., Miller, M., and Smart, M. (2007) Evaluating Transit Stops and Stations from the Perspective of Transit Users. Report to California Department of Transportation, Division of Research and Innovation, Sacramento, CA.
Jakobsson-Bergstad, C., Gamble, A., Hagman, O., Polk, M., Gärling, T. and Olsson, L.E. (2011) Affective-symbolic and instrumental-independence psychological motives mediating effects of socio-demographic variables on daily car use. Journal of Transport Geography, 19, 33-38.
Marottoli, R.A., Mendes, C.F., Glass, T.A., Williams, C.S., Cooney, L.M., Berkman, L.F. and Tinetti,
M.E. (1997) Driving cessation and increased depressive symptoms: prospective evidence from the new
haven EPESE. Journal of American Geriatrics Society, 45, 202-206.
METPEX (2013) Identification of user requirements concerning the definition of variables to be measured by the METPEX tool (Deliverable 2.3 of the METPEX project), EU Commissions.
METPEX (2014) Report on survey and data collection processes at each location (Deliverable 4.1 of the METPEX project), EU Commissions.
Muconsult (2003) De Kwaliteitsbeleving van de Reis Met de Trein. Fase 2: Kwantitatief Onderzoek (Quality Experience of a Train Journey. Phase 2: Quantitative Research (Stated Preference). Netherlands: Internal Publication Netherlands Railways.
Ory, D.T., Mokhtarian, P.L. When is getting there half the fun? Modeling the liking for travel. Transportation Research Part A, 39 (2), 97-123.
Páez A. and Whalen, K. (2010) Enjoyment of commute: A comparison of different modes, Transportation Research: Part A, 44, 537-549.
Pedersen, T., Friman, M. and Kristensson, P. (2011) The role of predicted, on-line experienced and remembered satisfaction in current choice to use public transport services. Journal of Retailing and Consumer Services, 18, 471-475.

EJTIR 17(3), 2017, pp.384-410 410 Susilo et al. Findings from measuring door-to-door travellers’ travel satisfaction with traditional and smartphone app survey methods in eight European cities
Steg, L. (2005) Car use: lust and must. Instrumental, symbolic and affective motives for car use. Transportation Research Part A, 39, 147-162.
Stradling, S., Anable, J., Carreno, M. (2007) Performance, importance and user disgruntlement: a six-step method for measuring satisfaction with travel modes. Transportation Research Part A, 41, 98–106.
Susilo, Y.O. and Cats, O. (2014) Exploring Key Determinants of Travel Satisfaction for Multi-Modal Trips by Different Travellers’ Groups. Transportation Research A, 67, 366-380.
Susilo, Y.O., Cats, O., Diana, M., Hrin, G.R., Woodcock, A. (2015) Implementing a behavioural pilot survey for the stage-based study of the whole journey traveller experience. Transportation Research Procedia, 11, 172 – 184.
Susilo, Y.O., Lyons, G., Jain, J. and Atkins, S. (2012) Great Britain Rail Passengers' Time Use and
Journey Satisfaction: 2010 findings with multivariate analysis. Transportation Research Record, 2323, 99-
109.
Susilo, Y.O., Woodcock, A., Liotopoulos, F., Duarte, A., Osmond, J., Abenoza, R.F., Anghel, L.E., Herrero, D., Fornari, F., Tolio, V., O’Connell, E., Markucevičiūtė, I., Kritharioti, C. and Pirra, M. (2017) Deploying traditional and smartphone app survey methods in measuring door-to-door travel satisfaction in eight European cities. Forthcoming at the Transportation Research Procedia.
Tovey, M. Woodcock, A. and Osmond, J (eds) (2017). Designing mobility and transport services: Developing traveller experience tools, Routledge, London
Tranter, P. (1995) Behind closed doors: women, girls and mobility. Paper presented at the Women and Transport Conference, Adelaide.
Van de Looij-Jansen, P.M. and De Wilde, E.J. (2008) Comparison of Web-Based versus Paper-and-Pencil Self-Administered Questionnaire: Effects on Health Indicators in Dutch Adolescents. Health services research, 43 (5), 1708-1721.
Van Hagen, M. (2015) Effect of Station Improvement Measures on Customer Satisfaction. Journal of Traffic and Transportation Engineering, 3, 7-18.
Wells, T., Bailey, J.T., Link, M.W. (2014) Comparison of smartphone and online computer survey administration. Social Science Computer Review, Vol. 32, 2, 238-55.
Wiersma, W. (2013). The validity of surveys: Online and offline. Oxford Internet Institute.
Yasmin, S. and Eluru, N. (2013). Evaluating alternate discrete outcome frameworks for modeling crash injury severity. Accident Analysis and Prevention, 59, 506-521.