Eitzen Chemical ASA - teamtankers.com · 3 Highlights • Eitzen Chemical reported EBITDA of USD...
14
Eitzen Chemical ASA 1 st Quarter Report 2012
Transcript of Eitzen Chemical ASA - teamtankers.com · 3 Highlights • Eitzen Chemical reported EBITDA of USD...

Eitzen Chemical ASA1st Quarter Report 2012

3
Highlights
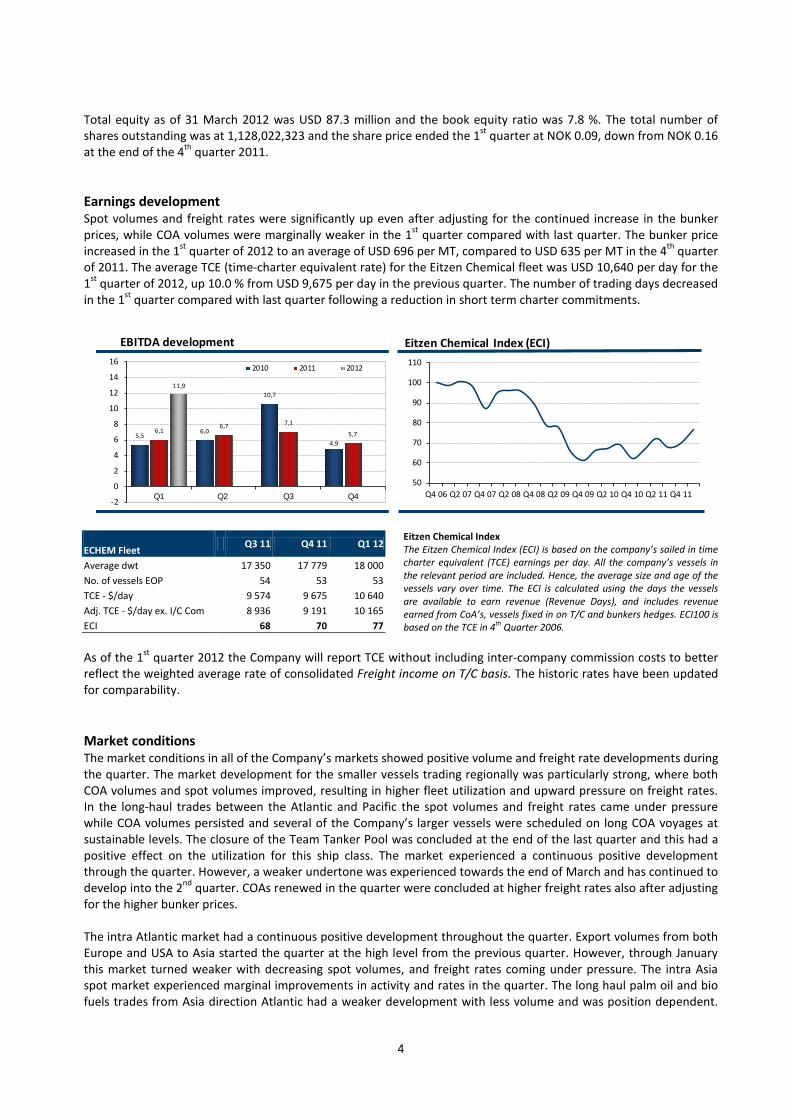
• Eitzen Chemical reported EBITDA of USD 11.9 million for the 1st quarter of 2012, compared to USD 5.7 million in the 4th quarter of 2011.
• The average time-charter rate for the Company’s fleet increased by 10.0 % from the previous quarter.
• Eitzen Chemical commenced a process to evaluate various options to ensure longer term financial strength and liquidity in January 2012. Various alternatives are under evaluation, including alternatives for a restructuring of the balance sheet. The Company is in discussions and has a constructive dialogue with its lenders.
• Eitzen Chemical expects a continued challenging chemical tanker market in the short term and consequently a weaker spot market in the 2nd quarter. Moderate improvements are expected in the second half of 2012.
Financial review Eitzen Chemical reported total Freight revenue of USD 105.6 million in the 1st quarter of 2012, compared to USD 105.3 million in the 4th quarter of 2011, following a 10.0 % increase in the average time-charter rate for the Company’s fleet from the previous quarter. Relative to the 4th quarter, the number of trading days decreased as a result of reduction in short term chartered–in tonnage. Average bunker prices, peaking in March, increased by 10% this quarter resulting in Voyage expenses of USD 54.6 million in the 1st quarter and increasing quarter end inventories. Freight income on T/C basis was USD 51.0 million, up USD 2.1 million from the previous quarter. The increase in income follows improvements in the spot market and higher utilization of the fleet. Ship operating expenses were USD 29.2 million in the 1st quarter (USD 30.4 million in Q4 2011). Charterhire expenses decreased by USD 3.2 million to USD 5.2 million mainly due to a reduction in short term charter commitments and a provision of USD 0.7 million for an unfavorable contract recorded in the previous quarter. General and administrative expenses were USD 6.1 million in the 1st quarter (USD 6.3 million in Q4 2011). EBITDA (earnings before interest, taxes, depreciation and amortization) ended at USD 11.9 million in the 1st quarter compared to USD 5.7 million in the previous quarter. Depreciation amounted to USD 16.2 million (USD 19.1 million in Q4 2011). The decrease in depreciation compared to the previous quarter is mainly related to the impairment of USD 62.5 million recorded in 4th quarter of 2011, which reduced the depreciation base. The Operating result (EBIT) for the 1st quarter was negative USD 4.3 million, compared to negative USD 76.8 million in the 4th quarter of 2011. The Operating result for the 4th quarter of 2011 includes USD 62.5 million in impairment and a Loss on sale of assets of USD 0.9 million related to the sale of Sichem Castel. Net interest expenses were marginally down at USD 10.7 million in the 1st quarter. Other financial items were net negative USD 1.8 million in the quarter (USD 10.1 million in Q4 2011). This comprises an unrealized currency loss on the NOK denominated bond loan of USD 4.3 million, which was partly offset by an unrealized currency gain of USD 2.2 million related to JPY denominated purchase options included in the finance lease obligations and USD 0.6 million in positive net foreign exchange difference on cash. Net loss in the 1st quarter was USD 16.8 million compared to a loss of USD 80.1 million in the previous quarter. Total book value for the Company’s vessels was USD 982.8 million as at 31 March 2012 (USD 995.1 million in Q4 2011). Total interest bearing debt including finance lease obligations was USD 974.6 million at the end of the 1st quarter (USD 973.3 million in Q4 2011). The current portion of the long-term interest bearing debt excluding the finance lease obligations was USD 26.1 million, whereof USD 11.7 million is due in the 4th quarter of 2012 and USD 14.4 million is due in the 1st quarter of 2013. Total cash and cash equivalents amounted to USD 65.8 million as of 31 March 2012 (USD 66.8 million end of Q4 2011). The Company has a cash covenant in its loan agreements which require that Eitzen Chemical shall maintain an unrestricted cash balance for an amount equal to or above USD 40 million in 2012 and until maturity.
4
Total equity as of 31 March 2012 was USD 87.3 million and the book equity ratio was 7.8 %. The total number of shares outstanding was at 1,128,022,323 and the share price ended the 1st quarter at NOK 0.09, down from NOK 0.16 at the end of the 4th quarter 2011. Earnings development Spot volumes and freight rates were significantly up even after adjusting for the continued increase in the bunker prices, while COA volumes were marginally weaker in the 1st quarter compared with last quarter. The bunker price increased in the 1st quarter of 2012 to an average of USD 696 per MT, compared to USD 635 per MT in the 4th quarter of 2011. The average TCE (time-charter equivalent rate) for the Eitzen Chemical fleet was USD 10,640 per day for the 1st quarter of 2012, up 10.0 % from USD 9,675 per day in the previous quarter. The number of trading days decreased in the 1st quarter compared with last quarter following a reduction in short term charter commitments.
Eitzen Chemical Index The Eitzen Chemical Index (ECI) is based on the company’s sailed in time charter equivalent (TCE) earnings per day. All the company’s vessels in the relevant period are included. Hence, the average size and age of the vessels vary over time. The ECI is calculated using the days the vessels are available to earn revenue (Revenue Days), and includes revenue earned from CoA’s, vessels fixed in on T/C and bunkers hedges. ECI100 is based on the TCE in 4th Quarter 2006.
As of the 1st quarter 2012 the Company will report TCE without including inter-company commission costs to better reflect the weighted average rate of consolidated Freight income on T/C basis. The historic rates have been updated for comparability. Market conditions The market conditions in all of the Company’s markets showed positive volume and freight rate developments during the quarter. The market development for the smaller vessels trading regionally was particularly strong, where both COA volumes and spot volumes improved, resulting in higher fleet utilization and upward pressure on freight rates. In the long-haul trades between the Atlantic and Pacific the spot volumes and freight rates came under pressure while COA volumes persisted and several of the Company’s larger vessels were scheduled on long COA voyages at sustainable levels. The closure of the Team Tanker Pool was concluded at the end of the last quarter and this had a positive effect on the utilization for this ship class. The market experienced a continuous positive development through the quarter. However, a weaker undertone was experienced towards the end of March and has continued to develop into the 2nd quarter. COAs renewed in the quarter were concluded at higher freight rates also after adjusting for the higher bunker prices. The intra Atlantic market had a continuous positive development throughout the quarter. Export volumes from both Europe and USA to Asia started the quarter at the high level from the previous quarter. However, through January this market turned weaker with decreasing spot volumes, and freight rates coming under pressure. The intra Asia spot market experienced marginal improvements in activity and rates in the quarter. The long haul palm oil and bio fuels trades from Asia direction Atlantic had a weaker development with less volume and was position dependent.
50
60
70
80
90
100
110
Q4 06 Q2 07 Q4 07 Q2 08 Q4 08 Q2 09 Q4 09 Q2 10 Q4 10 Q2 11 Q4 11
Eitzen Chemical Index (ECI)
5,5 6,0
10,7
4,9
6,1 6,7 7,1
5,7
11,9
-2
0
2
4
6
8
10
12
14
16
Q1 Q2 Q3 Q4
EBITDA development
2010 2011 2012
ECHEM Fleet Q3 11 Q4 11 Q1 12
Average dwt 17 350 17 779 18 000 No. of vessels EOP 54 53 53 TCE - $/day 9 574 9 675 10 640 Adj. TCE - $/day ex. I/C Com 8 936 9 191 10 165 ECI 68 70 77

5
The Middle East market improved significantly compared with the weak second half 2011 with more volumes and stronger freight rates.
Fleet development At the end of March 2012, the Eitzen Chemical fleet consisted of 53 vessels, of which 49 are owned or on financial lease and 4 are on operational lease. The commercially operated fleet totaled 72 vessels at the end of the 1st quarter, including 19 pool vessels owned by our partners. The process of discontinuing the City Class Pool and the withdrawal of the 19 vessels owned by our partners is expected to be completed in the 2nd quarter of 2012. 4 vessels were dry-docked during the 1st quarter of 2012, and 3 dry-dockings are scheduled to be completed in the 2nd quarter of 2012. Strategy and capital resources Eitzen Chemical’s results improved in the 1st quarter of 2012. The Company’s cash balance was reduced by USD 1.0 million, compared to USD 8.4 million during the 4th quarter of 2011. The improvement during the 1st quarter of 2012 was primarily driven by improved earnings on the vessels and positive working capital development. Following the discontinuation of the Team Tanker Pool last quarter, the Company has improved its earnings on its MR vessels. When the City Class Pool is discontinued in the 2nd quarter, it is further expected that the Company’s earnings will subsequently increase as a result of improved utilization within this ship class. With challenging conditions prevailing in the chemical tanker market, Eitzen Chemical has since 2009 focused on improving its financial situation. The Company negotiated a three-year debt moratorium in 2009, and has raised a total of USD 185 million in two equity issues in November 2009 and April 2011, respectively. The bank and bond debt agreements mature in 2014, whereas the debt moratorium period expires in November 2012. When the debt moratorium period expires, the Company is required to resume paying instalments on its debt obligations. As a consequence of the challenging chemical tanker market, the Company with support from its financial advisor ABG Sundal Collier is evaluating various alternatives to ensure adequate liquidity and longer term financial strength and flexibility. This includes evaluating alternatives for a restructuring of the balance sheet which is expected to result in a dilution of existing shareholders. As an integral part of this process, the Company is in discussions with its banks and their advisors, and representatives of the bondholders in relation to seeking a financial restructuring. The Company has a constructive dialogue with its lenders to secure a solution. Although no assurances can be given, Eitzen Chemical is confident that a solution to stabilize the financial position of the Company will be found with the support of its lenders. Outlook Despite a somewhat stronger market in the 1st quarter of 2012, Eitzen Chemical expects a continued challenging chemical tanker market in the short term and consequently a weaker spot market in the 2nd quarter. Moderate improvements are expected in the second half of 2012. The uncertainty with respect to world economic growth is an area of concern. The remaining orderbook[1] for chemical tankers (tankers below 60,000 dwt) is about 7 % of the fleet and the orderbook of smaller stainless steel vessels are only 0.9 % of the current fleet. In 2011, total deliveries of newbuildings were 4 million dwt, with scrapping of 1 million dwt, i.e. a net fleet growth of 3 million dwt, or 3.7 %, compared to 5.9 % in 2010 and 11.0 % in 2009. The industry expects a net annual fleet growth of approximately 4 % in 2012 and 2 % in 2013, depending on scrapping. Industry sources estimate that the tonne-mile demand for seaborne chemical transportation will increase with 5-8 % in 2012, depending on the world’s GDP growth. Hence, the development of the supply/demand balance is expected to continue being positive. When the remaining oversupply of chemical tankers has been absorbed, the chemical tanker market should see a significant recovery, both in rates and second hand values.
[1] Source: Clarkson Research

6
Forward looking statement This report contains forward looking statements. These statements are based upon various assumptions. Although Eitzen Chemical believes that these assumptions were reasonable when made, because assumptions are inherently subject to significant uncertainties and contingencies which are difficult or impossible to predict and are beyond its control. Eitzen Chemical cannot give assurance that it will achieve or accomplish these expectations, beliefs or intentions. No assurance can be given that the Company will be able at all times to be in compliance with all of its financial covenants towards its finance providers or to agree such necessary arrangements to timely secure full compliance with the terms of the agreements with its lenders. Such arrangements might require discussions with, amongst others, the Company’s lenders and such discussions might not be concluded and agreed in a timely manner, if at all.
Oslo, 22 May 2012
The Board of Directors of Eitzen Chemical ASA
Bjørn J. Sjaastad Chairman of the Board
Carl E. Steen Helene Jebsen Anker
Heidi Marie Petersen Aage R. B. Figenschou Per Sylvester Jensen Chief Executive Officer

7
See accompanying notes that are an integral part of these condensed consolidated financial statements.
Condensed Consolidated Income Statement(USD '000, except per share data)
2012Q1
(unaudited)
2011Q4
(unaudited)
2011Q1
(unaudited)
Freight revenue 105 598 105 298 101 321
Voyage expenses (54 586) (56 416) (51 882)
Freight income on T/C basis 51 012 48 882 49 439
Management fees and other income 1 361 1 904 1 023
Gross profit 52 373 50 786 50 462
Ship operating expenses (29 161) (30 389) (30 173)
Charterhire expenses (5 252) (8 399) (7 845)
General and administrative expenses (6 092) (6 335) (6 334)
EBITDA 11 868 5 663 6 110
Impairment - (62 510) -
Depreciation and amortization (16 173) (19 060) (20 015)
Gain/(loss) on sale of assets - (860) -
Operating result (EBIT) (4 305) (76 767) (13 905)
Interest income 47 65 130
Interest expense (10 742) (10 943) (10 804)
Other financial items (1 838) 10 096 (2 487)
Profit/(loss) before tax (16 838) (77 549) (27 066)
Income tax expense - (2 502) (17)
Net profit/(loss) (16 838) (80 051) (27 083)
Earnings per share (basic/diluted) (USD) (0.01) (0.07) (0.04)
Weighted average number of shares 1 128 022 323 1 128 022 323 754 177 831
Condensed Consolidated Statement of Comprehensive Income(USD '000)
2012Q1
(unaudited)
2011Q4
(unaudited)
2011Q1
(unaudited)
Net profit/(loss) (16 838) (80 051) (27 083)
Foreign currency translation differences 40 (24) 105
Other comprehensive income (loss), net of tax 40 (24) 105
Total comprehensive income (16 798) (80 075) (26 978)
Attributable to owners of the parent (16 798) (80 075) (26 978)

8
See accompanying notes that are an integral part of these condensed consolidated financial statements.
Condensed Consolidated Balance Sheet(USD '000) Note
201231.03
(unaudited)
201131.12
(audited)
Assets
Vessels 2 750 362 759 500 Vessels held under finance leases 2 232 486 235 637 Other non current assets 2 727 2 419
Total non-current assets 985 575 997 556
Trade and other receivables 50 396 62 375 Other current assets 25 083 22 861 Cash and cash equivalents 3 65 801 66 826
Total current assets 141 280 152 062
Total Assets 1 126 855 1 149 618
Equity and Liabilities
Equity 87 465 104 262 Treasury shares (116) (116)
Total equity 4 87 349 104 146
Interest bearing debt 5 753 908 761 666 Obligations under finance leases 5 180 979 186 587 Other non-current l iabil ities 609 562
Total non-current liabilities 935 496 948 815
Trade and other payables 54 870 70 786 Short term debt and current portion of long-term debt 5 26 099 11 669 Current portion of obligations under finance leases 5 13 587 13 406 Other current l iabil ities 9 454 796
Total current liabilities 104 010 96 657
Total liabilities -2417 1 039 506 1 045 472 -2633
Total Equity and Liabilities 1 126 855 1 149 618
9
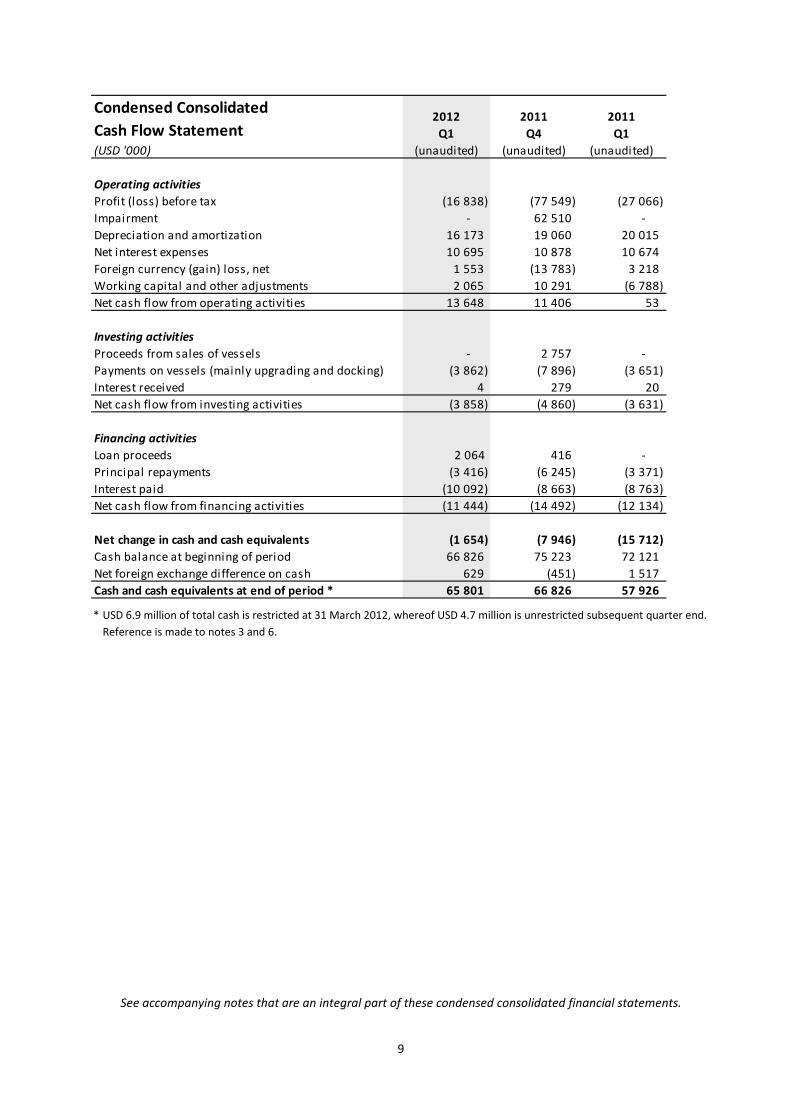
* USD 6.9 million of total cash is restricted at 31 March 2012, whereof USD 4.7 million is unrestricted subsequent quarter end.
Reference is made to notes 3 and 6.
See accompanying notes that are an integral part of these condensed consolidated financial statements.
Condensed Consolidated Cash Flow Statement (USD '000)
2012Q1
(unaudited)
2011Q4
(unaudited)
2011Q1
(unaudited)
Operating activitiesProfit (loss) before tax (16 838) (77 549) (27 066) Impairment - 62 510 - Depreciation and amortization 16 173 19 060 20 015 Net interest expenses 10 695 10 878 10 674 Foreign currency (gain) loss, net 1 553 (13 783) 3 218 Working capital and other adjustments 2 065 10 291 (6 788) Net cash flow from operating activities 13 648 11 406 53
Investing activitiesProceeds from sales of vessels - 2 757 - Payments on vessels (mainly upgrading and docking) (3 862) (7 896) (3 651) Interest received 4 279 20 Net cash flow from investing activities (3 858) (4 860) (3 631)
Financing activitiesLoan proceeds 2 064 416 - Principal repayments (3 416) (6 245) (3 371) Interest paid (10 092) (8 663) (8 763) Net cash flow from financing activities (11 444) (14 492) (12 134)
Net change in cash and cash equivalents (1 654) (7 946) (15 712) Cash balance at beginning of period 66 826 75 223 72 121 Net foreign exchange difference on cash 629 (451) 1 517 Cash and cash equivalents at end of period * 65 801 66 826 57 926

10
Employee benefit reserve The employee benefits reserve is used to record the value of the company’s share-based incentive program. Foreign currency translation reserve The foreign currency translation reserve is used to record exchange differences arising from the translation of the financial statements of subsidiaries in foreign currencies. Treasury shares The treasury shares is used to record purchase of own shares. The Company has 1 010 000 treasury shares. Revaluation reserve The revaluation reserves are used to record step by step revaluation in connection with purchase of subsidiary.
See accompanying notes that are an integral part of these condensed consolidated financial statements.
Condensed Consolidated Statement of Changes in Equity(USD '000)
2012 (unaudited) Attributable to equity holders of the parent company
Paid in capitalShare Share Employee Treasury Other Retained Reva- Trans- Total Total
capital premium benefit shares paid in earnings luation lation otherFigures in USD '000 reserve equity reserve reserves reserves At 1 January 2012 148 037 20 550 1 591 (116) 629 849 (705 365) 3 406 6 194 9 600 104 146 Profit (loss) for the period - - - - - (16 838) - - - (16 838) Other comprehensive income - - - - - - - 40 40 40
Total comprehensive income - - - - - (16 838) - 40 40 (16 798) At 31 March 2012 148 037 20 550 1 591 (116) 629 849 (722 203) 3 406 6 234 9 640 87 349
2011 (unaudited) Attributable to equity holders of the parent company
Paid in capitalShare Share Employee Treasury Other Retained Reva- Trans- Total Total
capital premium benefit shares paid in earnings luation lation otherFigures in USD '000 reserve equity reserve reserves reserves At 1 January 2011 128 279 19 458 1 145 (155) 597 818 (551 336) 3 406 6 819 10 225 205 435 Profit (loss) for the period - - - - - (27 083) - - - (27 083) Other comprehensive income - - - - - - - 105 105 105
Total comprehensive income - - - - - (27 083) - 105 105 (26 978) Share-based payment - - 98 - - - - - - 98 At 31 March 2011 128 279 19 458 1 243 (155) 597 818 (578 419) 3 406 6 924 10 330 178 555
Other reserves
Other reserves

11
Notes to the condensed consolidated financial statements Note 1 – Accounting principles Eitzen Chemical is a public limited company incorporated and domiciled in Norway which shares are listed on Oslo Stock Exchange. The Company’s address is Ruseløkkveien 6, P. O. Box 1794 Vika, 0122 Oslo, Norway. Basis of preparation The interim condensed consolidated financial statements for Eitzen Chemical have been prepared in accordance with International Accounting Standard IAS 34 “Interim Financial Reporting”. Going concern assumption The financial statements are based on the going concern assumption. We refer to the 2011 annual report and the Strategy and capital resources section in this interim report for further information. Significant accounting principles Each quarter the Company assesses whether there is an indication of asset impairment and whether assumptions in the value in use model used for impairment testing should be updated. Refer to note 2. A number of new accounting standards and amendments to standards have been issued by the IASB. Information about the content, implementation dates and related requirements for the issued but not yet adopted standards and amendments is included in the Significant accounting policies note in the 2011 annual report. None of the new accounting standards that came into effect on 1 January 2012 had a significant impact in the first quarter of 2012. The interim condensed consolidated financial statements do not include all the information and disclosures required in the annual financial statements, and should be read in conjunction with the annual financial statements as of 31 December 2011. The accounting principles used to prepare these interim financial statements are consistent with those used to prepare the annual financial statements.
12
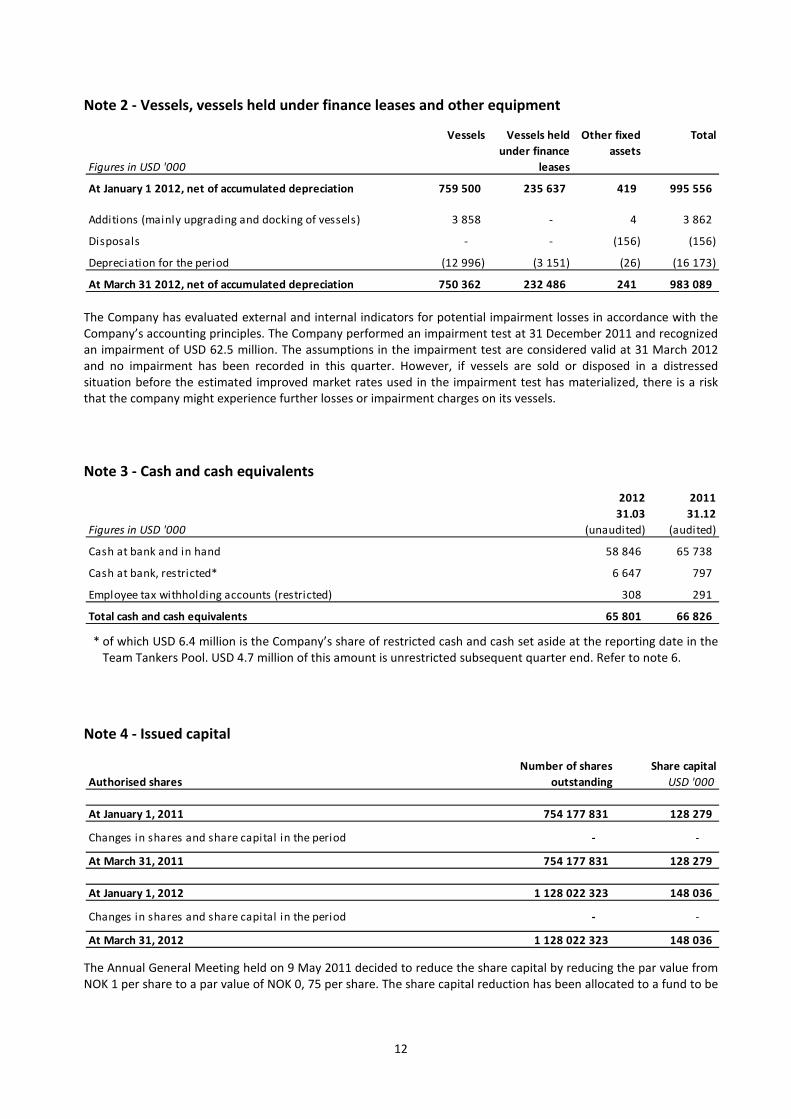
Note 2 - Vessels, vessels held under finance leases and other equipment
The Company has evaluated external and internal indicators for potential impairment losses in accordance with the Company’s accounting principles. The Company performed an impairment test at 31 December 2011 and recognized an impairment of USD 62.5 million. The assumptions in the impairment test are considered valid at 31 March 2012 and no impairment has been recorded in this quarter. However, if vessels are sold or disposed in a distressed situation before the estimated improved market rates used in the impairment test has materialized, there is a risk that the company might experience further losses or impairment charges on its vessels.
Note 3 - Cash and cash equivalents
* of which USD 6.4 million is the Company’s share of restricted cash and cash set aside at the reporting date in the
Team Tankers Pool. USD 4.7 million of this amount is unrestricted subsequent quarter end. Refer to note 6.
Note 4 - Issued capital
The Annual General Meeting held on 9 May 2011 decided to reduce the share capital by reducing the par value from NOK 1 per share to a par value of NOK 0, 75 per share. The share capital reduction has been allocated to a fund to be
Figures in USD '000
Vessels Vessels held under finance
leases
Other fixed assets
Total
At January 1 2012, net of accumulated depreciation 759 500 235 637 419 995 556
Additions (mainly upgrading and docking of vessels) 3 858 - 4 3 862
Disposals - - (156) (156)
Depreciation for the period (12 996) (3 151) (26) (16 173)
At March 31 2012, net of accumulated depreciation 750 362 232 486 241 983 089
Figures in USD '000
201231.03
(unaudited)
201131.12
(audited)
Cash at bank and in hand 58 846 65 738
Cash at bank, restricted* 6 647 797
Employee tax withholding accounts (restricted) 308 291
Total cash and cash equivalents 65 801 66 826
Authorised sharesNumber of shares
outstandingShare capital
USD '000
At January 1, 2011 754 177 831 128 279
Changes in shares and share capital in the period - -
At March 31, 2011 754 177 831 128 279
At January 1, 2012 1 128 022 323 148 036
Changes in shares and share capital in the period - -
At March 31, 2012 1 128 022 323 148 036
13
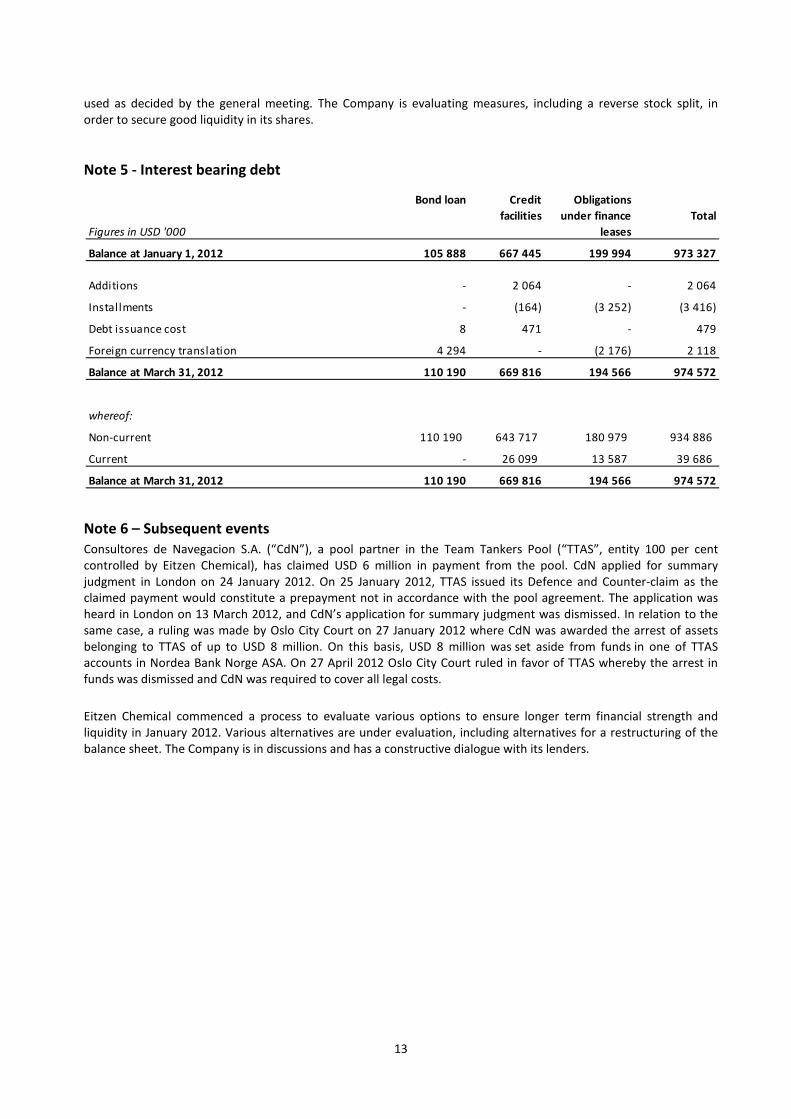
used as decided by the general meeting. The Company is evaluating measures, including a reverse stock split, in order to secure good liquidity in its shares.
Note 5 - Interest bearing debt
Note 6 – Subsequent events Consultores de Navegacion S.A. (“CdN”), a pool partner in the Team Tankers Pool (“TTAS”, entity 100 per cent controlled by Eitzen Chemical), has claimed USD 6 million in payment from the pool. CdN applied for summary judgment in London on 24 January 2012. On 25 January 2012, TTAS issued its Defence and Counter-claim as the claimed payment would constitute a prepayment not in accordance with the pool agreement. The application was heard in London on 13 March 2012, and CdN’s application for summary judgment was dismissed. In relation to the same case, a ruling was made by Oslo City Court on 27 January 2012 where CdN was awarded the arrest of assets belonging to TTAS of up to USD 8 million. On this basis, USD 8 million was set aside from funds in one of TTAS accounts in Nordea Bank Norge ASA. On 27 April 2012 Oslo City Court ruled in favor of TTAS whereby the arrest in funds was dismissed and CdN was required to cover all legal costs.
Eitzen Chemical commenced a process to evaluate various options to ensure longer term financial strength and liquidity in January 2012. Various alternatives are under evaluation, including alternatives for a restructuring of the balance sheet. The Company is in discussions and has a constructive dialogue with its lenders.
Figures in USD '000
Bond loan Credit facilities
Obligations under finance
leasesTotal
Balance at January 1, 2012 105 888 667 445 199 994 973 327
Additions - 2 064 - 2 064
Installments - (164) (3 252) (3 416)
Debt issuance cost 8 471 - 479
Foreign currency translation 4 294 - (2 176) 2 118
Balance at March 31, 2012 110 190 669 816 194 566 974 572
whereof:
Non-current 110 190 643 717 180 979 934 886
Current - 26 099 13 587 39 686
Balance at March 31, 2012 110 190 669 816 194 566 974 572

Eitzen Chemical ASARuseløkkveien 6
P.O. Box 1794 Vika0122 Oslo
Norway
eitzen-chemical.com


![THIRD QUARTER REPORT - Honda Pakistan · THIRD QUARTER REPORT DECEMBER 2017 "Makes all the difference" ((\\]fll ... 5.5t.%against USD and closod at 11 0.5. Agriculture Agricutture](https://static.fdocuments.in/doc/165x107/5f06dc5a7e708231d41a1987/third-quarter-report-honda-pakistan-third-quarter-report-december-2017-makes.jpg)