Eindhoven University of Technology MASTER Corona wind …Corona wind and heat transfer Vaessen,...
31
Eindhoven University of Technology MASTER Corona wind and heat transfer Vaessen, P.T.M. Award date: 1985 Link to publication Disclaimer This document contains a student thesis (bachelor's or master's), as authored by a student at Eindhoven University of Technology. Student theses are made available in the TU/e repository upon obtaining the required degree. The grade received is not published on the document as presented in the repository. The required complexity or quality of research of student theses may vary by program, and the required minimum study period may vary in duration. General rights Copyright and moral rights for the publications made accessible in the public portal are retained by the authors and/or other copyright owners and it is a condition of accessing publications that users recognise and abide by the legal requirements associated with these rights. • Users may download and print one copy of any publication from the public portal for the purpose of private study or research. • You may not further distribute the material or use it for any profit-making activity or commercial gain
Transcript of Eindhoven University of Technology MASTER Corona wind …Corona wind and heat transfer Vaessen,...

Eindhoven University of Technology
MASTER
Corona wind and heat transfer
Vaessen, P.T.M.
Award date:1985
Link to publication
DisclaimerThis document contains a student thesis (bachelor's or master's), as authored by a student at Eindhoven University of Technology. Studenttheses are made available in the TU/e repository upon obtaining the required degree. The grade received is not published on the documentas presented in the repository. The required complexity or quality of research of student theses may vary by program, and the requiredminimum study period may vary in duration.
General rightsCopyright and moral rights for the publications made accessible in the public portal are retained by the authors and/or other copyright ownersand it is a condition of accessing publications that users recognise and abide by the legal requirements associated with these rights.
• Users may download and print one copy of any publication from the public portal for the purpose of private study or research. • You may not further distribute the material or use it for any profit-making activity or commercial gain
AFDELING DER ELEKTROTECHNIEK
Vakgroep Technieken van de Energievoorziening (EHO)
Corona Wind and Heat Transfer
EH.85.A84
P.T.M. Vaessen
De afdellng der Elektrotechnlek van de
Technische Hogeschool Eindhoven aanvaardt
geen verantwoordellJkheld voor de lnhoud
van stage- en afstudeerverslagen.
Afstudeerwerk verricht o.l.v.
Prof. Dr. Ir. P.C.T. van der Laan
mei 1985
HOG ESC H 0 0 LT E C H N I S C H E E I N D H 0 V E N

ABSTRACT.
The convective heat transfer to or from a solid, can be significantly
enhanced by a nearby corona discharge, through the interaction of the
corona wind with the thermal boundary layer. Experimental measurements
have been performed to investigate the character of the corona wind.
Techniques used are: hot-wire anemometry and visualization with artifi
cial mist. A comparison between corona wind and wind originating from
an orifice shows that the heat transfer enhancement by corona wind is
surprisingly effective because the corona wind flows as a quite laminar
jet with a long reach and a small spread.
TABLE OF PHYSICAL CONSTANTS
Permittivity of vacuum
Relative permittivity of water
Electronic charge
Gravitational acceleration
Viscosity of air (N.T.P.)
Kinematic viscosity of air (N.T.P.)
Density of air (N.T.P.)
3
(0
(r
e
g
n
v
p
8.854 x 10⁻¹² l" -1.I:l
81
1.6 x 10⁻¹⁹ As
9.8 ms- 2
1.8 x 10⁻⁵ Nm- 2s
1.5 x 10- 5 m2s-1
1.2 kgm-3

- 4 -
CONTENTS
1. Introduction
2. The Negative Corona Discharge
3. Corona Wind
4. The Electric Wind System
5. Hot-Wire Anemometry
5.1. Theory
5.2. Experimental Setup
5.3. Measurements and Results
6. Visualization of Corona Wind
6.1. Artificial Mist generated by Solid Carbon Dioxide
6.2. Behaviour of Mist Particles in an Electric Wind
System
6.3. Experimental Setup
6.4. Results
7. Experiments with Titanium Tetrachloride
7.1. Characteristics of Titanium Tetrachloride
7.2. Experimental Setup
7.3. Results
8. Comparison of a Corona Wind Jet and an Orifice Jet
9. Discussion and Conclusions
REFERENCES
ACKNOWLEDGMENT
page
5
5
7
7
10
10
12
13
15
16
17
20
21
22
23
23
24
25
28
29
30
The enhancement of heat transfer across solid-gaseous interfaces by a
~earby corona discharge has been known si~ce 1899 (Chattock). In the
1960s increases of the heat transfer coefficient by about a factor
four above that for natural convection were measured. This resulted
in an intense research on this process throughout the world 1,2. Nowadays
several patents exist on the practical application of this phenomenon.
The heat transfer augmentation process is however, not yet clearly
explained. The corona wind itself, the character of the stream, the
interaction of charged particles with the target object, or a combination
of these factors may be responsible. The aim of this report is to find
which factor or factors are responsible for the observed heat transfer
enhancement. New applications of corona wind and an optimization of
already existing apparatus are then possible. Throughout the report we
employ S.I. units.
~. The Negative Corona Discharge.
In commercially used electric wind systems the corona discharge often
has a negative polarity and is of the so called "Trichel-type". The
main reason for choosing a negative instead of a positive discharge is
the fact that a negative corona discharge in a point ~o plate or a point
to rods configuration produces less ozone than a positive corona. Ozone
is a poisonous gas and a powerful oxidizing agent which attacks almost
all materi_a~ in the surroundings of the discharge. ~urthermore negative
coronas in ~lectron attaching gases burn more steadily up to currents of
30 ~A per point, with a concentrated ionization region. positive coronas
in the contrary have a tendency to show streamer filaments shooting
through the drift region towards the cathode at much lower currents than 30 ~A.
In a negative corona secondary processes at the cathode are possible,
this is the reason that negative coronas burn more steadily than positive
ones. The negative corona discharge of the "Trichel-type" 3 consists of
a negative electrode with a small radius of curvature and a positive
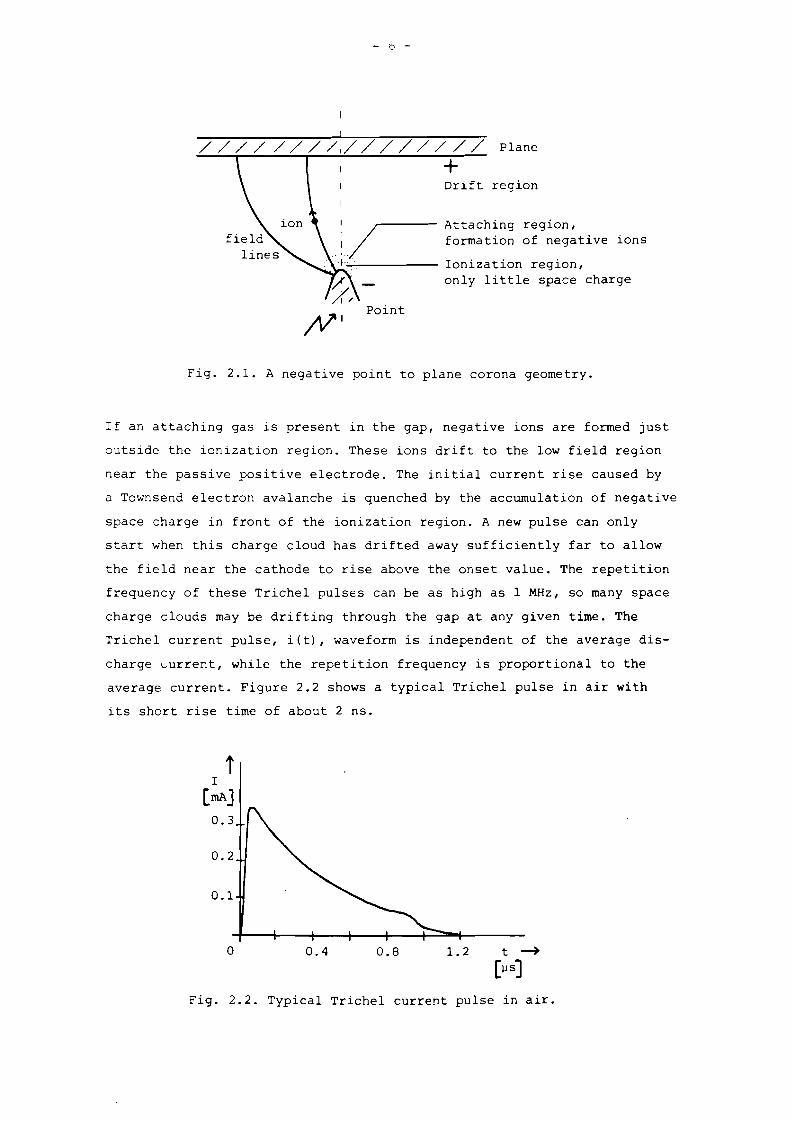
electrode, mainly acting as a charge collector. Figure 2.1 shows a
negative point to plane configuration with some important quantities.
The ionization processes take place in a very small region near the
electrode which is stressed by a negative high voltage higher than the
corona onset voltage.
- 0 -
/ / / / / / / /;/ / / / / / / / Plane
+Drift region
Attaching region,formation of negative ions
Ionization region,only little space charge
Point
Fig. 2.1. A negative point to plane corona geometry.
If an attaching gas is present in the gap, negative ions are formed just
outside the ionization region. These ions drift to the low field region
near the passive positive electrode. The initial current rise caused by
a Townsend electron avalanche is quenched by the accumulation of negative
space charge in front of the ionization region. A new pulse can only
start when this charge cloud has drifted away sufficiently far to allow
the field near the cathode to rise above the onset value. The repetition
frequency of these Trichel pulsEs can be as high as 1 MHz, so many space
charge clouds may be drifting through the gap at any given time. The
Trichel current pulse, i(t), waveform is independent of the average dis
charge ~urrent, while the repetition frequency is proportional to the
average current. Figure 2.2 shows a typical Trichel pulse in air with
its short rise time of about 2 ns.
1.20.80.4o
0.1
iI
[rnA]0.3
0.2
Fig. 2.2. Typical Trichel current pulse in air.

Corona Wind.
In a negative corona discharge in air the ionization takes place in a very
small region near the electrode with the smallest radius of curvature. The
rapidly drifting negative ions make frequent collisions with the neutral
molecules, so that they acquire a constant drift velocity. The force
caused by the electric field in the gap is then completely transferred
to the neutral gas. This is the essential element in the ion drag theory 4
The flow created in this manner is the corona wind, mostly consisting of
neutral gas molecules and thus resembling jet flow. The body force,
+F
+P E,
c(3.1)
+in which Pc is the charge density and E the electric field strength,
is a function of the location within the jet flow and acts throughout
the entire region between the electrodes. This force couples the
electrical and fluid dynamical behaviour of the corona discharge and
h . 5 hsows up as a source term in the Navier-Stokes equatlons . T e equations
governing the electric, velocity and temperature field form a large set
of coupled partial differential equations. The boundary conditions have
a large influence on the nature of the flow field but are often
difficult to formulate.
4. The Electric Wind System.
The electric wind system as shown in Fig. 4.1 consists of a flat 90°
edge of 1 mm thick brass and two parallel stainless steel rods of 5 mm
diameter. In this system d is the distance between the two rods and Sl
the distance between the point. and the plane of the rods. In commercially
used electric wind systems of this type (The METC-system, INTERPROBE Inc.,
Chicago) a flat plate is placed a distance h below the plane of the rods;
this plate may be the heat transfer surface in an oven. We consider the
point to be the center of a right handed cartesian coordinate system where
the x-axis is normal to the plane of the rods. A negative high voltage
is applied to the point, while the rods are grounded. The discharge is
run in the Trichel-pulse regime and is operated in atmospheric air.

- 8 -
Point
y
"W~--+- --- ---------z
Cc:R:O:d:S==:(======:::-=-=-=-:-:-=-=-=-lJ~~7 ---Fig. 4.1. Electric wind system.
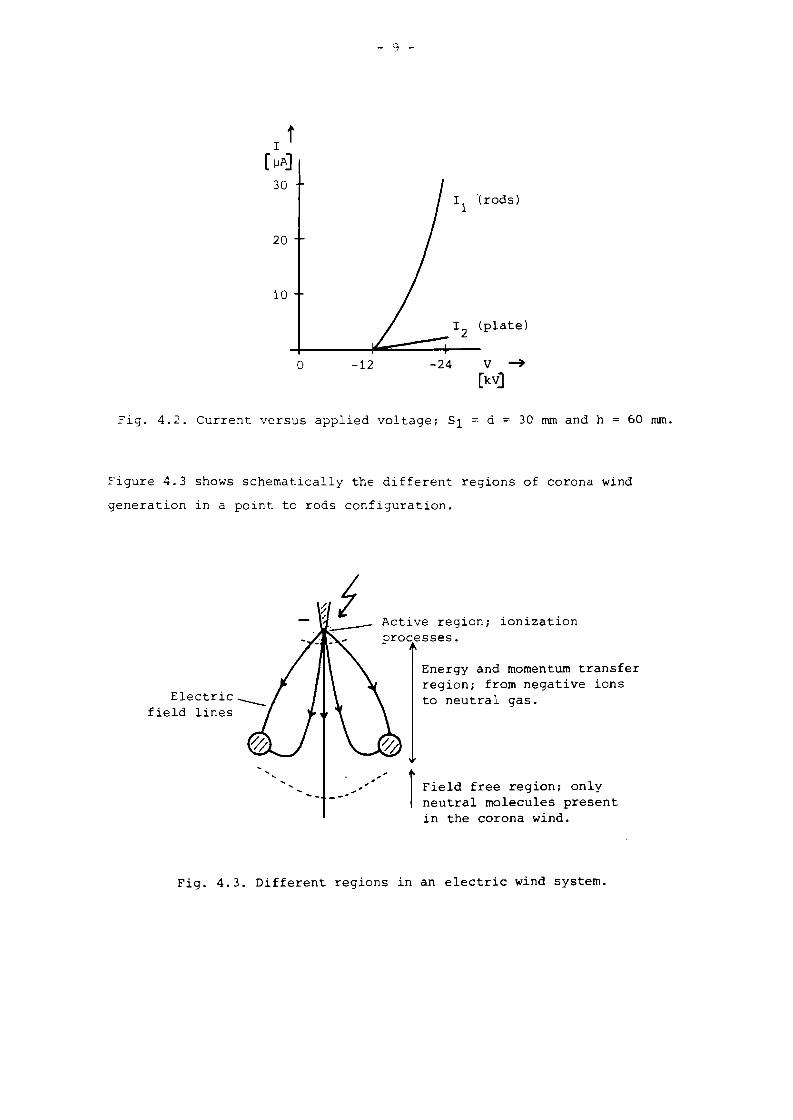
Figure 4.2 shows the current drawn to the rods versus the voltage applied
to the point. The voltage current characteristic follows the well known6
empirical formula
(4.1)
II is the current to the rods, V is the voltage applied to the point,
Vi is the corona onset voltage and Kl is a constant with dimensions
AV-2. When a grounded heat transfer plate is placed some distance below
the rods and the current, 12' drawn to this surface is measured we observe7
that
and
I «2
(4.2)
~ 4.3)
K2 is a constant with dimensions AV- l . The current 12 is small which
indicates that almost all ions reach the grounded rods. This is also
confirmed by the hot-wire anemometry measurements. The values for Kl and
K2 found from Fig. 4.2 are Kl = 1.8 x 10⁻¹³ AV- 2 and K2 = 1.5 x 10⁻¹⁰ AV- l .
- 9 -
11
(rodsl
12
(platel
-24-12o
10
20
I t[ llAJ
30
Fig. 4.2. Current versus applied voltage; 51 = d = 30 rom and h 60 rom.
Figure 4.3 shows schematically the different regions of corona wind
generation in a point to rods configuration.
Electric __field lines
Active region; ionizationprocesses.
Energy and momentum transferregion; from negative ionsto neutral gas.
, ,,
~- -' rField free region; onlyneutral molecules presentin the corona wind.
Fig. 4.3. Different regions in an electric wind system.
- 1.0 -
5. Hot-Wire Anemometry.
Anemometer measurements are based on a measurement of the convective
heat loss from an electrically heated fine wire 8. With this technique
measurement of air velocities down to 0.2 ms- l and turbulence frequencies
up to 100 kHz are possible. In Section 5.1 the theory of the constant
temperature hot-wire anemometry is presented. The Sections 5.2 and 5.3
deal with the experimental setup and the measurements respectively. In
the last Section, 5.4, the obtained results are presented.
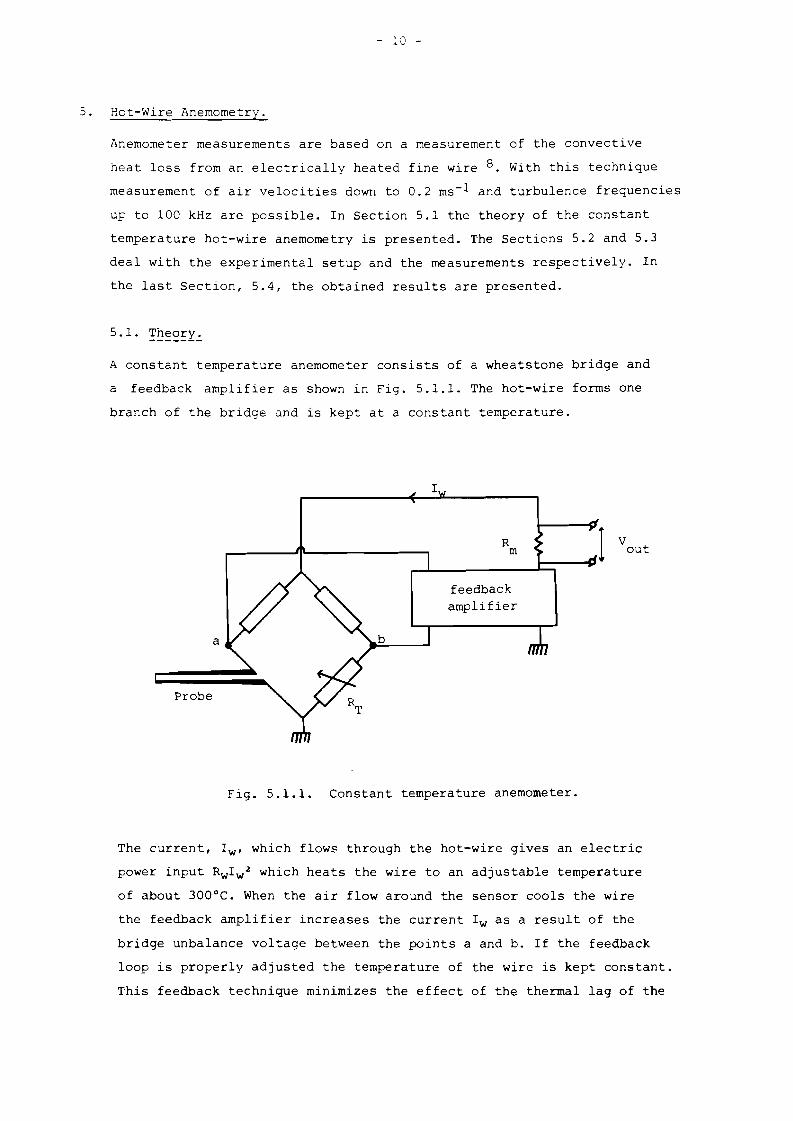
A constant temperature anemometer consists of a wheatstone bridge and
a feedback amplifier as shown in Fig. 5.1.1. The hot-wire forms one
branch of the bridge and is kept at a constant temperature.
I
a
Probe
vout
feedbackamplifier
Fig. 5.1.1. Constant temperature anemometer.
The current, I w' which flow~ through the hot-wire gives an electric
power input RwI w2 which heats the wire to an adjustable temperature
of about 300°C. When the air flow around the sensor cools the wire
the feedback amplifier increases the current I w as a result of the
bridge unbalance voltage between the points a and b. If the feedback
loop is properly adjusted the temperature of the wire is kept constant.
This feedback technique minimizes the effect of the thermal lag of the
- 11 -
wire and makes velocity measurements with turbulence frequencies up to
100 kHz possible. The instantaneous value of the electric power input,
usually measured as a voltage across a resistor, is not a simple function
of the velocity of the air flow. The output signal is also influenced by:
- non uniformities in temperature and flow pattern near the ends of
the hot-wire.
dirt and dust deposition on the wire.
- aging of the wire, due to prolonged operation at high temperatures.
variation in temperature and other properties of the surrounding
air.
the angle between the wire and the mean flo~ direction.
For these reasons calibration of a hot-wire sensor is always necessary.
Furthermore hot-wire readings are difficult to interpret because the
wire is mainly sensitive to velocities in a plane perpendicular to the
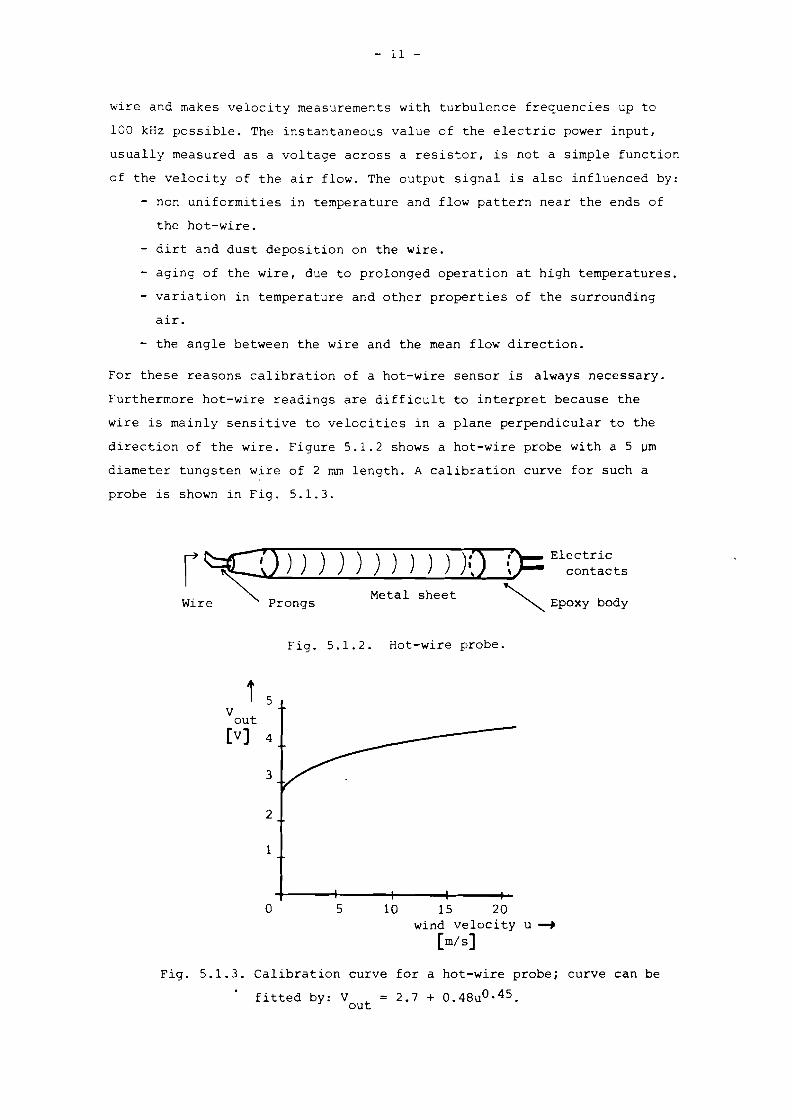
direction of the wire. Figure 5.1.2 shows a hot-wire probe with a 5 ~m
diameter tungsten wire of 2 rom length. A calibration curve for such a
probe is shown in Fig. 5.1.3.
r~O) )) ))le:a/ s~elt)OWlre Prongs
:):: Electric~ contacts
~ Epoxy body
Fig. 5.1.2. Hot-wire probe.
i 5v
out[v] 4
3
2
1
o 5 10 15 20wind velocity u -+
[m/s]
Fig. 5.1.3. Calibration curve for a hot-wire probe; curve can be
fitted by: Vout
2.7 + 0.48uO• 45 .

Figure 5.2.1 shows a block diagram of the experimental setup for the
determination of average wind velocities and the recording of the
anemometer output signal. The hot-wire probe in the electric wind
system can be moved in the x, y and z direction by means of a po
sitioning mechanism. The output signal of the anemometer unit can be
fed to an x-t recorder, an oscilloscope or a d.c. voltmeter. The
d.c. voltmeter measures the averaged signal of the anemometer unit as
the output of an additional low pass filter.
x - t-+-
recorder
Electric
d.c. wind system~
anemometeroscilloscope
supply with unit
probe
~d.c.
, ~ voltmeter
L.P.F.
Fig. 5.2.1. Block diagram of the experimental setup.
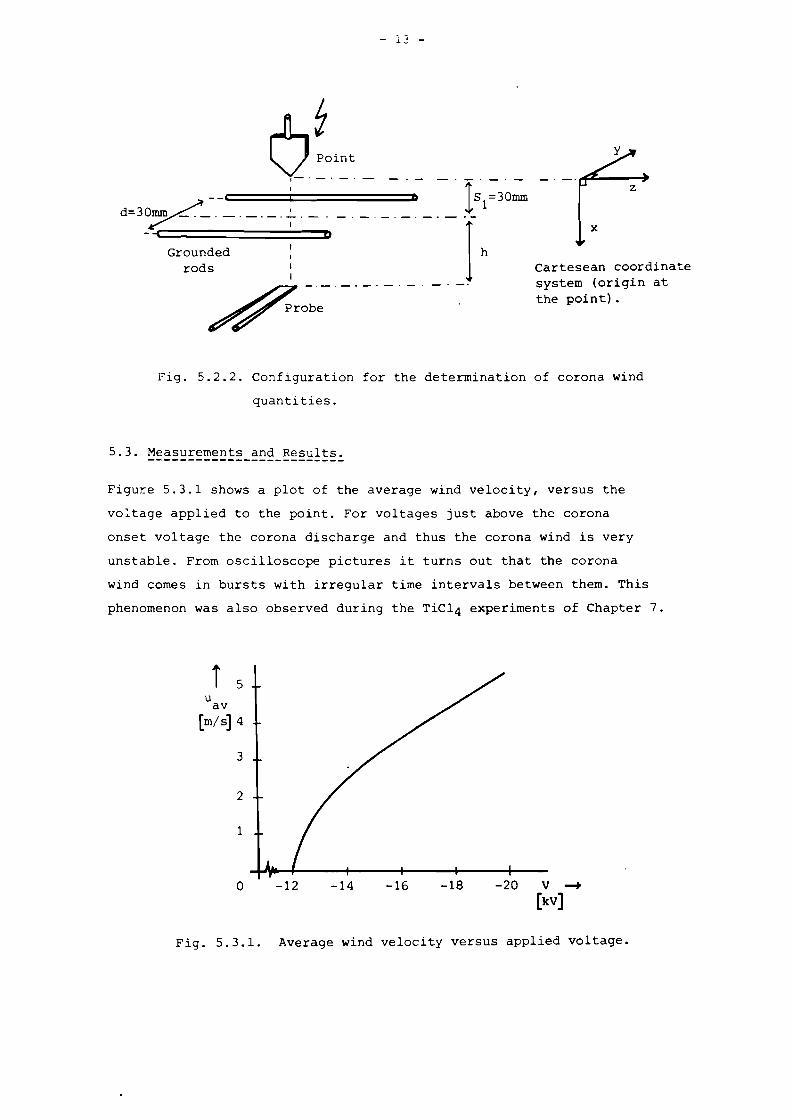
Figure 5.2.2 shows the configuration used for the determination of the
average wind velocity as a function of the voltage applied to the point.
For these measurements the probe is situated right below the corona
discharge point with a fixed value of h = 30 rom. This setup is also
used for measuring average wind velocity profiles. The probe is then
situated at a fixed value of h and the anemometer unit output signal
is recorded when the position of the probe is changed in the y and z
directions.
- 13 -
~ -'-'-'-'-'
// Probe
6~oint1-'--
I
d=307--· ( ._._.~.--.... 0
Groundedrods
..
Cartesean coordinatesystem (origin atthe point).
Fig. 5.2.2. Configuration for the determination of corona wind
quantities.
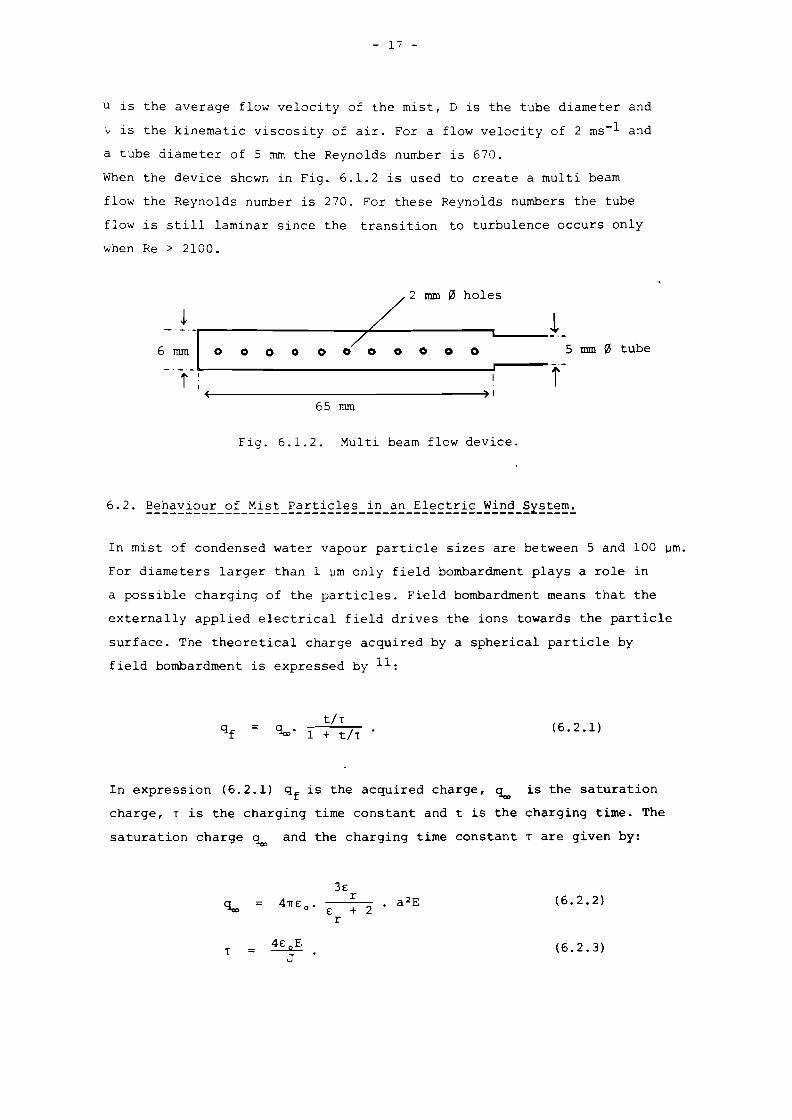
5.3. Measurements and Results.-_._----------------------
Figure 5.3.1 shows a plot of the average wind velocity, versus the
vo:tage applied to the point. For voltages just above the corona
onset voltage the corona discharge and thus the corona wind is very
unstable. From oscilloscope pictures it turns out that the corona
wind comes in bursts with irregular time intervals between them. This
phenomenon was also observed during the TiC14 experiments of Chapter 7.
2
3
u av[m/s] 4
-20 V-+[kV]
-18-16-14-12
1
5
o
i
Fig. 5.3.1. Average wind velocity versus applied voltage.

- 14 -
The average wind velocity is roughly proportional to the applied
voltage, at voltages well above the corona starting voltage:
u ~ Vav for V » V .•
l(5.3.1)
The results of Fig. 5.3.1 agree with the dependency of the average
wind velocity on the corona current 11:
u ~ ~l'av (5.3.2)
as is reported in the literature 1 From Eq. (4.1) we already knew:
together with Eq. (5.3.2) we get:
(5.3.3)
u av (5.3.4)
where K3 is another constant. Equation (5.3.4) is in agreement with
the plot shown in Fig. 5.3.1; for values of V well above the corona
onset voltage it reduces to Eq. (5.3.1). The corona wind jet has a long
reach of at least 25 cm in this electric wind system and hardly widens
witn increas~ng distance h below the rods. Figure 5.3.2 shows a
velocity profile for V = -16 kV and Sl = d = h = 30 rom.
The obtained velocity profiles for a fixed value of h are bell shaped.
The maximum velocity at the center decreases with increasing value of
h. The velocity profiles in the z direction are similar for all h while
those in the y direction are not. Furthermore the velocity profiles in
the y direction are wider than those in the z direction. This together
with the fact that the observed profiles in the y direction behave
differently, might indicate that the jet as a whole is moving more
in the y than in the z direction. A wiggling of the central core of
the jet was observed in Schlieren pictures 9

- J..') -
iu av
y direction
z direction
-30 -20 -10 o 10 20 30 coordinate -+[rom]
Fig. 5.3.2. Average wind velocity versus y and z coordinates;
51 = d = h = 30 rom, V = -16 kV.
Experiments with "shielding" devices 10 show that most of the negative ions
reach the grounded rods. A shielding device for the hot-wire sensor is a
device that should divert charged particles away from the wire and disturb
the flow field as little as possible. The experiments show no significant
differences between the readings of a shielded and an unshielded hot-wire
sensor for distances h greater than the rod to rod spacing d. An
additional test was to measure the current drawn by an unshielded hot
wire placed at a distance less than d below the plane of the rods;
even then this current was less than 0.05 ~A. This confirms the result
of Chapter 4 that most of the ions flow to the two grounded rods.
6. Visualization of Corona Wind
In this chapter a visualization technique is used to make the corona
wind flow visible. In Section 6.1 an artificial mist, generated by
solid carbon dioxide is used to make the corona wind flow pattern visible
near the discharge point. Section 6.2 deals with the behaviour of mist
particles in an electric wind system in order to determine if the
visual flow patterns are a true representation of the corona wind flow.
The experimental setup is the subject of Section 6.3 and some results
are presented in Section 6.4.

\ "- .1..C -
Figure 6.1.1 shows the pressure vessel in which the artificial mist is
generated. It contains water of approximately 60 e C and on top of it is
a heavy rubber membrane with a 5 mm diameter tube in it. When small
lumps of solid carbon dioxide (-80 e C) are put into the water the carbon
dioxide immediately starts to boil. The cold C02 bubbles rise to the
surface of the water and cool the air in the vessel. The air temperature
drops below the freezing point of water and the water vapour condenses
and forms a dense white mist. This mist is pushed through the tube by
the pressure built up by the carbon dioxide gas. By adjusting the rubber
membrane on top of the vessel is it possible to create a nearly constant
pressure and thus a constant flow of mist for a few minutes. The flow
velocity in the tube depends on the water temperature and the amount of
solid C02. The flow velocity was estimated by ticking against the tube
just above the rubber membrane and by measuring the time needed for the
disturbance to reach the flow exit. In this manner flow velocities between
0.5 and 2 ms- l were measured.
Snun 0 tube
I0° 0 0•• 0 0o 0 0 0o. 00
water L--=-e_,&~:
'" 12 cm
Solid CO2
Fig. 6.1.1. Pressure vessel for artificial mist generation.
For a tube flow the Reynolds number is defined as
Reu.D
\I(6.1.1)
- 17 -
u is the average flow velocity of the mist, D is the tube diameter and
v is the kinematic viscosity of air. For a flow velocity of 2 ms- l and
a tube diameter of 5 mm the Reynolds number is 670.
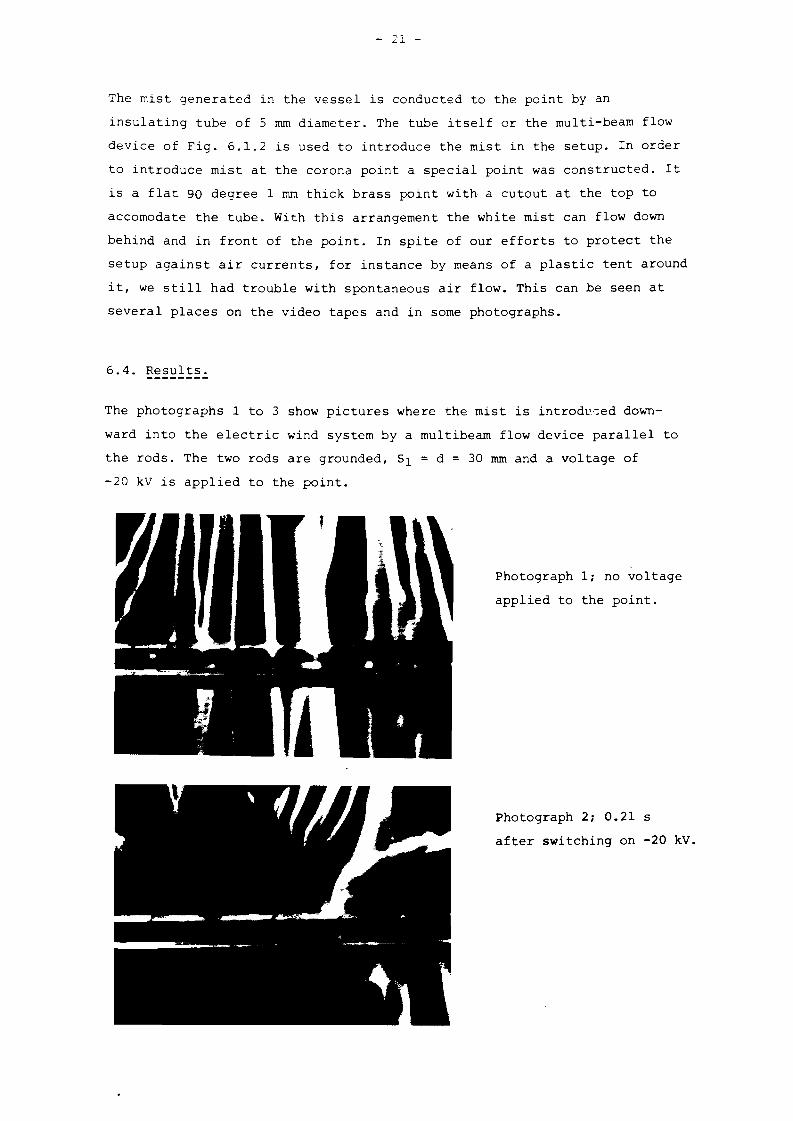
When the device shown in Fig. 6.1.2 is used to create a multi beam
flow the Reynolds number is 270. For these Reynolds numbers the tube
flow is still laminar since the transition to turbulence occurs only
when Re > 2100.
5 rom 0 tube
(
/2 rom ~ holes
~ -[--------o--o-/70'---O--O--O--O-\.:---~
6_~_, 0 0 0 0 i r)1
65 mm
Fig. 6.1.2. Multi beam flow device.
In mist of condensed water vapour particle sizes are between 5 and 100 urn.
For diameters larger than 1 urn only field bombardment plays a role in
a possible charging of the particles. Field bombardment means that the
externally applied electrical field drives the ions towards the particle
surface. The theoretical charge acquired by a spherical particle by
field bombardment is expressed by 11:
tITq",. 1 + tIT (6.2.1)
In expression (6.2.1) qf is the acquired charge, q", is the saturation
charge, T is the charging time constant and t is the charging time. The
saturation charge q", and the charging time constant T are given by:
3£4'11"£0·
r a 2 E (6.2.2)q", .£ + 2
r
T4£oE (6.2.3)
J

- 18 -
E is the charging field strength, a the particle radius, J the ion current
density, £r the relative permittivity of the particle and £0 the permittivity
of vacuum. A 20 ~m diameter mist particle (£r of water is 81) can reach
a saturation charge of 1.9 x 10⁻¹⁴ As or 1.2 x 10⁵ electronic charges in
an electric field of 6 kV (cm)-l. At voltages well above the corona onset
voltage the following forces act on a charged particle:
1. Gravitation force
+F
g+
mg, (6.2.4)
+where m is the mass of the particle and g the gravitational acceleration.
2. Electric force
+F
e(6.2.5)
+where qf is the acquired charge and E the field strength.
3. Friction force
+6nna~u, (6.2.6)
+where n is the gas viscosity, a the particle radius and ~u the velocity
difference between the particle and the surrounding gas. The friction
force as given above in Stokes law is valid if the sphere-Reynolds number
is less then 10. The sphere-Reynolds number is expressed by:
Res
(6.2.7)
+~u is the velocity difference between the particle and the surroun-
ding gas, a the sphere radius and v the kinematic viscosity.

- 19 -
4. Dipole force
... ...'V (poE) , (6.2.8)
...where p is the total dipole moment of the charged particle. The gravi-
tation force and the dipole force are small compared to the electric
force. For this reason the slow migration velocity of the particles
can be obtained from the equilibrium equation:
... ...F F
fe
or
... ...qfE 61TT1al',u.
From Eq. (6.2.10) we obtain:
(6.2.9)
(6.2.10)
...l',u (6.2.11)
... ...u is the velocity of the mist particles and U o the velocity of the
surrounding gas. We can characterize the motion of the mist particles
by introducing the dimensionless factor K, valid for absolute values:
Ku
1 + (6.2.12)
If the dimensionless factor K is close to unity the mist particles move
with the surrounding gas and are only little affected by the electric
field. For a factor K much greater than unity the velocity of the mist
particles is much greater than the gas velocity and is completely deter
mined by the electric field. Charging of mist particles mainly occurs
in the high field in the active region near the point. The gas velocity
near the point is very high, up to 20 ms-1 . The time available for
charging turns out to be small compared to the charging time constant

- 20 -
T in Eq. (6.2.3). Therefore qf remains only a fraction of the saturation
charge ~ in Eq. (6.2.2). For a 20 ~m diameter mist particle this
fraction turns out to be o. 2 ~. In that case a K-value of 1.27 in a
high field region of E 12 kV (cm)-l and a gas velocity of 10 ms- l is
obtained. If we assume that the charge which this 20 ~m diameter particle
acquires in the high field region remains constant we obtain a K-value of
1.17 in a region where E = 3kV (cm)-l and the gas velocity 4 ms- l . We see
that even for a mist particle which is charged in the vicinity of the
corona point the value of K is only a little more than unity. This
indicates that the velocity of the mist particles is only little affected
by the electric field of the corona discharge. In practice most of the
mist will be injected in a low field region, therefore the effect on
the gas velocity will be even less than calculated. The conclusion is that
the carbon dioxide generated mist can readily be used in an electric wind
system to visualize the gas flow.
Note that "filament" or "streak" lines as defined in Reference 12, are
made visible with this technique.
The experimental setup is shown in Fig. 6.3.1. In all experiments an
electric wind system is used with Sl = d = 30 rom. A SONY video camera
(AVC3250CE) is used for the recording, toghether with a U-matic recorder
(VO-2630) and a T.V. monitor. The camera is at 1.5 m distance from the
setup while the camera angle is 30°. A microphone is used to record the
parameters of the experiments on the soundtrack.
recorder Dmonitor
I( )1
d 30 rom
Fig. 6.3.1. Experimental setup.
30 rom
- Ll -
The mist generated in the vessel is conducted to the point by an
insulating tube of 5 mm diameter. The tube itself or the multi-beam flow
device of Fig. 6.1.2 is used to introduce the mist in the setup. In order
to introduce mist at the corona point a special point was constructed. It
is a flat 90 degree 1 mm thick brass point with a cutout at the top to
accomodate the tube. With this arrangement the white mist can flow down
behind and in front of the point. In spite of our efforts to protect the
setup against air currents, for instance by means of a plastic tent around
it, we still had trouble with spontaneous air flow. This can be seen at
several places on the video tapes and in some photographs.
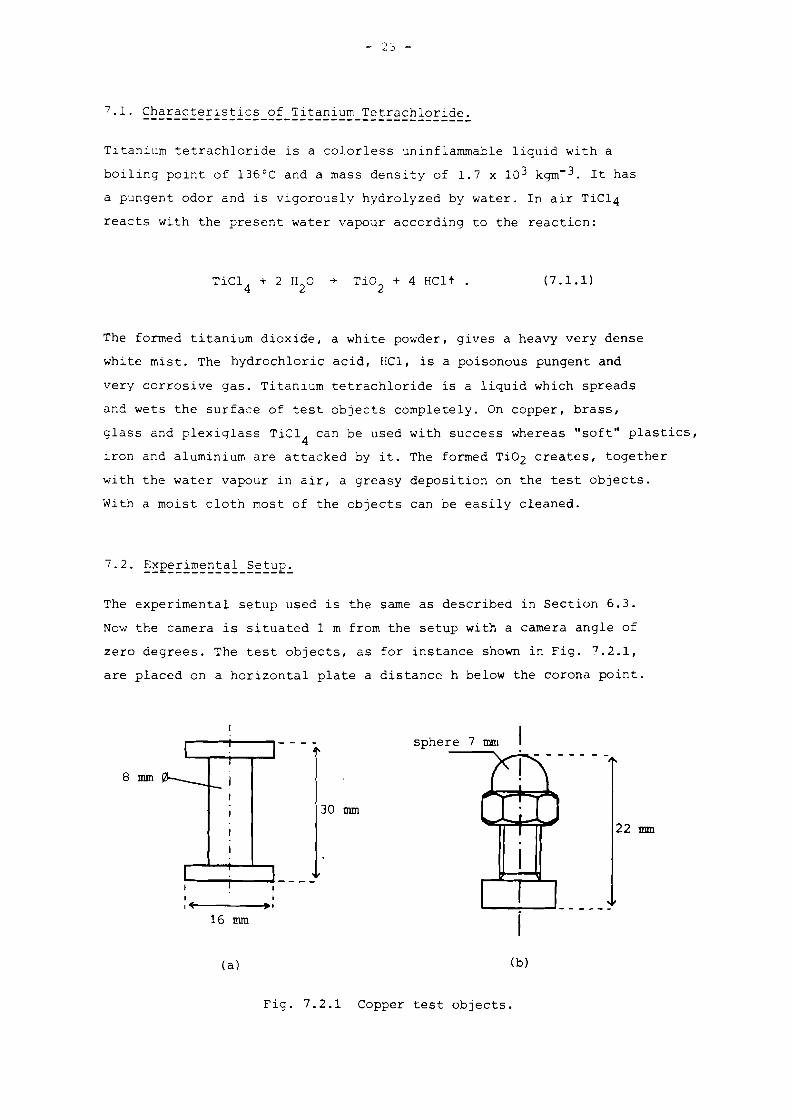
6.4. Results.
The photographs 1 to 3 show pictures where the mist is introd~~ed down
ward into the electric wind system by a multibeam flow device parallel to
the rods. The two rods are grounded, S1 = d = 30 mm and a voltage of
-20 kV is applied to the point.
Photograph 1; no voltage
applied to the point.
Photograph 2; 0.21 s
after switching on -20 kV.

- 22 -
Photograph 3; 1.67 s after
switching on -20 kV (steady
state) .
In about 1.5 s the flow has reached a steady state and from far left
and right the gas flow is directed towards the point and then pushed
down with great velocity between the rods. The diameter of the beam
below the rods is approximately 35 mm. At the center, just below the
point, the gas velocity has its maximum. This can be seen in the photo
graphs because the mist is thicker at the outside than at the center of
the flow. At higher gas velocities the mist bt;omes less dense because
of the quicker flow off of the mist particles while the supply rate is
still the same. Careful study of the video ~ape reveals that it takes
generally less than 0.04 s for the flow to respond to the applied
voltage and within one or two seconds a stationary flow is established.
At voltages below the corona onset voltage no effects on the mist flow
are observed.
7. Experiments with Titanium Tetrachloride.
In this chapter a technique is used to create thin layers of "mist" on
objects which are placed below the discharge point in an electric wind
sytem. The effects of the corona wind on such a layer, which simulates
a stationary boundary layer, can be investigated in this manner.
Section 7.1 starts with some characteristics of titanium tetrachloride.
In Section 7.2 the experimental setup is described and the results of
the experiments can be found in Section 7.3.
- 23 -
7.1. Characteristics of Titanium Tetrachloride.------------------------------------------
Titanium tetrachloride is a colorless uninflammable liquid with a
boiling point of 136°C and a mass density of 1.7 x 10 3 kgm-3. It has
a pungent odor and is vigorously hydrolyzed by water. In air TiC14
reacts with the present water vapour according to the reaction:
+ Ti02
+ 4 HClt . (7.1.1)
The formed titanium dioxide, a white powder, gives a heavy very dense
white mist. The hydrochloric acid, HC1, is a poisonous pungent and
very corrosive gas. Titanium tetrachloride is a liquid which spreads
and wets the surface of test objects completely. On copper, brass,
glass and plexiglass TiC14
can be used with success whereas "soft" plastics,
iron and aluminium are attacked by it. The formed Ti02 creates, together
with the water vapour in air, a greasy deposition on the test objects.
With a moist cloth most of the objects can be easily cleaned.
The experimental setup used is the same as described in Section 6.3.
Now the camera is situated 1 m from the setup with a camera angle of
zero degrees. The test objects, as for instance shown in Fig. 7.2.1,
are placed on a horizontal plate a distance h below the corona point.
Bmm
30 mm
sphere 7 mm
22 mm
""- ....1 _
16 mm
(a) (b)
Fig. 7.2.1 Copper test objects.

- 24 -
7.3. Results.
The photographs 4 and 5 show two TiC14 pictures with the test object
of Fig. 7.2.1 (a) placed below the corona point. The distance between
the corona point and the upper surface of the test object is 55 rom with
51 = d = 30 rom.
Photograph 4; applied voltage
-12 kV, stationary flow.
Photograph 5; applied voltage
-15 kV, stationary flow.
In photograph 4 the mist flows almost horizontally thus indicating that
the corona wind jet has a smaller diameter than the diameter of the test
object (16 rom). The video tape and the photographs show also the very
fast response of the TiC14 generated mist to the applied voltage as in
Chapter 6 with the artificial mist experiments. The already mentioned
bursts of the corona wind at voltages a little above the corona onset
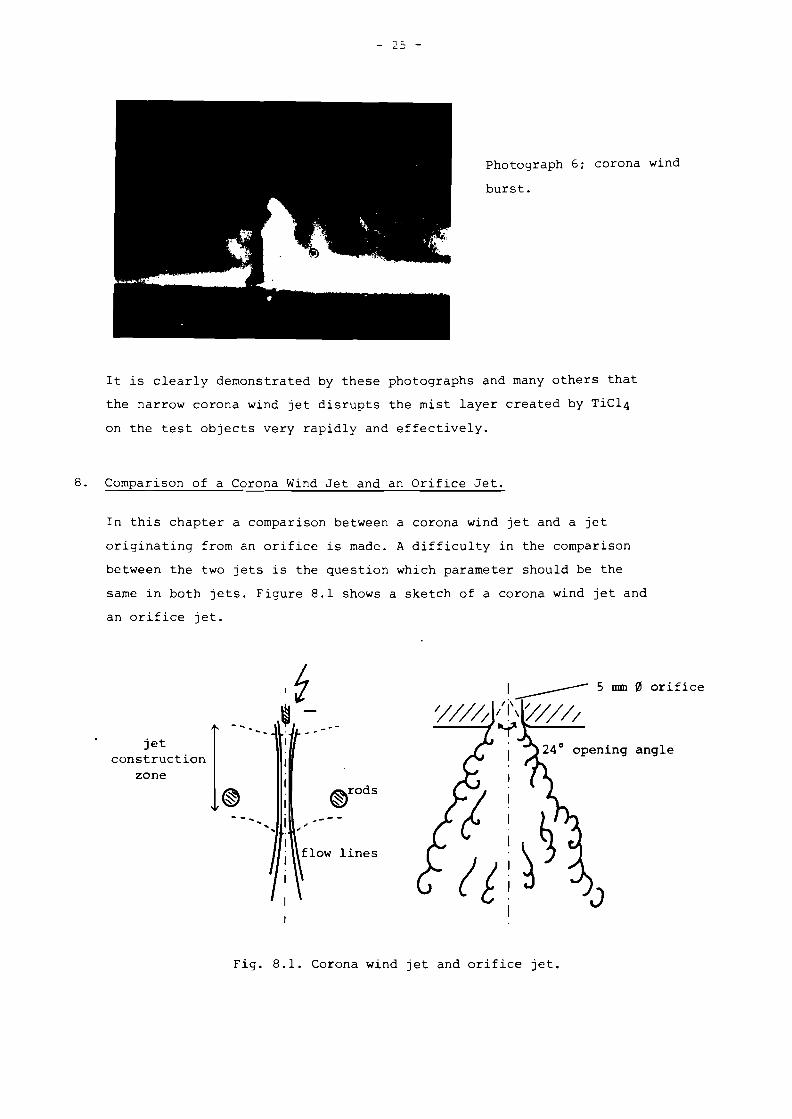
voltage are also observed in these experiments. Photograph 6 shows the
test object of Fig. 7.2.1 (b) during such a corona wind burst with an
applied voltage of -7 kV to the discharge point. The repetition frequency
of the bursts is between 0.1 and 1 Hz..
- 25 -
photograph 6; corona wind
burst.
It is clearly demonstrated by these photographs and many others that
the narrow corona wind jet disrupts the mist layer created by TiC14
on the test objects very rapidly and effectively.
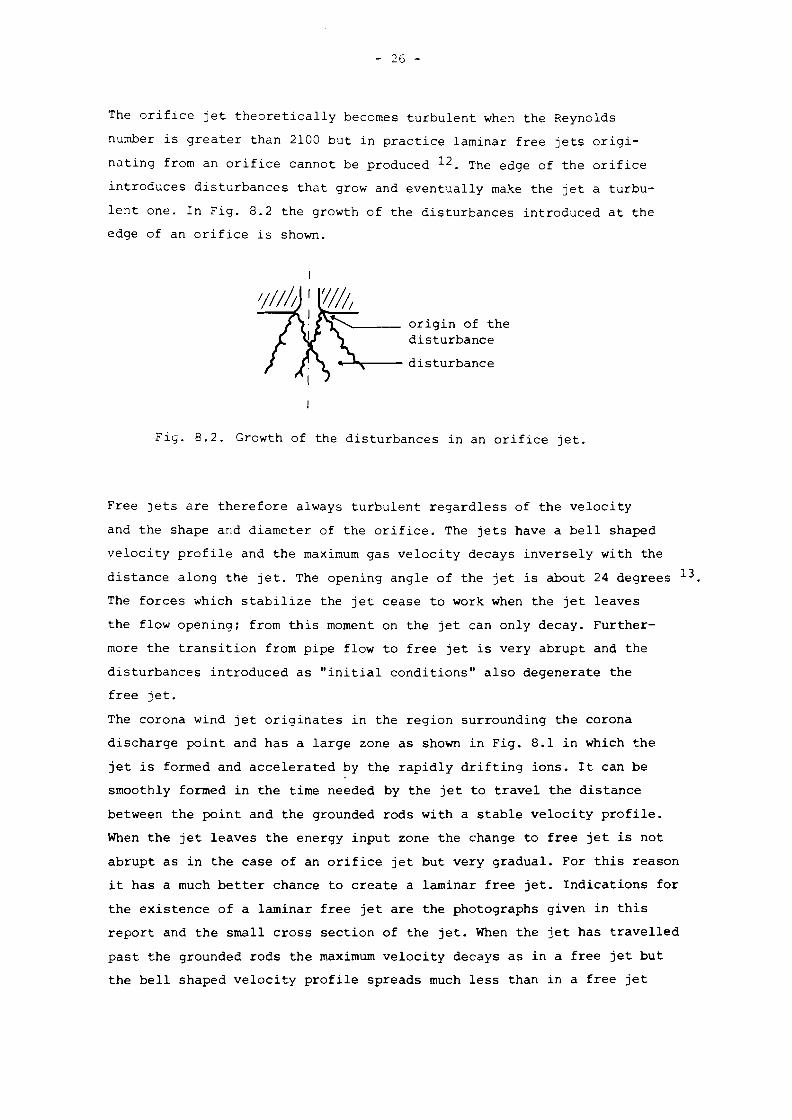
8. Comparison of a Corona Wind Jet and an Orifice Jet.
In this chapter a comparison between a corona wind jet and a jet
originating from an orifice is made. A difficulty in the comparison
between the two jets is the question which parameter should be the
same in both jets. Figure 8.1 shows a sketch of a corona wind jet and
an orifice jet.
jetconstruction
zone
.. ,~rods
~i- --
~~
flow lines
1 5 mm 91 orifice
///// /i\ /////---{"f' l'----i 24° opening angle
Fig. 8.1. Corona wind jet and orifice jet.
- 26 -
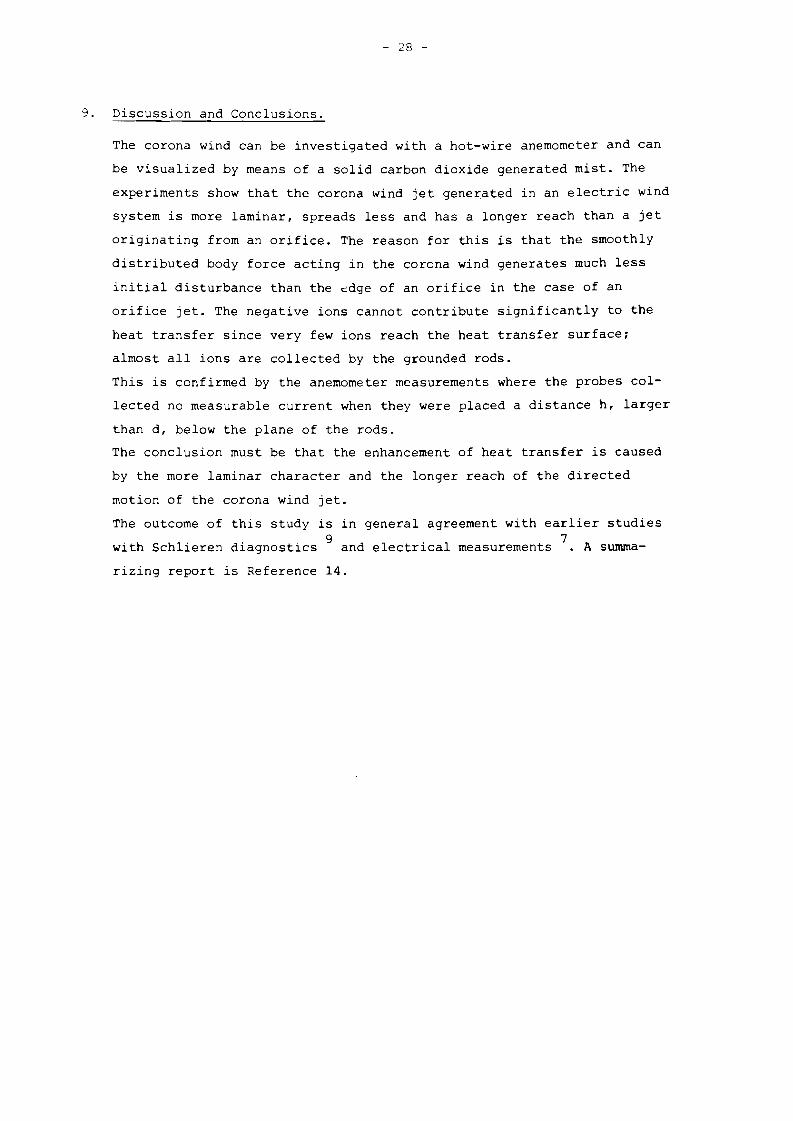
The orifice jet theoretically becomes turbulent when the Reynolds
number is greater than 2100 but in practice laminar free jets origi
nating from an orifice cannot be produced 12. The edge of the orifice
introduces disturbances that grow and eventually make the jet a turbu
lent one. In Fig. 8.2 the growth of the disturbances introduced at the
edge of an orifice is shown.
origin of thedisturbance
- ......--- disturbance
Fig. 8.2. Growth of the disturbances in an orifice jet.
Free jets are therefore always turbulent regardless of the velocity
and the shape and diameter of the orifice. The jets have a bell shaped
velocity profile and the maximum gas velocity decays inversely with the
distance along the jet. The opening angle of the jet is about 24 degrees 13
The forces which stabilize the jet cease to work when the jet leaves
the flow opening; from this moment on the jet can only decay. Further-
more the transition from pipe flow to free jet is very abrupt and the
disturbances introduced as "initial conditions" also degenerate the
free jet.
The corona wind jet originates in the region surrounding the corona
discharge point and has a large zone as shown in Fig. 8.1 in which the
jet is formed and accelerated by the rapidly drifting ions. It can be
smoothly formed in the time needed by the jet to travel the distance
between the point and the grounded rods with a stable velocity profile.
When the jet leaves the energy input zone the change to free jet is not
abrupt as in the case of an orifice jet but very gradual. For this reason
it has a much better chance to create a laminar free jet. Indications for
the existence of a laminar free jet are the photographs given in this
report and the small cross section of the jet. When the jet has travelled
past the grounded rods the maximum velocity decays as in a free jet but
the bell shaped velocity profile spreads much less than in a free jet

- 27 -
originating from an orifice. The conclusion is that in an electric wind
system the jet can be "better" generated than in the case of an orifice
jet. The electric wind system acts as a special nozzle which creates a
free jet with a laminar character, and so a greater range and a more
directed motion than in a jet originating from an orifice are possible.
- 28 -
9. Discussion and Conclusions.
The corona wind can be investigated with a hot-wire anemometer and can
be visualized by means of a solid carbon dioxide generated mist. The
experiments show that the corona wind jet gene~ated in an electric wind
system is more laminar, spreads less and has a longer reach than a jet
originating from an orifice. The reason for this is that the smoothly
distributed body force acting in the corona wind generates much less
initial disturbance than the edge of an orifice in the case of an
orifice jet. The negative ions cannot contribute significantly to the
heat transfer since very few ions reach the heat transfer surface;
almost all ions are collected by the grounded rods.
This is confirmed by the anemometer measurements where the probes col
lected no measurable current when they were placed a distance h, larger
than d, below the plane of the rods.
The conclusion must be that the enhancement of heat transfer is caused
by the more laminar character and the longer reach of the directed
motion of the corona wind jet.
The outcome of this study is in general agreement with earlier studies
with Schlieren diagnostics 9 and electrical measurements 7. A summa
rizing report is Reference 14.
- 29 -
REFERENCES
(1) Robinson, Mo, Movement of air in the electric wind of the corona
discharge, AlEE Trans., 114, pp. 143-150 (1961).
(2) Mitchel, A.So and LoE. Williams, Heat transfer by the corona wind
impinging on a flat surface, J. Electrostatics, ~, pp. 309-324 (1978) 0
_ (3) Goldman, M. and A. Goldman, Corona discharges in "Gaseous Electronics
Vol. I", M.No Hirch and H.J.· Oskam (editors), Academic Press (1978).
(4) Stuetzer, O.M., Ion drag pressure generation, J. Appl. Phys., 30,
pp. 984-994 (1959).
(5) Kulacki, F.A., Electrohydrodynamic enhancement of convective heat
and mass transfer in "Advances in transport processes", A.S. Mujumdar
and R.A. Mashelkar (editors), Wiley Eastern Limited (1982) .
• (6) Lama, WoL. and C.F. Gallo, Systematic study of the electrical
characteristics of the "Trichel" current pulses from negative needle
to-plane coronas, J. App1. Phys., 45, pp. 103-113 (1974).
(7) Kadete, Ho, Negative corona current characteristics of an electric
wind system, EHO MEMO 84/26 (February 1984).
(8) Bradshaw, Po, Chapter 5 in "An introduction to turbulence and its
measurements", Pergamon Press (1971) 0
(9) Kadete, H., Schlieren measurements on corona wind, EHO MEMO 84/28
(August 1984) 0
(10) Vaessen, PoT.Mo, Hot-wire anemometer study of the electrical wind in
an electric wind system, EHO MEMO 84/36 (December 1984) .
. (11) Masuda, S., Recent progress in electrostatic precipitation, 4th. conf.
on static electrification, London 5-8 May 1975, The Institute of
Physics Con~erence Series no. 27, pp. 154-171 (1975).
(12) Tritton, D.J., Chapter 11 in "Physical fluid dynamics", Van Nostrand
Reinhold Company (1977).
(13) Rajaratnam, N., Chapter 2 in "Turbulent jets", Elseviers Scientific
Publishing Company (1976).
(14) Kadete, H., P.T.M. Vaessen and P.C.T. van der Laan, Enhancement of
heat transfer by corona wind, To be published in the proceedings of
the 7th. International Symposium on Plasma Chemistry, Eindhoven
July 1-5 (1985).
EHO MEMOS are internal reports of the High Voltage Group of the
Eindhoven University of Technology.

- 30 -
ACKNOWLEDGMENT
This study is a continuation of research carried out by mr. H. Kadete
of the University of Dar es Salaam, Tanzania. A summarizing publication
on this cooperation is Reference 14.
I gratefully acknowledge the enthusiastic technical support by
mr. P.F.M. Gulickx. I am also grateful for the technical assistance
given by mr. N. Gijsbers with the video work.
Finaly I would like to thank mrs. R. Blatter for typing the manuscript.