EIA-Final-Report (1)
14
ENVIRONMENTAL IMPACT ASSESSMENT CONCRETE BATCHING PLANT JUNE 1, 2016 GROUP 40 Elliot Gorman Peter Pham Katherine Rose Schwartz Andy Van
-
Upload
katherine-schwartz -
Category
Documents
-
view
39 -
download
1
Transcript of EIA-Final-Report (1)

ENVIRONMENTAL IMPACT ASSESSMENT CONCRETE BATCHING PLANT
JUNE 1, 2016
GROUP 40
Elliot Gorman Peter Pham
Katherine Rose Schwartz Andy Van

CIVL3010: EIA Final Report
Group 40 Page | 1
Contents 1. Brief Background & Site Description .............................................................................................. 2
2. Project Impacts ............................................................................................................................... 2
3. Significant Impacts ......................................................................................................................... 3
3.1 Noise ............................................................................................................................................. 3
3.1.1 Noise criteria ......................................................................................................................... 3
3.1.2 Quantifying Noise .................................................................................................................. 3
3.1.3 Noise Contribution from Agitator Trucks .............................................................................. 4
3.2 Traffic ........................................................................................................................................... 5
3.2.1 Victoria St .............................................................................................................................. 5
3.2.2 Frank St .................................................................................................................................. 5
3.3 Waste ........................................................................................................................................... 6
4. Community Consultation ................................................................................................................ 7
5. Alternative Technologies ................................................................................................................ 7
6. Alternative Sites ............................................................................................................................. 8
6.1 Criteria ...................................................................................................................................... 8
6.2 Suggested Site .......................................................................................................................... 8
6.3 Alternative Site 1: St Marys ...................................................................................................... 8
6.4 Alternative Site 2: Yennora ....................................................................................................... 9
7. Recommendation ........................................................................................................................... 9
8. Reflections on EIA ......................................................................................................................... 10
8.1 Strengths of EIA .......................................................................................................................... 10
8.2 Flaws of EIA ................................................................................................................................ 10
8.3 Improvements ............................................................................................................................ 10
9. Reference ..................................................................................................................................... 11
10. Appendix .................................................................................................................................. 12
Appendix A: Calculation of source noise .......................................................................................... 12
Appendix B: Calculation of agitator truck noise ............................................................................... 12
B1: Victoria St (Reference AB) ...................................................................................................... 12
B2: Frank St (Reference AC) ......................................................................................................... 12
Appendix C: Calculation of traffic volume ........................................................................................ 12
C1: Victoria St ............................................................................................................................... 12
C2: Frank St .................................................................................................................................. 13
Appendix D: Calculation of slurry waste .......................................................................................... 13
Appendix E: Calculation of water waste ........................................................................................... 13

CIVL3010: EIA Final Report
Group 40 Page | 2
1. Brief Background & Site Description The Development project proposed is a concrete batching plant situated at 376-‐384 Victoria St, Wetherill Park (Fairfield City Council). The site is between Frank Street and Victoria Street, and just East of Elizabeth Street. Wetherill Park It lies 34 km west of Sydney’s central business district and has a high proportion of immigrants. The majority of the suburb is an industrial area with 6,026 people living in the southeast sector. The northern edge of the suburb lies along the Prospect Nature Reserve. The suggested site has a total area of 115,000 m2 and lies in the largest industrial area in the southern hemisphere.
The purpose of the batching plant will be to serve the needs of local contractors with a supply of 50,000m3 of concrete per annum with 190 trucks accessing the site daily. The site will employ 8 people and will operate 24/7 under the provision that noise and traffic regulations are satisfied.
2. Project Impacts A concrete batching plant combines various ingredients to produce concrete: calcium, silica, alumina, magnesia, iron oxide, sulfur dioxide compounds, fly ash, aggregates, and admixtures. Poorly monitored batching plants have the potential to release highly alkaline wastewater, dust, excess noise and other impacts outlined in table 2.1. Traffic and parking assessment, air quality assessment, a surface water management plan, a waste management plan, and an environmental noise assessment need to be assessed and analysed.
Figure 1.1: Aerial map view of site
Table 2.1: Impact Analysis Table
CIVL3010: EIA Final Report
Group 40 Page | 3
3. Significant Impacts 3.1 Noise 3.1.1 Noise criteria The project noise criterion has been set out by the NSW Industrial Noise Policy 1999. The standard and non-‐standard operating hours were determined by adding +5dBA and +10dBA to background noise, respectively (Table 3.1.1). For the proposed development, background noise was assumed since no data exists for the site.
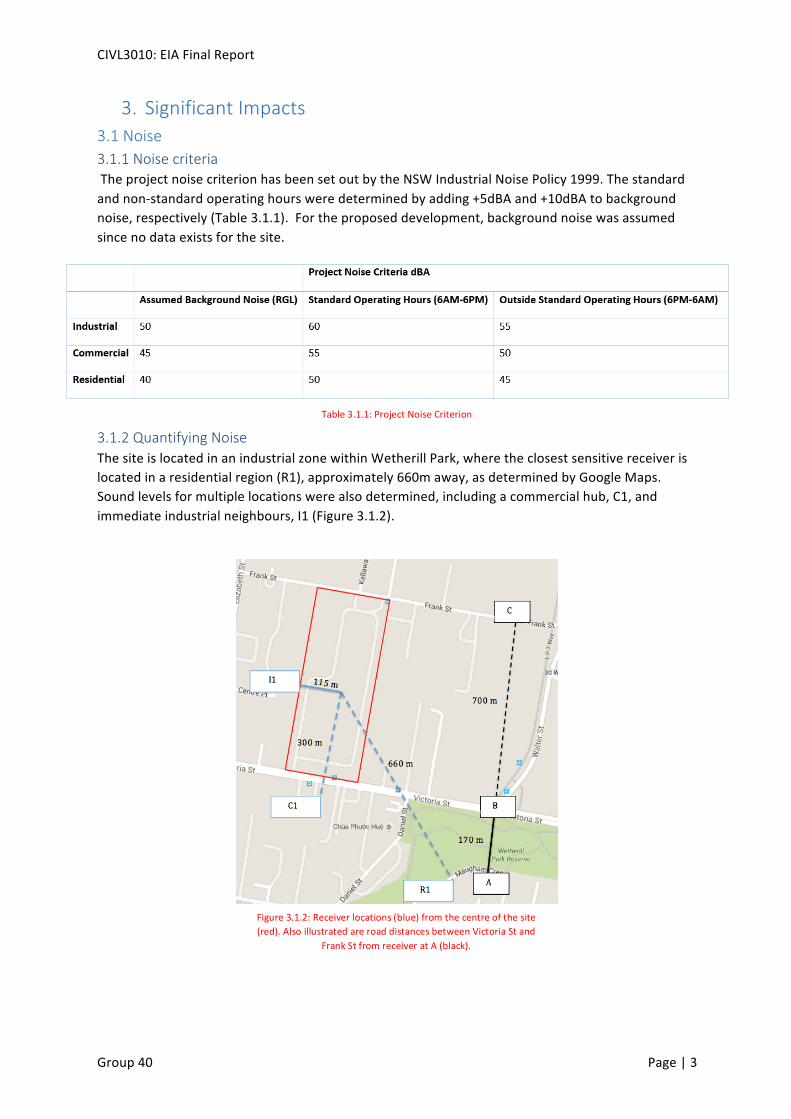
3.1.2 Quantifying Noise The site is located in an industrial zone within Wetherill Park, where the closest sensitive receiver is located in a residential region (R1), approximately 660m away, as determined by Google Maps. Sound levels for multiple locations were also determined, including a commercial hub, C1, and immediate industrial neighbours, I1 (Figure 3.1.2).
Table 3.1.1: Project Noise Criterion
Figure 3.1.2: Receiver locations (blue) from the centre of the site (red). Also illustrated are road distances between Victoria St and
Frank St from receiver at A (black).

CIVL3010: EIA Final Report
Group 40 Page | 4
To quantify the noise levels, sound pressure levels from a similar development by Holcim, Perth, were used to determine the site noise (URS 2012). Holcim measured the sound pressure level from the slumping and loading processes of three agitator trucks simultaneously, measuring a sound pressure level of approximately 55dBA at 100 metres. Operating sound pressure level at 10 metres was back calculated to be 75dBA (Ref. Appendix A). All locations were found to comply with the noise criterion as determined in section 3.1.1 (Table 3.1.3).
3.1.3 Noise Contribution from Agitator Trucks To determine suitable road noise, sound pressure levels for a single agitator truck (AS2436-‐2010 Table A.1) was used to calculate the noise level between Victoria Street and Frank Street, and the residential receiver (Figure 3.1.2). Trucks utilising Victoria Street do not comply with the residential sound limit of 50dBA (Table 3.1.4). Comparatively, trucks utilising Frank Street produced sound levels below the lowest limit of 45dBA for non-‐standard operating hours (Ref. Appendix B).
This indicates 24-‐hour operation may be possible if trucks are directed to Frank Street during non-‐standard hours. However, despite satisfying the noise criterion, sound pressure levels were only marginally lower, and noise mitigation should still be considered. Hoppers, silos and conveyors should be lined with sound-‐deadening material, compressors and pumps should be concealed, and fine aggregates should be weighed first.
Table 3.1.3. Sound Pressure Level of Receivers
Table 3.1.4. Sound pressure levels of Victoria Street and Frank Street from a receiver in the residential region.

CIVL3010: EIA Final Report
Group 40 Page | 5
3.2 Traffic 3.2.1 Victoria St The site has access to two roads. The southern road, Victoria Street, is a 4-‐lane undivided road with bus lanes either side. To quantify the road system, the Road and Maritime Services traffic volume data was utilized to determine vehicle counts during peak hour (RMS 2016). Approximately 875 vehicles travelled in the eastern direction every hour, where 10% was assumed to consist of heavy vehicles equivalent to 3.5pcu/hr. The addition of 16 agitator trucks yields a total traffic volume of 1152pcu/hr (Ref. Appendix C1), which is well below the capacity of Victoria Street as determined in Table 4.3 of the RTA Guide to Traffic Generating Developments.
3.2.2 Frank St The northern road, Frank Street, is a single-‐laned road with adjacent parking, corresponding to a capacity of 900pcu/hr (RTA 2002). Since traffic data was not available, an estimation based on the gross floor area was used, yielding a volume of 345 vehicles per hour during peak periods. Similarly, the addition of 16 trucks did not impact this road system, producing a total traffic volume of 489pcu/hr, remaining below the roads capacity (Ref. Appendix C2).
The proposed development should not impact the road systems. Although Frank St is more advantageous during peak hours, manoeuvrability will be limited. Additionally, main roadways such as the Cumberland Highway, Greater Western Highway or M4, will still be accessible.
Figure 3.2.1. Victoria Street Entrance Figure 3.2.2. Frank Street Entrance

CIVL3010: EIA Final Report
Group 40 Page | 6
3.3 Waste The number of waste streams identified for the proposed development has been narrowed down to three main concrete batching byproducts.
The first form will be solid waste and will generally be in the form of excess concrete. The plant will be producing specific volumes for contracted jobs, therefore, excess concrete waste will be minimal and completely recycled. All excess concrete will be returned to the plant and transported to licensed recycling facilities, such as the Elizabeth Drive Landfill Facility.
The second waste stream will be washout slurry. Boral Concrete and Quarries Country Queensland (BCQCQ) states that approximately 25 tonnes/week is produced for 70 truck movements per day (Planning NSW 2003). Assuming similarity, the amount of slurry produced from the proposed development will be approximately 68 tonnes/week or 2.8% (Ref. Appendix D). This waste will be sent to licensed recycling facilities in accordance with the POEO (Waste) Regulation 2005.
The final waste stream is the amount of water utilized on site. Using waste production from BCQCQ (Planning NSW 2003), an estimated 32,000 cubic metres of water will be used, amounting to 64.3% of the total plant capacity (Ref. Appendix E). In addition to the 2.8% contribution from slurry, this totals 67% of the plant capacity, and is greater than the 63% target as set out by the Waste Avoidance and Resource Recovery Act 2007.
The proposed development has neglected to specify any form of water treatments on-‐site. To comply with legislations, water treatment must be incorporated, since the largest contribution is from water. Facilities such as stormwater run-‐off tanks and washout pits or ponds are highly recommended.
Figure 3.3.1 Waste Treatment Pyramid

CIVL3010: EIA Final Report
Group 40 Page | 7
4. Community Consultation The main stakeholders for this project are the Fairfield city council, New South Wales Environment Protection Authority, and the neighbours in the community.
In order to respond to the concerns of stakeholders who are adversely affected by or had concerns about the project, we want to bring a focus to community involvement with the design/construction of this concrete batching plant. Because of this, it is important to have an interactive engagement process with the community to work collaboratively with them to achieve a common understanding of the happenings at the plant. In order to facilitate this interaction, we will have two dialogue processes that reach out to the entire community.
The demographics of Fairfield City Council show that there is an even distribution of people aged above and below 40, and we wanted to ensure all members of the community have the opportunity to be engaged with this project. The two dialogue processes we came up with were first, there will be community meetings where members of the community can participate in a series of 2-‐3 hour sections in a series of consecutive weeks while the decision-‐making process is occurring. In addition, we will create an online forum where community members can find the newest information on the concrete batching plant, participate in polls, and facilitate an online discussion.
This method of interaction helps to target and involve the younger part of the community. The community meetings will occur during the initial decision-‐making process; we want this deliberative dialogue to reach a common ground for construction.
Once we get to the construction stage these meetings will evolve into information sessions to keep the community informed on what is going at the site and if there are any changes or new technologies. It is important that we have limits on what is negotiable between the project and the community members during the weekly meetings prior to construction. This way we can ensure that while the community members have a voice, there will not be delays with the construction moving forward.
5. Alternative Technologies Some alternative technology that will mitigate dust emissions at batching plants are:
-‐ Use chemical suppressant products, or practice regular light watering -‐ The layout and design of the site itself will ideally minimize truck travel distances by putting
truck and wash facilities near the exit of the site and maintaining vehicle speed limits and regular sweeping to prevent dust build up.
-‐ As for the aggregate that is stored on site in stockpiles, these should be contained in storage bunkers with windshields that project above the bunker wall, and these bins should be filled with at least 0.5m of room at the top to prevent too much blowing in the wind.
-‐ The conveyors should also have design to prevent fugitive dust emissions by covering them with a roof and installing side protection barriers and implementing spill trays.
-‐ Belt cleaning devices can also be installed to reduce spillage. -‐ Mixer loading areas should also be roofed on either side. -‐ Water sprays and an air extraction and filtration system would also minimize the dust. -‐ Fabric filters are another alternative technology that can be installed in storage silos so that
concentration of solid particles doesn’t exceed 100 mg.m3.

CIVL3010: EIA Final Report
Group 40 Page | 8
6. Alternative Sites 6.1 Criteria The criteria set for choosing a site for this project are:
-‐ The site area must be large enough to accommodate the project. This includes sufficient area for the required equipment, office space and storage warehouse.
-‐ Any roads surrounding the site should be low traffic and very wide. This is to accommodate trucks going in and out of the compound. The site should also be close to major roads, highways and motorways to allow ease of transportation to and from the site
-‐ There should be public transport available nearby for the employees to commute. -‐ The site should be far away from noise receivers and any nature reserves, parks and river
6.2 Suggested Site The suggested site at Wetheril Park for the concrete batching plant meets all the criteria set above. Therefore it is a suitable site for the project. The suggested site is large enough, with bus stop right outside on Victoria Street. Also all surrounding roads have low traffic and connect to major highways.
6.3 Alternative Site 1: St Marys 40 Forrester Rd, St Marys NSW is a candidate for an alternative site with an area of 130,000m2, with a bus stop and train station 400m from the site. The issues associated with this site are noise and the environmental impacts. The nearest noise receptor is 350m away and the main route that the trucks take to reach the Great Western Highway, via Glossop Street, is residential housing on one side. The site is also situated next to South Creek Park, with Whalan Reserve 1.3km away. Therefore any air and water pollution could affect the local flora and fauna in the area.
Figure 6.3.1. Aerial map view of St Marys Site

CIVL3010: EIA Final Report
Group 40 Page | 9
6.4 Alternative Site 2: Yennora The second alternative site is at 38 Pine Rd, Yennora NSW, this site is very similar to the suggested site. As it is also situated in an industrial estate, with a site area of 120,000m2. The nearest noise receptor is 600m away and Fairfield Road Park is 500m away. Yennora train station is 500m away and there is also a freight train line across the road, which could be utilised to transport materials and aggregates to the plant. This site is also close to Horsley drive, which connects to the Cumberland highway, M4, M5 and M7. The only potential issue is that there is already an established concrete batching plant nearby, therefore demand may not be as high.
7. Recommendation It is recommended that the project should proceed at either the Wetheril Park or Yennora site. As these two sites satisfy the all of the criteria set for choosing a site for this project. But we don’t recommend the alternative site at St Marys as it produces too many issues in the form of noise to the local residents as well as pollution to the environment and the local flora and fauna.
Figure 6.4.1. Aerial map view of Yennora Site

CIVL3010: EIA Final Report
Group 40 Page | 10
8. Reflections on EIA The purpose of an EIA is to identify the potential effects a project may have on its surrounding environment and determine a suitable site for the project. The EIA process consists of:
-‐ Examining the project proposal and its site location. -‐ Identifying and assess all impacts based on the site location and the surrounding
environment. -‐ Identify any significant/major impacts and find ways of mitigation and management. -‐ Consult with stakeholders and the local community where the project is to be built. -‐ Review all the information obtained from the project proposal, site location, impact
assessment and consultation. And determine if the project proposal is suitable for the current site.
8.1 Strengths of EIA The strengths of an EIA include:
-‐ A thorough assessment of the environmental, social and economic impacts. -‐ Incorporates public opinion and community consultation, into the project stages to ensure
that all stakeholders associated are satisfied with the project. -‐ Provides mitigation and management of impacts for the project, to minimise the effect of
impacts on the surrounding environment.
8.2 Flaws of EIA The flaws of an EIA include:
-‐ The EIA process is quite lengthy and will take a lot of time and dedication to complete properly.
-‐ EIA reports are generally quite long and difficult to understand with a lot of technical jargon and calculations.
8.3 Improvements Several improvements which could be incorporated into the EIA process include:
-‐ Having a set guideline and specific detail for what should be included in an EIA. This reduces any redundant information and ensures that lesser technical jargon is used to allow a better understanding.
-‐ An online website, for users to generate an EIA, with a pre-‐set template. This will allow an EIA to be easily generated by any user and allows multiple users to work on an EIA together.

CIVL3010: EIA Final Report
Group 40 Page | 11
9. Reference NSW Industrial Noise Policy 1999, viewed 16 May 2016, http://www.epa.nsw.gov.au/noise/industrial.htm/
Planning NSW, 2003, Assessment Report for Development Application No. DA-‐76-‐2-‐3003-‐I Pursuant to Section 80 of the Environmental Planning and Assessment Act, 1979, Department of Urban and Transport Planning, Sydney, viewed 17 May 2016, http://majorprojects.planning.nsw.gov.au/index.pl?action=view_job&job_id=1910/
Protection of the Environment Operations Act 1997, viewed 15 May 2016, http://www.epa.nsw.gov.au/legislation/actsummaries.htm/
Protection of the Environment Operations (Waste) Regulation 2005, viewed 16 May 2016, http://www.legislation.nsw.gov.au/inforce/15937bef-‐eef8-‐c8ed-‐d2c1-‐dd4c148cc79c/2005-‐497.pdf/
Roads and Maritime Services, Traffic Volume Viewer, 2016. RMS, New South Wales, viewed 17 May 2016, http://www.rms.nsw.gov.au/about/corporate-‐publications/statistics/traffic-‐volumes/index.html/
RTA Guide to Traffic Generating Developments 2002, viewed 15 May 2016, http://www.rms.nsw.gov.au/documents/projects/guide-‐to-‐generating-‐traffic-‐developments.pdf/
Standards Australia 2010, Australian Standard AS2436: Guide to noise and vibration control on construction, demolition and maintenance sites, Standards Australia, Sydney.
URS 2012, Report: Environmental Management Plan East Perth Concrete Batching Plant, URS Australia Pty Limited, Western Australia, viewed 17 May 2016, http://www.vincent.wa.gov.au/files/bbf31579-‐9249-‐4ed5-‐8e79-‐a166010d828c/tesg0276r6_east_perth_cbp_emp.pdf/
Waste Avoidance and Resource Recovery 2007, viewed 17 May 2016, http://www.epa.nsw.gov.au/resources/wastestrategy/070226-‐WARR-‐report07.pdf/
NSW Department of Planning & Environment, Environmental Impact Assessments 2016, viewed 20 May 16, https://www.planningportal.nsw.gov.au/lodge-‐track-‐applications/lodge-‐your-‐application-‐or-‐certificate/lodge-‐your-‐application-‐department/environmental-‐impact-‐assessment
Australian Government: Department of Environment, Environmental Assessments 2016, viewed 20 May 2016, https://www.environment.gov.au/protection/environment-‐assessments
Environmental Protection Authority, EIA Process 2016, viewed 20 May 2016, http://www.epa.wa.gov.au/eia/assessdev/Pages/default.aspx

CIVL3010: EIA Final Report
Group 40 Page | 12
10. Appendix Appendix A: Calculation of source noise The noise level at a distance 𝑅#, from the receiver, 𝑅$, can be calculated as follows.
𝑆𝑜𝑢𝑛𝑑 𝑃𝑟𝑒𝑠𝑠𝑢𝑟𝑒 𝐿𝑒𝑣𝑒𝑙 𝑆𝑃𝐿 = 𝑆𝑃𝐿2 − 10 log𝑅$#
𝑅##
Where, 𝑆𝑃𝐿2 = 𝑠𝑜𝑢𝑛𝑑 𝑝𝑟𝑒𝑠𝑠𝑢𝑟𝑒 𝑙𝑒𝑣𝑒𝑙 𝑎𝑡 𝑎 𝑘𝑛𝑜𝑤𝑛 𝑙𝑜𝑐𝑎𝑡𝑖𝑜𝑛 𝑅$ = 𝑠𝑒𝑛𝑠𝑖𝑡𝑖𝑣𝑒 𝑟𝑒𝑐𝑒𝑝𝑡𝑜𝑟 𝑝𝑜𝑖𝑛𝑡 𝑅# = 𝑙𝑜𝑐𝑎𝑡𝑖𝑜𝑛 𝑜𝑓 𝑘𝑛𝑜𝑤𝑛 𝑠𝑜𝑢𝑛𝑑 𝑝𝑟𝑒𝑠𝑠𝑢𝑟𝑒
Therefore, using an estimated sound pressure level of 55 dBA at 100 metres (Holcim), the source sound pressure at 10 metres from the site can be calculated as:
𝑆𝑃𝐿$A = 55 − 10 log10#
100#
= 75 𝑑𝐵𝐴
Appendix B: Calculation of agitator truck noise B1: Victoria St (Reference AB) Taking 𝑆𝑃𝐿2 = 76 𝑑𝐵𝐴 at 10 m for a single agitator truck (AS2436-‐2010 Table A.1)
𝑆𝑃𝐿GH = 76 − 10 log170#
10#
= 51.39 𝑑𝐵𝐴 > 50 𝑑𝐵𝐴
B2: Frank St (Reference AC) Similarly, using an 𝑆𝑃𝐿2 = 76 𝑑𝐵𝐴.
𝑆𝑃𝐿GM = 76 − 10 log700#
10#
= 39.1 < 45 𝑑𝐵𝐴
Appendix C: Calculation of traffic volume C1: Victoria St From Table 4.3 of the RTA Guide to Traffic Generating Development 2002, a 4-‐lane undivided road has a capacity of 1800 𝑝𝑐𝑢/ℎ𝑟, assuming clearway conditions due to the presence of bus lanes on either side. Traffic volume data estimated to be 3500 𝑣𝑒ℎ𝑖𝑐𝑙𝑒𝑠/ℎ𝑟 during peak hour (6AM-‐10AM and 3PM-‐7PM) Therefore,
𝑁𝑢𝑚𝑏𝑒𝑟 𝑜𝑓 𝑣𝑒ℎ𝑖𝑐𝑙𝑒𝑠 𝑝𝑒𝑟 ℎ𝑜𝑢𝑟 =35004
= 875 𝑣𝑒ℎ𝑖𝑐𝑙𝑒𝑠/ℎ𝑟 Total of 190 trucks per day yields approximately 16 trucks per hour. Assuming 10% of the volume consist of heavy vehicles then, 88 heavy vehicles per hour. Each heavy vehicle is equivalent to 3.5 pcu. Hence,
𝑇𝑜𝑡𝑎𝑙 𝑝𝑎𝑠𝑠𝑒𝑛𝑔𝑒𝑟 𝑐𝑎𝑟 𝑢𝑛𝑖𝑡 𝑝𝑒𝑟 𝑝𝑐𝑢 = 876 − 88 + 88 + 16 ∗ 3.5 = 1152 𝑝𝑐𝑢/ℎ𝑟 < 1800 𝑝𝑐𝑢/ℎ𝑟

CIVL3010: EIA Final Report
Group 40 Page | 13
C2: Frank St From Table 4.3 of the RTA Guide to Traffic Generating Development 2002, a single-‐laned road with adjacent parking lane has a capacity of 900 pcu/hr. According to Table 3.7 of the RTA Guide to Traffic Generating Development, if no traffic data exists then an estimate of volume can be determined by calculating the gross floor area (GFA) of buildings along Frank St. Taking measurements from Google Maps, an approximation can be determined.
𝐺𝐹𝐴 = 138000𝑚# From Table 3.7 for industrial factories during peak periods, the ratio of vehicles to gross floor area is 1/100𝑚 #. Therefore,
𝑁𝑢𝑚𝑏𝑒𝑟 𝑜𝑓 𝑣𝑒ℎ𝑖𝑐𝑙𝑒𝑠 =𝐺𝐹𝐴4ℎ𝑟
∗1
100𝑚#
=1380004 ∗ 100
= 345 𝑣𝑒ℎ𝑖𝑐𝑙𝑒𝑠/ℎ𝑟 Assuming heavy vehicle capacity of 10%, then 34.5 heavy vehicles per her utilize the road space. Hence,
𝑇𝑜𝑡𝑎𝑙 𝑝𝑐𝑢 = 345 − 35 + (35 + 16) ∗ 3.5 = 488.5 𝑝𝑐𝑢/ℎ𝑟 < 900 𝑝𝑐𝑢/ℎ𝑟
Appendix D: Calculation of slurry waste According to Boral Concrete and Quarries Country Queensland, 25 tonnes/week of slurry is produced in washout pits for 70 truck movements per day. Assuming similarity,
𝐴𝑚𝑜𝑢𝑛𝑡 𝑜𝑓 𝑠𝑙𝑢𝑟𝑟𝑦 =2570
∗ 190
= 67.86 𝑡𝑜𝑛𝑛𝑒𝑠/𝑤𝑒𝑒𝑘 The percentage of waste relative to the total production capacity can be calculated as follows,
𝑃𝑒𝑟𝑐𝑒𝑛𝑡𝑎𝑔𝑒 =67.86 ∗ 52125000
= 2.8%
Appendix E: Calculation of water waste Boral Concrete and Quarries estimates approximately 1184 𝑚a/𝑦𝑟 of contaminated water will be utilized for 70 truck movements per day.
𝐴𝑚𝑜𝑢𝑛𝑡 𝑜𝑓 𝑤𝑎𝑡𝑒𝑟 =118470
∗ 190
= 32137 𝑚a/𝑦𝑟 Therefore, the percentage of contaminated water relative to the total production capacity can be calculated as follows,
𝑃𝑒𝑟𝑐𝑒𝑛𝑡𝑎𝑔𝑒 =3213750000
= 64.27%