Egypt Grain and Feed Annual Egypt Streamlines Its Grain ... GAIN Publications/Grain...FAS Cairo...
19
THIS REPORT CONTAINS ASSESSMENTS OF COMMODITY AND TRADE ISSUES MADE BY USDA STAFF AND NOT NECESSARILY STATEMENTS OF OFFICIAL U.S. GOVERNMENT POLICY Date: GAIN Report Number: Approved By: Prepared By: Report Highlights: MY 2017/18 wheat imports are forecast at 11.5 million metric tons (MMT). MY 2016/17 wheat imports are being revised downward to 11.0 MMT, 7.2 percent lower than USDA’s official forecast of 11.8 MMT. The decrease is due to foreign exchange (FOREX) challenges that importers faced before the Egyptian Pound was floated in November 2016. After the devaluation, imports have slowed down. Post forecasts MY 2017/18 corn imports at 8.6 MMT. Post is also revising MY2016/17 corn imports to 8.6 MMT from USDA’s estimate of 9.0 MMT for the same reasons. FAS Cairo expects the government will newly permit rice exports by year’s end, which could result in MY 2017/18 shipments of up to 300 TMT of milled rice and 150 TMT of broken rice exports. Ahmed Wally Ron Verdonk Egypt Streamlines Its Grain Import Procedures And Eases Import Regulations While Rice Exports Should Begin To Rebound Over The Coming Year Grain and Feed Annual Egypt 3/15/2017 Required Report - public distribution
Transcript of Egypt Grain and Feed Annual Egypt Streamlines Its Grain ... GAIN Publications/Grain...FAS Cairo...

THIS REPORT CONTAINS ASSESSMENTS OF COMMODITY AND TRADE ISSUES MADE BY
USDA STAFF AND NOT NECESSARILY STATEMENTS OF OFFICIAL U.S. GOVERNMENT
POLICY
Date:
GAIN Report Number:
Approved By:
Prepared By:
Report Highlights:
MY 2017/18 wheat imports are forecast at 11.5 million metric tons (MMT). MY 2016/17 wheat imports
are being revised downward to 11.0 MMT, 7.2 percent lower than USDA’s official forecast of 11.8
MMT. The decrease is due to foreign exchange (FOREX) challenges that importers faced before the
Egyptian Pound was floated in November 2016. After the devaluation, imports have slowed down. Post
forecasts MY 2017/18 corn imports at 8.6 MMT. Post is also revising MY2016/17 corn imports to 8.6
MMT from USDA’s estimate of 9.0 MMT for the same reasons. FAS Cairo expects the government
will newly permit rice exports by year’s end, which could result in MY 2017/18 shipments of up to 300
TMT of milled rice and 150 TMT of broken rice exports.
Ahmed Wally
Ron Verdonk
Egypt Streamlines Its Grain Import Procedures And Eases
Import Regulations While Rice Exports Should Begin To
Rebound Over The Coming Year
Grain and Feed Annual
Egypt
3/15/2017
Required Report - public distribution

Executive Summary:
FAS Cairo forecasts Egypt’s wheat production and planted area in MY 2017/18 at 8.1 MMT and 1.26
million hectares (ha) respectively. FAS Cairo’s forecast remains unchanged from USDA‘s official
estimate in MY2016/17. On March 8, 2017 the government of Egypt announced wheat procurement
prices for the crop to be harvested starting in April to average USD 214 per MT. The prices announced
are very close to the price of USD 211 per MT that the General Authority for Supply Commodities
(GASC) paid for its imported wheat in the past two months.
Prime Ministerial Decree No 2992 of 2016, declared the General Organization for Export and Import
Control (GOEIC), which is an agency of the Ministry of Trade and Industry (MTI), as the lead authority
for inspections of imported grain and soybeans. Under the new rules, GOEIC became the sole
government body responsible for wheat inspections. In MY 2017/18, post forecasts wheat imports at
11.5 MMT. MY 2016/17 wheat imports are being revised downward to 11.0 MMT from USDA’s
official forecast of 11.8 MMT.
Post forecasts MY 2017/18 corn imports at 8.6 MMT. Post is also revising downwards MY2016/17
imports to 8.6 MMT from USDA’s estimate of 9.0 MMT, as importers faced FOREX challenges,
tapping into the parallel market at a premium of 35-40 percent over the official exchange rate before the
government floated the currency. After the devaluation, prices have more than doubled in the domestic
market and imports have slowed down.
Post forecasts rice exports in MY 2017/18 to reach 450,000 MT. The GOE’s current export policy does
not allow for any rice exports despite substantial stocks that have accumulated in MY 2016/17. A
clearer picture will emerge after the MY2017/18 harvest this August and September. If the Egyptian
Government permits the market to work its course, it would be able to sell close to 200,000 MT of
broken rice and 500,000 MT of rice in the international marketplace.
Wheat

Production:
FAS Cairo forecasts Egypt’s wheat production and planted area in MY 2017/18 at 8.1 MMT and 1.26
million hectares (ha) respectively. FAS Cairo forecast remains unchanged from USDA‘s official
estimate in MY2016/17.
The Ministry of Agriculture and Land Reclamation (MALR) through its Agricultural Research Center
(ARC) is currently focused on three major vertical expansion efforts that include:
A) Increasing raised bed cultivation of wheat using high yielding varieties, leading to increased water
use efficiency and high crop intensification rates. Raised bed cultivation has about tripled from 113,500
ha in MY2013/14 to 334,000 ha in MY 2016/17 across the four major governorates planting wheat:
Sharqia, Beheira, Kafr El Sheikh and Dakahlia. MALR is determined to increase wheat areas using this
cultivation method with goal of expanding acreage for this production to 840,000 ha over the next three
years.
Raised bed wheat cultivation offers several advantages that include:
1. Increased average yields from 6.5 MT per ha to 8-10 MT per ha when using certified seeds of
high yielding varieties and following the planting guidelines set by ARC.
2. Improved water use efficiency by decreasing up to 20-25 percent of water use.
3. A reduced use of certified seed by 25 percent compared to conventional planting.
4. Maximizing the plant’s fertilizer intake during its different growth phases.
B) Increasing the amount of certified seed distributed to farmers from high-yielding wheat varieties that
include Giza 171; Sids 1,12,13, and 14; Gemiza168, 7, and 11; Shandaweel 1, Misr 1 and 2; Benisuif 1
and 2. Currently the Central Administration of Seed Production (CASP) of MALR is able to supply
farmers with 50 percent of their certified wheat seed needs from 28 varieties. CASP’s objective is to
meet up to 70 percent of farmers’ needs over the next two years.
C) The continuing implementation of the annual national wheat campaign, raising farmer awareness
about the newly released high-yielding varieties along with related agronomic practices. Over more
than 600 hectares were used as farmer demonstration fields across the country during MY2016/17.
The most significant challenge to MALR’s efforts in raising production per unit area is the tremendous
increase in violations on the arable lands of the Nile Delta because of the extended urbanization and
construction on these fertile grounds. It is estimated that since 2011 more than 125,000 hectares of
productive agricultural lands were transformed to cement structures.
When urbanization takes place, externalities such as decreased water availability and drainage tend to
affect yields in adjacent fields.
Procurement price:
On January 5, 2017, the Government of Egypt (GOE) announced that this year’s domestic wheat crop

would be bought from farmers based on prevailing international market prices, derived from a moving
average of prices paid by the Ministry of Supply’s General Authority for Supply Commodities (GASC)
for its imported wheat purchases over the previous two months, which in mid-March totals close to
USD 200 per MT, C&F. However, exchange rate volatility prompted the largest farmers union and
several members of the Parliament’s powerful Agricultural Committee to demand raising the
procurement price above the current price of USD 200 per MT and settle for a price between USD 227-
230 per MT.
These concerns have had some impact as on March 8, after a Cabinet meeting, the newly appointed
ministers of agriculture and supply and internal trade jointly announced the new wheat procurement
prices, which are based on crop quality and production costs. The average local procurement price of
USD 214 per MT is very close to the price of USD 211 per MT that the GASC paid for its imported
wheat bought in its last tender. Table 1 lists the new prices. Expectations are that 90 percent of the
procured wheat will grade in the first two categories:
Table (1): Prices of Local Wheat procurement for MY 2016/17
Wheat purity
Grade Price Per Ardeb
(LE) Price Per Ardeb
(USD)
Price Per
Ton ( LE)
Price Per Ton
(USD)
22.5 555 31.5 3700 $ 210.2
23 565 32.1 3766.6 $ 214
23.5 575 32.6 3833.3 $217.8
Comparing the average price of LE 2800 per ton before floating the Egyptian pound and an average of
LE 3766.6 per ton after floating the Egyptian currency and the new pricing policy announced by the
GOE on March 8, farmers’ incomes would increase by 37.7 percent as illustrated in table 2.
Table (2): Average Production Cost of One Hectare Before and After Egypt’s Floating
of the Pound
Cost before Egypt's Floating of the Pound(LE/ha)
Cost after Egypt's Floating of the Pound(LE/ha)
Change
Land Rent 9523 10714 12.5%
Land
Preparation 715 952 25%
Seeds 833 833 0%
Fertilizers 1904 2380 25%
Irrigation 476 714 33%
Pesticides 476 714 33%
Labor 595 833 29%
Harvest 3571 4285 20%
Total Cost 18093 21425 18.4%
Gross Income 21571 26214 22%
Net Income 3478 4789 37.7 %

The new procurement price should also save the government considerable resources, as it would not be
paying above-market prices for its domestic wheat, which it had been doing in the last three years. For
example, in MY 2015/16, the GOE announced a procurement price of LE 420 per ardeb, or USD315
per MT (USDUSD1 = EGP 8.88), therefore paying USD115 to USD120 per MT above prevailing
international market prices for its domestic wheat.
In addition, the new price should reduce fraudulent practices, by which unscrupulous players gamed the
system in passing off imported wheat as domestic, taking advantage of the arbitrage opportunity offered
by the price discrepancies. The new pricing regime is seen by many wheat traders as a very positive
step in the right direction to diminish arbitrage and fraud, saving a lot of resources that can be better
utilized supporting farmers with affordable inputs, know-how, and advanced technologies.
Post estimates that local wheat procurement for MY 2016/17 and MY 2017/18, respectively, will be in
the range of 4.0 – 4.5 MMT. As in years past, local wheat procurement will run from April 15 to July
15. The Ministry of Supply and Internal Trade (MOSIT) and its affiliated Holding Company for Silos
and Storage (HCSS) will be responsible for procuring the local production from farmers. In addition,
no private silos will procure from the local harvest.
Wheat storage will only be in public storage facilities and silos under the authority of HCSS. A
committee will investigate all the storage facilities that will receive the local harvest to make sure that
they are empty of imported wheat.
These measures are being implemented as part of recommendations made by Egypt’s Wheat
Commission, which was formed by Parliament to look into widespread allegations of fraudulent
practices in the procurement process.
Consumption:
Post forecast total wheat consumption at 20 MMT in MY 2017/18, up 1.5 percent from MY 2016/17
consumption of 19.7 MMT, which remains unchanged from USDA’s official MY 2016/17 estimate.
The increase is due to an increase in food, seed and industrial use (FSI) consumption by approximately
2.2 percent. The anticipated rise in FSI consumption of wheat is driven mostly by population growth,
which is growing at a rate of 2.5 percent annually and the presence of refugees from Iraq, Syria, Libya,
Yemen and Sudan, whom are estimated at 5 million.
Subsidy System Remains Unchanged but Costs Explode as Government Floats the Pound
The government’s bread subsidy system remains unchanged. Each beneficiary is allowed 150 loaves
per month or 5 loaves per day. “Baladi” bread is sold at a subsidized price of LE 0.05 per loaf (USD
0.01 per loaf), while the cost of producing one loaf is currently at LE 0.60 per loaf up from LE 0.35
before the GOE floated the Egyptian pound and partially lifted fuel subsidies. The government pays the
bakers the difference between the subsidized price (LE 0.05) and the market price (LE 0.60) It is
estimated that the program pays for close to 250- 280 million loaves per day, therefore a daily increase
in the government’s subsidized cost of LE 62.5-70 million.

The current system allows beneficiaries who consume less than the quota amount to convert their bread
savings into points(1 point = USD0.01) and spend it on more than 40 food products that can be
purchased from 27,000 privately-owned grocery stores partnering with MOSIT or the 5,000 publicly-
owned consumer complexes. Beneficiaries must use the redeemed points during the first twenty days of
the following month. During the past two years, beneficiaries purchased primarily sugar, rice, and
vegetable oil using their points. The program costs the GOE LE 6 billion annually (USD 34.0 million at
LE 17.6 per USD)
Widespread Inefficiencies in the Program
Although the program has been touted for its success in curtailing flour leakages, improving consumer
access, and product quality, unscrupulous actors have increasingly become adept at gaming the
program. After the government floated the pound, the price per ton of flour increased from LE 2,800
per ton (USD 315.3 at LE 8.88 per USD) to LE 4, 800 (USD 272.7 at LE 17.6 per USD). However,
public mills continued to supply bakeries with 82 percent extraction flour from wheat purchased at the
previous exchange rate at the old price of LE 2,800 per ton.
The reality is that under these circumstances, some of the flour intended for baladi bread output was
being sold at a higher price to other bakeries. This created a situation reminiscent of the past, as folks
lined up in front of some bakeries for extended periods to purchase subsidized bread. The arbitrage
opportunities prompted many actors to sell the subsidized flour in the black market, especially in rural
areas where oversight is minimal.
Recent reports indicate fraudulent practices in the smart card system, in which some unscrupulous
bakery owners obtain smart cards from beneficiaries and use them to record the maximum daily amount
of bread allowed by MOSIT, getting reimbursed for fictitious sales. The reports also found fraudulent
practices with the golden card, a card the government issues bakeries to deal with contingencies such as
distributing bread for people living in districts other than their birth places, those who’ve lost their
smart cards or who haven’t received their cards yet.
Through the use of a golden card bakeries have been granted permission to produce between 2000 to
4000 loaves daily since 2014, but there has been misuse as certain bakers record higher amounts of
bread via the golden card reporting system than were actually baked thereby receiving higher
reimbursement relative to what they should. Finally, the program currently covers close to 70 million
end-users, and it’s estimated that 20-30 million of these beneficiaries should not be eligible. This
inflated number adds significant burden to the program and contributes to greater uncertainty in terms
of program cost.
In FY 2016/17, the initial budget allocated for food subsidies was LE 41.0 (USD4.7 billion at LE 8.88
per USD) with an increase of 10.8 percent over the FY 2015/16 budget. Post expects that the actual
spending on food subsidies may exceed the allocated budget in FY 2016/17 by LE 10 billion reaching
LE 51 billion.
Table (3): Proposed Spending vs Actual Spending in GOE Food Subsidy Program
Fiscal
Year Proposed Budget for
Food Subsidy Actual Spending on
Food Subsidy Proposed Budget for
Bread Subsidy Actual Spending on
Bread Subsidy

( LE Billion ) ( LE Billion ( LE Billion ) ( LE Billion) 2012/2013 26.4 32.5 16.1 21.2 2013/2014 30.8 35.4 21.3 24.6 2014/2015 31.5 39.3 18.5 28.5 2015/2016 37.0 42.7 22.5 24.8 2016/2017 41.0 51.0 (expected) 23.7 29. 0
(Expected)
To address these inefficiencies in order to reduce the program’s high expenditures, the government is
developing a new set of indicators targeting appropriate end-users and which is intended to reduce
fraudulent practices. Five ministries are participating in this program, which is seen as a step towards
reforming the subsidy program, moving from an in-kind subsidy in the direction of a conditional cash
transfer program. A move to a strict cash-transfer program which is certainly challenging would
improve access to food products for those end-users that actually deserve the subsidy, while
significantly reducing costs.
Milling Capacity
Egypt has more than 410 public, public/private, and private sector mills with total investments of more
than USD one billion. According to some private investors, Egypt has an excess milling capacity of
more than 30 percent, creating many inefficiencies in this economic subsector.
Public and public/private milling capacity ranges between 50-55 TMT per day while the capacity of
private sector mills is estimated at 20 TMT per day. Ironically, last year, many private mills operated at
40 percent capacity due to shortages of imported wheat, caused by limited foreign currency and delayed
letters of credit.
Public mills and public/private mills produce flour at extraction rate 82 percent used for making the
subsidized baladi bread, producing 70 percent of all the flour going to the bread subsidy program, while
private mills produce the remaining 30 percent. Private sector mills producing 82% flour for the
government’s bread subsidy program are not allowed to produce the 72 percent extraction flour
produced by other the private sector mills in an attempt to avoid leakages.
Decreased Consumption of High-end Baked Goods as Customers’ Preferences Shift to Cheaper Baladi
Bread
The 72 percent extraction flour is sold to around 20,000 private sector bakeries that produce higher
quality bread and pastries. Cakes, pastries and baked goods consumed in Egypt witnessed a reduction
in their consumption rate in the second half of MY2016/17 due to a 100 percent increase in prices
compared to the first half of the marketing year, as 72 percent flour increased from LE 3500 per ton to
LE 7000 per ton. Private bakeries and in-store bakeries at large retailers and hypermarkets have also
increased their prices driving consumers to substitute their consumption to cheaper, unsubsidized baladi
bread.
Trade:
In MY 2017/18, FAS Cairo forecasts wheat imports of 11.5 MMT. MY 2016/17 wheat imports are

being revised downward to 11.0 MMT, 7.2 percent lower than USDA’s official forecast of 11.8 MMT,
due to a persistent shortage of foreign currency that affected the issuance of letters of credit during the
first five months of the current marketing year from July 2016- November 2016. In addition, the
inconsistent policies regarding ergot fungus caused GASC to cancel more than three tenders during the
period July 2016 to September 2016, due to lack of offers and causing the disruption of private sector
wheat shipments.
From July 2016 to March 10, 2017, private sector imports of wheat amounted to 3.31 MMT, while
GASC imports amounted to 3.88 MMT with three more GASC shipments expected to arrive during the
second half of March and April 2017.
New Trade Rules-Market Friendly Due to the confusion from the controversial ergot policy as well as from confusion about ragweed in
imported soybeans that extended through much of 2016, the Government of Egypt (GOE) restructured
its import procedures by issuing Prime Ministerial Decree No 2992 of 2016, declaring the General
Organization for Export and Import Control (GOEIC) as the lead authority for imported grain and
soybean inspections. The Ministry of Trade and Industry’s Decree No 24 of 2017 establishes the
operational guidelines for the implementation of the aforementioned prime ministerial decree.
Under the new rules, GOEIC became the sole government body responsible for wheat inspections at
shipping origins and arrivals. For inspections at origin, GOEIC replaced the government’s team of six
inspectors. Instead, it has established a list of qualified international inspection companies with whom
grain traders can voluntarily contract for pre-shipment inspection. Upon arrival, shipments are inspected
by GOEIC’s inspection teams.
Import Procedures
Importers have to submit an import permit application to GOEIC indicating the shipment's country of
origin and the amount being imported. Approvals are to be issued within two working days of
submission. The new regulations allow maximum residue levels for ergot of 0.05 percent, which
complies with the Egyptian Standard No. 1601-1 of 2010 and which is in line with Codex Alimentarius.
Traders are optimistic with Egypt’s new inspection system and hinted to FAS Cairo that dealing with an
experienced organization such as GOEIC will be more straightforward. The new process streamlines
import regulation because instead of having to deal with up to three governmental bodies, at times at
odds with each other, importers now need to engage with one, and this should result in lower costs,
which will end up benefiting consumers.
GASC’s Imports
Actual delivered GASC purchases from abroad, July 2016 to February 2017, amounted to 3.47 MMT,
against 3.85 MMT and 4.16 MMT during the same period in 2015 and 2014, respectively. GASC
conducted 25 tenders and the quantities that were contracted are listed in Table 4.
Table (4) GASC Imports as of July 2016 – Feb 2017:

Tender No
Tender date Shipment period Origin Tonnage /MT Total/MT
1 12 July 2016 Aug 10-20 Russia Ukraine
120,000 60,000
180,000
2 15 July 2016 Aug 21-30 Russia Romania
120,000 180,000
300,000
3 27 July 2016 Sept 1 -10 Romania Russia
60,000 60,000
120,000
4 01 Aug 2016 Sept 11-20 Russia 60,000 60,000 5 22 Aug 2016 Sept 21-30 cancelled cancelled cancelled 6 26 Aug 2016 Sept 26-Oct 5 Russia 180,000 180,000 7 30 Aug 2016 Oct 6-15 cancelled cancelled cancelled 8 15 Sep 2016 Oct 15-25 cancelled cancelled cancelled 9 19 Sep 2016 Oct 16-26 cancelled cancelled cancelled
10 22 Sep 2016 Oct 21- 31 Russia 240,000 240,000 11 03 Oct 2016 Nov 1-10 Russia 240,000 240,000 12 12 Oct 2016 Nov 11-20 Russia
Romania 60,000
120,000 180,000
13 19 Oct 2016 Nov 21-30 Russia 120,000 120,000 14 24 Oct 2016 Dec 1-10 Romania
Russia 240,000 180,000
420,000
15 07 Nov 2016 Dec 11-20 Romania Russia
60,000 180,000
240,000
16 10 Nov 2016 Dec 15-25 Russia 60,000 60,000 17 29Nov 2016 Jan 2-11 Russia 240,000 240,000 18 19 Dec 2016 Jan 20-31 Argentina
Russia Romania
120,000 180,000 60,000
360,000
19 28 Dec 2016 Feb 1-10 Ukraine Russia
60,000 175,000
235,000
20 13 Jan 2017 Feb 15-25 Russia Romania
175,000 60,000
235,000
21 19 Jan 2017 Feb 22- 3 March Ukraine 60,000 60,000 22 25 Jan 2017 March1-10 Russia 410,000 410,000 23 16 Feb 2017 March 16-25 Russia
Romania Ukraine
240,000 60,000 60,000
360,000
24
21 Feb 2017 March 24-5 April Russia Ukraine
300,000 60,000
360,000
25 27 Feb 2017 April 1-10 Russia
France Romania Ukraine
235,000 120,000 120,000 60,000
535,000
From July 2016 to Feb 2017, GASC purchased (but not all of which has been shipped) 3.57 MMT from
Russia, followed by Romania with 960,000 MT, Ukraine with 360,000 MT, then France and Argentina
with 120,000 MT each.
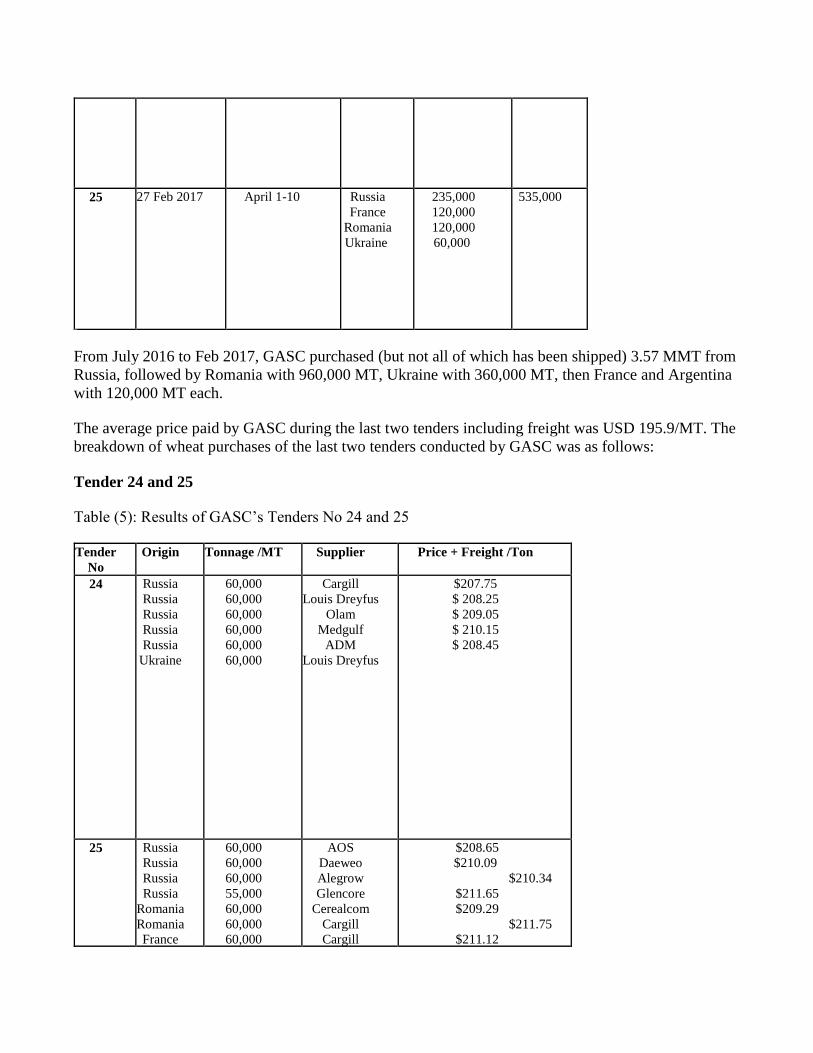
The average price paid by GASC during the last two tenders including freight was USD 195.9/MT. The
breakdown of wheat purchases of the last two tenders conducted by GASC was as follows:
Tender 24 and 25
Table (5): Results of GASC’s Tenders No 24 and 25
Tender No
Origin Tonnage /MT Supplier Price + Freight /Ton
24
Russia Russia Russia Russia Russia
Ukraine
60,000 60,000 60,000 60,000 60,000 60,000
Cargill Louis Dreyfus
Olam Medgulf
ADM Louis Dreyfus
$207.75 $ 208.25 $ 209.05 $ 210.15 $ 208.45
25
Russia Russia Russia Russia
Romania Romania France
60,000 60,000 60,000 55,000 60,000 60,000 60,000
AOS Daeweo Alegrow Glencore
Cerealcom Cargill Cargill
$208.65 $210.09
$210.34 $211.65 $209.29
$211.75 $211.12
France Ukraine
60,000 60,000
Lecureur Daeweo
$213.12 $212.50
The recent list of permitted countries of origin from which Egypt will permit imports of wheat include
the 19 countries listed in table 6.
Table (6): Origins Allowed to Export Wheat to Egypt
Europe Asia North America South America Australia France
Germany Poland
Bulgaria Lithuania
Serbia Moldova Romania Ukraine Hungary
Russia
Kazakhstan USA Canada
Argentina Brazil
Uruguay Paraguay
Australia
Stocks:
Post forecasts that MY2017/18 ending stocks at 2.55 MMT, a decrease of approximately 35 percent
from Post’s MY2016/17 estimate of 3.45 MMT, which was revised downward from USDA’s official
estimate of 4.25 MMT. The decrease in ending stocks of MY 2016/17 is attributed to lower imports by
the private sector.
GASC usually maintains a 3-4 supply of stocks, which include wheat imports in the pipeline. As such,
three months’ supply is in country, while an additional one month of supply is on its way to Egypt.
HCSS increased its storage capacity from 1.5 MMT to 3 MMT after finalizing the construction of 25
modern silos with capacity 1.5 MMT. The project was funded by UAE and this storage will be used for
some of the local harvest this season.
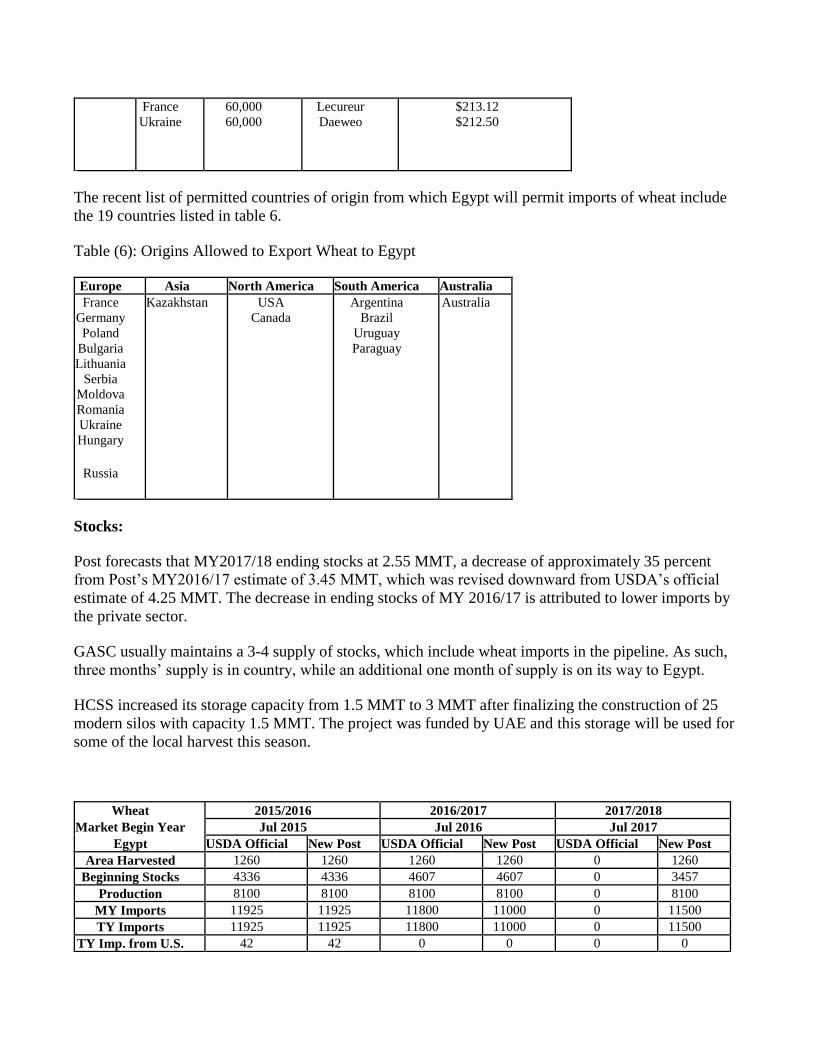
Wheat 2015/2016 2016/2017 2017/2018 Market Begin Year Jul 2015 Jul 2016 Jul 2017
Egypt USDA Official New Post USDA Official New Post USDA Official New Post Area Harvested 1260 1260 1260 1260 0 1260
Beginning Stocks 4336 4336 4607 4607 0 3457 Production 8100 8100 8100 8100 0 8100
MY Imports 11925 11925 11800 11000 0 11500 TY Imports 11925 11925 11800 11000 0 11500
TY Imp. from U.S. 42 42 0 0 0 0
Total Supply 24361 24361 24507 23707 0 23057 MY Exports 554 554 550 550 0 500 TY Exports 554 554 550 550 0 500
Feed and Residual 1400 1400 1400 1400 0 1300 FSI Consumption 17800 17800 18300 18 0 18700
Total Consumption 19200 19200 19700 19700 0 20000 Ending Stocks 4607 4607 4257 3457 0 2557
Total Distribution 24361 24361 24507 23707 0 23057
Corn
Production:
Post forecasts MY 2017/18 corn production and planted area to remain unchanged from MY 2016/17 at
6 MMT and 750,000 ha, respectively. White corn area is projected to decline to 400,000 ha, while
yellow corn planted area is forecast to increase from 250,000 ha to 350,000 ha.
The GOE announced the goal of expanding yellow corn production acreage to 400,000 ha with the 2018
crop. This hoped-for expansion is, nevertheless, a key priority of the current government in an effort to
decrease imports of feed ingredients and reduce the drain on scarce foreign-exchange reserves.
The MALR will implement a national campaign to increase yields per unit area and increase farmers’
awareness of the importance of replacing illegal rice fields outside the government’s allotted area with
yellow corn. MALR strategy is based on 4 major pillars:
1. Organizing more than 100 workshops to educate farmers about switching to yellow corn from
white corn and illegal rice cultivation in the coming years.
2. Introducing one way and three-way cross hybrids of yellow corn to farmers such as the three-
way cross hybrid 168, which has attained a production of 10.4 MT per ha in extension
programs.
3. Establishing four logistic centers in the Delta and Upper Egypt through the Principal Bank for
Development and Agricultural Credit (PBDAC) that will contract farmers’ production and sell it
to feed, poultry and dairy companies.
4. Increasing the number of demonstration fields from 472 fields in MY 2015/16 to 572 extension
fields across the different governorates, showcasing new maize hybrids produced by ARC, as
well as demonstrating good agricultural practices to obtain higher yields and decrease post-
harvest losses.
Consumption:
FAS Cairo forecasts MY 2017/18 consumption at 14.5 MMT similar to MY 2015/16 estimate of
14.5MMT, which is lowered from USDA’s official estimate by 4.1 percent due to a 100 percent
increase in poultry feed prices from LE 4,000 (USD450.4 at USD= 8.88) to LE 8,000 (USD454.5 at
USD= 17.6), and a similar leap in soybean meal pricing from LE 4,000 (USD450.4 at USD= 8.88) to
LE 8,000(USD454.5 at USD= 17.6).
The prices of vaccines and poultry medicines have more than doubled as a result of the floating of the
Egyptian currency, increasing in many cases more than 120 percent. As a result, the market has
witnessed several shortages of common vaccines used by the poultry industry, leading to greater-than-
expected losses due to outbreaks of viral diseases such as Newcastle disease (ND), avian influenza
(H5N1 and H5 N8 strains) and, most severely, infectious bronchitis (IB).
Because of these challenges, at least 60 percent of small-scale farms stopped production during the
winter season. Some commercial poultry farms, which represent up to 80 percent of total poultry
production, witnessed losses of 20-30 percent due to viral infections from the lack of vaccines in the
marketplace.
Despite these challenges, the poultry industry remains one of the leading food industries in Egypt with
investments of more than LE 45 billion, employing two million people, and consuming 12 million tons
of feed of which corn constitutes 70 percent of the ration. Currently there are 180 poultry feed mills
producing various types of feed formulations for the industry.
Not surprisingly, fish feed prices have also skyrocketed, increasing by more than 100 percent. Price of
extruded feed for tilapia increased from LE 4,000 (USD450.4 at USD= 8.88) to LE 8,500 (USD483 at
USD= 17.6) while extruded feed developed for sea bass and other marine fish increased from LE
12,000 to reach LE 23,000/MT. The high prices of feed contributed to a 40 percent increase in prices of
fish in the local market.
Currently, 75 privately-owned feed mills provide 90 percent of aquaculture feed, producing both
conventionally pelleted feeds (80-85 percent) and extruded feeds (15-20 percent). Most aquaculture
feed – 85 percent – is formulated to contain 25 percent crude protein. Aquaculture feed’s major dietary
energy sources include corn (15-20 percent), wheat bran (20–25 percent) and rice bran (10–20 percent).
The cost of feed mixes consumed by dairy cattle has also increased to LE 92 per day from LE 45 per
day. As a result, raw milk prices have increased more than 50 percent.
The surge in grain and feed prices has definitely contributed to record inflation levels. The annual rate
of inflation climbed to 29.6 percent in January 2017 and rose to 31.7 percent in February 2017
compared to 24.3 percent during December of 2016. According to the monthly report issued by the
Central Agency for Public Mobilization and Statistics (CAPMAS), in January 2017, monthly
inflation was driven by an increase in prices of meat and poultry of 6.4 percent, grain and bread by 9
percent, and milk, cheese, and eggs by 11.5 percent.
Trade:
Post forecasts MY 2017/18 imports at 8.6 MMT. Post is also revising downwards MY2016/17 imports
to 8.6 MMT from USDA’s estimate of 9.0 MMT, as importers faced FOREX challenges, tapping into
the parallel market at a premium of 35-40 percent over the official exchange rate before November
2016’s devaluation.
After the devaluation prices have more than doubled in the domestic markets and imports have slowed
due to a reduction in the consumption rates by the poultry, aquaculture and dairy industries. Egypt’s
current production of yellow corn covers less than 15 percent of its feed demand; therefore, demand by
the feed manufacturing industry must be met by imports.
Year- to- date imports as of February 28, 2017 were 824,820 MT with Ukraine as the leading origin at
608,358MT, followed by the United States at 89,673 and Bulgaria with 20,524 MT.
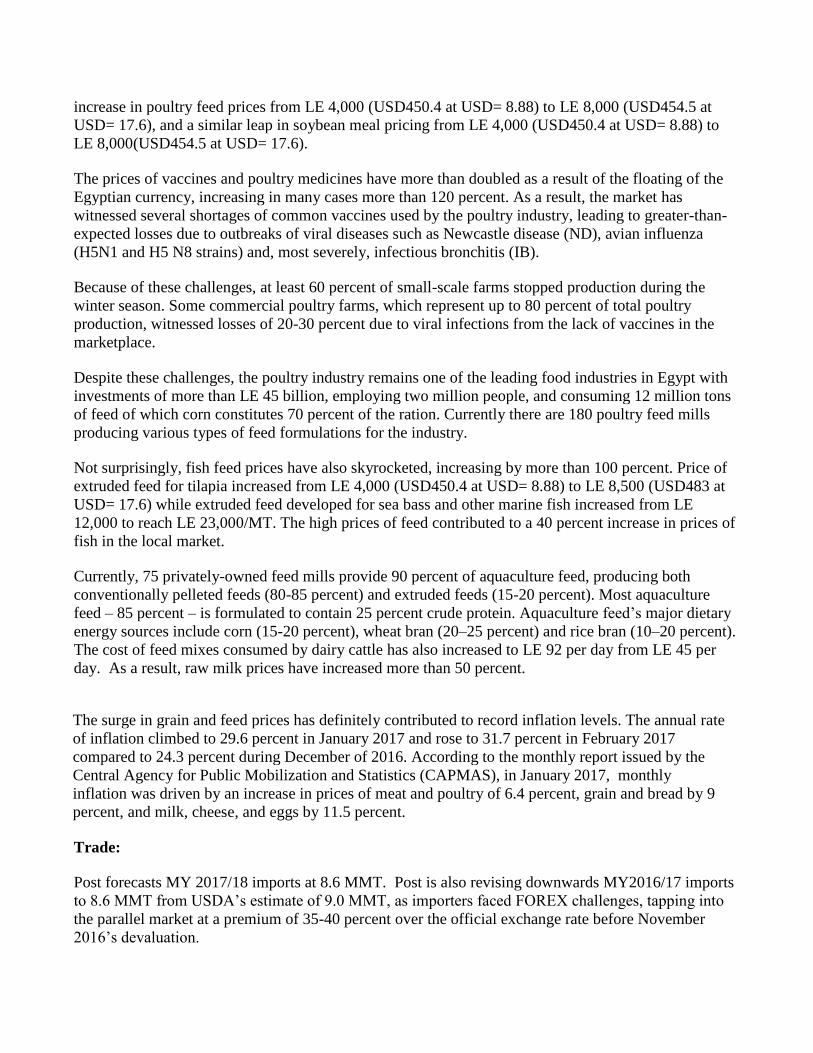
In CY 2016, the total quantity of corn imported was 8.76 MMT with a monthly average of around
730,000 MT against 8.2 MMT in CY 2015. In CY 2016, the four key suppliers of corn were Argentina
with 3.1 MMT, Ukraine with 2.5 MMT, Brazil with 1.46 MMT, USA with 1.02 MMT and Romania
with 385, 000 MT.
Fig (1); Key suppliers of corn to the Egyptian market in CY 2016
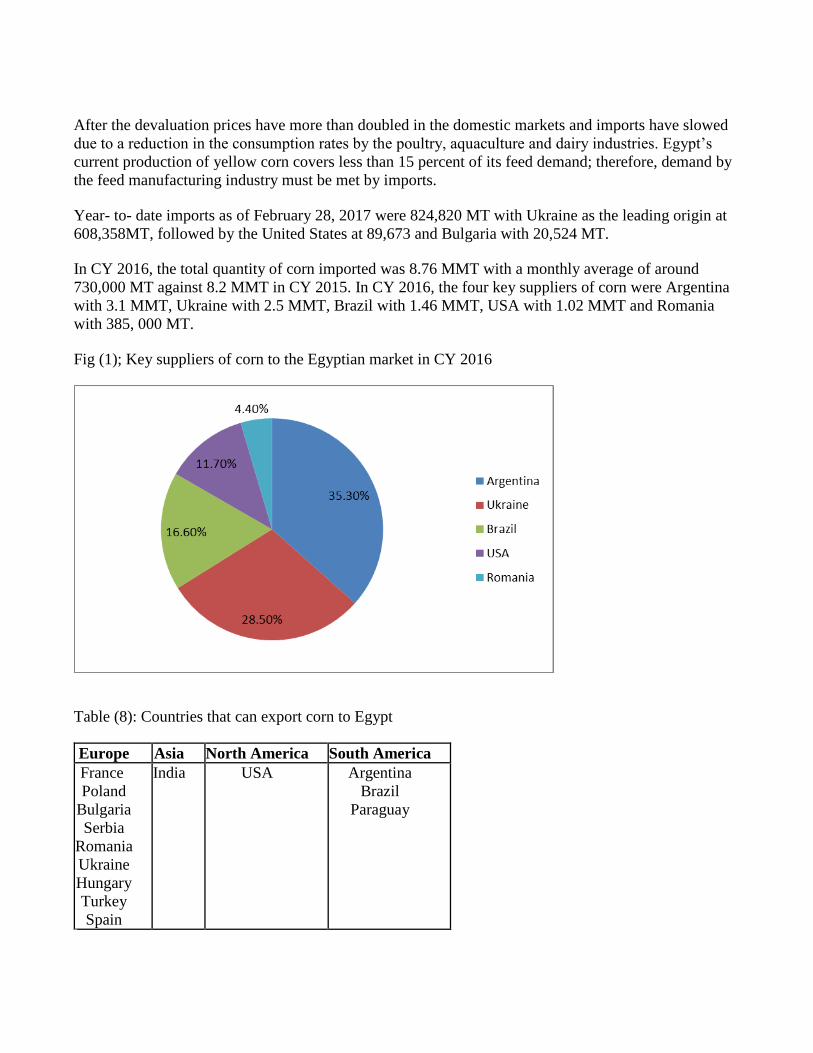
Table (8): Countries that can export corn to Egypt
Europe Asia North America South America
France
Poland
Bulgaria
Serbia
Romania
Ukraine
Hungary
Turkey
Spain
India USA
Argentina
Brazil
Paraguay

Imports of Dried Distillers Grains with Solubles and Corn Gluten
Egypt’s imports of distillers dried grains with soluble (DDGS) in CY 2016 reached 133,000 MT. All
these quantities were of U.S origin. In CY 2015 DDGS imports were 130,000 MT with U.S origin
constituting 96 percent of this amount. Egypt’s imports of corn gluten meal in CY 2016 reached
148,000 MT down from 157,000 MT in CY 2015.
Both corn gluten meal and DDGS are used in rations for poultry, dairy and beef cattle and aquaculture.
Prices of DDGS in the local market range between LE 4000-LE 4500 (USD242.4 – USD272.2 at USD
=LE 16.5) per ton, while prices of corn gluten meal range between LE 11,600 and LE 12,000
(USD696.9 – USD727.2 at USD =LE 16.5 ). Prices of corn gluten meal and DDGS have increased by
100 percent because of the float of the Egyptian currency.
Stocks:
Post forecasts corn stocks at 2.2 MMT in MY 2017/18. The MY 2016/17 stock quantity is raised
upward from USDA’s estimate by 5.9 percent driven by slower consumption growth.
Corn 2015/2016 2016/2017 2017/2018 Market Begin Year Oct 2015 Oct 2016 Oct 2017
Egypt USDA Official New Post USDA Official New Post USDA Official New Post Area Harvested 750 750 750 750 0 750
Beginning Stocks 2295 2295 2211 2135 0 2225 Production 6000 6000 6000 6000 0 6000
MY Imports 8776 8350 9000 8600 0 8600 TY Imports 8776 8350 9000 8600 0 8600
TY Imp. from U.S. 847 0 0 860 0 870 Total Supply 17071 16645 17211 16735 0 16825 MY Exports 10 10 10 10 0 10 TY Exports 10 10 10 10 0 10
Feed and Residual 12450 12100 12700 12100 0 12100 FSI Consumption 2400 2400 2400 2400 0 2400
Total Consumption 14850 14500 15100 14500 0 14500 Ending Stocks 2211 2135 2101 2225 0 2215
Total Distribution 17071 16645 17211 16735 0 16825
Rice:

Production:
Post forecasts that Egyptian milled rice production in MY2017/18 will decrease to 4.0 MMT from an
estimated 5.1 MMT in MY2016/17 which was revised upward from USDA’s official estimate of 4.5
MMT. The projected reduction is attributed to a decrease in the planted area to 700,000 ha in
MY2017/18 down from 920,000 ha in MY 2016/17, which was revised upward from USDA official
estimate of 750,000 ha.
For this year’s crop, farmers are expected to shift to cotton and yellow corn production due to attractive
prices for these crops. Moreover, the Ministry of Water Resources (MWRI) is expected to step up
enforcement of the limit on rice area by issuing hefty fines to those farmers found planting outside the
government’s specified rice acreage. Farmers planting rice in MY2017/18 outside the government’s
allotment area of 451,920 ha will face fines of LE 8,928 per ha (USD507.2 per ha at USD= LE 17.6)
compared to LE 5,328 per ha (USD600 per ha at USD=LE 8.88) in MY 2016/17.
The forecast rice area is still larger than the government’s allotment area of 451,920 ha in the seven
governorates of the northern Delta since farmers are willing take the risk as rice is still a relatively
preferred cash crop with high yields and recent favorable pricing.
Rice plantings are very important to the coastal provinces to limit the sea-water intrusion into northern
Delta soils, which is abated by rice cultivation as the copious amounts of drainage water used on rice
mitigates soil salinization.
Current rice varieties planted and produced by ARC and ARC Sakha research station include:
Sakha 101, Sakha 102, Sakha 104, Sakha 107 and Sakha 108
Giza 177, Giza 178, Giza 179 and Giza 181
Masry 1, Masry 2 and Masry 3.
In research or extension fields, the average production of these rice varieties is between 9-11 MT per ha
and totals 8-9 MT per ha in farmers’ fields. . These varieties are early maturing varieties that develop in
three months and consume on average 9,000 to 11,000 cubic meters water per hectare.
Consumption:
FAS Cairo forecasts rice consumption at 4.25 MMT in MY 2017/18, a jump in consumption reflecting
population growth, increase use in an expected resurgent tourism sector and owing to improved
economic conditions expected later in 2017 and in 2018. Rice is heavily consumed in the provinces of
the northern Delta and Suez Canal region as well as big cities like Cairo and Alexandria. Consumers in
urban centers tend to purchase packaged rice while consumers in rural areas rely more on unpackaged
rice.
After the government announced that it would purchase rice from farmers at LE 3000 per MT of paddy
rice in August of 2016, traders offered farmers prices that exceeded LE 4000 per MT. Traders held on
to the stocks acquired, trying to force the government to revise its export policy, causing rice shortages
that affected the government’s subsidy program, which takes 1.2-1.4 MMT of milled rice annually.

To address some of the shortfall, MOSIT imported 35,000 MT of Indian rice at a price of USD360 per
ton and another 70,000 MT at a price USD 410 per ton in October 2016. Prices of the Indian rice were
first offered at LE7.5 per KG in MOSIT outlets, and further reduced to 6.5LE per KG.
Current prices of domestic packaged rice ranges between LE 6-8 per KG in public consumer
complexes and MOSIT outlets selling to subsidy card holders, while prices in the retail market range
between LE 7-11 per KG . Meanwhile, unpackaged rice prices range between LE 6-9 per KG.
After a standoff of almost a year that pitted private millers and traders against MOSIT, the newly
appointed Minister of Supply and Internal Trade reached a deal, in which millers and traders will supply
MOSIT with a minimum of 200 MT of milled rice per month at a price of LE 6,300 per MT on the
condition that prices are placed on the rice packages and the percentage of brokens does not exceed 10
percent. As mentioned above, MOSIT outlets now sell the rice to subsidy card holders at LE 6.5/Kg.
The deal between traders and the MOSIT will ensure an affordable and reliable supply for the
government’s subsidy program, which should support an official resumption of rice exports.
Trade:
Post forecasts that rice exports in MY 2017/18 will expand dramatically to reach 450,000 MT while the
GOE’s current prohibition on exports represents a substantial missed opportunity for moving stocks and
generating FOREX. Ongoing efforts by the Agriculture Export Council (AEC) and the Chamber of
Cereal Industries (CCI) urging the Ministry of Trade and Industry (MTI) to force reconsideration of the
government’s ban on rice exports should contribute to resolution. FAS/Cairo believes that MTI will
allow trade to resume for a brief period after MOSIT feels that it will obtain a secure and continuous
supply of rice needed for its food subsidy program later this year.
A clearer picture will emerge after the MY2017/18 harvest in August and September. If Egypt allowed
the market to work its course, it could be able to sell close to 200,000 MT of broken rice and 500,000
MMT of rice in the international marketplace.
MY 2016/17 exports were slashed by 250,000 MT because of the ban on rice and broken rice exports
since August 10, 2016. Certain sources estimate that around 50,000 MT of milled rice were smuggled
into Libya and Sudan in the current marketing year.
Stocks:
Post forecasts that ending rice stocks in MY 2017/18 will be 1.4 MMT, less than FAS Cairo’s estimate
of 2.0 MMT in MY 2016/17, which was revised upward from USDA’s official estimate by 541,000
MT. MOSIT’s unclear policy on its rice procurement intentions as well as the government’s ban on
milled rice and broken rice exports were the main contributors to the record amount of stocks in MY
2016/17. With the appointment of new leadership in MOSIT, post expects a clearer rice policy,
ensuring that the government buys domestic stocks for its food subsidy program, while opening the
door for exports, generating much need foreign exchange the economy so desperately needs.

Rice, Milled 2015/2016 2016/2017 2017/2018 Market Begin Year Oct 2015 Oct 2016 Oct 2017
Egypt USDA
Official New
Post USDA
Official New
Post USDA
Official New
Post Area Harvested 650 650 750 920 0 700
Beginning Stocks 924 924 924 854 0 2019 Milled Production 4000 4000 4554 5100 0 4000 Rough Production 5797 5797 6600 7391 0 5797
Milling Rate (.9999) 6900 6900 6900 6900 0 6900 MY Imports 100 80 300 115 0 100 TY Imports 100 80 300 115 0 100
TY Imp. from U.S. 0 0 0 0 0 0 Total Supply 5024 5004 5778 6069 0 6119 MY Exports 200 200 300 50 0 450 TY Exports 200 200 300 50 0 450
Consumption and
Residual 3900 3950 4000 4000 0 4250
Ending Stocks 924 854 1478 2019 0 1419 Total Distribution 5024 5004 5778 6069 0 6119

Commodities:
Select