EFORE THE HOUSE OMMITTEE ON NATURAL...
12
1155 15 th Street NW · Suite 900 · Washington, DC 20005 · Phone 202.621.2950 www.instituteforenergyresearch.org BEFORE THE HOUSE COMMITTEE ON NATURAL RESOURCES SUBCOMMITTEE ON OVERSIGHT AND INVESTIGATIONS THE STATUS OF IVANPAH AND OTHER FEDERAL LOAN-GUARANTEED SOLAR ENERGY PROJECTS ON BUREAU OF LAND MANAGEMENT LANDS JULY 14, 2016 TESTIMONY OF DANIEL R SIMMONS THE INSTITUTE FOR ENERGY RESEARCH Introduction The Obama administration has aggressively pushed the leasing of Bureau of Land Management land for solar leases. It is admirable that, at least for solar energy, the administration understands that federal lands are multi-use under federal law and that energy production is an important use of federal lands. It would be much better if the administration moved to cut red tape for all energy sources instead of discriminating against other sources of energy production. The massive amount of loan guarantees and grants the federal government has given these solar facilities on federal lands shows why the federal government should make energy sources compete on equal footing instead of favoring one source above others. There is no reason the federal government should give hundreds of millions of dollars in subsidies from the American taxpayer to the billionaire owners of a facility like Ivanpah. If Google (and their billionaire founders) want to take risks on new energy systems, they should use their own money instead of risking taxpayer dollars. When the Obama administration worked to expedite solar leasing they made a number of claims that require examination. The administration claimed that they support an “all-of-the-above
Transcript of EFORE THE HOUSE OMMITTEE ON NATURAL...
1155 15th Street NW · Suite 900 · Washington, DC 20005 · Phone 202.621.2950
www.instituteforenergyresearch.org
BEFORE THE
HOUSE COMMITTEE ON NATURAL RESOURCES
SUBCOMMITTEE ON
OVERSIGHT AND INVESTIGATIONS
THE STATUS OF IVANPAH AND OTHER FEDERAL LOAN-GUARANTEED SOLAR
ENERGY PROJECTS ON BUREAU OF LAND MANAGEMENT LANDS
JULY 14, 2016
TESTIMONY OF DANIEL R SIMMONS
THE INSTITUTE FOR ENERGY RESEARCH
Introduction
The Obama administration has aggressively pushed the leasing of Bureau of Land Management
land for solar leases. It is admirable that, at least for solar energy, the administration understands
that federal lands are multi-use under federal law and that energy production is an important use
of federal lands. It would be much better if the administration moved to cut red tape for all
energy sources instead of discriminating against other sources of energy production.
The massive amount of loan guarantees and grants the federal government has given these solar
facilities on federal lands shows why the federal government should make energy sources
compete on equal footing instead of favoring one source above others. There is no reason the
federal government should give hundreds of millions of dollars in subsidies from the American
taxpayer to the billionaire owners of a facility like Ivanpah. If Google (and their billionaire
founders) want to take risks on new energy systems, they should use their own money instead of
risking taxpayer dollars.
When the Obama administration worked to expedite solar leasing they made a number of claims
that require examination. The administration claimed that they support an “all-of-the-above

2
energy strategy,” and that solar power “increase[es] energy security.”1 The reality is that
increasing solar (and wind) production on federal land may actually increase energy imports, not
decrease them.
Also, solar energy is an expensive source of electricity generation as revealed by not only data
from the Energy Information Administration, but also by a forthcoming report from the Institute
for Energy Research (IER). The IER report shows electricity from new solar is nearly 5 times
more expensive than from existing nuclear and over 3.5 times more expensive than existing coal.
Lastly, the problem is that it is difficult to keep the lights on with solar power. Solar only
produces electricity when the sun is shining, but peak periods of electricity demand frequently
occur as the sun is setting or after it has set. This reduces the usefulness of solar for grid-
connected electricity generation.
Kudos to BLM for expediting energy leasing on federal land
The Department of Interior and Bureau of Land Management should be applauded for working
to expedite energy leasing on federal lands. The administration developed a roadmap for solar
energy development2 and tried to reduce the massive amount of red tape imposed on energy
leasing on federal lands. This is laudable because under federal land laws, such as the Federal
Land Policy and Management Act, BLM lands are supposed to be multi-use lands and energy is
an important use of these lands.
That said, the problem with the administration’s actions with regard to solar leasing is that
contrary to claims that the administration has an “all-of-the-above” policy,3 the administration
has been antagonistic towards natural gas, oil, and coal production on federal lands.4
This antagonism shows up in the oil and natural gas production data. According to a new report
from the Congressional Research Service, from 2010 through 2015, oil production on private and
1 Department of Interior, Obama Administration Releases Roadmap for Solar Energy Development on Public Lands,
July 24, 2016, https://www.doi.gov/news/pressreleases/Obama-Administration-Releases-Roadmap-for-Solar-Energy-Development-on-Public-Lands 2 Department of Interior, Obama Administration Releases Roadmap for Solar Energy Development on Public Lands,
July 24, 2016, https://www.doi.gov/news/pressreleases/Obama-Administration-Releases-Roadmap-for-Solar-Energy-Development-on-Public-Lands 3 Id.
4 Institute for Energy Research, Administration Actions Designed to Increase the Cost of Energy and the Cost of
Using Energy, Sept. 9, 2014, http://instituteforenergyresearch.org/administration-actions-designed-increase-cost-energy-cost-using-energy/

3
state lands was up 113 percent, however oil production on federal lands increased by a measly
0.8 percent.5
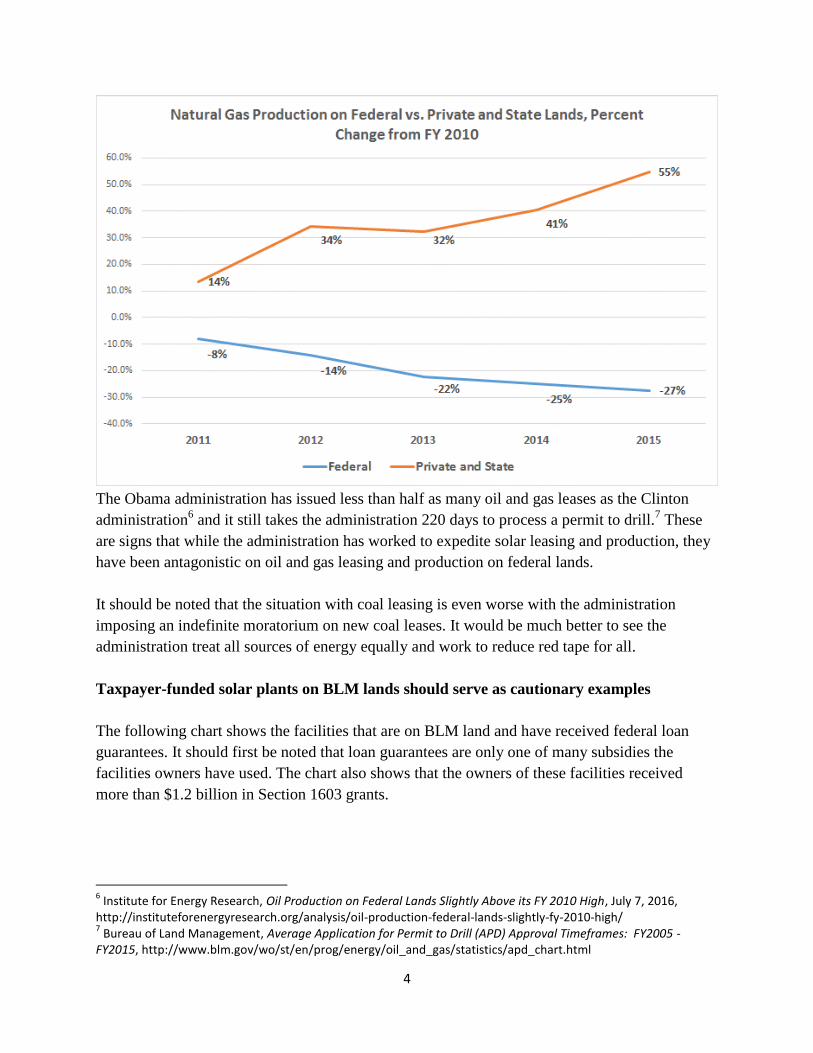
With natural gas production, there is a similar story. On private and state lands, natural gas
production is up 55 percent, but natural gas production on federal lands is down 27 percent.
5 Marc Humphries, U.S. Crude Oil and Natural Gas Production in Federal and Nonfederal Areas, Congressional
Research Service, June 22, 2016, http://www.fas.org/sgp/crs/misc/R42432.pdf
4
The Obama administration has issued less than half as many oil and gas leases as the Clinton
administration6 and it still takes the administration 220 days to process a permit to drill.
7 These
are signs that while the administration has worked to expedite solar leasing and production, they
have been antagonistic on oil and gas leasing and production on federal lands.
It should be noted that the situation with coal leasing is even worse with the administration
imposing an indefinite moratorium on new coal leases. It would be much better to see the
administration treat all sources of energy equally and work to reduce red tape for all.
Taxpayer-funded solar plants on BLM lands should serve as cautionary examples
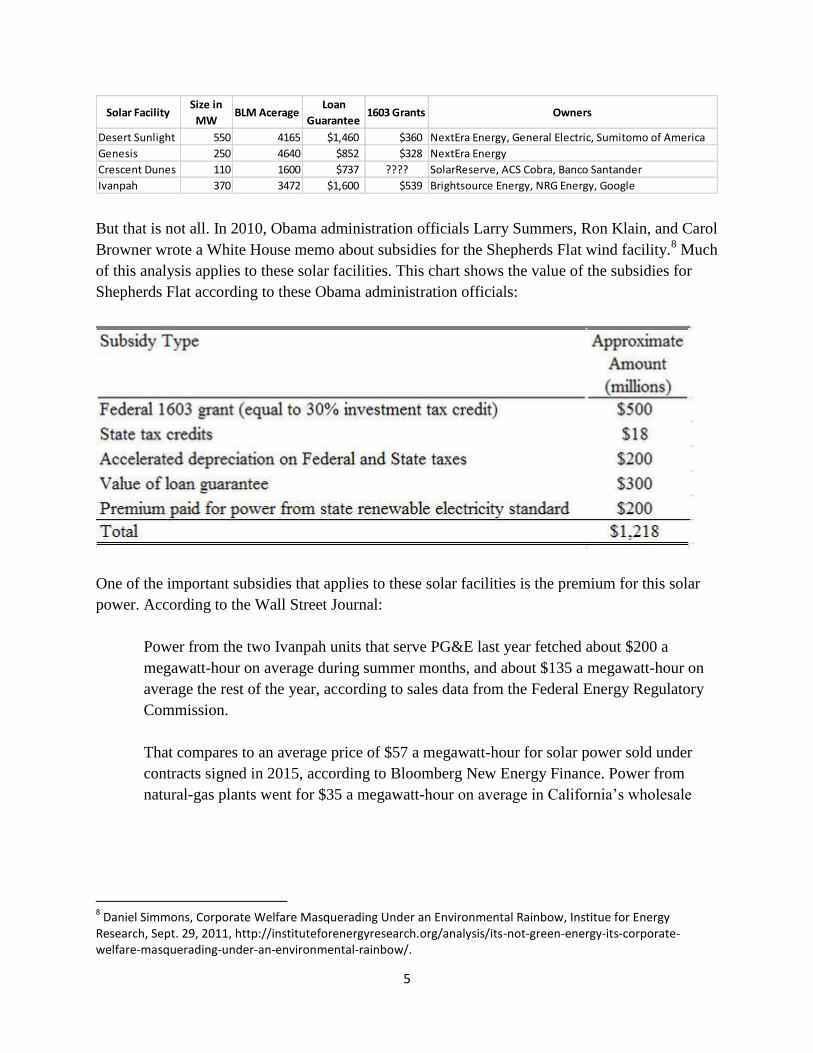
The following chart shows the facilities that are on BLM land and have received federal loan
guarantees. It should first be noted that loan guarantees are only one of many subsidies the
facilities owners have used. The chart also shows that the owners of these facilities received
more than $1.2 billion in Section 1603 grants.
6 Institute for Energy Research, Oil Production on Federal Lands Slightly Above its FY 2010 High, July 7, 2016,
http://instituteforenergyresearch.org/analysis/oil-production-federal-lands-slightly-fy-2010-high/ 7 Bureau of Land Management, Average Application for Permit to Drill (APD) Approval Timeframes: FY2005 -
FY2015, http://www.blm.gov/wo/st/en/prog/energy/oil_and_gas/statistics/apd_chart.html
5
But that is not all. In 2010, Obama administration officials Larry Summers, Ron Klain, and Carol
Browner wrote a White House memo about subsidies for the Shepherds Flat wind facility.8 Much
of this analysis applies to these solar facilities. This chart shows the value of the subsidies for
Shepherds Flat according to these Obama administration officials:
One of the important subsidies that applies to these solar facilities is the premium for this solar
power. According to the Wall Street Journal:
Power from the two Ivanpah units that serve PG&E last year fetched about $200 a
megawatt-hour on average during summer months, and about $135 a megawatt-hour on
average the rest of the year, according to sales data from the Federal Energy Regulatory
Commission.
That compares to an average price of $57 a megawatt-hour for solar power sold under
contracts signed in 2015, according to Bloomberg New Energy Finance. Power from
natural-gas plants went for $35 a megawatt-hour on average in California’s wholesale
8 Daniel Simmons, Corporate Welfare Masquerading Under an Environmental Rainbow, Institue for Energy
Research, Sept. 29, 2011, http://instituteforenergyresearch.org/analysis/its-not-green-energy-its-corporate-welfare-masquerading-under-an-environmental-rainbow/.
Solar FacilitySize in
MWBLM Acerage
Loan
Guarantee1603 Grants Owners
Desert Sunlight 550 4165 $1,460 $360 NextEra Energy, General Electric, Sumitomo of America
Genesis 250 4640 $852 $328 NextEra Energy
Crescent Dunes 110 1600 $737 ???? SolarReserve, ACS Cobra, Banco Santander
Ivanpah 370 3472 $1,600 $539 Brightsource Energy, NRG Energy, Google
6
market last year, according to a Wall Street Journal analysis of data compiled by the
Energy Department.9
$135 to $200 per MWH is very expensive electricity. Obviously this is a large subsidy for the
owners of the Ivanpah plant, which raises the question why the facility was built and subsidized
in the first place.
What makes this very unseemly is that there was never any reason for this facility to receive
hundreds of millions of dollars in subsidies because the owners had the money to spare. The
facility is owned by Google (currently called Alphabet with a market capitalization of over $500
billion), NRG Energy (market capitalization of $5 billion), and Brightsource Energy. If Google
wants to build an expensive solar plant, they are free to do so. They have plenty of money as
Google’s “poorest” founder, Larry Page, is personally worth more than $29 billion. There is,
however, no reason the American taxpayer needs to subsidize a solar plant for billionaires.
Amazingly, NRG Energy only contributed $300 million to the cost of the plant and Google
contributed $168 million. This is less than what the American people put in through the 1603
grant alone.
Making matters worse, PG&E buys the electricity from Ivanpah at very high electricity rates and
passes those higher costs to California electricity ratepayers. California ratepayers pay for these
facilities not only through higher federal taxes required to pay for the federal subsidies, but again
when they pay their electricity bill every month.
Solar Power does not increase America’s energy security nor does it reduce energy imports
When the Department of Interior rolled out their Roadmap for Solar Energy Development on
Public Lands, then-Secretary of Energy Chu stated, “Developing America's solar energy
resources is an important part of President Obama's commitment to expanding American-made
energy, increasing energy security, and creating jobs.” This statement is incorrect and suspect in
a number of ways.
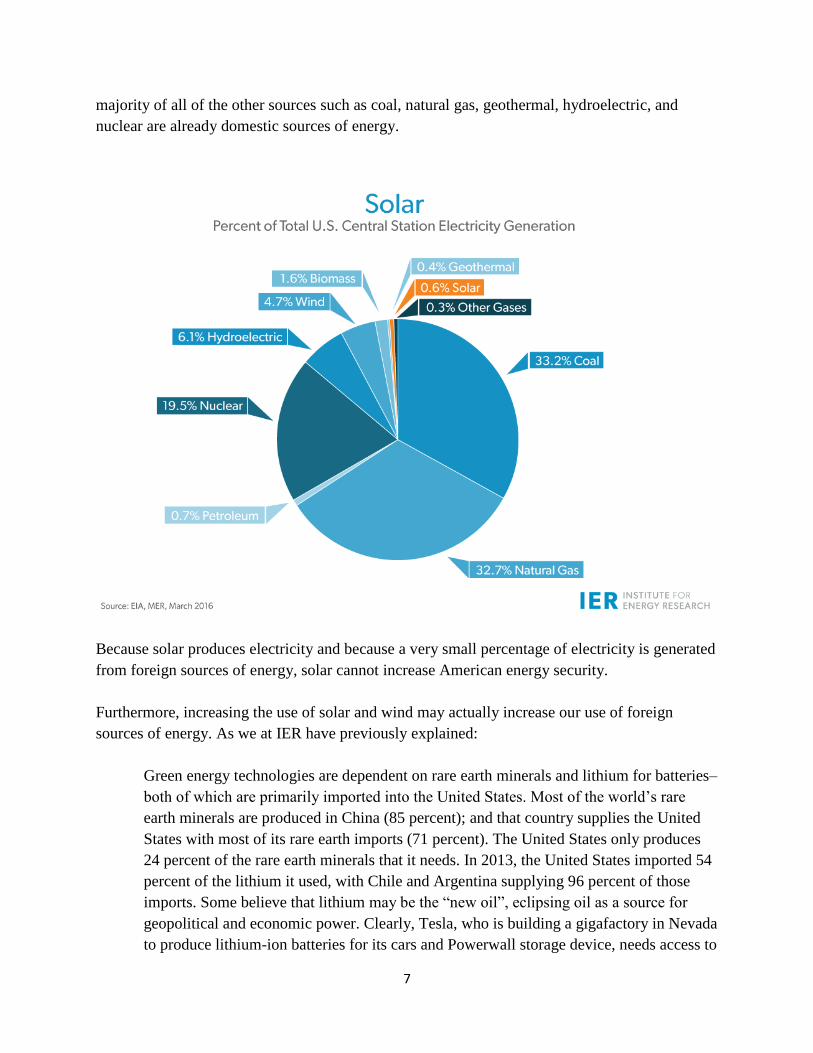
First, almost 100 percent of America’s electricity generation is already American-made. The
following graphic, using data from the Energy Information Administration, shows that solar
produced 0.6 percent of electricity in 2015. It also shows that petroleum produced a mere 0.7
percent of electricity in 2015. The U.S. imports about one quarter of the oil we use10
and the vast
9 Cassandra Sweet, Ivanpah Solar Plant May be Forced to Shut Down, Wall Street Journal, March 16, 2016,
http://www.wsj.com/articles/ivanpah-solar-plant-may-be-forced-to-shut-down-1458170858?cb=logged0.4268413656962808 10
Institute for Energy Research, Petroleum (Oil), http://instituteforenergyresearch.org/topics/encyclopedia/petroleum/
7
majority of all of the other sources such as coal, natural gas, geothermal, hydroelectric, and
nuclear are already domestic sources of energy.
Because solar produces electricity and because a very small percentage of electricity is generated
from foreign sources of energy, solar cannot increase American energy security.
Furthermore, increasing the use of solar and wind may actually increase our use of foreign
sources of energy. As we at IER have previously explained:
Green energy technologies are dependent on rare earth minerals and lithium for batteries–
both of which are primarily imported into the United States. Most of the world’s rare
earth minerals are produced in China (85 percent); and that country supplies the United
States with most of its rare earth imports (71 percent). The United States only produces
24 percent of the rare earth minerals that it needs. In 2013, the United States imported 54
percent of the lithium it used, with Chile and Argentina supplying 96 percent of those
imports. Some believe that lithium may be the “new oil”, eclipsing oil as a source for
geopolitical and economic power. Clearly, Tesla, who is building a gigafactory in Nevada
to produce lithium-ion batteries for its cars and Powerwall storage device, needs access to

8
low-cost lithium. In contrast to these figures, the United States now imports only 27
percent of the oil it uses domestically.11
When it comes to solar panel production, the vast majority of solar panels are produced in China.
As we have explained:
It is clear from worldwide manufacturing data that China is taking over the production
market for solar PVs. China has been the world’s largest manufacturer of solar panels
since 2008, and since 2011, has produced the majority of global photovoltaics on an
annualized basis. By the end of 2017, China is expected to have enough manufacturing
11
Institute for Energy Research, Green Energy Actually Increase U.S. Dependence on Imports, Feb. 29, 2016, http://instituteforenergyresearch.org/analysis/green-energy-actually-increases-u-s-dependence-on-imports/

9
capacity to produce 51 gigawatts of photovoltaics per year, an amount over twice as large
as the global production of 24 gigawatts in 2010.12
Therefore, using more solar power means more energy imports, not less.
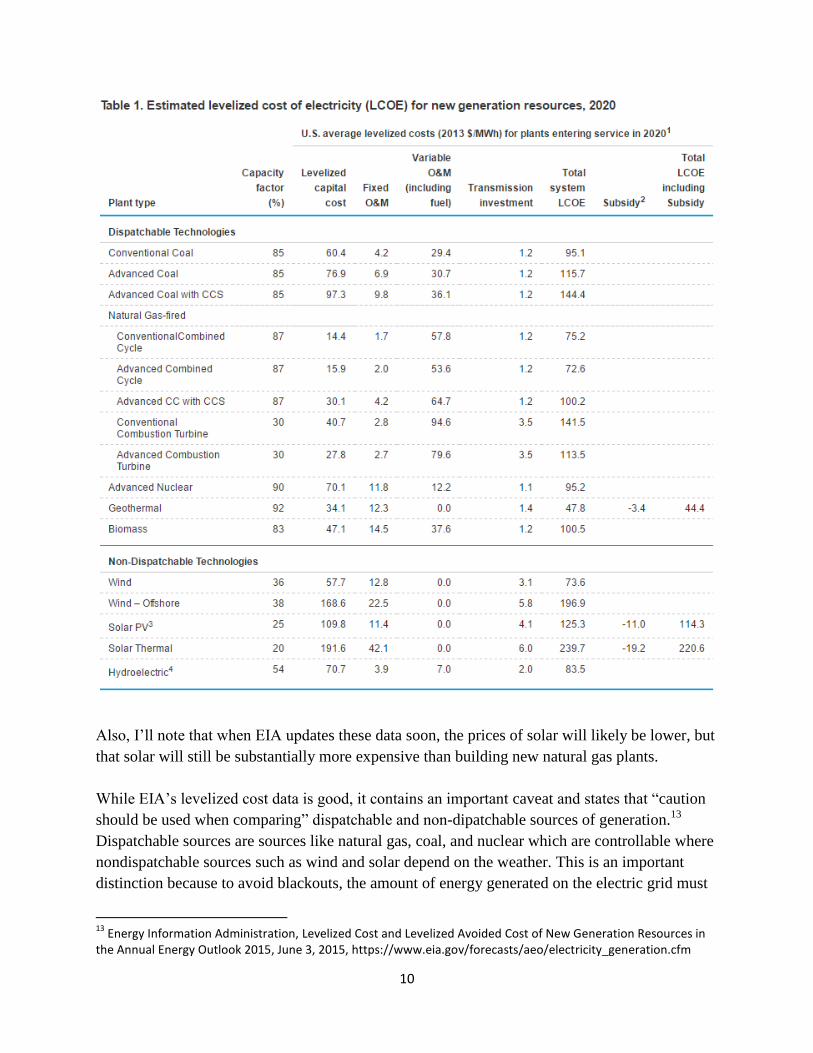
Electricity from solar facilities is very expensive
The gold standard for comparing the cost of electricity from various sources is the Energy
Information Administration’s levelized cost data. These data show that electricity from new
natural gas-fired power plants costs $75 per megawatthour (MWH) while electricity from new
solar PV costs $125 per MWH and from new solar thermal costs nearly $240 per MWH. In other
words, when it comes to electricity from new plants, solar PV is 66 percent more expensive than
new natural gas and solar thermal is 220 percent more expensive. To put this in context, Crescent
Dunes, Genesis, and Ivanpah are solar thermal plants and Desert Sunlight is a PV plant.
12
Institute for Energy Research, Hillary’s Solar PV Plan Aids Chinese Manufacturing, July 31, 2015, http://instituteforenergyresearch.org/analysis/hillarys-solar-pv-plan-aids-chinese-manufacturing/
10
Also, I’ll note that when EIA updates these data soon, the prices of solar will likely be lower, but
that solar will still be substantially more expensive than building new natural gas plants.
While EIA’s levelized cost data is good, it contains an important caveat and states that “caution
should be used when comparing” dispatchable and non-dipatchable sources of generation.13
Dispatchable sources are sources like natural gas, coal, and nuclear which are controllable where
nondispatchable sources such as wind and solar depend on the weather. This is an important
distinction because to avoid blackouts, the amount of energy generated on the electric grid must
13
Energy Information Administration, Levelized Cost and Levelized Avoided Cost of New Generation Resources in the Annual Energy Outlook 2015, June 3, 2015, https://www.eia.gov/forecasts/aeo/electricity_generation.cfm

11
always equal the amount of energy used by all of the homes and business connected to the grid.
This means that dispatchable sources are inherently more valuable than non-dispatchable
sources.
Furthermore, the most important comparison that we can make with electricity generation is not
new sources versus new sources, but our current sources of generation versus new generation.
To deal with the issue of dipatchablity and to make an apples-to-apples comparison between
different sources of electricity generation, as well as comparing existing sources to new sources,
the Institute for Energy Research will soon release an update to our report on The Levelized Cost
of Electricity from Existing Generation Resources14
which will include the levelized cost of solar
PV compared to other existing sources of generation.
The report finds that electricity from new solar is nearly 5 times more expensive than from
existing nuclear and over 3.5 times more expensive than existing coal. The summary data is in
the chart below. Also, it should be noted that the solar we included in this report is solar PV, not
solar thermal. Solar thermal would be even more expensive than solar PV.
Solar power struggles to help keeps the lights on
14
Thomas F. Stacy & George S. Taylor, The Levelized Cost of Electricity from Existing Generation Resources, June 2015, http://instituteforenergyresearch.org/wp-content/uploads/2015/06/ier_lcoe_2015.pdf

12
One of the biggest challenges in keeping the lights on and the electricity grid stable is making
sure the electricity grid has sufficient electricity during times of peak demand. Because solar is
non-dispatchable and dependent on the weather and time of the year, it cannot necessarily help
meet times of peak demand.
For example, the best time of the year for solar is during the summer and the best day of the year
should be the summer solstice. This year the solstice occurred on June 20th
. In California on the
summer solstice, peak electricity system demand occurred at 5:50 pm with demand of 44,550
MW.15
Solar peak production occurred at around 1 pm at 6,922 MW16
and by 6:00 pm near the
time of peak demand solar production had fallen to 4,491 MW. By 7:00 pm, when system
demand was still 44,000 MW, solar production had fallen to 2,629. By 9:00 pm solar production
was zero while electricity demand was still nearly 42,000 MW.
It should be noted that this is pretty much the best case scenarios for solar power to help keep the
lights on. During much of the year, there is little to zero solar production at times of peak system
demand. For example, on the spring equinox this year system demand peaked at 7:43 pm,17
however, solar production was zero by 8 pm.18
Conclusion
The Obama administration should be applauded for aggressively trying to cut red tape for energy
leasing on federal lands. However, the administration should have worked to reduce red tape for
all kinds of energy production and not just renewable production.
Solar energy is an expensive source of electricity generation. It is a much better bet for Google’s
founders to spend their own money trying to make solar cost competitive rather than using
billions in taxpayer dollars. It is unseemly that the American taxpayer has contributed billions of
dollars to these facilities when the owners could have financed these projects without taxpayer
dollars.
15
California ISO, Renewables Watch, June 20, 2016, http://content.caiso.com/green/renewrpt/20160620_DailyRenewablesWatch.pdf 16
California ISO, Hourly Breakdown of Renewable Resources, June 20, 2016, http://content.caiso.com/green/renewrpt/20160620_DailyRenewablesWatch.txt 17
California ISO, Renewables Watch, March 21, 2016, http://content.caiso.com/green/renewrpt/20160321_DailyRenewablesWatch.pdf 18
California ISO, Hourly Breakdown of Renewable Resources, March 21, 2016, http://content.caiso.com/green/renewrpt/20160321_DailyRenewablesWatch.txt