
Efficiency of Islamic Banks in Sudan: A Non-Parametric ... · Sudan is peculiar as the...
22
Efficiency of Islamic Banks in Sudan: A Non-Parametric Approach Ibrahim A. Onour ∗ Abdelgadir M.A Abdalla ∗∗ API/WPS 1012 ∗ Senior Economic Expert, Arab Planning Institute, P. O. Box 5834 Safat 13059, Kuwait, Emails: [email protected] ; [email protected] , Tel. 965-940-12953 (Corresponding author). . ∗∗ Professor of Finance, School of Management Studies, University of Khartoum, P.O. Box 321, Khartoum, Sudan. Email:[email protected] ; [email protected]
Transcript of Efficiency of Islamic Banks in Sudan: A Non-Parametric ... · Sudan is peculiar as the...
Efficiency of Islamic Banks in Sudan: A Non-Parametric Approach
Ibrahim A. Onour ∗ Abdelgadir M.A Abdalla∗∗
API/WPS 1012
∗ Senior Economic Expert, Arab Planning Institute, P. O. Box 5834 Safat 13059, Kuwait, Emails: [email protected]; [email protected] , Tel. 965-940-12953 (Corresponding author). . ∗∗ Professor of Finance, School of Management Studies, University of Khartoum, P.O. Box 321, Khartoum, Sudan. Email:[email protected]; [email protected]

Efficiency of Islamic Banks in Sudan: A Non-Parametric
Approach Abstracts This paper employs several efficiency measures and productivity changes using
Data Envelopment Analysis (DEA) to investigate efficiency performance of Islamic
banks in Sudan. Our results indicate, among twelve banks included in our sample
only two banks, (the largest bank in the group which is government owned, and
middle sized, private bank), score technical efficiency level (i.e. scale and pure
technical efficiency). While the smallest bank in the group (private owned), score
pure technical efficiency (i.e., managerial efficiency), but scale inefficient. These
results imply ownership is not a constraint of managerial and scale efficiency but
bank’s size is important factor for scale efficiency.
ملخص
منهج غير معلماتي: اإلسالمية في السودانقياس آفاءة البنوك
مصرفًا تبحث الورقة قياس آفاءة البنوك السودانية باستخدام بيانات مالية الثني عشر
تم استخدام المنهج التطويقي . 2007-2008 توفرت لدينا بياناتهم خالل الفترة تجاريًاتوضح نتائج الدراسة . إلى آفاءة إدارية وآفاءة إنتاجللبيانات والذي يصنف الكفاءة الفنية
اثنين فقط من مجموع البنوك قيد الدراسة يستوفيان الكفاءة اإلدارية واإلنتاجية معًا، وهما نتائج أن أصغر البنوك في المجموعة من توضح الآما . بنك حكومي وآخر قطاع خاص
هذه النتائج تدعم مفهوم أن . داريةحيث حجم الودائع وحجم االئتمان يستوفي الكفاءة اإلآفاءة البنوك التجارية، آما تحقيق أمام ًاال تشكل عائق) قطاع عام أو قطاع خاص(الملكية
. الكفاءة اإلدارية، لكنه عائق أمام الكفاءة اإلنتاجية تحقيقأن حجم البنك ال يمثل عائق أمام
1

1. Introduction: Islamic banking system has a long history in Sudan, as it goes back to
mid 1970, when two Islamic banks operated in the country for the first
time, funded mainly by private Saudi capital1. The purpose of this study
to examine the efficiency and nature of returns to scale of Islamic banks
in Sudan during the period of 2007 and 2008. The banking system in
Sudan is peculiar as the comprehensive peace agreement, which ended
the civil war between the North and the South of the country in 2006,
stipulates that all banks in the North would operate according to Islamic
banking system (interest-free), whereas the banks in the south operate
according to conventional banking system (interest-based). The data
included in this research covers 12 banks, operating according to Islamic
banking system. The methodology employed includes the Data
Envelopment Analysis (DEA), a non-parametric mathematical
programming technique that reveals efficiency and return to scale through
construction of a best- practice frontier.
The DEA literature distinguishes two types of efficiency; technical
efficiency and allocative efficiency. The technical efficiency refers to the
ability of a decision-making unit (DMU) to produce as much output as
possible at a given input level, or to produce a given level of output
employing the least possible input levels, whereas allocative efficiency
refers to cost-minimizing mix of inputs, at a given relative input prices.
Therefore, technical efficiency focuses on minimization of input waste, to
the extent that further reduction of inputs becomes infeasible. As a result,
Data envelopment analysis (DEA) can enable banks to identify both
sources of relative cost inefficiency - technical and allocative. Reducing
excess inputs would increase technical efficiency, and selecting the cost-
1 Only Pakistan, Iran and Sudan are the only countries with fully Shariya compliant banking system, while only Iran and Sudan have fully Shariya compliant stock markets.
2
minimizing mix of inputs, given relative input prices, would lead to
allocative efficiency. Banks that attain both types of efficiency gain an
edge in the competition for private savings by competing more effectively
with relatively cost-inefficient competitors2.
In the past, DEA approach has been extensively employed in the banking
efficiency literature. Miller and Noulas (1996) applied DEA methodology
on North American region banking sector. Drake and Hall (2003),
indicate size efficiency evidence on Japanese banks. Unlike the case of
large banks in US and UK, which experience economies of scale,
Rezvanian and Mehdian (2002) show small and medium size commercial
banks in Singapore enjoy economies of scale. Darrat et al (2002)
employed DEA on a number of banks in Kuwait indicating evidence of
technical inefficiency.
The remaining parts of the paper include five sections. Section two
discusses the main differences of Islamic banking system from the
Western style banking system. Section three describes the data of the
research. Sections four and five respectively deal with the methodology
and analysis of the results. The final section concludes the study.
2- Islamic Financial System
A major distinguishing feature of Islamic financial system is the financial
products which are based on prohibition of interest rate3. Thus, central to
Islamic financial product design is partnership and risk sharing, which is
commonly referred to as the profit-and-loss sharing paradigm (Presely &
Sessions, 1994). Another distinction of Islamic banking system includes, 2 It is important to realize that the efficiency concept in this analysis refers to cost efficiency rather than information efficiency which has to do with transparency and disclosure aspects. Since in reality Islamic banks are also profit maximizers (cost minimizers), they share the same goal of cost efficiency with conventional banks. 3 Most commonly employed Islamic products are Mudarabah, Musharaka, Murabaha, and Ijara, as well as Salam and Mugawla (for definitions of each of these and other products see Aggarwal and Yousif, 2000).
3
the nature of contracts traded among Islamic financial institutions are
subject to behavioral norms which are different from those norms
governing Western style financial institutions. More precisely, Islamic
products are based on the principles of risk sharing between capital owner
and entrepreneur, as opposed to interest rate based financing modes,
inherent in the Western financial system. Also the common share in
Islamic system differ from that of Western definition due to the way the
contract addresses asymmetric information between the capital owner and
the manager (Mannan, 1993; and Naughton & Naughton, 2000 ). The
Islamic system views the equity contract as a form of Mudarabah, where
one party provides the capital and the other one provides enterprenurship,
or management. Thus, the risk of asymmetric information is safeguarded
by the very nature of Mudarabah contract which assign equal burden of
risk and reward on parties, capital provider and manager. Since concerns
related to asymmetric information in Islamic system are mitigated
through adherence of all parties to Shariya principles, we can say that
Islamic financial system follows self-regulatory model (El-Din, 2002).
Also another distinction of Islamic financial system included in the
managerial governance aspects of firms. In Islamic system corporate
governance is heavily influenced the basic principle of partnership and
mutual risk sharing based on mutual trust between the two parties, the
principal and agent. Mannan (1993) point out that the longer term
partnership nature of mudurabah contracts supports the presence of large
block-shareholders, as opposed to smaller shareholders who are more
likely interested in short term gains and socially less beneficial projects.
As a result, corporate governance in Islamic system is more inclined
towards board structure comprised of major block shareholders acting in
a supervisory context over incumbent managers (Presley and Sessions,
1994).
4

3-Data analysis
The data employed in our study includes input and output variables for
twelve banks operating currently in Sudan. The input variables include
salaries & wages, and deposits, while the output variables include loans
and net incomes4. The sample period includes data from the latest
financial statements of 2007 and 2008. Despite the banking sector in
Sudan includes currently about thirty commercial banks, we included in
our sample only those provided the needed data for the analysis. It should
be noted that the efficiency (inefficiency) concepts in DEA models, based
on the above named input and output variables not necessarily imply
efficiency (inefficiency) of risk management. Inefficiency of a DMU here
implies falling short of best practice cost minimizing DMUs in the group
(so-called efficiency frontier). To clarify this point further suppose, there
are two banks with equal input sizes - deposits and operating expenses.
Then the bank which allocates more loans out of its total deposits, while
maintaining higher net earnings to shareholders is regarded more
efficient, even if this condition is achieved under imperfect competition
due to monopoly power, or special privileged status gained by
government ownership. In this paper we refer to the inefficiency case
arising from such situation as regulatory inefficiency because caused
mainly by regulatory constraints facing the inefficient banks, or DMUs.
The ranking of the major financial variables included in table (1), reveal
that the smallest bank in the group in terms of deposits and loans in the
year 2008, was Islamic Cooperative Development bank, with deposit and
loan sizes reaching 469 million of Sudanese pounds (equivalent to 195
million US$) and 196 million of Sudanese pounds (82 million US$)
respectively. The largest bank in terms of deposits and loans, for the same
4 Other studies define inputs as total expenses on labor (salaries & wages), capital (book value of fixed assets) and deposits (demand and saving deposits).
5

period, was Omdurman National bank, with 1173 million Sudanese
pounds (489 million US$), and 34472 million Sudanese pounds (14363
million US$). It is important to note that Omdurman National bank is the
only government owned bank in the group of banks included in our
analysis. Thus, size and earning performance dominance of ONB could
be due to the ownership factor as this is the only government owned bank
in the group. To put our DEA efficiency performance analysis in fairer
context, in this paper we explored the efficiency analysis with and
without ONB, to see how efficiency performance of other banks in the
group is influenced.
Table (1): Ranking leading indicators
DMU (2008) Deposits Loans Net Income
SIB 5 8 6 SHIB 8 7 8 BNMB 6 6 5 TIB 4 9 4 ICDB 12 12 11 KHB 11 11 12 FIB 3 2 3 SFB 2 4 2 ONB 1 1 1 UCB 9 5 7 SB 10 3 10 ARB 7 10 9
Note: See appendix for key to acronyms for DMUs. 4- Methodology: Several alternative DEA models have been employed in banks efficiency
literature. The DEA models differ according to difference in the shape of
the efficient frontier. In this paper we employed three alternative DEA
models. We use the CCR (Charnes, Cooper, and Rohdes, 1978), BCC
(Banker, Charnes, and Cooper, 1984), and the Additive model (Charnes,
6

Cooper, Golaney, Seiford, and Stutz, 1985). The main objective of a DEA
study is to project the inefficient DMUs onto the most efficient frontiers
of the DMUs in the sample, under the assumptions of change in return to
scale and constant return to scale. There are three directions, input-
oriented approach that aims at reducing the input amounts by as much as
possible at a given level of output; the output-oriented, approach that
maximizes output levels at a given input level; and the Additive model
that deals with the input excesses and output shortfalls simultaneously in
a way that maximizes both.
It should be noted that the Additive and BCC models may give different
results when inefficiencies are present. The CCR and BCC models differ
in that the former evaluates scale as well as technical inefficiencies
simultaneously, whereas the latter evaluates the two in a separately
identified fashion (Charnes et al 1994). In the following we illustrate
briefly each of these models.
4.1: Basic DEA models:
In vector-matrix notation the input-oriented CCR model, with a real
variable θ and a non-negative vector of variables can be
expressed as:
Tn ),..( 1 λλλ =
(LP0) min θ (1) subject to:
00 ≥− λθ xx (2)
0yY ≥λ (3)
0≥λ (4)
Where y0 and x0 are respectively the output and the input levels related to
the specific DMU0 under investigation, and Y and X are matrices
constituting all output and input variables. The objective function in
7

equation (1) minimizes the input level, whereas the constraints in
equations (2) and (3) constrain the minimization of input within feasible
region, and equation (4) stipulates non-negativity constraint the input and
output weights.
The problem (LP0) has a feasible solution at θ=1, 10 =λ , 0=iλ (j≠0).
Hence the optimalθ, denoted by θ*, is not greater than 1. On the other
hand, due to the nonzero assumption for the data (X and Y), the
constraint (4) forces λ to be nonzero because y0>0. Putting all this
together, we have . The input excesses and the output
shortfalls can be identified as:
10 * ≤< θ −S+S
λθ XxS −=−0 (5)
0yYS −=+ λ (6)
With , for any feasible solution 0≥−S 0≥+S ),( λθ of DLP0.
If an optimal solution ( ) above satisfies θ*=1 and is zero-
slack ( , ), then the DMU0 is called CCR-efficient.
Otherwise, the DMU0 is called CCR-inefficient. Thus, full CCR-
efficiency needs to satisfy:
**** ,,, +− SSλθ
0* =−S 0* =+S
(i) θ*=1
(ii) All slacks are zero.
The first of these two conditions is referred to as “radial efficiency”. It is
also referred to as “technical efficiency” because a value of θ*<1 means
that all inputs can be simultaneously reduced without altering the
proportion in which they are utilized. Because (1-θ*) is the maximal
proportionate reduction allowed by the production possibility set, any
8
further reductions associated with nonzero slacks will necessarily change
the input proportions. Hence the inefficiencies associated with any
nonzero slack identified in the above two phase procedure are referred to
as “mix inefficiencies”. “Weak efficiency” is sometime used when
attention if restricted to (i) in definition 2. The conditions (i) and (ii)
taken together describe what is also called “Pareto-Koopmans”
efficiency. The weak efficiency also called “Farrell efficiency” because
nonzero slack, when present in any input or output, can be used to effect
additional improvements without worsening any other input or output. On
the other hand CCR-efficiency refers to satisfaction of both (i) and (ii)
conditions.
The input-oriented BCC model evaluates the efficiency of DMU0
(0=1,...n) by adding to the constraints in (2) – (4), the new constraint
1=λe , and solving for the minimum objective function in equation (1).
It is clear that difference between CCR and BCC models is present in the
free variable u0, which is the dual variable associated with the constraint
which also does not appear in the CCR model.
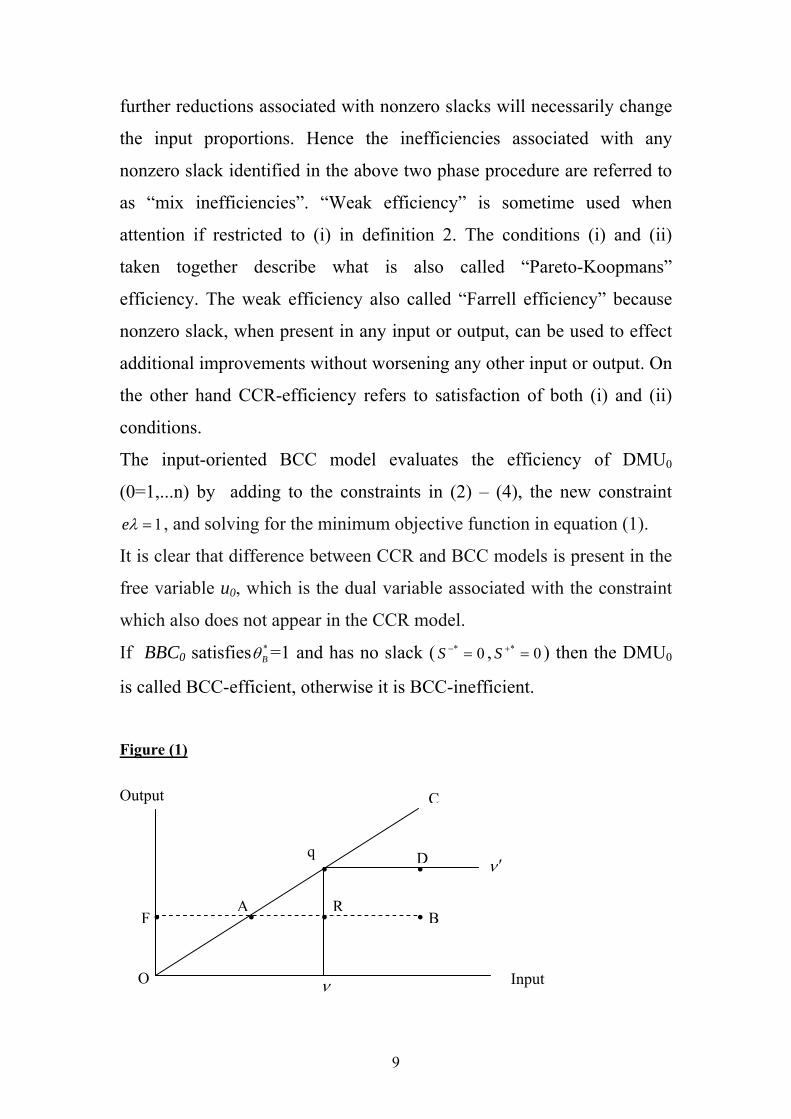
If BBC0 satisfies =1 and has no slack ( , ) then the DMU0
is called BCC-efficient, otherwise it is BCC-inefficient.
*Bθ 0* =−S 0* =+S
Figure (1)
Output C Input
AB
D
R
q
ν
ν ′
F
O
9
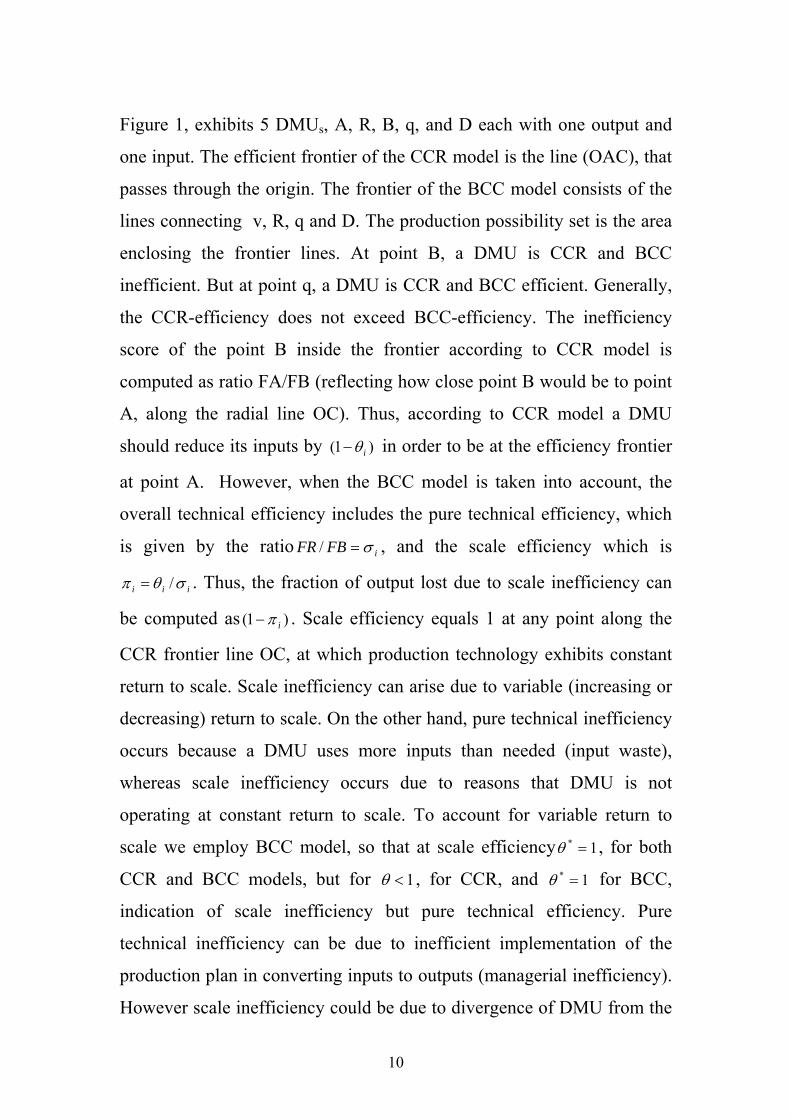
Figure 1, exhibits 5 DMUs, A, R, B, q, and D each with one output and
one input. The efficient frontier of the CCR model is the line (OAC), that
passes through the origin. The frontier of the BCC model consists of the
lines connecting v, R, q and D. The production possibility set is the area
enclosing the frontier lines. At point B, a DMU is CCR and BCC
inefficient. But at point q, a DMU is CCR and BCC efficient. Generally,
the CCR-efficiency does not exceed BCC-efficiency. The inefficiency
score of the point B inside the frontier according to CCR model is
computed as ratio FA/FB (reflecting how close point B would be to point
A, along the radial line OC). Thus, according to CCR model a DMU
should reduce its inputs by )1( iθ− in order to be at the efficiency frontier
at point A. However, when the BCC model is taken into account, the
overall technical efficiency includes the pure technical efficiency, which
is given by the ratio iFBFR σ=/ , and the scale efficiency which is
iii σθπ /= . Thus, the fraction of output lost due to scale inefficiency can
be computed as )1( iπ− . Scale efficiency equals 1 at any point along the
CCR frontier line OC, at which production technology exhibits constant
return to scale. Scale inefficiency can arise due to variable (increasing or
decreasing) return to scale. On the other hand, pure technical inefficiency
occurs because a DMU uses more inputs than needed (input waste),
whereas scale inefficiency occurs due to reasons that DMU is not
operating at constant return to scale. To account for variable return to
scale we employ BCC model, so that at scale efficiency , for both
CCR and BCC models, but for
1* =θ
1<θ , for CCR, and for BCC,
indication of scale inefficiency but pure technical efficiency. Pure
technical inefficiency can be due to inefficient implementation of the
production plan in converting inputs to outputs (managerial inefficiency).
However scale inefficiency could be due to divergence of DMU from the
1* =θ
10
most productive scale size. Therefore decomposing technical efficiency
into pure technical and scale efficiencies allows us to gain insight into the
main source of inefficiency in Sudanese banks.
The preceding models required us to distinguish between input-oriented
and output oriented specifications. The additive model combines both
orientations in a single model:
(ADD0) max (7) +− += eSeSZ
subject to:
(8) 0xSX =+ −λ
(9) 0ySX =− +λ
1=λe (10)
0,0,0 ≥≥≥ +− ssλ
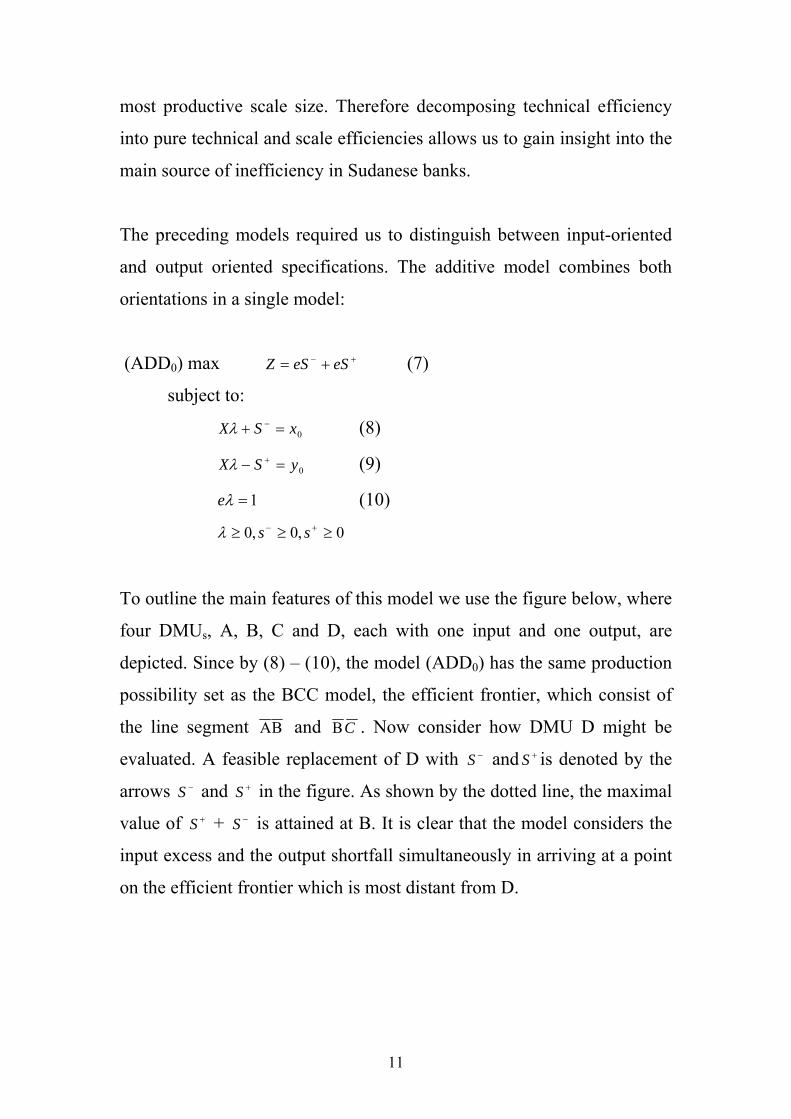
To outline the main features of this model we use the figure below, where
four DMUs, A, B, C and D, each with one input and one output, are
depicted. Since by (8) – (10), the model (ADD0) has the same production
possibility set as the BCC model, the efficient frontier, which consist of
the line segment ΒΑ and CΒ . Now consider how DMU D might be
evaluated. A feasible replacement of D with and is denoted by the
arrows and in the figure. As shown by the dotted line, the maximal
value of + is attained at B. It is clear that the model considers the
input excess and the output shortfall simultaneously in arriving at a point
on the efficient frontier which is most distant from D.
−S +S−S +S
+S −S
11
The Additive Model output input
0 1 2 3 4 5 6
Another useful analytical tool within the DEA technique is the Malmquist
index, which measures the change in technical efficiency within two
periods. To explain how Malmquist index can computed within DEA
framework, suppose each DMUj(j=1,…n) produces: a vector of outputs
by using a vector inputs of each time period t,
tz1,..T. From t to t+1, DMU0’s efficiency may change or (and) the frontier
may shift. Malmquist productivity index is defined as:
),..( 1t
sjtj
tj YYY = ),..( 1
tmj
tj
tj XXX =
⎥⎦
⎤⎢⎣
⎡= +++
+
++ ),(),(
),(),(
10
10
10
001
01
01
00
0000 ttt
ttt
ttt
ttt
YXYX
YXYX
mθθ
θθ (11)
Where and are the input and output vectors
of DMU0 among others, and is the minimum cost values. Then
),..( 0100tm
tt XXX = ),...( 0100t
stt YYY =
),( 000ttt YXθ
m0 measures the productivity change between periods t and t+1.
Productivity declines if m0>1, remains unchanged if m0=1, and improves
if m0<1 .
S-
S+
D
C
B
A
4
3
2
1
12
The following modification of m0 makes it possible to measure the
change in technical efficiency and the movement of the frontier in terms
of specific DMU0.
21
0001
01
00
001
01
01
01
01
01
01
0
0000 ),().,(
),().,(),(
),(⎥⎦
⎤⎢⎣
⎡= ++
++++
+++ tttttt
tttttt
ttt
ttt
YXYXYXYX
YXYX
mθθθθ
θθ (12)
The first term on the RHS measures the magnitude of technical efficiency
change between periods t and t+1. Obviously
1),(
),(1
01
01
0
000<
>+++ =⎥⎦
⎤⎢⎣
⎡ttt
ttt
YXYX
θθ Indicates the technical efficiency improves, remains,
or declines. The second term measures the shift in the EPF between
periods t and t+1.
5. Results and analysis Since Islamic banks manage their investment capital based on interest-
free principal, their capital structure is believed to be dominated by
shareholders’ equity and investment deposits which mainly based on
profit and loss sharing principal. In other words, the return on capital is
determined by the return on the economic activity in which the funds
are employed. Based on these distinctions the inputs and outputs in this
paper determined based on the intermediation approach in which DEA
model consist of two inputs and two outputs. The inputs include salaries
& wage expenses, and total deposits. The outputs include total loans
and net income. The specification of inputs as stated above is consistent
with the intermediation approach in which capital and labor are used to
produce loans and net earnings to shareholders. More specifically,
capital input is represented by total deposits, and labor input represented
13
by salary & wage expenses. The efficiency performance of Sudanese
banks in the sample indicate that Omdurman National Bank (ONB) and
Blue Nile Mashriq Bank (BNMB) satisfy scale and pure technical
efficiency, whereas Islamic Cooperative Development Bank (ICDB),
the smallest in the group in terms of deposits and loans, satisfy pure
technical efficiency while scale inefficient. Given that DEA efficiency
scoring mechanism determined based on a benchmark DMU, and given
that ONB is the only government-owned bank in the group, that enjoys
privilege status in terms of government deposits, we performed the
efficiency test scores in the second round excluding ONB from the
group to see how well performs the remaining group when a new
benchmark DMU introduced. Results in table (3) reveal that the number
of DMUs which are scale and technical efficient, when ONB excluded
from sample, increases to three banks which includes BNMB, UCB,
and SB. The technical efficient group also rises to three banks,
including ICDB, KHB, and FIB. The remaining banks, SHIP,TIB, SFB,
and ARB, appear to have scale and technical inefficiency problems. The
high efficiency scores for most banks in the group could be due to
recapitalization of banks and the nonperforming loans clean-up policy
urged by the central bank in 2005. As a result of the recapitalization
efforts, lower provisions were charged for loan losses and there were
also higher loan recoveries. Some banks may have adopted stricter
provisioning and classification policies for non-performing loans to
further strengthen their balance sheets.
14
Results in table (4) display changes in efficiency for each individual bank
during 2007 and 2008, represented by the term outside the bracket in
equation (12) of Malmquist index. The results in column (2) indicate
considerable variation across banks and across time. Only ONB remained
unchanged in its efficiency status for both periods. For all other banks
their efficiency status improved in 2008 as all numbers in column (2) are
non-zero positive. Results in column (3) reveal changes in the best-
practice frontier from period 2007 to 2008. As all numbers in this column
are positive all banks experience improvement in their technical progress.
Column (1) includes results of Malmquist index, indicating a positive
productivity change during 2008 compared to the year before. This may
reveal the recapitalization of banks capital and the clean-up of non-
performing loans policy adopted by the central bank in 2005, which may
have influenced banks inputs and outputs. One important direction of
future research on this issue is to include sensitivity analysis. In DEA
models each Decision Making Unit (DMU) is classified either as efficient
or inefficient. Change in inputs or outputs constraints for any DMU can
alter the efficiency decisions, i.e., an efficient DMU can become
inefficient and vice versa. Sensitivity analysis allows us to identify the
extent to which the efficiency status of an efficient DMU is sensitive to
changes in inputs and outputs. Thus, efficiency of DMU is viewed as
robust the more insensitive efficiency of a DMU to changes in inputs or
outputs. This implies that efficiency status of a DMU remains unchanged
even when inputs and outputs change within wider range of variation.
15

Table (2 ): Efficiency Scores Additive Model
DMU CCR *θ
BCC *θ *
1−S *
2−S **
3S *4+S
SIB 0.41 0.41 0.00 (+) (+) 0.00 SHIB 0.37 0.37 (+) 0.00 (+) 0.00 BNMB 1.00 1.00 0.00 0.00 0.02 0.00 TIB 0.48 0.83 0.00 (+) (+) 0.00 ICDB 0.21 1.00 0.00 0.00 0.00 0.00 KHB 0.12 0.57 0.00 (+) (+) (+) FIB 0.44 0.82 0.00 (+) (+) 0.00 SFB 0.32 0.96 0.00 (+) (+) 0.00 ONB 1.00 1.00 0.00 0.00 0.00 0.00 UCB 0.83 0.83 0.00 (+) (+) 0.00 SB 0.26 0.27 0.00 (+) (+) (+) ARB 0.25 0.25 0.00 (+) (+) (+) Note: See appendix for full names of DMUs. and are input slacks, and and are output slacks; (+) denotes a positive number.
*1−S *
2−S **
3S*
4+S
Table (3): Efficiency scores without ONB
Additive Model DMU CCR
*θ BCC
*θ *1−S *
2−S **
3S *4+S
SIB 0.23 0.23 + + + 0.00 SHIB 0.66 0.66 + 0.00 + 0.00 BNMB 1.00 1.00 0.00 0.00 0.00 0.00 TIB 0.16 0.16 + 0.00 + 0.00 ICDB 0.22 1.00 0.00 0.00 0.00 0.00 KHB 0.65 1.00 0.00 0.00 0.00 0.00 FIB 0.22 1.00 0.00 0.00 0.00 0.00 SFB 0.14 0.17 0.00 0.00 0.00 0.00 ONB -- -- -- -- -- -- UCB 1.00 1.00 0.00 0.00 0.00 0.00 SB 1.00 1.00 0.00 0.00 0.00 0.00 ARB 0.13 0.13 + + + 0.00 Note: See appendix for the acronyms under DMUs. and are input slacks, and
and are output slacks; (+) denotes a positive number.
*1−S *
1−S
**3S *
4+S
16

Table (4): Malmquist index and productivity change
DMU Malmquist Index*
Efficiency changes
Frontier shift
SIB 1.21 12.08 0.10 SHIB 1.01 9.01 0.11 BNMB 0.76 6.82 0.11 TIB 1.27 13.64 0.093 ICDB 1.24 12.64 0.098 KHB 0.92 8.47 0.10 FIB 0.72 6.00 0.12 SFB 1.04 9.50 0.10 ONB 0.098 1.00 0.09 UCB 0.55 5.55 0.09 SB 1.36 7.39 0.18 ARB 1.19 11.07 0.10 *Input-oriented CRS Malmquist index.
6- Concluding remarks: To measure efficiency performance of Islamic banks in Sudan we
employed DEA approach using the intermediation approach of
banking services, which entails banks produce financial services
using inputs. The DEA models employed test technical efficiency of
twelve Islamic banks in Sudan. Technical efficiency can be divided
into pure technical efficiency (i.e. efficient implementation of
production plan in converting inputs into outputs) and scale
efficiency (divergence of decision making units from the most
productive scale size).
The efficiency performance of Sudanese banks in the sample indicate
the largest bank in the group, Omdurman National Bank (ONB) and
middle sized, Blue Nile Mashriq Bank (BNMB) are the only two banks
attain scale and pure technical efficiency scores, the smallest bank in the
group which is Islamic Cooperative Development Bank (ICDB), scored
pure technical efficiency level, but scale inefficient.
17
These results imply, since ONB is the only government owned and
the largest bank in the group in terms of deposit and loan sizes, and
BNMB and ICDB are private owned banks, banks ownership is not
instrumental factor for managerial efficiency (pure technical
efficiency) performance, and also banks sizes is not a necessary
requirement for managerial efficiency.
Since DEA efficiency scoring mechanism determined based on best
performing benchmark DMUs, and given that ONB is the only
government-owned bank in the group, that enjoys special status in
terms of government deposits, we also run the efficiency test without
ONB to reduce the sample constituents into more homogenous
decision making units. Results in table (3) show the number of DMUs
which are scale and technical efficient, when ONB excluded from
sample, increases to three banks including BNMB, UCB, and SB. The
technical efficient group also rises to three banks, including ICDB,
KHB, and FIB. The remaining banks, SHIP, TIB, SFB, and ARB,
appear to have scale and technical inefficiency problems.
Results of productivity changes, implied by Malmquist index show
that the two banks (ONB, and BNMB) which scored technical
efficiency have shown productivity improvement during 2007 and
2008. This result is consistent with the stricter provisioning and
classification policies adopted by these banks, aimed at clean-up of
nonperforming loans to further strengthen their balance sheets.
18

References
Aggarwal, R., and Yousif, T., (2000) “Islamic Banks and Investment Financing” Journal of Money, Credit and Banking, 32/1, pp.93-120. Banker, R.D; Charnes A.; Cooper, W., (1984) “Some Models for Estimating Technical and Scale Inefficiencies in Data Envelopment Analysis” Management Science, 30, pp.1078 – 1092. Charnes A.; Cooper W; and Rhodes E., (1978) “Measuring the Efficiency of Decision Making Units” European Journal of Operation Research, 2, pp.429-444. Charnes A.; Cooper W.; Lewin A.; and Seiford L. (Eds.), 1994: Data Envelopment Analysis: Theory, Methodology, and Application, Kluwer Academic Publishers, Boston, MA. Charnes, A.; Cooper W.; Golany B; Seiford L.; Stutz J. (1985) "Foundations of Data Envelopment Analysis for Pareto-Coopmans Efficient Empirical Production Functions" Journal of Econometrics, 30 (1-2),pp.91-107. Darrat A.; Topuz C.; and Yousef T., (2002) “Assessing Cost and Technical Efficiency of Banks in Kuwait” Economic Research Forum, 8th annual conference, Cairo. Drake, L.; and Hall, M. (2003) "Efficiency in Japanese Banking: An Empirical Analysis" Journal and Banking and Finance, 27, pp.891-917. EL-Din, S. I., (2002) "Towards an Islamic Model of Stock Markets" Journal of King Abdulaziz University: Islamic Economics, 14, pp.3-29. Miller S, and Noulas A., (1996) “The Technical Efficiency of Large Bank Production, Journal of Banking and Finance, 20, pp. 495 – 509. Mannan, M. A., (1993). Understanding Islamic Finance: A Study of the Securities Market Framework. Islamic Development Bank, Saudi Arabia, Islamic research and Training Institute, Research paper No.18.
19

Naughton, T., and Naughton S., (2000) "Religion, Ethics and Stock Trading: The Case of an Islamic Equities Market" Journal of Business Ethics, 23/2, pp.145-159. Presley, J.R., and Sessions J. G.(1994) "Islamic Economics: The Emergence of a New Paradigm" The Economic Journal, 104/424, pp.584-596. Rezvanian R.; and Mehadian S., (2002) “An Examination of Cost Structure and Production Performance of Commercial Banks in Singapore” Journal of Banking and Finance, 26, pp.78-98.
20

Appendix: Key to acronyms SIB Sudan Islamic Bank SHIB Alshamal Islamic Bank BNMB Blue Nile Mushrig Bank TIB Tadamon Islamic Bank ICDB Islamic Cooperative Development BankKHB Khartoum Bank FIB Fisal Islamic Bank SFB Sudanese French Bank ONB Omdurman National Bank UCB United Capital Bank SB Alsalam Bank ARB Animal Resource Bank
21