Effects of vacuum environment on small fatigue crack ...€¦ · 1 Effects of vacuum environment on...
27
Instructions for use Title Effects of vacuum environment on small fatigue crack propagation in Ti-6Al-4V Author(s) Yoshinaka, Fumiyoshi; Nakamura, Takashi; Takaku, Kazuaki Citation International journal of fatigue, 91, 29-38 https://doi.org/10.1016/j.ijfatigue.2016.05.024 Issue Date 2016-10 Doc URL http://hdl.handle.net/2115/71584 Rights © 2016. This manuscript version is made available under the CC-BY-NC-ND 4.0 license http://creativecommons.org/licenses/by-nc-nd/4.0/ Rights(URL) http://creativecommons.org/licenses/by-nc-nd/4.0/ Type article (author version) File Information Effects of vacuum environment on small fatigue crack propagation in Ti-6Al-4V.pdf Hokkaido University Collection of Scholarly and Academic Papers : HUSCAP
Transcript of Effects of vacuum environment on small fatigue crack ...€¦ · 1 Effects of vacuum environment on...

Instructions for use
Title Effects of vacuum environment on small fatigue crack propagation in Ti-6Al-4V
Author(s) Yoshinaka, Fumiyoshi; Nakamura, Takashi; Takaku, Kazuaki
Citation International journal of fatigue, 91, 29-38https://doi.org/10.1016/j.ijfatigue.2016.05.024
Issue Date 2016-10
Doc URL http://hdl.handle.net/2115/71584
Rights © 2016. This manuscript version is made available under the CC-BY-NC-ND 4.0 licensehttp://creativecommons.org/licenses/by-nc-nd/4.0/
Rights(URL) http://creativecommons.org/licenses/by-nc-nd/4.0/
Type article (author version)
File Information Effects of vacuum environment on small fatigue crack propagation in Ti-6Al-4V.pdf
Hokkaido University Collection of Scholarly and Academic Papers : HUSCAP

1
Effects of vacuum environment on small fatigue crack propagation in Ti-6Al-4V Fumiyoshi Yoshinakaa, b, Takashi Nakamura, and Kazuaki Takakua a Division of Mechanical and Space Engineering, Graduate School of Engineering, Hokkaido University
Kita 13, Nishi 8, Kita-ku, Sapporo, Hokkaido 060–8628, Japan b JSPS Research Fellow, Japan
c Division of Mechanical and Space Engineering, Faculty of Engineering, Hokkaido University
Kita 13, Nishi 8, Kita-ku, Sapporo, Hokkaido 060–8628, Japan
Tel.: +81 11 706 6421
E-mail: [email protected]
Abstract
Small fatigue crack propagation tests were conducted on Ti-6Al-4V in ultrahigh vacuum, air, and argon to
clarify the effects of vacuum on crack propagation processes. The crack propagation rate in vacuum was
significantly lower than that in air. The crack propagation rate in argon agreed with that in air in the small
crack regime; however, it became similar to that in vacuum in the long crack regime. This indicates that
the existence of gases has significant effects in the small crack regime, even if they are chemically inert.
These results led us to conclude that, in addition to chemical inactivity, the absence of physical adsorption
plays an important role in the retarding effect of vacuum on small crack propagation.
Keywords: Small fatigue crack propagation; Vacuum; Inert gas; Gigacycle fatigue; Internal fracture
1. Introduction
An (α+β) titanium alloy Ti-6Al-4V is used in various fields as well as in aerospace applications
due to its excellent mechanical properties. Especially, its good fatigue property allows its use for the
component subjected to severe cyclic loading. The fatigue properties of this alloy were extensively
investigated by Lütjering [1–2] and Ritchie [3–4]. On the other hand, the fatigue behavior in the very high
cycle regime (> 107 cycles) has recently become a great topic of interest in this alloy. Many researches on
this material have reported fatigue fractures originating from the inside of the material (internal fracture)
in the very high cycle regime [4–8], whereas the origin is generally on the surface of the material (surface
fracture) in the high or low cycle regime. Internal fractures even occur at a stress level lower than the
ordinary fatigue limit, which is defined as the fatigue limit of the surface fracture. This fatigue failure

2
peculiarity in the very high cycle regime is a serious problem because the conventional fatigue design
based on the fatigue limit or fatigue strength at 107 cycles of surface fracture might lead to an inaccurate
estimation of long term strength. However, the internal small crack propagation processes have not yet
been clarified mainly due to the difficulty of observation.
The internal cracks seem to propagate through a vacuum-like environment that is shut off from
the air [9–15]. In other words, the effects of oxidation or gas adsorption on crack propagation could be
almost ignored in the internal crack propagation processes. On the basis of this concept, we have
conducted uniaxial fatigue tests in various vacuum environments to investigate the effects of vacuum-like
environment on internal crack propagation processes [10, 14]. As a result, remarkably similar fracture
surfaces were observed between a surface fracture in vacuum and in an internal fracture, although
completely different fracture surfaces were obtained between a surface fracture in vacuum and that in air.
Also, Benedetti et al. reported that the fracture surface of the shot peened specimen, which fractured by
the internal crack, bore a remarkable resemblance to that of the as-received specimen tested in vacuum
[15]. These results indicate that the environment inside the internal cracks is similar to a vacuum and has
a crucial effect on internal crack propagation.
We also conducted crack propagation tests on Ti-6Al-4V in ultrahigh vacuum focusing on long
cracks and clarified that the crack propagation rate da/dN was significantly lower in vacuum than in air
[13, 16]. This result suggests that the long fatigue lives of internal fractures can be attributed to such low
propagation rates of internal cracks due to a vacuum-like environment.
The retarding effect on the crack propagation rate in vacuum (or accelerating effect on that in
air) has been reported in the literature on various materials [13, 16–18]. In most works including our
previous results, however, the effects were discussed using a CT specimen with a long crack of, for
example, several to tens of mm in length. It is well known that small crack propagation behavior is more
sensitive to the effects of environments [19–20]; therefore, small crack propagation behavior must be
investigated to fully understand effects of vacuum environment on crack propagation.
On the other hand, the vacuum environment is regarded as a typical inert environment. The
major difference between the vacuum environment and the other inert environments, such as inert gas
environments, is the amount of gases. Regarding the environment inside an internal crack, there is a
possibility that the vacuum pressure (roughly corresponding to the amount of gases) is not that low due to
the gaseous substances in the materials. In this context, it is of great interest to investigate the effects of
the existence of gases on small crack propagation. The small crack propagation test in an inert gas
environment is beneficial to investigate the effects of the existence of gases without chemical interaction
between the crack and ambient environment.
In the present study, small crack propagation tests were conducted in air and ultrahigh vacuum
to clarify the effects of vacuum environment on crack propagation on the basis that the environment
inside the internal crack is vacuum-like. The tests were carried out under constant load amplitude

3
(K-increasing condition) with hourglass specimens. A small cylinder-shaped defect was created on the
specimen surface as a crack starter, and a small surface crack originating from the defect was carefully
observed to study small crack propagation. Additionally, by focusing on the possibility that the gases in
the material affect the internal crack propagation, the same tests were conducted in argon to simply
investigate the effects of the existence of gases.
2. Experimental procedures
2.1 Experimental material
The experimental material was an (α+β) titanium alloy Ti-6Al-4V. The chemical composition
of the material is shown in Table 1. The supplied material was a 20 mm diameter round bar that had been
heat treated as follows: solution treatment at 1203 K for 3.6 ks followed by air cooling and over aging at
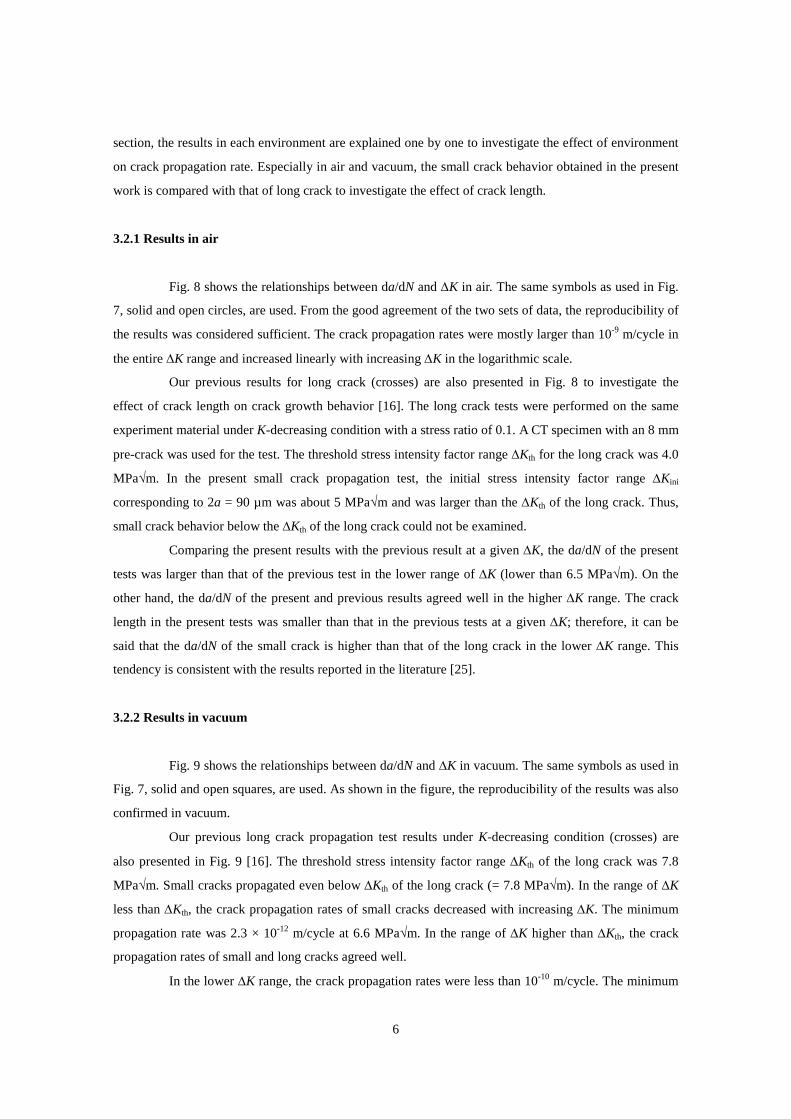
978 K for 7.2 ks followed by air cooling. The (α+β) dual-phase microstructure was observed as shown in
Fig. 1. The average grain size of each phase was 10 µm. The mechanical properties are listed in Table 2,
and the tensile strength and the elongation were 943 MPa and 17%, respectively.
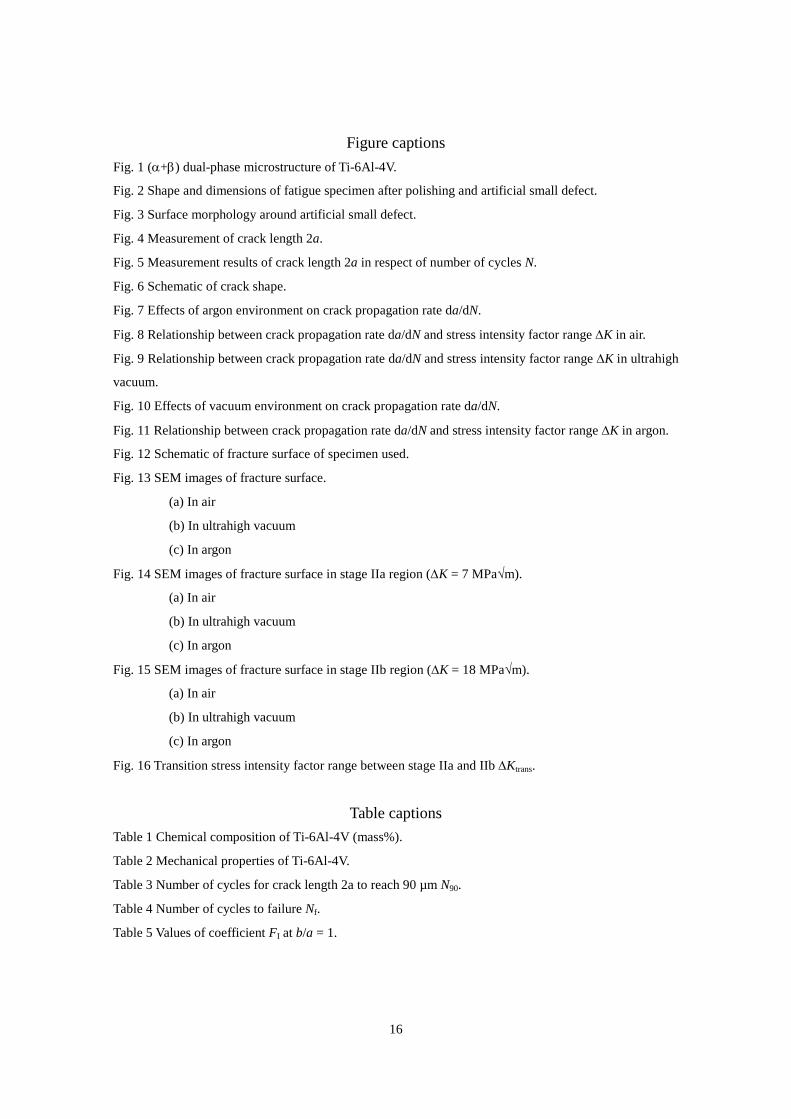
The material was lathe-turned into hourglass specimens with a parallel part of φ4.1 × 6 mm.
The specimen surfaces were ground with #120 to #2000 grit emery paper and then buff-polished with
diamond abrasive. The shape and dimensions of the fatigue specimen after polishing are shown in Fig. 2.
The diameter of the parallel part after polishing was φ4.0 mm.
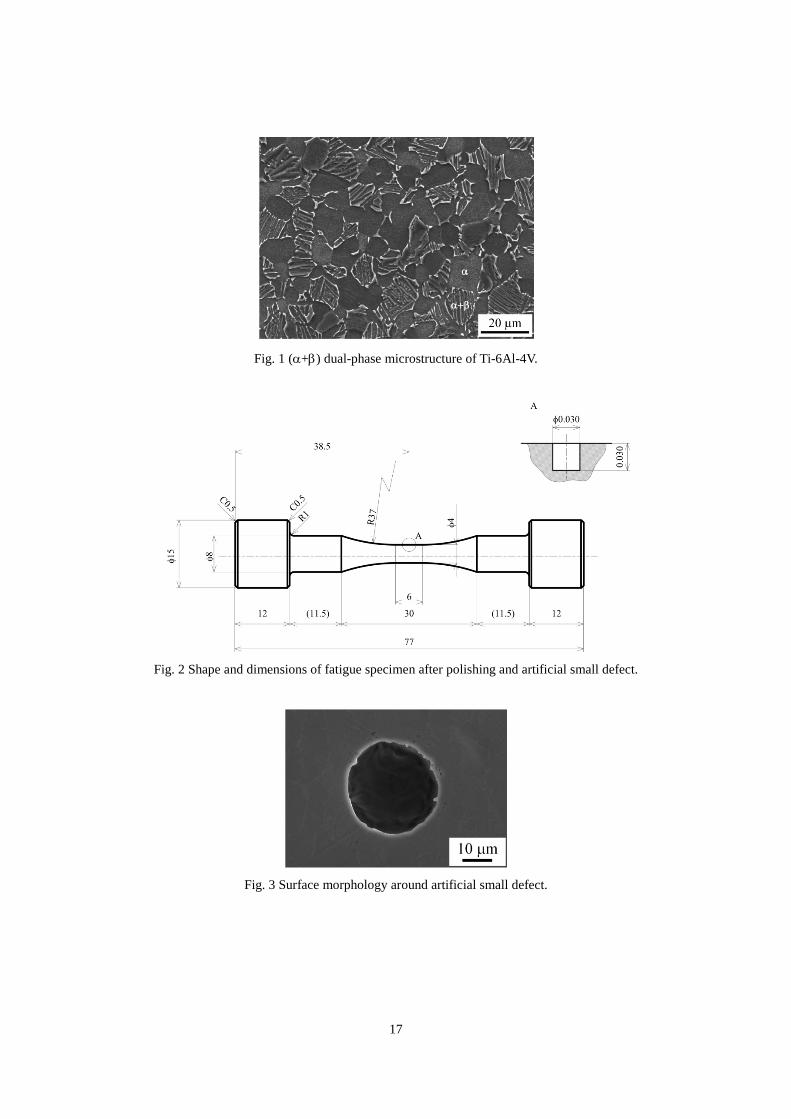
An artificial small defect was created on the center of the parallel part as a crack starter by
using an excimer laser. The defect was cylinder-shaped with a 30 µm diameter and 30 µm depth as shown
in Fig. 2. The excimer laser machining enables high processing accuracy with negligible heat effects
compared to conventional drill machining or general laser machining with, for example, a CO2 or YAG
laser. Fig. 3 shows the magnification view around the defect. Burrs generated on the peripheral edge of
the defect by the laser machining were completely removed by buff-polishing. In the present work, all the
cracks were successfully initiated from the defect. Stage I and initial part of stage IIa of the crack
propagation process are unobservable due to the small defect as explained in Section 4.1. However, the
specimens with a small defect shown in Fig. 2 are suitable for the aim of the present work, which is to
investigate the effect of environment on near-threshold small fatigue crack propagation.
An elastic-plastic stress analysis was performed on the parallel part by using ANSYS to
calculate the stress field around the small defect. The axial stress was calculated under an applied external
stress of 700 MPa, which was the maximum stress used in the tests. As a result, a local disturbance of the
stress field was caused due to the small defect as expected. The axial stress at the cross-section in the
middle of the specimen, however, saturated at 700 MPa in a region 45 µm away from the center of the
defect. Therefore, the observation results over crack length 2a (defined in the following section) of 90 µm
were mainly discussed to ignore the effect of stress concentration due to the small defect.

4
2.2 Experimental conditions
Crack propagation tests were carried out under constant load amplitude (K-increasing
condition) by using an ultrahigh vacuum uniaxial testing machine [12]. The vacuum chamber of the
machine was evacuated by using a dry scroll pump and a turbomolecular pump. The ultimate pressure of
the chamber is 4.6 × 10⁻⁷ Pa. The testing machine is equipped with a vacuum viewport, and the specimen
surface can be observed through the viewport. The tests were carried out under sinusoidal waveform
loading at a stress ratio R of 0.1 and a test frequency f of 60 Hz. The maximum stress σmax was constant at
700 MPa. The test environments were air, ultrahigh vacuum (2.7 × 10⁻⁶ – 5.3 × 10⁻⁶ Pa), and argon (1 atm
= 1.0 × 10⁵ Pa) at room temperature. For the fatigue tests in argon, the vacuum chamber was evacuated to
10-6 Pa and then purged with argon until the pressure was 1 atm. Two specimens were used for each
environmental condition to confirm the reproducibility of the test results.
The tests were interrupted periodically, and the surface crack behavior was monitored by using
a digital microscope (Keyence: VHX-2000). The microscope enables a high spatial resolution of
submicron order. During the observation, a tensile load equivalent to 80% of the maximum loading was
applied to open the crack. Fig. 4 shows the definition of the crack length 2a. In the present work, the
crack length 2a was measured as the distance between each of the two crack tips projected to the plane
perpendicular to the loading direction.
Following the fatigue tests, fracture surface observations were carried out by using an SEM
(Keyence: VE-9800) to investigate the details of the crack propagation behavior in each environment.
3 Crack propagation behavior
3.1 Relation between crack length and number of cycles
Regardless of the test environment, all specimens failed with a surface crack originating and
propagating from the small defect. The crack initiation was detected at less than 1000 cycles in all
specimens. As mentioned in Section 2.1, the observation results over the crack length 2a of 90 µm were
mainly discussed to ignore the effect of stress concentration due to the small defect in the present work.
Here, N90 is defined as the number of cycles for the crack length 2a to reach 90 µm, and the values in
each environment are shown in Table 3. The results of the two specimens in each environment are
identified by the solid and open symbols in the table: solid and open circles in air, solid and open squares
in vacuum, and solid and open triangles in argon. N90 consists of the number of cycles to crack initiation
and that taken for crack propagation to reach the length of 90 µm. The number of cycles to crack
initiation was so small (less than 1000 cycles) in all the specimens that most of N90 was considered to be
spent on initial crack propagation.

5
As shown in the table, N90 in argon and that in air had roughly the same order of magnitude. In
contrast, N90 in vacuum was approximately ten times larger than that in air. These facts suggest that the
crack propagation rate just after crack initiation was much lower in vacuum than in air and argon.
The crack length from 2a = 90 µm with respect to the number of cycles in each environment
are shown in Fig. 5. The vertical axis and the horizontal axis indicate the crack length 2a and the number
of cycles N, respectively. The shapes of 2a-N curve for each environment are similar as shown in the
figure, and the environment inducing the most rapid crack propagation is air, followed by argon and
vacuum. In particular, in vacuum, the crack propagated significantly slowly as indicated by the plateau
around 1 – 3 × 10⁶ cycles.
The number of cycles to failure Nf is listed in Table 4. The environment providing the smallest
Nf is air, followed by argon and vacuum. Considering that the N90 in argon and that in air were roughly the
same, the difference in the Nf between air and argon is caused by the crack propagation in the relatively
long crack regime (2a > 90 µm). The Nf in vacuum was significantly improved and was two orders of
magnitude larger than that in air. The improvement in the Nf in vacuum compared to that in air can be
seen in other literature [10, 14, 21–22].
3.2 Crack propagation rate
From the measurement results of crack length 2a, the crack propagation rate da/dN was
calculated, and the relationships with stress intensity factor range ∆K were investigated. da/dN is defined
as the average crack propagation rate ∆a/∆N, which is calculated by dividing the crack propagation length
∆a by the increment of number of cycles ∆N between two adjacent measuring points. ∆K was calculated
by using Eq. 1 [23].
∆𝐾𝐾 = 𝐹𝐹I∆𝜎𝜎√𝑎𝑎 (1)
where FI is a coefficient depending on both the aspect ratio of crack b/a and the ratio of crack depth to
specimen radius b/r in Fig. 6. As a result of fracture surface observation, the crack propagated uniformly
in all directions from the small defect. Therefore, b/a is determined as 1. Table 5 shows the relationships
between FI and a/r at b/a = 1. The FI at each crack length was calculated using linear interpolation
between two values as shown in Table 5. In the calculation of ∆K, the presence of the small defect was
not taken into account since the crack tip dealt with here was sufficiently apart from the edge of the small
defect (crack length 2a > 90 µm) [24].
Fig. 7 shows the relationships between da/dN and ∆K for all test environments: air (circles),
vacuum (squares), and argon (triangles). In the figure, the same symbols as used in Fig. 5 are used. As
shown in the figure, the crack propagation rates were different depending on the test environments. In this
6
section, the results in each environment are explained one by one to investigate the effect of environment
on crack propagation rate. Especially in air and vacuum, the small crack behavior obtained in the present
work is compared with that of long crack to investigate the effect of crack length.
3.2.1 Results in air
Fig. 8 shows the relationships between da/dN and ∆K in air. The same symbols as used in Fig.
7, solid and open circles, are used. From the good agreement of the two sets of data, the reproducibility of
the results was considered sufficient. The crack propagation rates were mostly larger than 10-9 m/cycle in
the entire ∆K range and increased linearly with increasing ∆K in the logarithmic scale.
Our previous results for long crack (crosses) are also presented in Fig. 8 to investigate the
effect of crack length on crack growth behavior [16]. The long crack tests were performed on the same
experiment material under K-decreasing condition with a stress ratio of 0.1. A CT specimen with an 8 mm
pre-crack was used for the test. The threshold stress intensity factor range ∆Kth for the long crack was 4.0
MPa√m. In the present small crack propagation test, the initial stress intensity factor range ∆Kini
corresponding to 2a = 90 µm was about 5 MPa√m and was larger than the ∆Kth of the long crack. Thus,
small crack behavior below the ∆Kth of the long crack could not be examined.
Comparing the present results with the previous result at a given ∆K, the da/dN of the present
tests was larger than that of the previous test in the lower range of ∆K (lower than 6.5 MPa√m). On the
other hand, the da/dN of the present and previous results agreed well in the higher ∆K range. The crack
length in the present tests was smaller than that in the previous tests at a given ∆K; therefore, it can be
said that the da/dN of the small crack is higher than that of the long crack in the lower ∆K range. This
tendency is consistent with the results reported in the literature [25].
3.2.2 Results in vacuum
Fig. 9 shows the relationships between da/dN and ∆K in vacuum. The same symbols as used in
Fig. 7, solid and open squares, are used. As shown in the figure, the reproducibility of the results was also
confirmed in vacuum.
Our previous long crack propagation test results under K-decreasing condition (crosses) are
also presented in Fig. 9 [16]. The threshold stress intensity factor range ∆Kth of the long crack was 7.8
MPa√m. Small cracks propagated even below ∆Kth of the long crack (= 7.8 MPa√m). In the range of ∆K
less than ∆Kth, the crack propagation rates of small cracks decreased with increasing ∆K. The minimum
propagation rate was 2.3 × 10⁻¹² m/cycle at 6.6 MPa√m. In the range of ∆K higher than ∆Kth, the crack
propagation rates of small and long cracks agreed well.
In the lower ∆K range, the crack propagation rates were less than 10-10 m/cycle. The minimum

7
amount of crack propagation per loading cycle must be larger than the lattice spacing (≈ 10-10 m);
therefore, it should be noted that the crack propagation rate shown in Fig. 9 indicates the average crack
propagation length per cycle during the measuring period of ∆N. The crack propagation rate could be less
than 10-10 m/cycle if the crack could not propagate continuously.
3.2.3 Comparison between results in air and those in vacuum
The results of the small crack shown in Fig. 8 and 9 are replotted in Fig. 10 to investigate the
effects of the vacuum environment on the crack propagation rate. The crack propagation rate in vacuum
was significantly lower than that in air. The difference is about one to three orders of magnitude at a given
∆K, and the pronounced effects of the vacuum were shown in the lower ∆K range corresponding to the
small crack length.
Regarding internal fractures in very high cycle fatigue (VHCF), internal cracks are considered
to propagate through the vacuum-like environment as mentioned in Chapter 1. Then, similarly to the
effect in vacuum shown in Fig. 10, the environment around the internal crack can have a retarding effect
on crack propagation, which leads to significantly improved fatigue lives compared with the surface crack.
Therefore, the occurrence of internal fractures at very high cycle regimes is considered to be due to the
vacuum-like environment around the crack.
3.2.4 Results in argon
Fig. 11 shows the relationships between da/dN and ∆K in argon. The reproducibility of the
results was also confirmed in argon. The crack propagation rates in argon were mostly larger than 10-9
m/cycle in the entire ∆K range as with those in air; however, the da/dN-∆K curves were not linear in the
logarithmic scale.
The results in air (circles), vacuum (squares), and argon (triangles) were already shown in Fig.
7 in Section 3.2. The crack propagation rate in argon agreed with that in air in the lower ∆K range (< 8
MPa√m); however, it became similar to that in vacuum in the higher ∆K range (> 11 MPa√m). The
transition region from air to vacuum was seen in the range 8 MPa√m to 11 MPa√m. As mentioned in
Section 3.1, the N90 in argon and that in air were roughly the same, but the Nf were different. This is due
to the difference in da/dN in the higher ∆K range.
Petit et al. reported similar results for aluminum alloy 7075-T651 [26]. They conducted
K-increasing crack propagation tests with a stress ratio of 0.1 at a frequency of 35 Hz. The test
environments were air, vacuum, and nitrogen. In their results, the crack propagation rate in nitrogen was
similar to that in air in the lower ∆K range and to that in vacuum in the higher ∆K range. This trend of the
crack propagation rate in nitrogen is similar to that of Fig. 7. Therefore, our result that da/dN in argon

8
agreed with that in air in the lower ∆K range and with that in vacuum in the higher ∆K range is not a
coincidence; it is an essential effect of the inert gas on the crack propagation process.
4 Fracture surface observation
4.1 Classification of fatigue crack propagation process
Fig. 12 shows a schematic of the fracture surface of the specimen with the small defect used in
the present work. The fatigue crack propagation process is usually classified into three stages according to
the crack propagation behavior [27–29]: stage I, stage II, and stage III. Furthermore, stage II can be
subdivided into IIa, IIb, and IIc. In the present work, however, stage I and the initial part of stage IIa did
not exist because of the small defect. Therefore, the observation of the crack propagation started from the
middle of stage IIa.
Fig. 13 (a), (b), and (c) show the SEM image of the fracture surface in air, in vacuum, and in
argon, respectively. The magnified view of the fracture surface near the crack initiation site (∆K = 7
MPa√m) in air, in vacuum and in argon are shown in Fig. 14 (a), (b) and (c), respectively. A very rough
appearance, typically observed in stage IIa region was observed. The magnified view of the fracture
surface far from the crack initiation site (∆K = 18 MPa√m) in air, in vacuum and in argon are shown in
Fig. 15 (a), (b) and (c), respectively. A smooth and flat appearance corresponding to stage IIb was
observed in this region. In the following discussion, firstly we focus on the transition from stage IIa to
stage IIb in each environment. The effect of environment on the fracture surface on stage IIa and stage IIb
are discussed in detail in Section 4.2.
The fracture surface appearances were totally different between stage IIa and stage IIb in the
high magnification observation as shown in Fig. 14 and 15. Therefore, the two crack propagation stages
were distinguished by means of the difference in the appearance on the high magnified views. The dashed
semi circles on Fig.13 indicate the boundary between stage IIa and IIb. The transition stress intensity
factor range ∆Ktrans at this boundary is shown in Fig. 16. The ∆Ktrans were different depending on the test
environment, and the average values of ∆Ktrans in air, in vacuum, and in argon were 11.3 MPa√m, 9.1
MPa√m, and 10.3 MPa√m, respectively.
Beevers reported that the transition from stage IIa to IIb occurs when the cyclic plastic zone
size ahead of crack tip rp becomes roughly comparable to the grain size of the material [30]. The typical rp
under plane strain condition is given in Eq. 2.
𝑟𝑟p =1
3𝜋𝜋�∆𝐾𝐾
2𝜎𝜎ys�2
(2)
where σys is the yield stress. Following Beevers’ result, the transition can occur when rp reached a critical

9
size defined by the grain size. However, ∆Ktrans in each environment was apparently different, although
these values were obtained from the same sample material (the same grain size). This result indicates that
the local yield stress around the crack tip that corresponds to σys in Eq. 2 is sensitively affected by the test
environments. From Eq. 2, the smaller ∆Ktrans means that there is lower yield stress or higher plasticity
around the crack tip. According to Fig. 16, therefore, the plasticity of the material at the crack tip is
considered to be greater in vacuum. The high plasticity at the crack tip in vacuum can also be seen in
other literature [21, 31–32]. Besides, the difference in ∆Ktrans between argon and vacuum implies that the
existence of gases can affect the plasticity of the material, even though they are chemically inert. The
difference in plasticity is likely caused by gas adsorption on a newly formed surface at the crack tip. The
effects of gas adsorption are discussed more in detail later.
4.2 Effects of environment on fracture surface
As shown in Fig. 14, regardless of the test environment, the crystallographic very rough
fracture surfaces were recognized in the stage IIa region. Angular features with sharp edges were
observed both in the fracture surface in air and in argon. In contrast, the fracture surface in vacuum had
more rounded edges and a granular appearance. The fracture surface in argon was therefore different from
that in vacuum, but it was similar to that in air in the small crack regime.
In comparison with the fracture surface in stage IIa shown in Fig. 14, a smoother appearance
was observed in stage IIb, as shown in Fig. 15. The differences in fracture surface between the
environments were less in stage IIb. However, the detailed features were different in terms of the striation
pattern. As shown in Fig. 15, the striation patterns were obviously formed in air, while there were no
obvious striation patterns in vacuum and in argon.
As above, the fracture surface appearance in argon was quite similar to that in air in the lower
∆K range. On the other hand, the similarity between the fracture surface in argon and that in vacuum was
obtained in the higher ∆K range. These tendencies are coincident with the trend in the crack propagation
rate. As shown in Fig. 7, the crack propagation rate in argon was similar to that in air in the lower ∆K
range and was almost the same as that in vacuum in the higher ∆K range. The different trends in the crack
propagation rate in argon between the higher and lower ∆K ranges apparently reflect the different crack
propagation behavior shown by the fracture surface, which indicates that the effects of argon on the crack
propagation rate depend on ∆K or the crack length.
5. Discussion
5.1 Effects of vacuum on crack propagation
As mentioned in Section 3.2.3, the crack propagation rate in vacuum was significantly lower

10
than that in air (Fig. 10). In this section, the reason for the difference in crack propagation rate between
air and vacuum is discussed to figure out the effects of vacuum on crack propagation.
In the literature, the retarding effect of vacuum on various materials including an (α+β)
titanium alloy has been reported. The literature has pointed out that oxidization or chemical adsorption on
a newly-formed slip stage dominantly affects crack propagation in air [19]: a newly-formed slip stage at
the crack tip in air is oxidized or chemisorbed in a very short time, while these phenomena hardly ever
occur in vacuum. Oxides and adsorbates decrease the surface energy on a newly-formed surface;
therefore, the crack can easily propagate in air compared to in vacuum. Namely, the decrease in surface
energy in air can explain the relative retarding effect in vacuum.
Oxides and adsorbates on a newly-formed slip stage can also act as obstacles for dislocation
motion at the crack tip. Since these phenomena are almost negligible in vacuum, the plastic deformation
at the crack tip is easier in vacuum as mentioned in Section 4.1. The high plasticity in vacuum can
promote crack tip opening. According to linear fracture mechanics, the large crack tip opening results in a
high crack propagation rate. However, plastic strain in vacuum tends to be highly homogenized, and this
promotes more blunting of the crack tip than expected by linear fracture mechanics [18]. Additionally, the
high plasticity in vacuum causes severe crack closure [21]. The high homogeneity of plastic strain, large
blunting of the crack tip, and severe crack closure are considered to be the reasons for the retarding effect
of vacuum.
Another important factor affecting the crack propagation rate is reversibility of slip [33–35].
The dislocations moving forward during the loading part of the cycle can reverse during the following
unloading part. The reversibility of slip in vacuum is considered to be high due to the absence of oxides
and adsorbates, which act as obstacles to reverse slip [33–34]. Pelloux et al. reported that the striation
pattern was not observed in vacuum due to the high reversibility of slip [33]. Also, in our present work,
the striation pattern was not observed in vacuum, while it was clearly observed in air as mentioned in
Section 4.2 (Fig. 15). This fact indicates that the reversibility of slip was higher in vacuum than in air. The
high reversibility of slip decreases the real increment of crack propagation in a whole cycle and results in
a low crack propagation rate in vacuum.
5.2 Effects of inert gas on crack propagation
As discussed in Section 5.1, the difference in crack propagation rate between air and vacuum is
explained by mainly chemical interaction such as oxidization or chemical adsorption. In this section, the
crack propagation behavior in argon is discussed to understand the effect of a chemically inert
environment on crack propagation in detail.
As shown in Section 3.2.4, the crack propagation rate in argon agreed with that in vacuum in
the higher ∆K range. Besides, a striation pattern was not observed in argon in this higher ∆K range as was

11
obtained in vacuum as shown in Fig. 15. These results indicate that the effect of vacuum on crack
propagation is almost the same as that in argon in the higher ∆K range. The common feature of these
environments is they are chemically inert; therefore, the effect of vacuum on crack propagation in the
higher ∆K range corresponding to the long crack can be explained by the absence of chemical interaction
between the ambient environment and crack.
In the lower ∆K range, on the other hand, the crack propagation rate in argon was significantly
higher than that in vacuum but was the same as that in air, indicating that the effects of vacuum on crack
propagation in the lower ∆K range corresponding to the small crack cannot be explained by only chemical
inactivity. The existence of a high amount of argon gas had an accelerating effect on small crack
propagation, even though it is chemically inert. Therefore, physical adsorptions on a newly-formed slip
stage can be a plausible process to affect the crack propagation rate in argon. The physical adsorption
between argon gases and the specimen surface is driven by van der Waals force and charge transfer force
[36–37]. Here, charge transfer force is due to the charge transfer from an argon gas to the specimen
surface. The physisorbed argon is likely to act in a similar manner to chemisorbates in air, which results
in a high crack propagation rate. In other words, the adsorption modes (chemical or physical) have little
or no effect on the degree of accelerating effect on small crack propagation.
In the present work, the acceleration effect of argon on the crack propagation rate could be seen
only in the small crack regime. Here, several researchers reported that small crack propagation is
remarkably sensitive to microstructure [27, 38]. Therefore, the argon gas environment is considered to
have a pronounced effect on the microstructure-sensitive crack propagation in the small crack regime.
The effects of inert gas on crack propagation are not yet clear; however, the existence of
ambient gases plays an important role in the small crack regime, even though they are chemically inert.
The retarding effect of ultrahigh vacuum on crack propagation in the present work is due to the quite low
amount of gases, which leads to the absence of both chemical and physical adsorption regardless of crack
length. In contrast, the acceleration effect of argon on crack propagation was only seen in the small crack
regime. Therefore, there is a possibility that different amounts of gases affect the crack propagation
process differently, especially in the small crack regime. Regarding the internal fracture in VHCF, the
environment and vacuum pressure inside an internal crack is probably determined by gas content in
metals. Therefore, it is very interesting to clarify the effects of vacuum pressure (which roughly
correspond to the amount of gases) on fatigue properties. In particular, it is important to investigate the
small internal crack propagation in terms of fatigue life prediction since the small crack propagation
process accounts for the majority of fatigue lives in VHCF. In this context, the small crack propagation
test at various vacuum pressures is necessary to fully understand the internal crack propagation process.
Conclusion

12
The underlying idea in the present work is that the internal fatigue crack in the VHCF regime
propagates through a vacuum-like environment. To consider the factors affecting this kind of vacuum
environment more precisely, small crack propagation tests were carried out on Ti-6Al-4V in air, ultrahigh
vacuum, and argon. The fracture surface observation was then conducted to investigate the crack
propagation behavior in each environment in more detail. From the results, the effect of the vacuum
environment on crack propagation was discussed in terms of the chemical reactivity and the amount of
gases. The major results obtained are as follows:
1. The crack propagation rate in vacuum was smaller than that in air. The pronounced effect of vacuum
was shown in the small crack regime, and the crack propagation rates were less than 10-10 m/cycle in
this regime.
2. As a result of fracture surface observation, the crack propagation behavior in vacuum transferred
from stage IIa to IIb at the lower ∆K range compared with in air. This low transition stress intensity
factor range ∆Ktrans in vacuum indicates the high plasticity at the crack tip.
3. Fracture surface observation also revealed that a striation pattern was not found in vacuum but
obviously was observed in air. The absence of a striation pattern indicates the high reversibility of
slip at the crack tip in vacuum.
4. The retarding effect of vacuum compared with air is explained by the high plasticity and high
reversibility of slip. These peculiarities in vacuum are attributed to the absence of oxides and
adsorbates on a newly-formed slip stage at the crack tip, which prevent dislocation motion.
5. The crack propagation rate in argon agreed with that in vacuum and was lower than that in air in the
higher ∆K range; however, the crack propagation rate in argon agreed with that in air and was higher
than that in vacuum in the lower ∆K range.
6. Considering that both the vacuum and argon environment are chemically inert, the agreement of the
crack propagation rate between argon and vacuum in the higher ∆K range indicates that chemical
interaction such as chemical adsorption plays an important role in this ∆K range. The crack
propagation behavior in vacuum in the higher ∆K range is therefore mainly explained by the
chemical inactivity of the ambient environment.
7. In contrast, the disagreement of the crack propagation rate between argon and vacuum in the lower
∆K range indicates that the existence of a high amount of ambient gases has a significant effect in
the small crack regime, even though they are chemically inert. A plausible process to affect the crack
propagation rate in argon is physical adsorption on a newly-formed slip stage at the crack tip. The
small crack propagation behavior in vacuum is therefore explained by the quite low amount of gases,
resulting in the absence of both chemical and physical adsorption.
Acknowledgement

13
The authors acknowledge the support of a Grant-in-Aid for Scientific Research (A, 2012, 24246024)
from JSPS.
References
[1] Lütjering G. Influence of processing on microstructure and mechanical properties of (α+ β) titanium
alloys. Mater Sci Eng A 1998;243;32–45
[2] Hines JA, and Lütjering G. Propagation of microcracks at stress amplitudes below the conventional
fatigue limit in Ti–6Al–4V. Fatigue Fract Eng M 1999;22; 657–65
[3] Ritchie RO, Davidson DL, Boyce BL, Campbell JP, and Roder O. High-cycle fatigue of Ti-6Al-4V.
Fatigue Fract Eng M 1999;22;621–32
[4] Nalla RK., Boyce BL, Campbell JP, Peters JO, and Ritchie RO. Influence of microstructure on
high-cycle fatigue of Ti-6Al-4V: Bimodal vs. lamellar structures. Metall Mater Trans A 2002;33;
899–918
[5] Neal DF, Blenkinsop PA. Internal fatigue origins in α-β titanium alloys. Acta Mater 1976;24;59–63
[6] Atrens A, Hoffelner W, Duerig TW, Allison JE. Subsurface crack initiation in high cycle fatigue in
Ti-6Al-4V and in a typical stainless steel. Scr Mater 1983;17;601–6
[7] Oguma H, Nakamura T. The effect of microstructure on very high cycle fatigue properties in
Ti-6Al-4V. Scr Mater 2010;63;32–4
[8] Sushant KJ, Szczepanski CJ, Golden PJ, Porter III WJ, John R. Characterization of fatigue
crack-initiation facets in relation to lifetime variability in Ti-6Al-4V. Int J Fatigue 2012;42;248–57
[9] Nishijima S, Kanazawa K. Stepwise S-N curve and fish-eye failure in gigacycle fatigue. Fatigue
Fract Eng M 1999;22;601–7
[10] Nakamura T, Oguma H, Shiina T. Influential factors on interior-originating fatigue fractures of
Ti-6Al-4V in gigacycle region: focusing on stress ratio and internal environment of material. In:
Lüetjering G, Albrecht J, editors. Ti-2003 Science and Technology, Wheinheim:
Wiley-VCH;2004;1775–82
[11] Sakai T. Review and prospects for current studies on very high cycle fatigue of metallic materials for
machine structural use. J Solid Mech Mater Eng. 2009;3;425–39
[12] Nakamura T, Oguma H, Shinohara Y. The effect of vacuum-like environment inside sub-surface
fatigue crack on the formation of ODA fracture surface in high strength steel. Procedia Eng
2010;2;2121–9
[13] Oguma H, Nakamura T. Fatigue crack propagation properties of Ti-6Al-4V in ultra high vacuum
environment. Proceedings of the 18th European Conference of Fracture (ECF18)
2010;ECF18;CD-ROM
[14] Nakamura T, Oguma H. Vacuum fatigue tests of high strength steel to simulate sub-surface fractures.

14
In: Berger C, Christ HJ, editors. Fifth International conference on very high cycle fatigue, Berlin:
DVM;2011;251–6
[15] Benedetti M, Fontanari V, Bandini M, and Savio E. High-and very high-cycle plain fatigue
resistance of shot peened high-strength aluminum alloys: The role of surface morphology. Int J
Fatigue 2015;70; 451–62
[16] Oguma H, Nakamura T. Fatigue crack propagation properties of Ti-6Al-4V in vacuum environments.
Int J Fatigue 2013;50;89–93
[17] Grinberg NM. The effect of vacuum on fatigue crack growth. Int J Fatigue 1982;4;83–95
[18] McEvily AJ, Gonzalez Velazquez JL. Fatigue crack tip deformation processes as influenced by the
environment. Metall Trans A 1992;23;2211–21 [19] Duquette DJ, Gell M. The effect of environment on the mechanism of Stage I fatigue fracture.
Metallurg Trans 1971;2;1325–31 [20] Suresh S, Zamiski GF, Ritchie RO. Oxide-induced crack closure: an explanation for near-threshold
corrosion fatigue crack growth behavior. Metallurg Trans A 1981; 12;1435–43 [21] Sugano M, Kanno S, Satake T. Fatigue behavior of titanium in vacuum. Acta Metall
1989;37;1811–20 [22] Shen H, Podlaseck SE, Kramer IR. Effect of vacuum on the fatigue life of aluminum. Acta Metall
1966;14;341–6 [23] Nishitani H, Chen D. Stress intensity factor for a semi-elliptic surface crack in a shaft under tension.
Trans JSME A 1984;50;1077–82 (in Japanese) [24] Murakami Y. Metal Fatigue: Effects of Small Defects and Nonmetallic Inclusions.
Elsevier;2002;11–24 [25] Suresh S, Ritchie RO. Propagation of short fatigue cracks. Int Mater rev 1984;29;445–75 [26] Petit J, Zeghloul A. On the effect of environment on short fatigue crack growth behavior and
threshold. In: Miller KJ, de los Rios ER, editors. The behavior of short fatigue cracks, London: MEP;1986;163–77
[27] Forsyth PJE. Fatigue damage and crack growth in aluminum alloys. Acta Metall 1963;11;703–15 [28] Birkbeck G, Inckle AE, Waldron WJ. Aspects of Stage II fatigue crack propagation in low-carbon
steel. J Mater Sci 1971;6;319–23 [29] Totten G. Fatigue crack propagation. Adv Mater Processes 2008;166;39–41 [30] Beevers CJ. Fatigue crack growth characteristics at low stress intensities of metal and alloys. Met
Sci 1977;11;362–7 [31] Ohta A, Sasaki E. Plastic zone around fatigue cracks of pure iron in vacuum and dry air. Acta Metall
1972;20;657–60 [32] Serdyuk VA, Grinberg NM. The plastic zone and growth of fatigue cracks in magnesium MA12
alloy at room and low temperatures. Int J Fatigue 1983;5;79–85 [33] Pelloux RMN. Mechanism of formation of ductile fatigue striations. Trans Am Soc Met
1969;62;281–5 [34] Sriram TS, Ke C-M, Chung YW. Fatigue deformation of silver single crystals: STM evidence for
crack nucleation, measurements of slip irreversibility and verification of a new scaling relationship for fatigue life. Acta Metall Mater 1993;41;2515–21
[35] Shyam A, Milligan WW. A model for slip irreversibility, and its effect on the fatigue crack propagation threshold in a nickel-base superalloy. Acta Mater 2005;53;835–44
[36] Küppers J, Nitschké F, Wandelt K, and Ertl G. The adsorption of Xe on Pd (110). Surf Sci 1979;87;295–314

15
[37] Ishi S, and Viswanathan B. Adsorption of xenon atoms on metal surfaces. Thin Solid Films 1991;201;373–402
[38] Petit J, Kosche K. Stage I and Stage II propagation of short and long cracks in Ai-Zn-Mg alloys. In. Miller KJ, de los Rios ER, editors. Short fatigue cracks (ESIS 13), London: MEP;1992;135–51
16
Figure captions Fig. 1 (α+β) dual-phase microstructure of Ti-6Al-4V.
Fig. 2 Shape and dimensions of fatigue specimen after polishing and artificial small defect.
Fig. 3 Surface morphology around artificial small defect.
Fig. 4 Measurement of crack length 2a.
Fig. 5 Measurement results of crack length 2a in respect of number of cycles N.
Fig. 6 Schematic of crack shape.
Fig. 7 Effects of argon environment on crack propagation rate da/dN.
Fig. 8 Relationship between crack propagation rate da/dN and stress intensity factor range ∆K in air.
Fig. 9 Relationship between crack propagation rate da/dN and stress intensity factor range ∆K in ultrahigh
vacuum.
Fig. 10 Effects of vacuum environment on crack propagation rate da/dN.
Fig. 11 Relationship between crack propagation rate da/dN and stress intensity factor range ∆K in argon.
Fig. 12 Schematic of fracture surface of specimen used.
Fig. 13 SEM images of fracture surface.
(a) In air
(b) In ultrahigh vacuum
(c) In argon
Fig. 14 SEM images of fracture surface in stage IIa region (∆K = 7 MPa√m).
(a) In air
(b) In ultrahigh vacuum
(c) In argon
Fig. 15 SEM images of fracture surface in stage IIb region (∆K = 18 MPa√m).
(a) In air
(b) In ultrahigh vacuum
(c) In argon
Fig. 16 Transition stress intensity factor range between stage IIa and IIb ∆Ktrans.
Table captions Table 1 Chemical composition of Ti-6Al-4V (mass%).
Table 2 Mechanical properties of Ti-6Al-4V.
Table 3 Number of cycles for crack length 2a to reach 90 µm N90.
Table 4 Number of cycles to failure Nf.
Table 5 Values of coefficient FI at b/a = 1.
17
Fig. 1 (α+β) dual-phase microstructure of Ti-6Al-4V.
Fig. 2 Shape and dimensions of fatigue specimen after polishing and artificial small defect.
Fig. 3 Surface morphology around artificial small defect.

18
Fig. 4 Measurement of crack length 2a.
Fig. 5 Measurement results of crack length 2a in respect of number of cycles N.
Fig. 6 Schematic of crack shape.

19
Fig. 7 Effects of argon environment on crack propagation rate da/dN.
Fig. 8 Relationship between crack propagation rate da/dN and stress intensity factor range ∆K in air.

20
Fig. 9 Relationship between crack propagation rate da/dN and stress intensity factor range ∆K in
ultrahigh vacuum.
Fig. 10 Effects of vacuum environment on crack propagation rate da/dN.

21
Fig. 11 Relationship between crack propagation rate da/dN and stress intensity factor range ∆K in argon.
Fig. 12 Schematic of fracture surface of specimen used.

22
(a) In air
(b) In ultrahigh vacuum
(c) In argon
Fig. 13 SEM images of fracture surface.

23
(a) In air
(b) In ultrahigh vacuum
(c) In argon
Fig. 14 SEM images of fracture surface in stage IIa region (∆K = 7 MPa√m).

24
(a) In air
(b) In ultrahigh vacuum
(c) In argon
Fig. 15 SEM images of fracture surface in stage IIb region (∆K = 18 MPa√m).

25
Fig. 16 Transition stress intensity factor range between stage IIa and IIb ∆Ktrans.

26
Table 1
Chemical composition of Ti-6Al-4V (mass%).
Al V O N C Fe H Ti
6.12 4.27 0.16 0.002 0.02 0.15 0.0029 Bal.
Table 2
Mechanical properties of Ti-6Al-4V.
Tensile strength
[MPa]
0.2% proof stress
[MPa]
Elongation
(%)
Reduction of area
(%)
Hardness
(Hv)
943 860 17 40 316
Table 3
Number of cycles for crack length 2a to reach 90 µm N90.
In air ● 2.2×10⁴
○ 4.2×10⁴
In ultrahigh vacuum ■ 6.5×10⁵
□ 1.4×10⁶
In argon ▲ 2.2×10⁴
△ 1.0×10⁵
Table 4
Number of cycles to failure Nf.
In air ● 4.6×10⁴
○ 7.2×10⁴
In ultrahigh vacuum ■ 5.5×10⁶
□ 6.9×10⁶
In argon ▲ 9.2×10⁴
△ 1.9×10⁵
Table 5
Values of coefficient FI at b/a = 1.
a/r 0 0.125 0.250 0.375 0.500
FI 0.660 0.665 0.683 0.714 0.758