Effects of Stacking Sequence and Impactor Diameter on ...
18
Copyright © 2016 Tech Science Press CMC, vol.52, no.2, pp.105-121, 2016 Effects of Stacking Sequence and Impactor Diameter on Impact Damage of Glass Fiber Reinforced Aluminum Alloy Laminate Zhengong Zhou 1 , Shuang Tian 1, 2 and Jiawei Zhang 3 Abstract: The methods of numerical simulation and test are combined to analyze the impact behavior of glass fiber reinforced aluminum alloy laminate (GLARE). A new failure criteria is proposed to obtain the impact failure of GLARE, and com- bined with material progressive damage method by writing code of LS-DYNA. Low velocity impact test of GLARE is employed to validate the feasibility of the finite element model established. The simulation results have been shown that pro- gressive damage finite element model established is reliable. Through the applica- tion of the finite element model established, the delamination of GLARE evolution progress is simulated, various failure modes of GLARE during impact are obtained, and the effects of stacking sequence and impactor diameter on the impact damage of GLARE are obtained. Keywords: GLARE, Impact behavior, Progressive damage, Finite element method, Impact test. 1 Introduction Glass fiber reinforced aluminum alloy laminate (GLARE) as a kind of fiber metal laminate (FML) is made of aluminium alloy sheet and alterable stacking sequence of glass fiber reinforced composites, which was first applied to cabin in 1987, and then widely adopted in practical engineering seen Volt (1996, 1999, 2011) and S- traznicky (2000). GLARE combine the advantages of aluminum alloy with glass fiber reinforced composites, becomes a structural material with low density, good corrosion resistance and impact resistance seen Sinmazçelik (2011) and Wu and Yang (2005). Damage and failure of aircraft structures caused by impact has been investigated over the years. Studies show that aviation structural failure problems 1 Center for Composite Materials, Harbin Institute of Technology, Harbin, China 2 Corresponding author E-mail: [email protected] 3 Beijing Institute of Mechanical Equipment, Beijing, P. R. China
Transcript of Effects of Stacking Sequence and Impactor Diameter on ...

Copyright © 2016 Tech Science Press CMC, vol.52, no.2, pp.105-121, 2016
Effects of Stacking Sequence and Impactor Diameter onImpact Damage of Glass Fiber Reinforced Aluminum
Alloy Laminate
Zhengong Zhou1, Shuang Tian1,2 and Jiawei Zhang3
Abstract: The methods of numerical simulation and test are combined to analyzethe impact behavior of glass fiber reinforced aluminum alloy laminate (GLARE).A new failure criteria is proposed to obtain the impact failure of GLARE, and com-bined with material progressive damage method by writing code of LS-DYNA.Low velocity impact test of GLARE is employed to validate the feasibility of thefinite element model established. The simulation results have been shown that pro-gressive damage finite element model established is reliable. Through the applica-tion of the finite element model established, the delamination of GLARE evolutionprogress is simulated, various failure modes of GLARE during impact are obtained,and the effects of stacking sequence and impactor diameter on the impact damageof GLARE are obtained.
Keywords: GLARE, Impact behavior, Progressive damage, Finite element method,Impact test.
1 Introduction
Glass fiber reinforced aluminum alloy laminate (GLARE) as a kind of fiber metallaminate (FML) is made of aluminium alloy sheet and alterable stacking sequenceof glass fiber reinforced composites, which was first applied to cabin in 1987, andthen widely adopted in practical engineering seen Volt (1996, 1999, 2011) and S-traznicky (2000). GLARE combine the advantages of aluminum alloy with glassfiber reinforced composites, becomes a structural material with low density, goodcorrosion resistance and impact resistance seen Sinmazçelik (2011) and Wu andYang (2005). Damage and failure of aircraft structures caused by impact has beeninvestigated over the years. Studies show that aviation structural failure problems
1 Center for Composite Materials, Harbin Institute of Technology, Harbin, China2 Corresponding author E-mail: [email protected] Beijing Institute of Mechanical Equipment, Beijing, P. R. China

106 Copyright © 2016 Tech Science Press CMC, vol.52, no.2, pp.105-121, 2016
always caused by impacting seen Vogelesang (2000). Therefore, it is necessaryto acquire knowledge concerning impact damage tolerance of structural material-s. By means of test and numerical simulation, researchers have attained a numberof achievements currently. In respect of test, impact tests usually conducted afterlaminates are clamped or simply supported seen Pang (1991), Pierson (1996) andLee (1997). Because the plastic deformation of the aluminum alloy after impact,the damage inspection of fiber reinforced aluminum alloy laminate (FML) test fo-cuses on the superficial phenomena observation. These studies include the analysisof the influence of impactor size, specimen geometry shape and composite stack-ing sequence on impact damage of FML seen Liu (2010) and Abdullah (2006). Inthe respect of simulation, researchers have been working for establishing an ap-propriate analytical model to simulate the composite laminate, such as a simplelocking-alleviated 3D 8-node mixed-collocation C-0 finite element and a simplelocking-alleviated 4-node mixed-collocation C-0 finite element are developed inDong’s study (2014). A majority of researchers employed commercial analyticalsoftware such as ABAQUS and LS-DYNA, however, the judgment for compositefailure mode in the software cannot describe the complicated three-dimensional im-pact problem accurately. In order to overcome this disadvantage, the user subrou-tine was developed. Tita (2008) developed a Vectorized User Material Subroutine(VUMAT) to simulate the impact damage of CFRP laminates. In his simulation thedifferent failure criterias seen Yamada (1978) and Hashin (1979) are employed inABAQUS software by VUMAT. In modeling, considering interface delaminationis an important failure mode in impact, the cohesive element as a special kind offinite elements used to model the interfacial layers in laminates. The mechanicalbehavior of these elements depend on the kind of constitutive relations implement-ed while analysis seen Sosa (2012).
So far, Many researchers have attempted to model the low-velocity impact responseand capture the various failure modes seen Faggiani (2010), Zhou (2012), Zhou(2006), and Foo (2011). The overall findings was reviewed in Chai’s (2011). Butthe failure mode of delamination established before ignore the shear stress influenceof neighboring layers on interface layer, and the material performance is progres-sive degradation during impact, but always regard as damage when failure initial.For these reasons, a new failure criterion of composites by modifying Hou’s isproposed in this paper. The new failure criterion include five failure modes of com-posites, consider the shear stress effect of neighboring layers on interface layer, anddistinct different failure modes of fiber. By subroutine code combine the new fail-ure criterion with the material performance progressive degradation method, whichis employed to analyze the impact behavior of GLARE. Through the simulation, theinternal damage evolution process of GLARE during the impact is obtained, and

Effects of Stacking Sequence and Impactor Diameter 107
the effects of stacking sequence and impactor diameter on the impact resistance ofGLARE are also obtained.
2 Impact tests and finite element model
In order to analyze the phenomena of GLARE during impact test, nonlinear finiteelement analysis software LS-DYNA is employed. The general steps involved tomodel the complex phenomenon are explained via a flowchart shown in Figure 1.The development module in Figure 1 is achieved by writing subroutine code intocomputational process. The original module is existing module of software, whichcan be employed directly.
Figure 1: Finite element simulation process
2.1 Material model to analyze the impact failure of GLARE
In order to obtain dynamic behavior of GLARE during impact, choosing suitablefailure modes to acquire all possible failure of composite layer and plasticity effectof aluminum alloy layer is necessary. GLARE is covered with aluminum alloylayer, its stress and strain relationship during impact can be analyzed with JohnsonCook Plasticity Model (J-C) seen Kashani (2015) as follows:
σy = (A+Bεpn)(1+ c ln ε̇
∗)(1−T ∗m) (1)
In the formula, A is the yield stress, B and n represent effects of strain hardening;ε̄ p is equivalent plastic strain; c is strain rate constant; ε̇∗ = ε̇/ε̇0 is dimensionlessplastic strain rate for ε̇0 = 1s−1; T ∗ = (T −Troom)/(Tmelt −Troom) is homologoustemperature, in which, Tmelt is melt temperature and Troom is room temperature; mis melt temperature index. As presented in formula (1), by means of multiplying,

108 Copyright © 2016 Tech Science Press CMC, vol.52, no.2, pp.105-121, 2016
the strain hardening, strain rate and temperature are taken into consideration in themodel. Besides, the three considered are mutually independent. So this modelis applicable to metal material analysis in impact. In a J-C model, metal damagefailure criterion is expressed as follows:
εf = [d1 +d2 expd3σ
∗][1+d4 lnε∗][1+d5T ∗] (2)
In formula (2), σ∗ = p/σ y, p is the material pressure; The value of di(i = 1, . . . ,5)are constant, can be obtained by testing. Because 2024-T3 aluminum alloy is adopt-ed in this paper, the performance parameters adopt the test results of Kay (2002) asshown in Table 1. During calculating, the value of ∆ε̄ p/ε̄ p is obtained, the failureinduced when the value increase to 1, or else the material is considered to be intact,circular calculation is conducted.
Table 1: 2024-T3 aluminum alloy sheet performance parameter seen Kay (2002)
Elastic parameters E = 724GPa, ν = 0.33, ρ = 2770kg/m3
The yield parameters A = 265MPa, B = 426MPa, c = 0.015, m = 1, n = 0.34Failure parameters d1 = 0.13,d2 = 0.13,d3 =−1.5,d4 = 0.011
During impact, various failure modes of glass fiber reinforced composite insideGLARE will be induced, and the failure mode and evolution process are complex.In this paper five kinds of composite failure modes are taken into consideration,such as matrix cracking, matrix crushing, fiber tensile breakage, fiber compressionbreakage and interface delamination. The strength failure criterion proposed byHou (2000) is considered to analyze the generation of failure. The failure criterionsconcerning the matrix are presented as follows:
Matrix cracking:
e2m =
(σ22
YT
)2
+
(σ12
S12
)2
+
(σ23
S23
)2
≥ 1,(σ22 ≥ 0) (3)
Matrix crushing:
e2d =
14
(−σ22
S12
)2
+Y 2
C σ22
4S212YC
− σ22
YC+
(σ12
S12
)2
≥ 1,(σ22 < 0) (4)
When analyzing fiber failure, Hou ignored different failure modes of impact sur-face and back. Therefore, two different failure modes of fiber tensile and fibercompression are taken into consideration in this paper, and the expressions beloware adopted to analyze fiber failure:

Effects of Stacking Sequence and Impactor Diameter 109
Fiber compression failure:
f 2c =
(σ11
XC
)2
+
(σ12
S f
)2
+
(σ13
S f
)2
≥ 1,(σ11 < 0) (5)
Fiber tensile failure:
f 2t =
(σ11
XT
)2
+
(σ12
S f
)2
+
(σ13
S f
)2
≥ 1,(σ11 ≥ 0) (6)
During the impact, delamination is one of the main failure mode seen Chai (2014).During modeling, between the prepreg layers is introduced the interface elementto simulate the delamination. Because of the delamination criterion which Houproposed ignored the effect of neighbor layers shear on interface. Therefore, a newdelamination failure criterion is proposed as follows:
Interface delamination:
e2l =
(nσ23
Sl23
)2
+
(n+1σ23
Sl23
)2
+
(σ33
ZT
)2
+
(σ22
YT
)2
≥ 1,(σ33 ≥ 0) (7)
Where σ11 is stress in the fiber direction; σ22 is stress in the transverse direction;σ33 is stress in the thickness direction; σ12 is shear stress in fiber and transversedirections; σ23 is shear stress in transverse and thickness directions; σ13 is shearstress in fiber and thickness directions; XT is tensile strength in fiber direction; XC
is compressive strength in fiber direction; YT is tensile strength in transverse di-rection; YC is compressive strength in transverse direction; ZT is tensile strength inthickness direction; S12 is shear strength in fiber and transverse directions; S23 isshear strength in transverse and thickness directions; S f is shear strength of fiberfailure; Sl23 is shear strength for delamination in transverse and thickness direction-s; n is the number of layers of the laminates.
During numerical simulation, when any stress calculation result of element satisfiedthe criterions (3)–(7), the element is considered occur the failure mode accordingly,then the failure element performance degradation will happen.
2.2 Obtain the material degradation parameter
In order to obtain accurate simulation results, it is important to select suitable degra-dation model of composite. In this section, the degradation model of compositeproposed by Kermanidis (2000) is employed. Through a lot of contrast analysis be-tween simulation results and test results, the material property degradation valuesof glass fiber reinforced composite inside the GLARE are obtained.

110 Copyright © 2016 Tech Science Press CMC, vol.52, no.2, pp.105-121, 2016
2.2.1 Low velocity impact test
Low velocity impact test is conducted with drop hammer impact test machine inthis paper. The impactor head is a hemisphere with 8mm diameter, and impactormass is 11kg. The tests are conducted for two kinds of GLARE with the initial im-pact energy of 25J. The stacking sequence of produced GLARE specimens are uni-directional (Al/0/0/0/0/Al) and symmetric orthotropic laminates (Al/0/90/90/0/Al).Performance parameters of aluminum alloy sheet and glass fiber reinforced com-posite single-layer laminate are shown Table 1 and Table 2. In the process ofspecimen production, firstly decontaminate the aluminum alloy sheet in acetonesolution, then degrease in alkali solution, then deoxidize in nitric acid solution,then anodize in phosphoric acid solution, then clean and dry. Secondly lay theglass fiber reinforced prepreg according to Table 3, then put into a vacuum tank forheating and curing. Finally take it out until cool to ambient temperature, and cut itinto specimens size with water jet cutting machine. The dimensions of specimenare shown in Table 3.
Table 2: Glass fiber reinforced composite laminate performance parameters
Elastic parameters Strength parametersE11(GPa) 49.7 G12(GPa) 5.3 ν12 0.29 ST (MPa) 65.5 XC(GPa) 0.643E22(GPa) 12.9 G13(GPa) 5.3 ν13 0.29 S(MPa) 53 YT (MPa) 45.5E33(GPa) 12.9 G23(GPa) 4.8 ν23 0.29 XT (GPa) 1.721 XC(MPa) 131.1
Table 3: The dimensions size of GLARE test specimen
tAl (mm) tGFP (mm) L (mm) w (mm)Al/0/90/90/0/Al 1 0.15 100 100(Symbols in the table means: t = thickness, L = length, w = width)
2.2.2 Material property degradation method
In order to obtain composite degradation parameter, the finite element simulationresults are compared with the tests, and three-dimensional finite element analysismodel is established as shown in Figure 2. In the analytical model, impactor ismade of rigid materials, and its elastic modulus is 210Gpa; Poisson’s ratio is 0.3;density is 7800kg/m3. Surface-to-surface contact condition is set between layers,as well as the impactor and every layer of laminate. The interpenetration betweengrids is not allowed. To guarantee that the impactor is perpendicular to laminate

Effects of Stacking Sequence and Impactor Diameter 111
surface during the impact, all freedom degrees of the impactor were limited, exceptthe perpendicular direction. Besides, clamping around GLARE was defined as afixed constraint. As GLARE is subject to short-term local stress impact, the gridsof the impact region was refined. Failure criterions in section 2.1 are adopted inmodeling to determine composite failure mode. Through comparative analysis,following composite degradation parameters of materials are employed:
Matrix cracking failure: E22, G12, G23 degrade to 0.4 of its original value;
Matrix crushing failure: E22, G12, G23 degrade to 0.5 of its original value;
Fiber compression failure: E11, E22, G12, G23, G13, ν12, ν23, ν13 degrade to 0.18 ofits original value;
Fiber tensile failure: E11, E22, G12, G23, G13, ν12, ν23, ν13 degrade to 0.1 of itsoriginal value;
Interface delamination failure: E33, G13, E23, ν13, ν23 degrade to 0.
Figure 2: The finite element model of low velocity impact
2.3 Contrastive analysis of finite element simulation and test results
In order to validate the finite element model established is reliable, simulation isconducted with impact test conditions. During the simulation, stress analytical re-sults of all elements are extracted for judging failure mode. The failure elements ofaluminum alloy sheet can be determined with the formula (2). When the value offormula (2) reaches 1, aluminum alloy is considered to be failure, and failure ele-ments should be removed. Otherwise, increase computational time steps, conductstress analysis and failure judge again until the stress does not increase, then calcu-lation is terminated. The failure element of glass fiber reinforced composites canbe determined with the formula (3) to formula (7). When any of the formulas val-ue reaches 1, materials property degradation is carried out in corresponding failureelement as section 2.2.2. Otherwise, increase computational time steps, determineelement stress and material degradation again until the stress does not increase. By
112 Copyright © 2016 Tech Science Press CMC, vol.52, no.2, pp.105-121, 2016
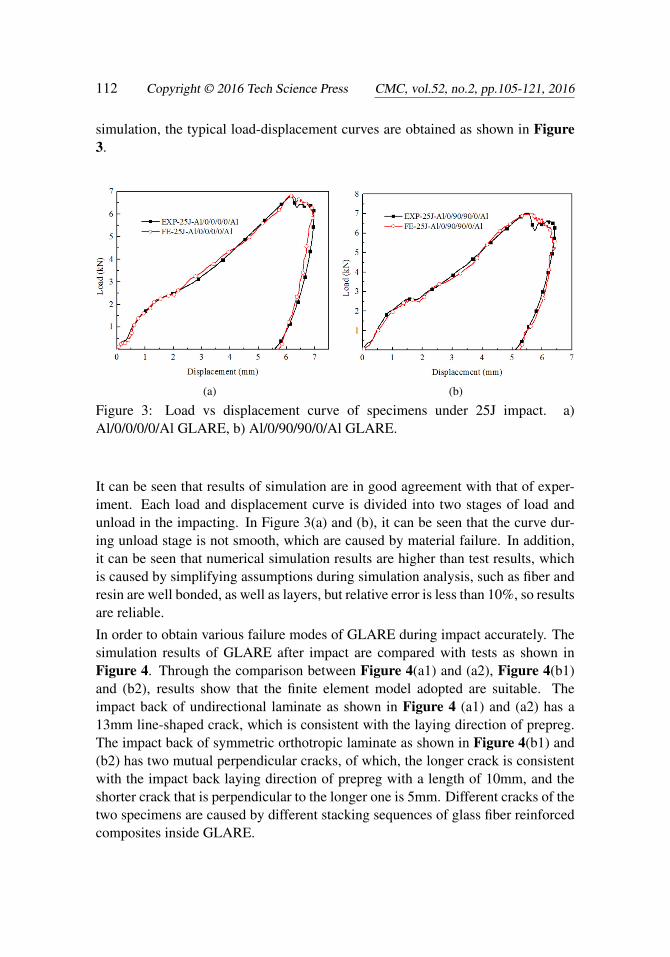
simulation, the typical load-displacement curves are obtained as shown in Figure3.
(a) (b)
Figure 3: Load vs displacement curve of specimens under 25J impact. a)Al/0/0/0/0/Al GLARE, b) Al/0/90/90/0/Al GLARE.
It can be seen that results of simulation are in good agreement with that of exper-iment. Each load and displacement curve is divided into two stages of load andunload in the impacting. In Figure 3(a) and (b), it can be seen that the curve dur-ing unload stage is not smooth, which are caused by material failure. In addition,it can be seen that numerical simulation results are higher than test results, whichis caused by simplifying assumptions during simulation analysis, such as fiber andresin are well bonded, as well as layers, but relative error is less than 10%, so resultsare reliable.
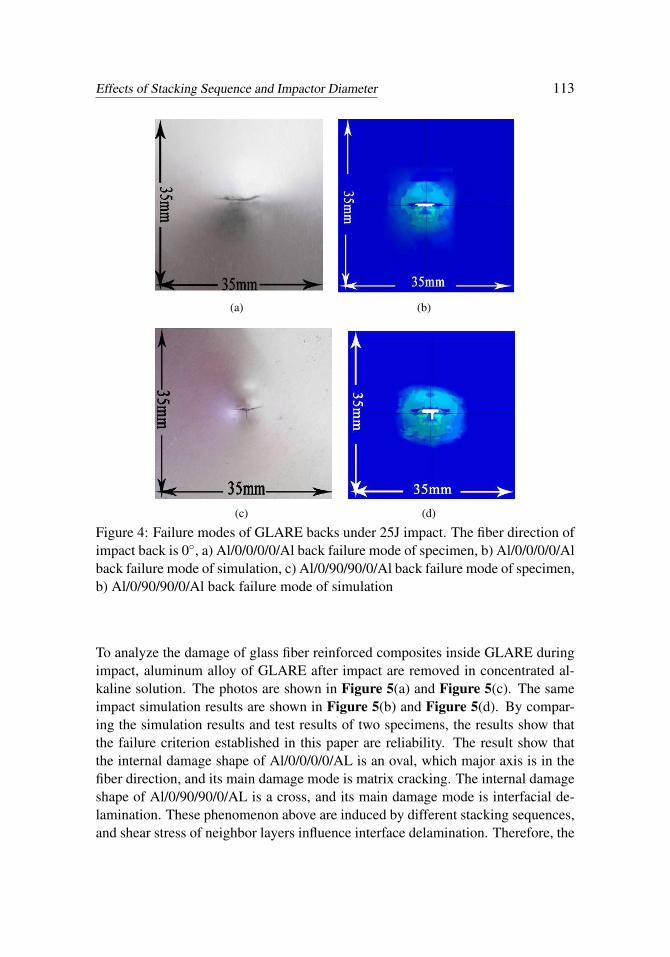
In order to obtain various failure modes of GLARE during impact accurately. Thesimulation results of GLARE after impact are compared with tests as shown inFigure 4. Through the comparison between Figure 4(a1) and (a2), Figure 4(b1)and (b2), results show that the finite element model adopted are suitable. Theimpact back of undirectional laminate as shown in Figure 4 (a1) and (a2) has a13mm line-shaped crack, which is consistent with the laying direction of prepreg.The impact back of symmetric orthotropic laminate as shown in Figure 4(b1) and(b2) has two mutual perpendicular cracks, of which, the longer crack is consistentwith the impact back laying direction of prepreg with a length of 10mm, and theshorter crack that is perpendicular to the longer one is 5mm. Different cracks of thetwo specimens are caused by different stacking sequences of glass fiber reinforcedcomposites inside GLARE.
Effects of Stacking Sequence and Impactor Diameter 113
(a) (b)
(c) (d)
Figure 4: Failure modes of GLARE backs under 25J impact. The fiber direction ofimpact back is 0◦, a) Al/0/0/0/0/Al back failure mode of specimen, b) Al/0/0/0/0/Alback failure mode of simulation, c) Al/0/90/90/0/Al back failure mode of specimen,b) Al/0/90/90/0/Al back failure mode of simulation
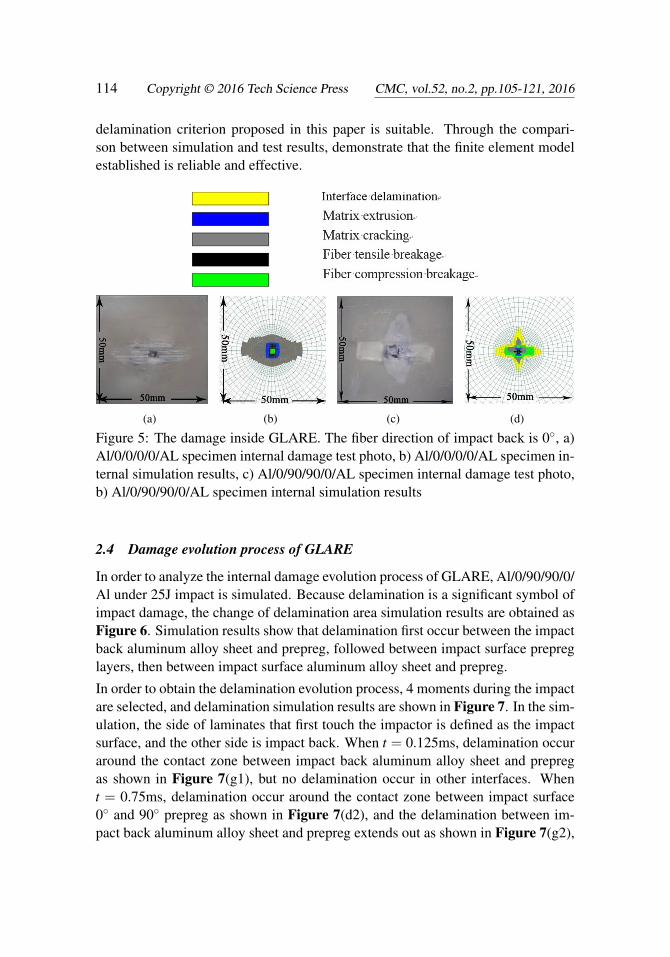
To analyze the damage of glass fiber reinforced composites inside GLARE duringimpact, aluminum alloy of GLARE after impact are removed in concentrated al-kaline solution. The photos are shown in Figure 5(a) and Figure 5(c). The sameimpact simulation results are shown in Figure 5(b) and Figure 5(d). By compar-ing the simulation results and test results of two specimens, the results show thatthe failure criterion established in this paper are reliability. The result show thatthe internal damage shape of Al/0/0/0/0/AL is an oval, which major axis is in thefiber direction, and its main damage mode is matrix cracking. The internal damageshape of Al/0/90/90/0/AL is a cross, and its main damage mode is interfacial de-lamination. These phenomenon above are induced by different stacking sequences,and shear stress of neighbor layers influence interface delamination. Therefore, the
114 Copyright © 2016 Tech Science Press CMC, vol.52, no.2, pp.105-121, 2016
delamination criterion proposed in this paper is suitable. Through the compari-son between simulation and test results, demonstrate that the finite element modelestablished is reliable and effective.
(a) (b) (c) (d)
Figure 5: The damage inside GLARE. The fiber direction of impact back is 0◦, a)Al/0/0/0/0/AL specimen internal damage test photo, b) Al/0/0/0/0/AL specimen in-ternal simulation results, c) Al/0/90/90/0/AL specimen internal damage test photo,b) Al/0/90/90/0/AL specimen internal simulation results
2.4 Damage evolution process of GLARE
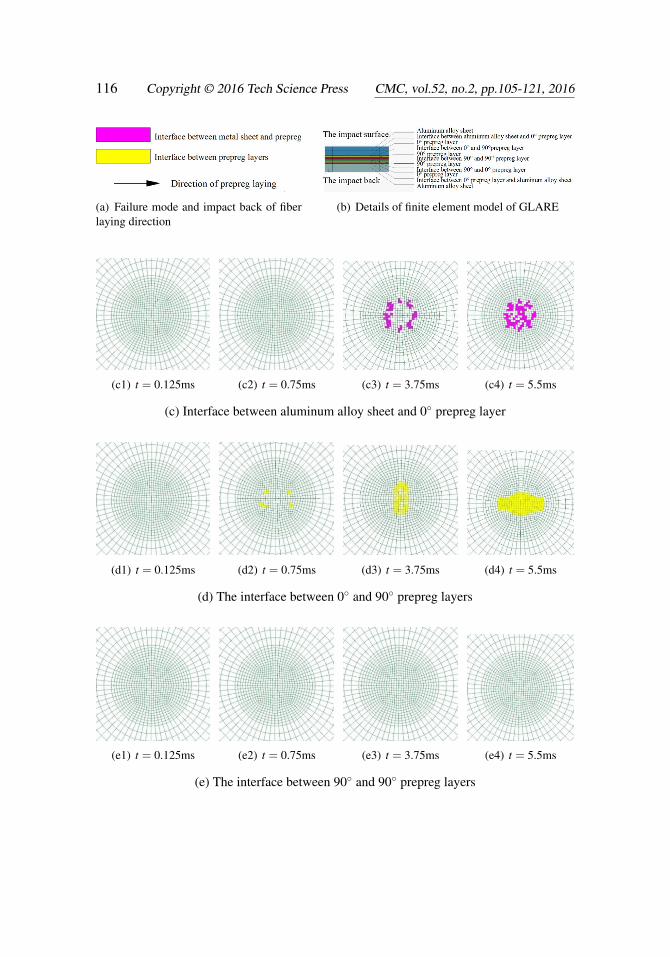
In order to analyze the internal damage evolution process of GLARE, Al/0/90/90/0/Al under 25J impact is simulated. Because delamination is a significant symbol ofimpact damage, the change of delamination area simulation results are obtained asFigure 6. Simulation results show that delamination first occur between the impactback aluminum alloy sheet and prepreg, followed between impact surface prepreglayers, then between impact surface aluminum alloy sheet and prepreg.
In order to obtain the delamination evolution process, 4 moments during the impactare selected, and delamination simulation results are shown in Figure 7. In the sim-ulation, the side of laminates that first touch the impactor is defined as the impactsurface, and the other side is impact back. When t = 0.125ms, delamination occuraround the contact zone between impact back aluminum alloy sheet and prepregas shown in Figure 7(g1), but no delamination occur in other interfaces. Whent = 0.75ms, delamination occur around the contact zone between impact surface0◦ and 90◦ prepreg as shown in Figure 7(d2), and the delamination between im-pact back aluminum alloy sheet and prepreg extends out as shown in Figure 7(g2),

Effects of Stacking Sequence and Impactor Diameter 115
Figure 6: The interfacial delamination area with time
but no delamination occur in other interfaces. When t = 3.75ms, delaminationoccurs around the contact zone between impact surface aluminum alloy sheet andprepreg as shown in Figure 7(c3). Massive delamination occur between 0◦ and 90◦
prepreg as shown in Figure 7(d3), between 90◦ and 0◦ prepreg as shown in Figure7(f3). Delamination between the impact back aluminum alloy sheet and prepregextend in and out is shown in Figure 7(g3), but no delamination occur in centerinterface as shown in Figure 7(e3). When t = 5.5ms, delamination between thealuminum alloy sheet and prepreg extend out and in as shown in Figure 7(c4) andFigure 7(g4), and delamination between different prepreg layers are maximized asshown in Figure 7(d4) and Figure 7(f4), but no delamination in center interfaceas shown in Figure 7(e4). Simulation results show that delamination area betweenprepreg layers extend a lot in the bottom prepreg direction and extend a bit in upperprepreg direction, and the delamination area shape similar to an oval. This phe-nomenon due to the interface is be influenced by the neighbor prepregs, and thebottom pregpreg undergoes larger deformation than upper prepreg during impact,so the delamination extends a lot in the bottom prepreg laying direction, and theshape of the delamination is similar to an oval.
3 Effect of stacking sequence on impact damage of GLARE
In order to analyze the influence of stacking sequence on GLARE impact damage,the finite element model established above is adopted to simulate different GLAREunder 25J impact. GLARE are Al/0/90/Al, Al/0/90/0/90/Al, Al/0/90/90/0/Al, Al/0/0/0/0/Al and Al/0/45/90/-45/Al. During the simulation, 11kg impactor with 8mm
116 Copyright © 2016 Tech Science Press CMC, vol.52, no.2, pp.105-121, 2016
(a) Failure mode and impact back of fiberlaying direction
(b) Details of finite element model of GLARE
(c1) t = 0.125ms (c2) t = 0.75ms (c3) t = 3.75ms (c4) t = 5.5ms
(c) Interface between aluminum alloy sheet and 0◦ prepreg layer
(d1) t = 0.125ms (d2) t = 0.75ms (d3) t = 3.75ms (d4) t = 5.5ms
(d) The interface between 0◦ and 90◦ prepreg layers
(e1) t = 0.125ms (e2) t = 0.75ms (e3) t = 3.75ms (e4) t = 5.5ms
(e) The interface between 90◦ and 90◦ prepreg layers

Effects of Stacking Sequence and Impactor Diameter 117
(f1) t = 0.125ms (f2) t = 0.75ms (f3) t = 3.75ms (f4) t = 5.5ms
(f) The interface between 90◦ and 0◦ prepreg layers
(g1) t = 0.125ms (g2) t = 0.75ms (g3) t = 3.75ms (g4) t = 5.5ms
(g) the interface between 0◦ prepreg layer and aluminum alloy sheet
Figure 7: Evolution of interfacial delamination inside GLARE during the impact
diameter is employed. The size of GLARE and the properties of the componentmaterials are shown as Table 1 to Table 3.
During impact, stress analytical results of each element in model is obtained, thenthe values are put into the equations (3)–(7) to judge the element failure mode, fi-nally all the failure element occupy the area of the model is obtained in Figure 8.By comparing the simulation results of the damage area, it is found that the damagearea with two-layer prepreg (Al/0/90/Al) is larger than that with four-layer prepreg,which indicates that increasing prepreg layers can increase impact damage toler-ance. Comparing the damage area of GLARE with four-layer prepreg, the damagearea of Al/0/0/0/0/Al is the largest, which reveals that the angle between layer-s can increase impact damage tolerance of GLARE. Comparing the damage areaof Al/0/90/90/0/Al and Al/0/90/0/90/Al, the former induced a larger damage area,which shows that increasing the amount of angle between layers can improve im-pact damage tolerance of GLARE. Comparing the damage area of Al/0/90/0/90/Aland Al/0/45/90/-45/Al GLARE, the former induce a larger damage area, which

118 Copyright © 2016 Tech Science Press CMC, vol.52, no.2, pp.105-121, 2016
means that decreasing angles between layers can improve impact damage toleranceof GLARE.
Figure 8: The change of GLARE damage area during 25J impact
4 Effect of impactor diameter on impact damage of GLARE
In order to analyze the influence of impactor diameter on GLARE impact damage,the finite element model established is adopted to simulate impacting under 25J.During simulation, the impactor is 11kg with diameters of 10mm, 12mm and 14mmrespectively, and the GLARE stacking sequences are Al/0/90/Al, Al/0/90/0/90/Al,Al/0/90/90/0/Al, Al/0/0/0/0/Al and Al/0/45/90/-45/Al. Through simulating the im-pact process, the damage element occupy the analysis model area are obtained asFigure 9. The impact damage area simulation results show that damage area ofGLARE reduces with the enlarging of impactor diameter. This is because the de-crease of impactor diameter leads to larger local stress that GLARE is subjected to,and the damage area increases accordingly.
5 Conclusion
By combination of test and finite element simulation methods, the GLARE withorthorhombic symmetry and unidirectional stacking sequences during 25J impactare analyzed in this paper. Through modifying the composite failure criteria ofHou proposed, and combining materials performance degrade gradually method,the three-dimensional progress degradation finite element analytical model is es-tablished. The typical load-displacement curve and corrosion testing results ofGLARE show that the model established is reliable.

Effects of Stacking Sequence and Impactor Diameter 119
Figure 9: The change of GLARE damage area with impactor diameter
Through numerical simulation, delamination of GLARE first occur between theimpact back aluminum alloy sheet and prepreg, followed between impact surfaceprepreg layers, then between impact surface aluminum alloy sheet and prepreg.
Through further analysis the impact damage of five GLARE by employing the fi-nite element established, the simulation results show increasing prepreg layers canincrease impact damage tolerance, and angles between layers can improve impactdamage tolerance of GLARE. Damage area of GLARE reduces with the enlargingof impactor diameter.
References
Abdullah, M. R.; Cantwell, W. J. (2006): The impact resistance ofpolypropylene-based fibre–metal laminates. Composites Science and Technology,vol. 66, no. 11, pp. 1682–1693.
Chai, G. B.; Manikandan, P. (2014): Low velocity impact response of fibre-metallaminates–A review. Composite Structures, vol. 107, pp. 363–381.
Chai, G. B.; Zhu, S. (2011): A review of low-velocity impact on sandwich struc-tures. Proceedings of the Institution of Mechanical Engineers, Part L: Journal ofMaterials Design and Applications, vol. 225, no. 4, pp. 207–230.
Dong, L.; El-Gizawy; A. S.; Juhany; K. A.; Atluri; S. N. (2014): A sim-ple locking-alleviated 3D 8-node mixed-collocation c0 finite element with over-integration, for functionally-graded and laminated thick-section plates and shells,with & without z-pins. CMC: Computers Materials and Continua, vol. 41, no. 3,pp. 163–192.
120 Copyright © 2016 Tech Science Press CMC, vol.52, no.2, pp.105-121, 2016
Dong, L.; El-Gizawy, A. S.; Juhany, K. A.; Atluri, S. N. (2014): A simplelocking-alleviated 4-node mixed-collocation finite element with over-integration,for homogeneous or functionally-graded or thick-section laminated compositebeams. CMC: Computers, Materials & Continua, vol. 40, no. 1, pp. 49–77��
Faggiani, A.; Falzon, B. G. (2010): Predicting low-velocity impact damage on astiffened composite panel. Composites Part A: Applied Science and Manufacturing,vol. 41, no. 6, pp. 737–749.
Foo, C. C.; Seah, L. K.; Chai, G. B. (2011): A modified energy-balance model topredict low-velocity impact response for sandwich composites. Composite Struc-tures, vol. 93, no. 5, pp. 1385–1393.
Hashin, Z. (1979): Analysis of properties of fiber composites with anisotropicconstituents. Journal of Applied Mechanics, vol. 46, no. 3, pp. 543–550.
Hou, J. (2000): Prediction of impact damage in composite plates. Composites Sci-ence and Technology, vol. 60, no. 2, pp. 273–281.
Kashani, M. H.; Sadighi, M.; Lalehpour, A. (2015): The effect of impact energydivision over repeated low-velocity impact on fiber metal laminates. Journal ofComposite Materials, vol. 49, no. 6, pp. 635–646.
Kay, G. (2002): Failure Modeling of Titanium-61-4V and 2024-T3 Aluminumwith the Johnson-Cook Material Model. Technical Rep. Lawrence Livermore Na-tional Laboratory, Livermore, CA.
Kermanidis, T. (2000): Finite element modeling of damage accumulation in boltedcomposite joints under incremental tensile loading. in Proceedings of the ThirdECCOMAS Congress.
Lee, Y.-S.; Kang, K.-H.; Park, O. (1997): Response of hybrid laminated compos-ite plates under low-velocity impact. Computers & Structures, vol. 65, no. 6, pp.965–974.
Liu, Y.; Liaw, B. (2010): Effects of constituents and lay-up configuration on drop-weight tests of fiber-metal laminates. Applied Composite Materials, vol. 17, no. 1,pp. 43–62.
Pang, S. S.; Zhao, Y.; Yang, C.; Griffin, S. A. (1991): Impact response of com-posite laminates with a hemispherical indenter. Polymer Engineering & Science,vol. 31, no. 20, pp. 1461–1466.
Pierson, M. O.; Vaziri, R. (1996): Analytical solution for low-velocity impactresponse of composite plates. AIAA Journal, vol. 34, no. 8, pp. 1633–1640.
Straznicky, P. V. (2000): Applications of fiber-metal laminates. Polymer Compos-ites, vol. 21, no. 4, pp. 558–567.

Effects of Stacking Sequence and Impactor Diameter 121
Sinmazçelik, T.; Avcu, E.; Bora, M.; Çoban, O. (2011): A review: fibre met-al laminates, background, bonding types and applied test methods. Materials &Design, vol. 32, no. 7, pp. 3671–3685.
Sosa, J. L. C.; Karapurath, N. (2012): Delamination modelling of GLARE usingthe extended finite element method. Composites Science and Technology, vol. 72,no. 7, pp. 788–791.
Tita, V.; J. de Carvalho.; Vandepitte (2008): Failure analysis of low velocity im-pact on thin composite laminates: Experimental and numerical approaches. Com-posite Structures, vol. 83, no. 4, pp. 413–428.
Vlot, A.; Vogelesang, L.; De Vries, T. (1999): Towards application of fibre metallaminates in large aircraft. Aircraft Engineering and Aerospace Technology, vol.71, no. 6, pp. 558–570.
Vlot, A. (1996): Impact loading on fibre metal laminates. International Journal ofImpact Engineering, vol. 18, no. 3, pp. 291–307.
Vlot, A.; Gunnink, J. W. (2011): Fibre metal laminates: an introduction. SpringerScience & Business Media.
Vogelesang; L. B.; Vlot, A. (2000): Development of fibre metal laminates foradvanced aerospace structures. Journal of Materials Processing Technology, vol.103, no. 1, pp. 1–5.
Wu, G.; Yang, J. M. (2005): The mechanical behavior of GLARE laminates foraircraft structures. Jom, vol. 57, no. 1, pp. 72–79.
Yamada, S. E.; Sun, C. T. (1978): Analysis of laminate strength and its distribu-tion. Journal of Composite Materials, vol. 12, no. 3, pp. 275–284.
Zhou, J.; Hassan, M. Z.; Guan, Z. (2012): The low velocity impact response offoam-based sandwich panels. Composites science and Technology, vol. 72, no. 14,pp. 1781–1790.
Zhou, D. W.; Stronge, W. J. (2006): Low velocity impact denting of HSSAlightweight sandwich panel. International Journal of Mechanical Sciences, vol.48, no. 10, pp. 1031–1045.