Experimental warming amplified opposite impacts of drought ...

HAL Id: insu-00615432https://hal-insu.archives-ouvertes.fr/insu-00615432
Submitted on 19 Aug 2011
HAL is a multi-disciplinary open accessarchive for the deposit and dissemination of sci-entific research documents, whether they are pub-lished or not. The documents may come fromteaching and research institutions in France orabroad, or from public or private research centers.
L’archive ouverte pluridisciplinaire HAL, estdestinée au dépôt et à la diffusion de documentsscientifiques de niveau recherche, publiés ou non,émanant des établissements d’enseignement et derecherche français ou étrangers, des laboratoirespublics ou privés.
Effects of short-term ecosystem experimental warmingon water-extractable organic matter in an ombrotrophic
Sphagnum peatland (Le Forbonnet, France)Frédéric Delarue, Fatima Laggoun-Défarge, Alexandre Buttler, Sébastien
Gogo, Vincent Jassey, Jean-Robert Disnar
To cite this version:Frédéric Delarue, Fatima Laggoun-Défarge, Alexandre Buttler, Sébastien Gogo, Vincent Jassey, etal.. Effects of short-term ecosystem experimental warming on water-extractable organic matter in anombrotrophic Sphagnum peatland (Le Forbonnet, France). Organic Geochemistry, Elsevier, 2011, 42(9), pp.1016-1024. �10.1016/j.orggeochem.2011.07.005�. �insu-00615432�
Effects of short-term ecosystem experimental warming on water-
extractable organic matter in an ombrotrophic Sphagnum peatland (Le
Forbonnet, France)
Frédéric Delaruea, Fatima Laggoun-Défarge
a*, Alexandre Buttler
b, c, d, Sébastien Gogo
a, e,
Vincent E.J. Jasseyb and Jean-Robert Disnar
a
a Université d‟Orléans, CNRS/INSU - Institut des Sciences de la Terre d‟Orléans UMR 6113.
Campus Géosciences - 1A, rue de la Férollerie, 45071 Orléans cedex 2, France.
b Laboratoire de Chrono-Environnement, UMR CNRS 6249, UFR des Sciences et
Techniques, 16 route de Gray, Université de Franche-Comté, F-25030 Besançon, France.
c Ecole Polytechnique Fédérale de Lausanne EPFL, Ecological Systems Laboratory ECOS,
Station 2, 1015 Lausanne, Switzerland
d Swiss Federal Research Institute WSL, Station 2, 1015 Lausanne, Switzerland
e INRA, Science du Sol UR0272, Centre de recherches d‟Orléans, 2163 avenue de la Pomme
de Pin, CS 40001 Ardon, 45075 Orléans cedex 2, France.
*Corresponding author: Tel.: +33 2 38 49 46 63; fax: +33 2 38 63 64 88
E-mail address: [email protected] (F. Laggoun-Défarge)
Abstract
In a future warmer world, peatlands may change from a carbon sink function to a carbon
source function. This study tracks changes in water-extractable organic matter (WEOM) after
one year of in situ experimental warming using open-top chambers (OTCs). WEOM was
studied in the upper peat layers (0-10 cm) through analysis of water-extractable organic
carbon (WEOC), stable C isotopic composition (δ13
C), specific UV absorbance at 280 nm
and sugar composition of peat cores taken from an open bog (DRY sites) and a transitional
poor fen (WET sites).
At the DRY sites, the impact of OTCs was weak with respect to WEOM parameters,
whereas at the WET sites, the air warming treatment led to a decrease in peat water content,
suggesting that the supply of heat by OTC‟s was used mainly for evapotranspiration. OTCs

at the WET sites also induced a relative enrichment at the surface (0 to 5 cm depth) of
aliphatic and/or aromatic compounds with concomitant decrease of WEOC, as a result of
decomposition. On the contrary, WEOC and sugar contents increased in the deeper peat layer
(7.5–10 cm depth) probably as a result of increased leaching of phenolic compounds by
roots, which then inhibits microbial activities.
The different responses to experimental warming at DRY and WET sites suggest that the
spatial variability of moisture in the peatland is critical for the understanding of the impact of
global warming on the fate of organic matter and the carbon cycle in peatlands.
Key words: carbohydrates; climate change; organic matter; SUVA280 ; OTC; carbon isotope
1. Introduction
Owing to an imbalance between primary production and organic matter (OM) decay,
northern peatlands - which contain about 455 Pg carbon (C) - currently act as an important C
sink (Clymo, 1983; Gorham, 1991). The peatland sink function is mainly due to interactions
of several factors such as water logging, anoxia, acidity and low temperature, which limit OM
decomposition (Moore and Knowles, 1990; Laiho, 2006). Peatlands are predominantly
abundant in continental boreal and sub-boreal regions where a greater temperature increase is
expected over the next century (Immirzi and Maltby, 1992; IPCC, 2007). If environmental
constraints which favour C sequestration change (Davidson and Janssens, 2006), peatlands
may switch from a C sink to a C source function (Oechel et al., 1995; Waddington and
Roulet, 1996).
To determine the response of peatland ecosystems to climate change, in situ warming
experiments are now commonly performed, e.g. with open-top chambers (OTCs). Up to now,
most studies on the impact of OTCs on peatland functioning dealt with changes in plant
communities and primary production (Dorrepaal et al., 2004; Aerts et al., 2006; Sullivan et
al., 2008) or with CO2-CH4 balance (Welker et al., 2004; Chivers et al., 2009; Dorrepaal et al.,
2009). Recently, on the basis of litter bag experiments, Dabros and Fyles (2010) studied the
impact of OTCs on soil OM decomposition including nutrient supply and acidity. In contrast
to the study of Dorrepaal et al. (2009) on C respired, Dabros and Fyles (2010) showed that
higher air temperatures induced by 14 months of OTC treatment (i) reduced the temperature
of the soil as a result of increased evapotranspiration (the paradox of "colder soils in a

warmer world"; Groffmann et al., 2001) and (ii) had no effect on decomposition rates of
Sphagnum and spruce litters.
The biogeochemical processes in early peat OM decomposition still remain poorly
understood and thus constitute a limiting factor in understanding the fate of C pools in
peatlands (Limpens et al., 2008; Zaccone et al., 2008). Furthermore experimental in situ air
warming have more often focused on ecosystem responses such as gas exchanges at the
surface and seldom took into account organic C pools where various reactions to increased
temperature may be expected (Davidson et al., 2000; Kirschbaüm, 2000; Knorr et al., 2005).
Water-extractable OM (WEOM) reflects OM decomposition (Saïd-Pullicino et al., 2007)
and can therefore be a suitable indicator of consequences of experimental warming. WEOM
consists of a heterogeneous mixture of more or less labile organic compounds soluble in water
(Balesdent, 1996; Zsolnay, 2003) provided by both freshly decomposed litter and products of
microbial metabolic activities (Charman, 2002; Zaccone et al., 2009). Within such pools, the
most labile OM has mainly been studied through the analysis of sugars which are considered
as readily degradable constituents used preferentially by microorganisms (Haider, 1992; Volk
et al., 1997). In investigating sugar composition and its link to microbial activity, Medeiros et
al. (2006) showed that some sugars such as mannitol, a polyol or reduced sugar, can also be
seen as indicator of osmotic stress. On the other hand, the less labile OM of the WEOM is
often investigated by way of specific ultra-violet absorbance at 280 nm (SUVA280), which
provides an estimate of aromaticity of the WEOM (Traina et al., 1990; Kalbitz et al. 2003;
Weishaar et al., 2003).
The aim of the present work was to investigate the impact of in situ experimental air
warming on WEOM properties in the upper 10 cm of peat, where most of the labile OM is
decomposed. We hypothesised that peatland warming has detectable consequences on
WEOM properties and that some biogeochemical parameters can be used as early indicators
of changes. We considered the impact of OTCs on the peat temperature recorded at 7 cm
depth. First we used the dry mass/wet mass (DM/WM) ratio and the mannitol content for
assessing environmental conditions related to water table depth and/or soil humidity, and
second we inferred the fate of labile and recalcitrant OM in relation to changes in
decomposition processes, using water-extractable organic carbon (WEOC), isotopic
composition (δ13
C), specific UV absorbance at 280 nm (SUVA280) and sugar composition
(neutral monosaccharides, neutral disaccharides and polyols). The study was performed on
the undisturbed Sphagnum-dominated “Le Forbonnet” peatland in a transitional poor fen site
(„WET‟) and an open bog site („DRY‟).

2. Materials and Methods
2.1. Study site
The study site is an undisturbed ombrotrophic Sphagnum-dominated mire situated in the
Jura Mountains (The Forbonnet peatland, France, 46°49‟35‟‟N, 6°10‟20‟‟E) at an altitude of
840 m a.s.l. The site is characterized by cold winters (on average -1.4°C) and mild summers
(on average 14.6°C). The annual mean temperature measured at the site over a one-year
period from 5th
November 2008 to 30th
November 2009 was 6.5°C, and the annual
precipitations 1200 mm (see also Delarue et al. in press).
Two sites were selected with respect to the functional groups of plants and hence their
hydrology. The first site („WET‟) was a transitional Sphagnum-dominated poor fen, relatively
flat and homogeneous, characterized by a moss cover dominated by Sphagnum fallax and by
the lack of S. magellanicum. Vascular plants such as Eriophorum vaginatum, Vaccinum
oxycoccus and Andromeda polifolia were recorded in very low abundance. Scheuchzeria
palustris and Carex limosa occurred outside of the studied plots. The second site („DRY‟)
was a Sphagnum bog directly adjacent to the fen area. Patterns of hummocks with S.
magellanicum, V. oxycoccos, E. vaginatum and Calluna vulgaris, and hollows with lawns of
S. fallax, Carex rostrata and A. polifolia characterized the sampling area. The terms “WET”
and “DRY” are used to denote the existence of a wetness and trophic gradient inferred from
the vegetation. The vegetation is known to be largely determined by water level (Wheeler and
Proctor 2000; Økland et al., 2001) and the presence and dominance of S. fallax, S.
magellanicum and Eriophorum vaginatum is a good indicator of environmental conditions
along the gradient poor-fen with hollows and lawns, and bog with hummocks (Pedersen,
1975; Gerdol, 1995).
2.2. Experimental design, sampling and WEOM extraction
OTCs are passive warming chambers (Aronson and McNulty, 2009). They were designed
following the International Tundra Experiment (ITEX) to obtain quasi-natural transmittance
of visible wavelengths and to minimize the transmittance of re-radiated infrared wavelengths
(Marion et al., 1997). The hexagonal chambers are made of transparent polycarbonate and are
50cm high, 1.7 m wide at the top and 2.4 m wide at the base. They were raised 10 cm above

the soil surface to allow air to circulate. Six OTCs were installed in May 2008 in the DRY
and the WET sites. At each site, six plots were selected in representative surfaces and then
randomly allocated to treatment. Three plots were equipped with OTCs, while three others
were taken as controls. The plots were named as follows: at the DRY site, plots equipped with
OTCs as DRY-OTC, and control plots as DRY-CTL; the corresponding plots at the WET site
were WET-OTC and WET-CTL. Among the 12 sampling plots, the maximal distance
between the two most distant plots was ca. 30 m. The monitoring of peat temperature started
in November 2008 and of air temperature in July 2009. These two parameters were measured
every 30 minutes at 7 cm depth and 10 cm above the soil surface respectively using
thermocouple probes and datalogger (CR-1000 Campbell).
Peat cores were extracted from each plot in June 2009, after 13 months of experiment. The
twelve cores (13 cm diameter, 25 cm long) were cut into 2.5 cm slices that were sub-sampled
for various analyses. One subsample was dried at 50 °C for one week to measure the dry mass
and the wet mass (DM/WM ratio). Another was directly frozen at -18 °C for WEOM
extraction and associated analyses. It was later split into two parts. For each sub-sample, ca.
3g minced frozen peat were placed in 10 ml ultrapure water and manually homogenized for
WEOM extraction. After 10 min incubation at ambient temperature (20 °C) to defrost the
peat, the water extract (ultrapure water + peat water extract) was filtered through a glass fibre
filter (GF6, Schleicher & Schuell, 1 μm pore size). Filtration was performed under vacuum to
optimize water extraction. Ultrapure water was then added to obtain an aliquot volume of 25
ml. The first water extract was divided into two sub-aliquots: one for WEOC and δ13
C
analyses, and one for the SUVA280, while the second water extract was used for carbohydrate
and polyol analyses (Fig. 1).
2.3. Methods
2.3.1. Water-extractable organic carbon (WEOC) and stable carbon isotopic composition
(δ13
C)
WEOC content and its isotopic composition were determined using liquid-
chromatography-isotope ratio monitoring-mass spectrometry (LC-irMS; Thermo Isolink), in
bulk mode. Prior to analysis, the samples were acidified to pH 1 (Fig. 1) with H3PO4 (85%).
The inorganic C was eliminated by bubbling He through the mixture (ca. 5 min).
Standardisation involved a benzoic standard for WEOC analysis, and pure CO2, IAEA and
USGS simple molecule standards for δ13
C (Albéric et al., 2010).
2.3.2. Specific UV absorbance at 280 nm
Solutions were acidified to pH 6-7 (Fig. 1) following the recommendation of Weishaar et
al. (2003). UV absorbance was measured at 280 nm using a UV spectrophotometer
(Gibson®). SUVA280 was calculated as absorbance divided by WEOC concentration
(Hansson et al., 2010) and expressed as mg C-1
m-1
.
2.3.3. Neutral and reduced sugars analysis
After water extraction (Fig. 1), deoxy-6-glucose (0.4 mg ml-1
in water) was added as
internal standard (Wicks et al., 1991). The sample was evaporated to dryness under vacuum.
The sugars were then dissolved in pyridine containing 1 wt% LiClO4 and left 16 h at 60°C for
anomer equilibration (Bethge et al., 1996), after which they were silylated (Sylon BFT,
Supelco) and analysed using a Perkin–Elmer gas chromatograph fitted with a 25 m × 0.25 mm
i.d. CPSil5CB column (0.25 µm film thickness) and flame ionization detector. The oven
temperature was raised from 60 to 120 °C (held 1 min) at 30 °C min-1
, to 240 °C at 3 °C min-1
and finally to 310 °C (held 10 min) at 20 °C min-1
. The injector split was off before injection
and was turned on after 2 min. The injector was at 240 °C and the detector at 300 °C. A
mixture of nine neutral monosaccharides, neutral disaccharides and polyols (fructose, glucose,
mannose, sucrose, trehalose, arabitol, glycerol, inositol and mannitol) was used as external
standard for compounds identification through peak retention times and for individual
response coefficient determination. Concentrations are expressed in mg g-1
or µg g-1
dry mass.
Replicate analyses gave an analytical precision of 5%.
2.3.4. Statistical analysis
The differences induced by OTC treatment at DRY and WET plots, in terms of air
temperature, peat temperature and biogeochemical parameters were analyzed using the t-test
(Statistica98 ®). Statistical significance was determined at p < 0.05 level. p-values comprised
between 0.05 and 0.10 were considered as indicating a trend (Sullivan et al., 2008).

3. Results
3.1. OTC’s warming effect on air and soil temperatures
By comparison with control plots, at both DRY and WET sites the daily mean air temperature
showed a significant increase in OTCs in July, August and in September (Table 1). At the
DRY site the increase reached 0.8 °C through the period considered, whereas in the WET site
it ranged from 0.7 °C to 1.0°C. The maximum air temperature reached higher values in OTCs,
up to 3.0°C in DRY site and up to 4.5°C in WET site (Table. 1). OTCs had no significant
effect on the minimum temperature (Table 1). The rise in mean temperature can therefore be
considered to be a result of the increase in maximum air temperature.
The mean peat temperature measured at 7 cm depth did not show any significant OTCs effect
in DRY site (Table 1), whereas in WET site it showed a significant effect in March with an
increase of 0.2 °C, which appears to be the result of a significant rise in minimum peat
temperature. No significant differences in minimum peat temperature were observed in DRY
site, whereas in the WET site, the minimum peat temperature was significantly higher in
November, March and April under the effect of the OTCs (Table 1). The maximum peat
temperature showed no significant OTC effect in neither DRY nor WET sites. Daily thermal
amplitudes in the soil (Fig. 2) were higher in OTCs in April, May and June in DRY (but
differences are not significant), whereas the opposite trend appears in WET (differences are
significant at many periods of the year). These findings were confirmed by measurements
carried out during 2010.
3.2. Water-extractable OM properties
3.2.1. Dry matter vs wet matter ratio (DM/WM)
DM/WM ratio varied from 8.9 to 6.6% in the DRY-CTL plots, and from 9.4 to 6.8% in the
DRY OTC ones (Fig. 3A). Given the large standard errors, it was not possible to detect OTC
effect on DM/WM ratios in the DRY situation. In the WET-CTL plots, DM/WM ranged from
8.0 to 5.9%, while it varied from 10.9 to 8.0% in the WET-OTC ones (Fig. 3B). The DM/WM
ratios were higher at all depths for OTCs plots, and this difference with the control plots was
significant at depths 2.5-5 cm and exhibited trends at depths 0-2.5 cm, 5-7.5 cm and 7.5-10
cm.

3.2.2. Water-extractable organic carbon (WEOC)
The WEOC content varied from 10.11 to 3.84 mg g-1
in DRY-CTL and from 10.28 to 3.16
mg g-1
in DRY-OTC (Fig. 3A), but no significant differences were observed between OTC
and control plots. In contrast to the DRY site, in WET site, the WEOC content fell from 15.83
to 1.27 mg g-1
in WET-CTL and from 9.28 to 1.60 mg g-1
in WET-OTC (Fig. 3B). At soil
surface (0 to 2.5 cm), the WEOC content was significantly lower in OTCs compared to
control plots. With depth, WEOC decreased and the difference between OTCs and controls
was still significant at 2.5-5 cm and again at 7.5-10 cm (Fig. 3B).
3.2.3. Isotopic composition (δ13
C)
The δ13
C values, ranging between -27.05 and -27.88‰ for DRY-CTL and between -27.05
and -27.83‰ for DRY-OTC, with rather large standard errors, do not evidence any significant
difference when compared with OTCs and controls in DRY site (Fig. 3A). At the WET site,
the δ13
C values, ranging from -26.47 to -27.83‰ in WET-CTL and from -27.23 to -27.73‰
in WET-OTC, do not differ significantly neither (Fig. 3B), although some trends are
detectable. At the surface peat (0-2.5 cm) and at depth 2.5-5 cm, the trends (with p-values of
0.08 and 0.05 respectively) indicated lower isotopic signatures in OTCs as compared to
control plots, whereas the trend was reversed at depth 7.5-10 cm (p-value = 0.09).
3.2.4. Specific UV absorbance at 280 nm (SUVA280)
The SUVA280 index tended to increase with depth, with no significant differences between
OTCs and control plots at neither DRY or WET sites (Fig. 3). Values ranged from 2.32 to
1.21 mg C l-1
m-1
in DRY-CTL and from 2.48 to 1.47 mg C l-1
m-1
in DRY-OTC. In the WET
site, SUVA280 varied from 3.46 to 0.73 mg C l-1
m-1
in WET-CTL and from 3.52 to 1.06 mg C
l-1
m-1
in WET-OTC. SUVA280 showed a trend between OTCs and control plots only at 2.5-5
cm depth (p-value = 0.07), with higher values in OTC treatment.
3.2.5. Neutral monosaccharides, disaccharides and polyols
Three types of sugars were identified in the WEOM: neutral monosaccharides, neutral
disaccharides and polyols also termed reduced sugars (Table 2). The mannitol content was

221 and 344 mg g-1
, respectively at 2.5-5 cm and 5-7.5 cm depth in DRY-CTL, and only 88
and 81 mg g-1
in DRY-OTC at the same depths. Thus, in the DRY site, the OTCs induced a
significant decrease in the mannitol content at these two depths. In the WET site, the
mannitol content tended to increase in OTCs at 7.5-10 cm depth, (51 mg g-1
in WET-CTL vs.
198 mg g-1
in WET-OTC), whereas it tended to decrease in OTCs for fructose at 5-7.5 cm
depth. In the WET site, glucose, mannose, glycerol and inositol contents exhibited also
significant differences induced by OTCs but only at specific depths (Table 2). At 0-2.5 cm
depth, the glycerol content was significantly lower in OTCs (169 µg g-1
in WET-CTL and 105
µg g-1
in WET-OTC). Inositol showed a significantly lower yield in OTCs at 5-7.5 cm depth
(139 mg g-1
in WET-CTL and 12 mg g-1
in WET-OTC). At 7.5-10 cm depth, the glucose
content was significantly higher in OTCs (0.42 mg g-1
in WET-CTL and 0.97 mg g-1
in WET-
OTC). Mannose content showed the same significant pattern as glucose (3 mg g-1
in WET-
CTL and 20 mg g-1
in WET-OTC). Fructose, glucose, mannose and glycerol all showed a
clear decrease with depth.
4. Discussion
4.1. Impact of OTCs is different in DRY and WET sites
From July to September 2009, the mean air temperature increased by 0.7 to 1° C in the
OTC plots as compared to control plots (Table 1). Subsequent measures showed that this
warming also happened in 2010. Based on this significant effect (p<0.001) and considering
results from many other studies on the impact of OTCs on mean air temperature (e.g., Marion
et al., 1997; Hollister and Webber, 2000; Dorrepaal et al. 2004; Sullivan et al., 2008), it seems
reasonable to assume that OTCs are likely to have increased the air temperature at the OTC
sites also before core sampling, despite the lack of full data coverage for air temperature
between the start of the experiment (May 2008) and the soil sampling date (June 2009).
In general, the effect of OTCs on the peat temperature amplitude, comparatively to
controls, was more often significant during winter, with identical patterns in DRY and WET
sites. In both cases, the mean amplitude was significantly lower in OTCs than in control plots,
suggesting a loss of sensitivity to environmental temperature variation. As heat diffuses faster
in water than in air (Rosenberg et al., 1983; Hollister, 1998), the lower temperature amplitude
in peat under OTC treatment can be interpreted as the consequence of a decrease in thermal
conductivity in relation to soil humidity in both DRY and WET sites, at least in winter. For

Dabros and Fyles (2010), the decrease in thermal conductivity (i) resulted from an increase in
evapotranspiration and (ii) led to a decrease in average temperature. Our data do not allow us
to draw such conclusions on the time scale considered. The mean and minimum temperatures
in the WET sites were higher and significant under OTCs as compared to control plots only in
November 2008 and March and April 2009 (Table 1). For the DRY sites, there was no
evidence to support such a pattern and data tend to indicate, on the contrary, colder soils. This
difference could be explained by the water level variations and/or soil humidity, and their
interaction with air temperature at the boundary layer. Because of the lack of continuous
measurements of humidity in air and peat, as recommended by Aerts et al. (2006) and
Aronson and McNulty (2009), it was not possible to directly assign the consumption of heat
by evapotranspiration. Overall, significant differences mainly appeared during winter,
probably as a result of the low temperature range, which entailed a decrease in variance and
thus facilitated the appearance of significant differences. During early summer time, the daily
thermal amplitude (Fig. 2) indicated that in DRY sites, the temperature reached higher and
lower extremes, with a tendency for OTC sites to have a higher mean temperature, whereas
the contrary occurred in WET sites.
This study highlights certain difficulties using OTCs or at least for the measurement of
their effect, particularly on soil temperature. It also demonstrates the need for measuring
concomitantly air and soil moisture. Furthermore, in contrast to various other studies
(Dorrepaal et al., 2004; Sullivan et al., 2008) in which soil temperature was determined at 5
cm depth, we did the measurements at 7 cm depth, which maybe makes it more difficult to
detect induced warming. In general soil temperature is typically measured at one depth and
does not take into account the phenomenon of thermal diffusion and its interactions with the
"architecture" of the peat, i.e. density, which controls heat exchange and evapotranspiration
(Tsuboya et al., 2001; Admiral and Lafleur, 2007). It thus appears that understanding the
response of peatlands to higher air temperatures requires a thermodynamic approach
combined with a better characterization of the vertical variability of physical parameters
affecting thermal diffusion. Such an approach may also facilitate the understanding of the
high environmental spatial variability in peatlands, as suggested by the weaker responses and
the greater standard errors in DRY site as compared to WET site.
4.2. OTC-induced warming affects the dynamics of water-extractable organic
matter

Since WEOM is an organic fraction extracted from wet peat using soft conditions and
consists of available OM pools (Zaccone et al., 2009), it can be a suitable substrate to infer in
situ OM dynamics, particularly under the short term effects of climate change as simulated by
OTCs (13 months as for our study).
Moreover, the DM/WM ratio is likely to give straightforward information on changes in
humidity and/or water table level, and is also linked to the type of bulk OM in relation to the
growing vegetation. At the DRY site, this ratio did not discriminate the specific effect of
OTCs (Fig. 3), but it did in the WET site resulting in higher dry matter content under OTCs.
Therefore, although in situ continuous measurements of peat humidity were missing, we can
assume that higher air temperature created by the OTC treatment at the WET sites resulted in
higher evapotranspiration and thus drier soils in OTCs in comparison to control sites.
Similarly, mannitol as well as the non-reducing disaccharide trehalose are considered as
osmolytes that can accumulate in microbial and plant cells in response to osmotic stress such
as reduction in moisture or increase in temperature (Bohnert et al., 1995; Chaturvedi et al.,
1997; Waisley, 2004, Medeiros et al., 2006). Under OTCs of the DRY site, mannitol had
lower concentration in the rooting zone (2.5-7.5 cm depth) and this could indicate a decrease
in osmotic stress. This decrease did not correspond to a significant change in the water
content of peat in the DRY site (Table 2; Fig. 3). Conversely, mannitol in the WET site,
particularly at 7.5-10 cm depth, exhibited greater content under OTCs. Combined with the
higher DM/WM ratio, this underlines a possible higher osmotic stress and indicates also a
likely decrease of groundwater level or more probably of soil moisture under the effect of
OTCs (Table 2; Fig. 3).
Unlike at the WET site, at the DRY site, except for mannitol contents, no significant
changes in the WEOM parameters have been recorded between OTCs and control sites,
indicating that 13 months of incubation by OTCs did not affect the WEOM dynamics.
Therefore, the following discussion only focuses on the WET site.
At 0-5 cm depth at the WET site, the effect of OTCs resulted in a significant decrease of
WEOC and glycerol (Table 2; Fig. 3), which could correspond to changes in the early
decomposition of the peat, i.e. senescence (Thormann et al., 2007) or a change of plant
composition and thus of the quality of new OM inputs. Vegetation surveys including vascular
plants and mosses, using quantitative frequency measurements (Buttler, 1992) and their
analysis with Redundancy analysis (RDA) showed that the site effect (DRY vs WET) was
highly significant (p < 0.001) on vegetation communities in the two consecutive years 2008
and 2009, but that the OTC effect did not yet induce significant changes at community level
(p = 0.97 and 0.77 for respectively 2008 and 2009). Consequently, the changes in WEOM
properties cannot be assigned to a shift in vegetation composition and to consecutive changes
in fresh OM inputs, but would rather be attributable to changes in senescence processes
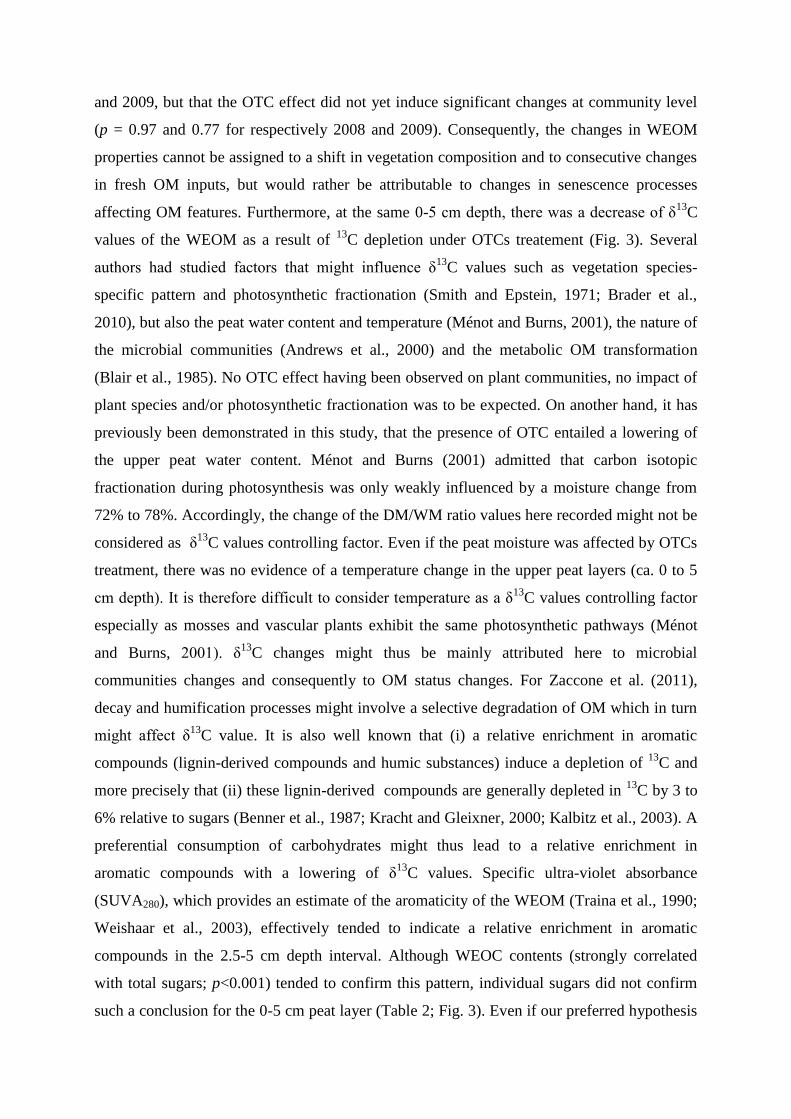
affecting OM features. Furthermore, at the same 0-5 cm depth, there was a decrease of δ13
C
values of the WEOM as a result of 13
C depletion under OTCs treatement (Fig. 3). Several
authors had studied factors that might influence δ13
C values such as vegetation species-
specific pattern and photosynthetic fractionation (Smith and Epstein, 1971; Brader et al.,
2010), but also the peat water content and temperature (Ménot and Burns, 2001), the nature of
the microbial communities (Andrews et al., 2000) and the metabolic OM transformation
(Blair et al., 1985). No OTC effect having been observed on plant communities, no impact of
plant species and/or photosynthetic fractionation was to be expected. On another hand, it has
previously been demonstrated in this study, that the presence of OTC entailed a lowering of
the upper peat water content. Ménot and Burns (2001) admitted that carbon isotopic
fractionation during photosynthesis was only weakly influenced by a moisture change from
72% to 78%. Accordingly, the change of the DM/WM ratio values here recorded might not be
considered as δ13
C values controlling factor. Even if the peat moisture was affected by OTCs
treatment, there was no evidence of a temperature change in the upper peat layers (ca. 0 to 5
cm depth). It is therefore difficult to consider temperature as a δ13
C values controlling factor
especially as mosses and vascular plants exhibit the same photosynthetic pathways (Ménot
and Burns, 2001). δ13
C changes might thus be mainly attributed here to microbial
communities changes and consequently to OM status changes. For Zaccone et al. (2011),
decay and humification processes might involve a selective degradation of OM which in turn
might affect δ13
C value. It is also well known that (i) a relative enrichment in aromatic
compounds (lignin-derived compounds and humic substances) induce a depletion of 13
C and
more precisely that (ii) these lignin-derived compounds are generally depleted in 13
C by 3 to
6% relative to sugars (Benner et al., 1987; Kracht and Gleixner, 2000; Kalbitz et al., 2003). A
preferential consumption of carbohydrates might thus lead to a relative enrichment in
aromatic compounds with a lowering of δ13
C values. Specific ultra-violet absorbance
(SUVA280), which provides an estimate of the aromaticity of the WEOM (Traina et al., 1990;
Weishaar et al., 2003), effectively tended to indicate a relative enrichment in aromatic
compounds in the 2.5-5 cm depth interval. Although WEOC contents (strongly correlated
with total sugars; p<0.001) tended to confirm this pattern, individual sugars did not confirm
such a conclusion for the 0-5 cm peat layer (Table 2; Fig. 3). Even if our preferred hypothesis

is a stimulated WEOM decomposition in the upper peat layers under the effect of OTCs, we
could not exclude an associated increase of humic substances. At 5-7.5 cm depth, sugars such
as fructose and inositol showed significantly lower contents under OTCs as compared to
control plots, while WEOC, SUVA280 and δ13
C were not affected by OTC treatment (Fig. 3).
In contrast to the soil surface, at 7.5-10 cm depth, the effect of OTCs resulted in an
enrichment of δ13
C, a slight but significant increase of WEOC, and an increase of sugar
contents (Table 2; Fig. 3). Albeit the composition of the surface vegetation did not change, we
cannot exclude belowground changes such as an increase of root exudates (e.g. phenolic
compounds) by vascular plants, i.e. Eriophorum vaginatum. Such changes would be
congruent with changes of δ13
C, WEOC and sugars, and this would highlight a relative good
preservation of labile dissolved OM and carbohydrates at this depth. Such preservation could
be enhanced by the release of phenolic compounds, which can block enzymatic activities,
allowing the most labile OM, i.e. fructose, glucose, mannose and inositol to be accumulated.
It has been shown that phenolics produced by Sphagnum have a potential inhibitor effect on
fungal and bacterial breakdown activity and/or on enzymes implied in OM decomposition
(Wetzel, 1992; Fenner et al., 2005; Opelt et al., 2007; Mellegard et al., 2009).
5. Conclusion
This study highlights some difficulties in predicting peatland OM response to a rise in air
temperature:
It appears that peat temperature alone is not sufficient for characterizing the impact of
OTCs on environmental conditions. There is a need for continuous measurements of humidity
at the soil surface and in peat for understanding thermal diffusion at air-soil interface and
towards depth;
The differences in warming responses between DRY and WET sites indicate that
spatial variability is a key component in understanding the fate of peatland C in a perspective
of global warming;
Our results, which cover a 1 yr simulated warming and thus only reflect a single
season, must be extrapolated with caution. Even if the plant assemblage did not show
significant changes during such a short duration, below ground changes such as a shift in root
biomass and/or exudates cannot be excluded.
Despite the short duration of the OTC manipulative warming, WEOM shows, at the WET
site, (i) a relative enrichment of aliphatic and/or aromatic compounds due to the increased

consumption of WEOC in the upper peat layers and (ii) an accumulation of WEOC and
sugars in the deeper layers, probably as an effect of increased phenolic compounds leached by
roots. Beyond these patterns our work shows that WEOM, in some moisture conditions, is an
efficient indicator for understanding early decay processes and the fate of OM.
Acknowledgments
This work was funded as part of the PEATWARM initiative through an ANR (French
National Agency for Research) grant (ANR-07-VUL-010). The authors are indebted to the
Regional Scientific Council of Natural Heritage of the Franche-Comté Region for access to
Le Forbonnet site. They would like to thank M.-L. Toussaint for temperature monitoring, N
Lottier for analytical assistance and E Rowley-Jolivet and B. Corboz for revision of the
English version. They also are grateful to the two anonymous referees for their constructive
comments.

References
Admiral, S.W., Lafleur, P.M., 2007. Modelling of latent heat partitioning at a bog peatland.
Agricultural and Forest Meteorology 144, 213-229.
Aerts, R., Cornelissen, J.H.C., Dorrepaal, E., 2006. Plant performance in a warmer world:
General responses of plants from cold, northern biomes and the importance of winter and
spring events. Plant Ecology 182, 65-77.
Albéric, P., Gautret, P., Juchelka, D., 2010. irm-LC/MS: δ13
C Analysis of Dissolved Organic
Matter in Natural Waters. Thermo Fisher Scientific Application Note: 30198.
Andrews, J.A., Matamala, R., Westover, K.M., Schlesinger, W.H., 2000. Temperature effects
on the diversity of soil heterotrophs and the delta C-13 of soil-respired CO2. Soil Biology
& Biochemistry 32, 699-706.
Aronson, E.L., McNulty, S.G., 2009. Appropriate experimental ecosystem warming methods
by ecosystem, objective, and practicality. Agricultural and Forest Meteorology 149, 1791-
1799.
Balesdent, J., 1996. The significance of organic separates to carbon dynamics and its
modelling in some cultivated soils. European Journal of Soil Science 47, 485-493.
Benner, R., Fogel, M.L., Sprague, E.K., Hodson, R.E., 1987. Depletion of 13C in lignin and
its implications for stable carbon isotope studies. Nature 329, 708-710.
Bethge, P.O., Holmström, C., Juhlin, S., 1996. Quantitative gas chromatography of mixtures
of simple sugars. Svensk Papperstidning 69, 60-63.
Blair, N., Leu, A., Munoz, E., Olsen, J., Kwong, E., Des Marais, D., 1985. Carbon isotopic
fractionation in heterotrophic microbial metabolism. Applied and Environmental
Microbiology 50, 996–1001.
Bohnert, H.J., Nelson, D.E., Jensen, R.G., 1995. Adaptations to environmental stresses. Plant
Cell 7, 1099-1111.
Brader, A.V., van Winden, J.F., Bohncke, S.J.P., Beets, C.J., Reichart, J.-G., de Leeuw, J.W.,
2010. Fractionation of hydrogen, oxygen and carbon isotopes in n-alkanes and cellulose of
three Sphagnum species. Org. Geochem. 41, 1277–1284.
Buttler, A., 1992. Permanent plot research in wet meadows and cutting experiment. Vegetatio
103, 113-124.
Charman, D., 2002. Peatlands and Environmental Change, John Wiley and Sons, West
Sussex, England, Chichester
Chaturvedi, V., Bartiss, A., Wong, B., 1997. Expression of bacterial mtlD in Saccharomyces
cerevisiae results in mannitol synthesis and protects a glycerol-defective mutant from high-
salt and oxidative stress. Journal of Bacteriology 179, 157-162.
Chivers, M.R., Turetsky, M.R., Waddington, J.M., Harden, J.W., McGuire, A.D., 2009.
Effects of experimental water table and temperature manipulations on ecosystem CO2
fluxes in an Alaskan rich fen. Ecosystems 12, 1329-1342.
Clymo, R.S., 1983. Peat. In: Gore, A.J.P. (Ed),. Ecosystems of the World, 4A. Mires: Swamp,
Bog, Fen and Moor, General Studies. Elsevier, Amsterdam, pp. 159-224.
Dabros, A., Fyles, J.W., 2010. Effects of open-top chambers and substrate type on
biogeochemical processes at disturbed boreal forest sites in northwestern Quebec. Plant
and Soil 327, 465-479.
Davidson, E.A., Janssens, I.A., 2006. Temperature sensitivity of soil carbon decomposition
and feedbacks to climate change. Nature 440, 165-173.
Davidson, E.A., Trumbore, S.E., Amundson, R., 2000. Biogeochemistry - Soil warming and
organic carbon content. Nature 408, 789-790.
Delarue, F., Laggoun-Défarge, F., Disnar, J.R., Lottier, N., Gogo, S., in press. Organic matter
sources and decay assessment in a Sphagnum-dominated peatland (Le Forbonnet, Jura
Mountains, France): impact of moisture conditions. Biogeochemistry, doi:10.1007/s10533-
010-9410-0.
Dorrepaal, E., Aerts, R., Cornelissen, J.H.C., Callaghan, T.V., van Logtestijn, R.S.P., 2004.
Summer warming and increased winter snow cover affect Sphagnum fuscum growth,
structure and production in a sub-arctic bog. Global Change Biology 10, 93-104.
Dorrepaal, E., Toet, S., van Logtestijn, R.S.P., Swart, E., van de Weg, M.J., Callaghan, T.V.,
Aerts, R., 2009. Carbon respiration from subsurface peat accelerated by climate warming
in the subarctic. Nature 460, 616-U79.
Fenner, N., Freeman, C., Reynolds, B., 2005. Hydrological effects on the diversity of
phenolic degrading bacteria in a peatland: implications for carbon cycling. Soil Biology &
Biochemistry 37, 1277-1287.
Gerdol, R., 1995. The growth dynamics of sphagnum based on field-measurements in a
temperate bog and on laboratory cultures. Journal of Ecology 83, 431-437.
Gorham, E., 1991. Northern peatlands – role in the carbon-cycle and probable responses to
climatic warming. Ecological Applications 1, 182-195.

Groffman, P.M., Driscoll, C.T., Fahey, T.J., Hardy, J.P., Fitzhugh, R.D., Tierney, G.L., 2001.
Colder soils in a warmer world: A snow manipulation study in a northern hardwood forest
ecosystem. Biogeochemistry 56, 135-150.
Haider, K., 1992. Problems related to humification processes in soils of the temperate climate.
In: Stotzky, G., Bollag, J.M. (Eds.), Soil Biochemistry, vol. 7. Marcel Dekker, New York,
pp. 55- 94.
Hansson, K., Kleja, D.B., Kalbitz, K., Larsson, H., 2010. Amounts of carbon mineralised and
leached as DOC during decomposition of Norway spruce needles and fine roots. Soil
Biology & Biochemistry 42, 178-185.
Hollister, R.D., 1998. Response of wet meadow tundra to interannual and manipulated
temperature variation: implications for climate change research. MSc thesis, Michigan
State University.
Hollister, R.D., Webber, P.J., 2000. Biotic validation of small open-top chambers in a tundra
ecosystem. Global Change Biology 6, 835-842.
Immirzi, C.P., Maltby, E., 1992. The global status of peatlands and their role in the carbon
cycle. Wetlands Ecosystems Research Group, Report 11.
I.P.C.C., (Intergovernmental Panel on Climate Change) 2007. Climate Change 2007: The
Physical Science Basis. Cambridge University Press
Kalbitz, K., Schwesig, D., Schmerwitz, J., Kaiser, K., Haumaier, L., Glaser, B., Ellerbrock,
R., Leinweber, P., 2003. Changes in properties of soil-derived dissolved organic matter
induced by biodegradation. Soil Biology & Biochemistry 35, 1129-1142.
Kracht, O., Gleixner, G., 2000. Isotope analysis of pyrolysis products from Sphagnum peat
and dissolved organic matter from bog water. Org. Geochem. 31, 645-654.
Kirschbaum, M.U.F., 2000. Will changes in soil organic carbon act as a positive or negative
feedback on global warming? Biogeochemistry 48, 21-51.
Knorr, W., Prentice, I.C., House, J.I., Holland, E.A., 2005. Long-term sensitivity of soil
carbon turnover to warming. Nature 433, 298-301.
Laiho, R., 2006. Decomposition in peatlands: Reconciling seemingly contrasting results on
the impacts of lowered water levels. Soil Biology & Biochemistry 38, 2011-2024.
Limpens, J., Berendse, F., Blodau, C., Canadell, J.G., Freeman, C., Holden, J., Roulet, N.,
Rydin, H., Schaepman-Strub, G., 2008. Peatlands and the carbon cycle: from local
processes to global implications - a synthesis. Biogeosciences 5, 1475-1491.
Marion, G.M., Henry, G.H.R., Freckman, D.W., Johnstone, J., Jones, G., Jones, M.H.,
Levesque, E., Molau, U., Mølgaard, P., Parsons, A.N., Svoboda, J., Virginia, R.A., 1997.

Open-top designs for manipulating field temperature in high-latitude ecosystems. Global
Change Biology 3, 20–32.
Medeiros, P.M., Fernandes, M.F., Dick, R.P., Simoneit, B.R.T., 2006. Seasonal variations in
sugar contents and microbial community in a ryegrass soil. Chemosphere, 65(5), 832-839.
Mellegard, H., Stalheim, T., Hormazabal, V., Granum, P.E., Hardy, S.P., 2009. Antibacterial
activity of sphagnum acid and other phenolic compounds found in Sphagnum papillosum
against food-borne bacteria. Letters in Applied Microbiology 49, 85-90.
Ménot, G., Burns, S.J., 2001. Carbon isotopes in ombrogenic peat bog plants as climatic
indicators: calibration from an altitudinal transect in Switzerland. Org. Geochem. 32, 233–
245.
Moore, T.R., Knowles, R., 1990. Methane emissions from fen, bog and swamp peatlands in
Quebec. Biogeochemistry 11, 45-61.
Oechel, W.C., Vourlitis, G.L., Hastings, S.J., Bochkarev, S.A., 1995. Change in Arctic CO2
flux over 2 decades – effects of climate-change at Barrow, Alaska. Ecological Applications
5, 846-855.
Okland, R.H., Okland, T., Rydgren, K., 2001. A Scandinavian perspective on ecological
gradients in north-west European mires: reply to Wheeler and Proctor. Journal of Ecology
89, 481-486.
Opelt, K., Chobot, V., Hadacek, F., Schonmann, S., Eberl, L., Berg, G., 2007. Investigations
of the structure and function of bacterial communities associated with Sphagnum mosses.
Environmental Microbiology 9, 2795-2809.
Pedersen, A., 1975. Growth measurements of five Sphagnum species in south Norway.
Norwegian Journal of Botany 22, 277-284.
Rosenberg, N.J., Blad, B.L., Verma, S.B., 1983. Microclimate; The Biological Environment.
Wiley, New York.
Said-Pullicino, D., Kaiser, K., Guggenberger, G., Gigliotti, G., 2007. Changes in the chemical
composition of water-extractable organic matter during composting: Distribution between
stable and labile organic matter pools. Chemosphere 66, 2166-2176.
Smith, B.N., Epstein, S., 1971. Two categories of 13
C/12
C ratios for higher plants. Plant
Physiol. 47, 380–384.
Sullivan, P.F., Arens, S.J.T., Chimner, R.A., Welker, J.M., 2008. Temperature and
microtopography interact to control carbon cycling in a high arctic fen. Ecosystems 11, 61-
76.

Thormann, M.N., Rice, A.V., Beilman, D.W., 2007. Yeasts in peatlands: A review of richness
and roles in peat decomposition. Wetlands 27, 761-772.
Traina, S.J., Novak, J., Smeck, N.E., 1990. An ultraviolet absorbance method of estimating
the percent aromatic carbon content of humic acids. Journal of Environmental Quality 19,
151-153.
Tsuboya, T., Takagi, K., Takahashi, H., Kurashige, Y., Tase, N., 2001. Effect of pore
structure on redistribution of subsurface water in Sarobetsu Mire, northern Japan. Journal
of Hydrology 252, 100-115.
Volk, C.J., Volk, C.B., Kaplan, L.A., 1997. Chemical composition of biodegradable dissolved
organic matter in streamwater. Limnology and Oceanography 42, 39-44.
Waddington, J.M., Roulet, N.T., 1996. Atmosphere-wetland carbon exchanges: Scale
dependency of CO2 and CH4 exchange on the developmental topography of a peatland.
Global Biogeochemical Cycles 10, 233-245.
Wasley, J., 2004. The effect of climate change on Antarctic terrestrial flora. PhD thesis,
School of Biological Sciences, University of Wollongong.
Weishaar, J.L., Aiken, G.R., Bergamaschi, B.A., Fram, M.S., Fujii, R., Mopper, K., 2003.
Evaluation of specific ultraviolet absorbance as an indicator of the chemical composition
and reactivity of dissolved organic carbon. Environmental Science & Technology 37,
4702-4708.
Welker, J.M., Fahnestock, J.T., Henry, G.H.R., O'Dea, K.W., Chimner, R.A., 2004. CO2
exchange in three Canadian High Arctic ecosystems: response to long-term experimental
warming. Global Change Biology 10, 1981-1995.
Wetzel, R.G., 1992. Gradient-dominated ecosystems - sources and regulatory functions of
dissolved organic-matter in fresh-water ecosystems. Hydrobiologia 229, 181-198.
Wheeler, B.D., Proctor, M.C.F., 2000. Ecological gradients, subdivisions and terminology of
north-west European mires. Journal of Ecology 88, 187-203.
Wicks, R.J., Moran, M.A., Pittman, L.J., Hodson, R.E., 1991. Carbohydrate signatures of
aquatic macrophytes and their dissolved degradation products as determined by a sensitive
high-performance ion chromatography method. Applied and Environmental Microbiology
57, 3135-3143.
Zaccone, C., Casiello, G., Longobardi, F., Bragazza, L., Sacco, A., Miano, T.M., 2011.
Evaluating the „conservative‟ behavior of stable isotopic ratios (δ13
C, δ15
N, and δ18
O) in
humic acids and their reliability as paleoenvironmental proxies along a peat sequence

Zaccone, C., D'Orazio, V., Shotyk, W., Miano, T.M., 2009. Chemical and spectroscopic
investigation of porewater and aqueous extracts of corresponding peat samples throughout
a bog core (Jura Mountains, Switzerland). Journal of Soils and Sediments 9, 443-456.
Zaccone, C., Said-Pullicino, D., Gigliotti, G., Miano, T.M., 2008. Diagenetic trends in the
phenolic constituents of Sphagnum-dominated peat and its corresponding humic acid
fraction. Organic Geochemistry 39, 830-838.
Zsolnay, A., 2003. Dissolved organic matter: artefacts, definitions, and functions. Geoderma
113, 187-2.

Table 1 Effects of OTCs on temperatures of air (10 cm above soil surface) and peat (at -7 cm
depth) during a 3-months period (July to September 2009) for air temperature and during a 8-
months period (November 2008 to June 2009) for soil temperatures in DRY and WET sitesa.
Table 2 Effect of OTCs on neutral monosaccharides (fructose, glucose and mannose), neutral
disaccharides (sucrose and trehalose) and polyol contents (mg g-1
or µg g-1
) in the surface peat
(0-10 cm) of the OTC plots and control (CTL) plots in DRY and WET sites Significant
differences between OTCs and controls are indicated by p-values in bold (n = 3).
Fig. 1. Sampling strategy and flowchart for sample treatment and analysis
Fig. 2. Daily thermal amplitudes (°C) of peat (at -7 cm depth) in the control plots (empty
symbols) and the OTC plots (black symbols) in both DRY (A) and WET (B) sites. Significant
differences between OTCs and controls are indicated (* p <0.05 ; **p < 0.01 ; n = 3).
Fig. 3. Effect of OTCs on dry matter – wet matter (DM/WM) ratio, water-extractable organic
carbon (WEOC content - mg g-1
), isotopic C signature (δ13
C - ‰) and specific ultra-violet
absorbance at 280 nm (SUVA280 - l mg C-1
m-1
) in surface peat (0-10 cm) of the OTC (black
symbols) and control (empty symbols) plots from DRY (A) and WET (B) sites. Mean values
and standard errors are given. Significant differences between OTCs and controls are
indicated (* p <0.05 ; **p < 0.01 ; n = 3).