Advancing the SEEA Experimental Ecosystem...
32
System of Environmental-Economic Accounting Advancing the SEEA Experimental Ecosystem Accounting Ecosystem Service Measurement and Modelling Advancing the SEEA-EEA Project
Transcript of Advancing the SEEA Experimental Ecosystem...
System of Environmental-Economic Accounting
Advancing the SEEA
Experimental Ecosystem Accounting
Ecosystem Service Measurement and
Modelling
Advancing the SEEA-EEA Project
System of Environmental-Economic Accounting
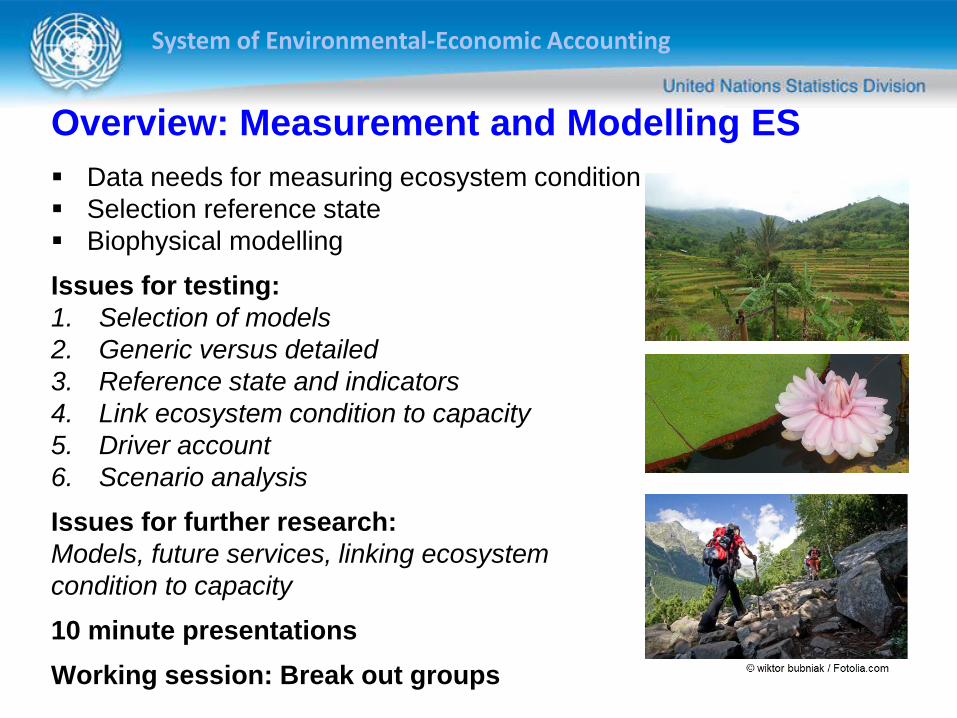
Overview: Measurement and Modelling ES
Data needs for measuring ecosystem condition
Selection reference state
Biophysical modelling
Issues for testing:
1. Selection of models
2. Generic versus detailed
3. Reference state and indicators
4. Link ecosystem condition to capacity
5. Driver account
6. Scenario analysis
Issues for further research:
Models, future services, linking ecosystem
condition to capacity
10 minute presentations
Working session: Break out groups
System of Environmental-Economic Accounting
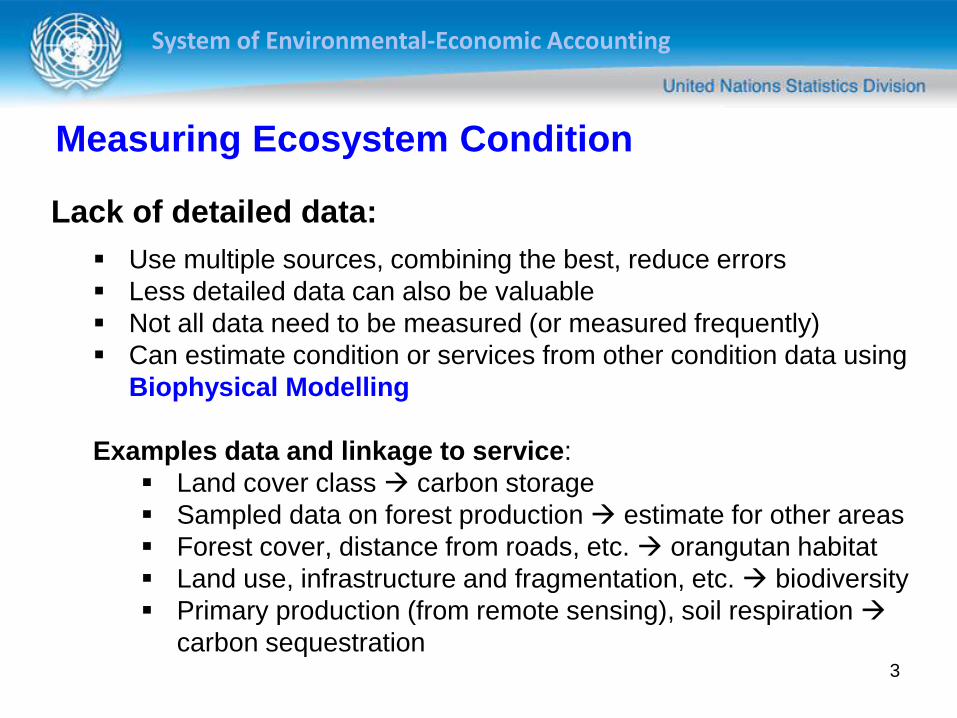
Lack of detailed data:
Use multiple sources, combining the best, reduce errors
Less detailed data can also be valuable
Not all data need to be measured (or measured frequently)
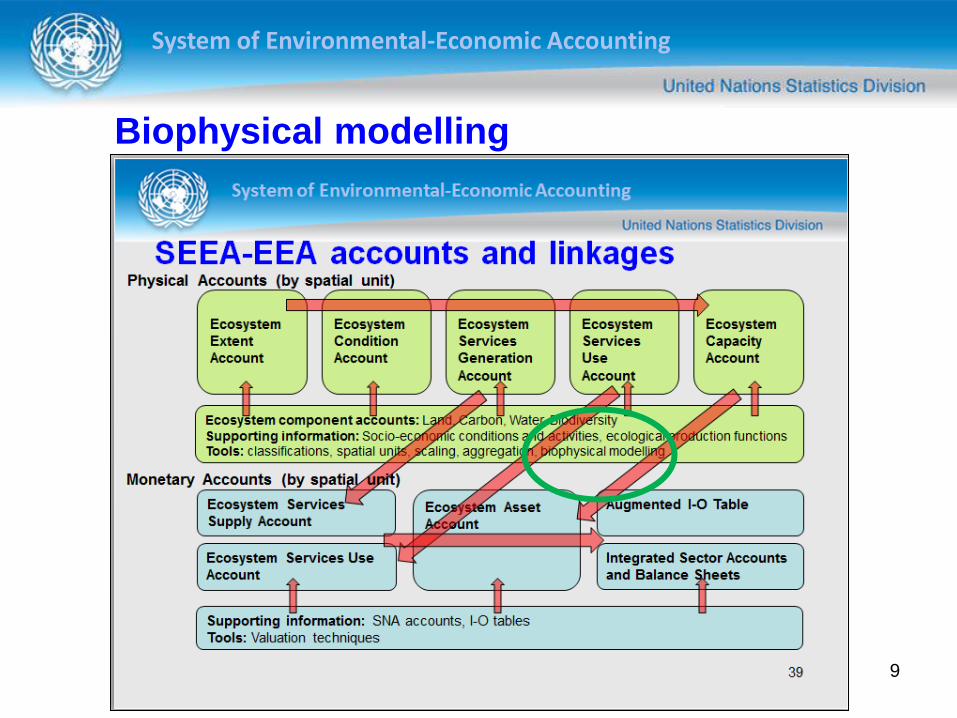
Can estimate condition or services from other condition data using
Biophysical Modelling
Examples data and linkage to service:
Land cover class carbon storage
Sampled data on forest production estimate for other areas
Forest cover, distance from roads, etc. orangutan habitat
Land use, infrastructure and fragmentation, etc. biodiversity
Primary production (from remote sensing), soil respiration
carbon sequestration
3
Measuring Ecosystem Condition
System of Environmental-Economic Accounting
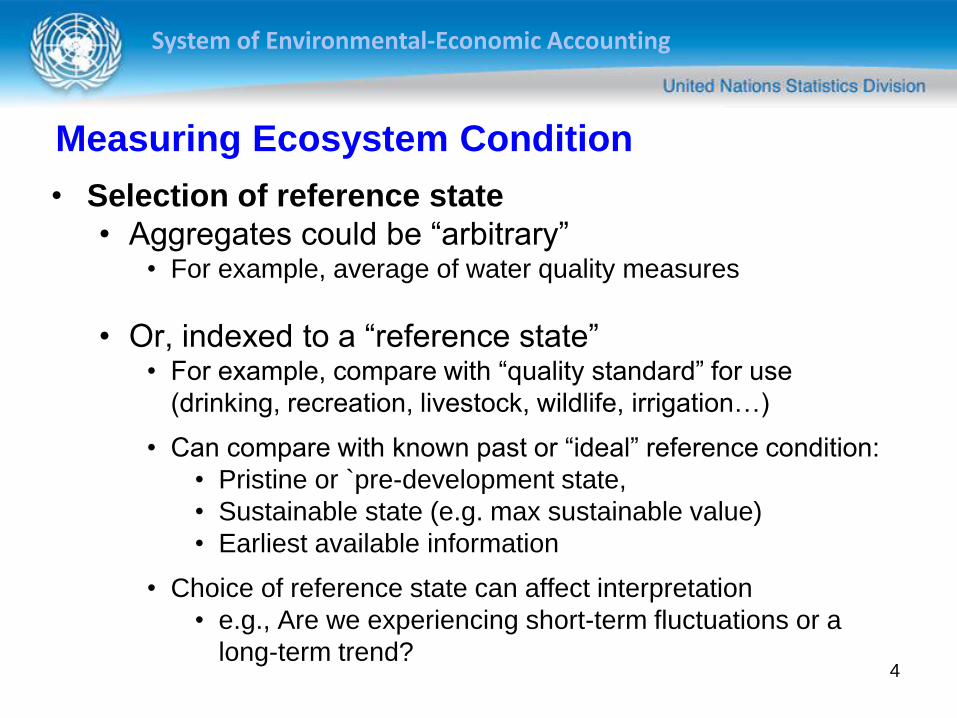
• Selection of reference state
• Aggregates could be “arbitrary” • For example, average of water quality measures
• Or, indexed to a “reference state” • For example, compare with “quality standard” for use
(drinking, recreation, livestock, wildlife, irrigation…)
• Can compare with known past or “ideal” reference condition:
• Pristine or `pre-development state,
• Sustainable state (e.g. max sustainable value)
• Earliest available information
• Choice of reference state can affect interpretation
• e.g., Are we experiencing short-term fluctuations or a
long-term trend?
4
Measuring Ecosystem Condition
System of Environmental-Economic Accounting
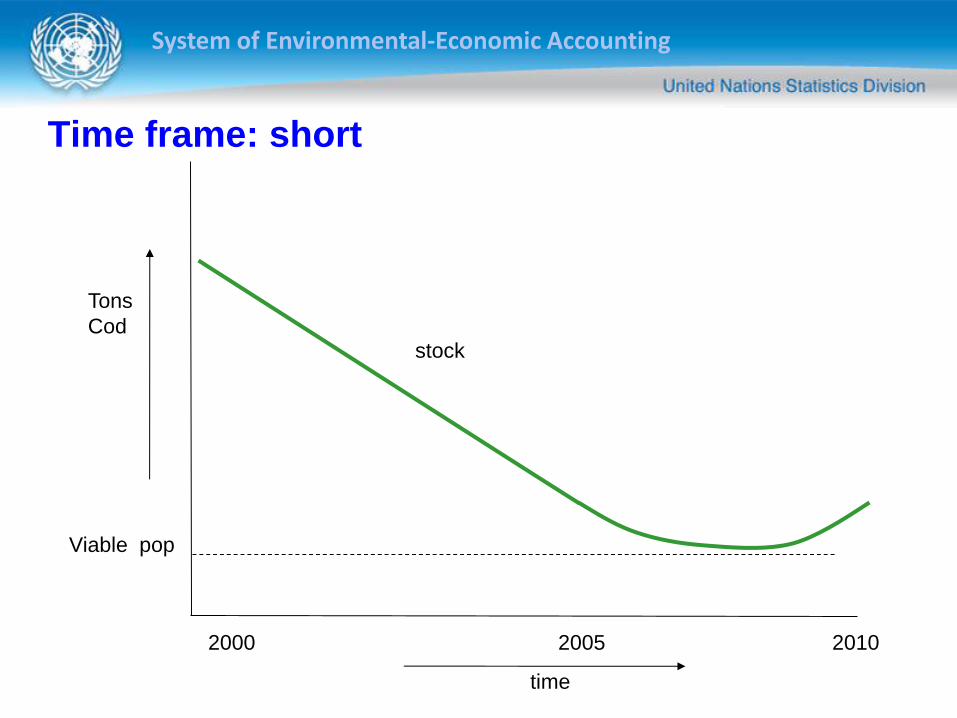
Time frame: short
stock
Tons
Cod
time
Viable pop
2000 2005 2010

System of Environmental-Economic Accounting
Time frame: longer
past future
stock
Tons
Cod
time
Viable pop
Pre-industrial
2000 2005 2010
System of Environmental-Economic Accounting
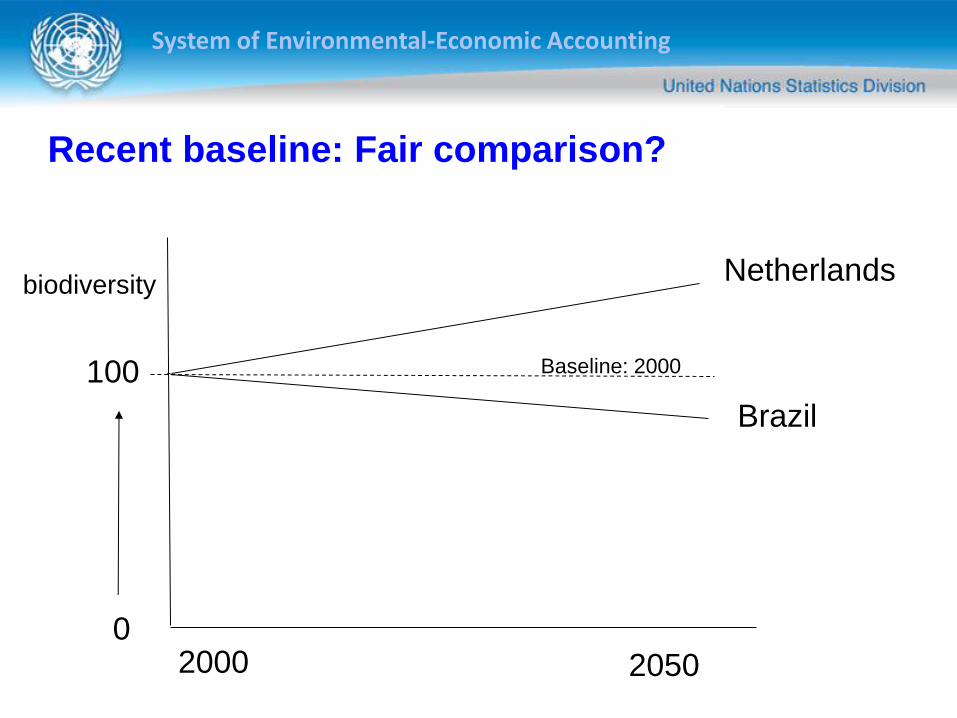
Recent baseline: Fair comparison?
100
2000 2050
Netherlands
Brazil
biodiversity
Baseline: 2000
0

System of Environmental-Economic Accounting
Historic baseline: Fair comparison?
100
1900 2050
Netherlands
Brazil
biodiversity
1950 2000
Baseline: natural state
System of Environmental-Economic Accounting
Biophysical modelling
9
System of Environmental-Economic Accounting
Biophysical modelling: Which type to choose
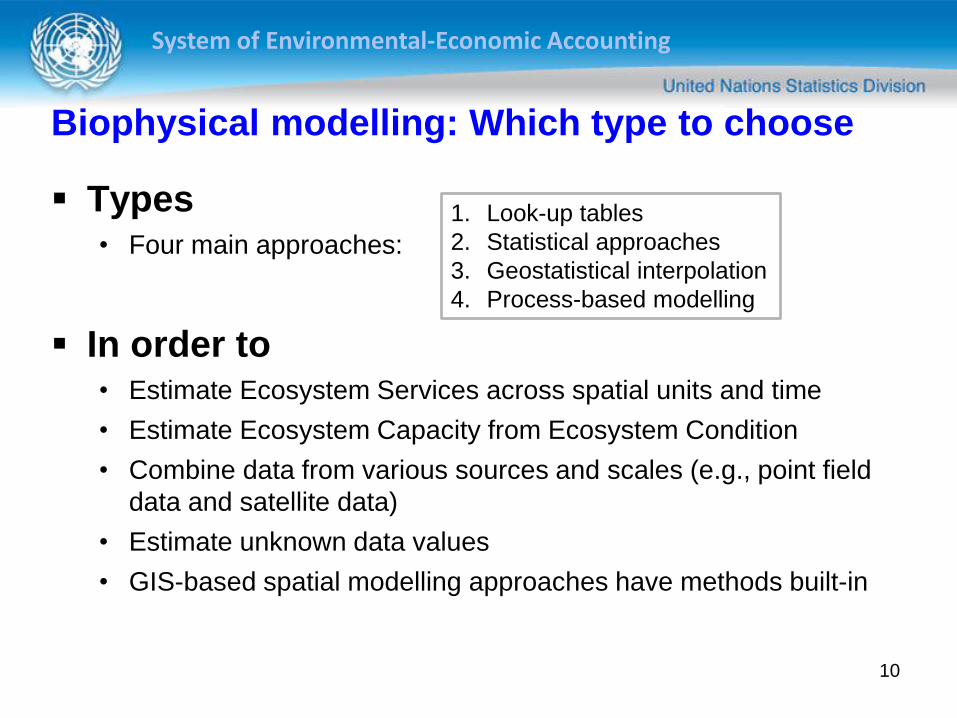
Types • Four main approaches:
In order to • Estimate Ecosystem Services across spatial units and time
• Estimate Ecosystem Capacity from Ecosystem Condition
• Combine data from various sources and scales (e.g., point field
data and satellite data)
• Estimate unknown data values
• GIS-based spatial modelling approaches have methods built-in
1. Look-up tables
2. Statistical approaches
3. Geostatistical interpolation
4. Process-based modelling
10
System of Environmental-Economic Accounting
Biophysical modelling
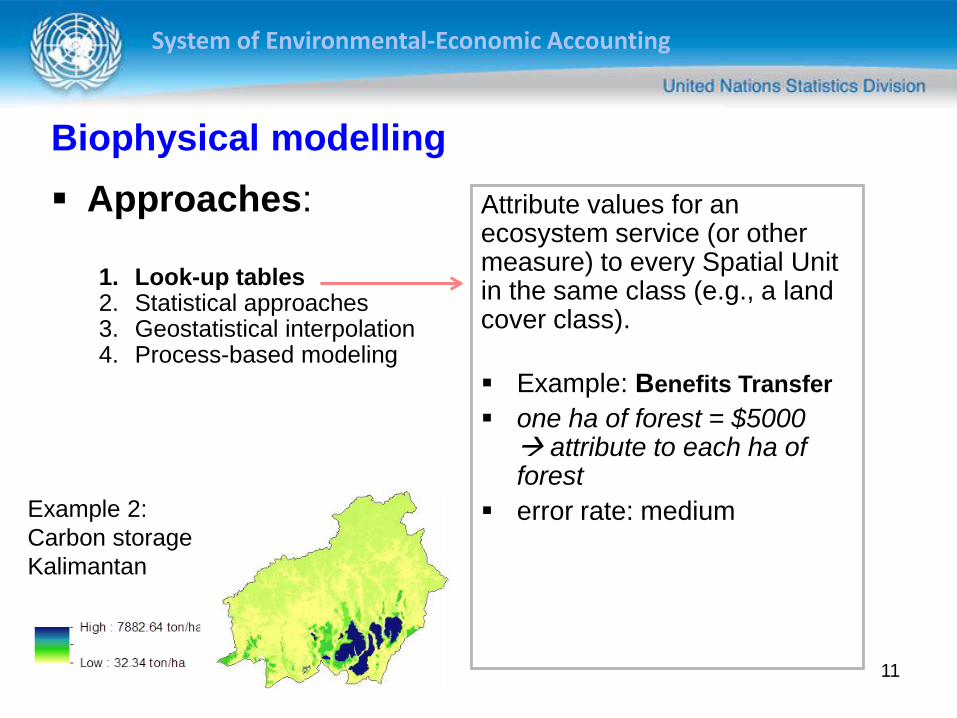
Approaches:
1. Look-up tables 2. Statistical approaches 3. Geostatistical interpolation 4. Process-based modeling
Attribute values for an ecosystem service (or other measure) to every Spatial Unit in the same class (e.g., a land cover class).
Example: Benefits Transfer
one ha of forest = $5000 attribute to each ha of forest
error rate: medium
11
Example 2:
Carbon storage
Kalimantan
System of Environmental-Economic Accounting
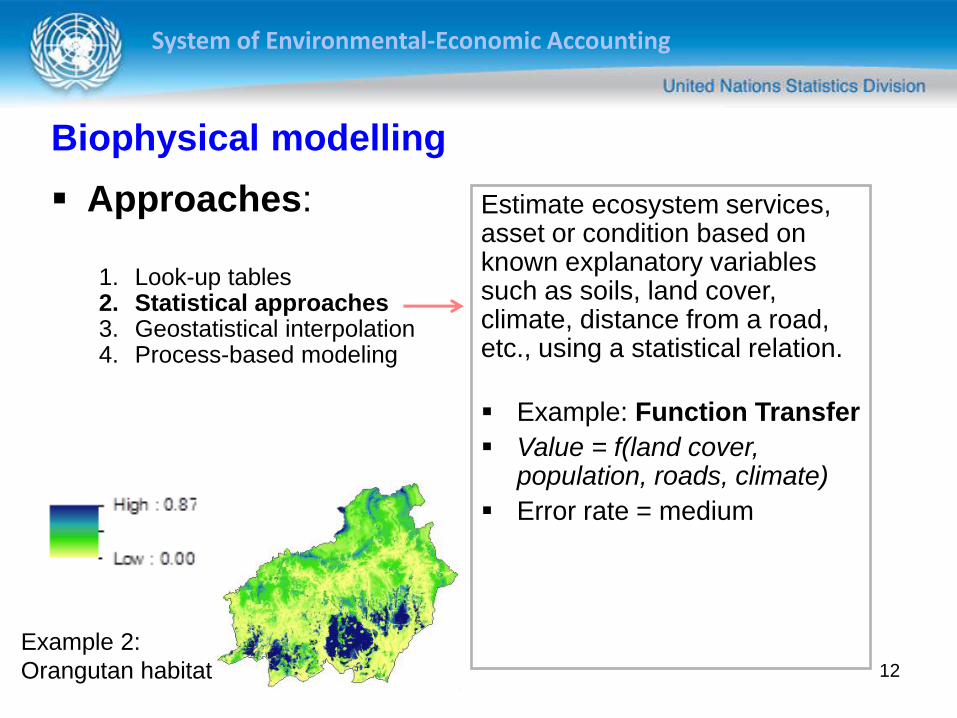
Estimate ecosystem services, asset or condition based on known explanatory variables such as soils, land cover, climate, distance from a road, etc., using a statistical relation.
Example: Function Transfer
Value = f(land cover, population, roads, climate)
Error rate = medium
12
Biophysical modelling
Approaches:
1. Look-up tables 2. Statistical approaches 3. Geostatistical interpolation 4. Process-based modeling
Example 2:
Orangutan habitat
System of Environmental-Economic Accounting
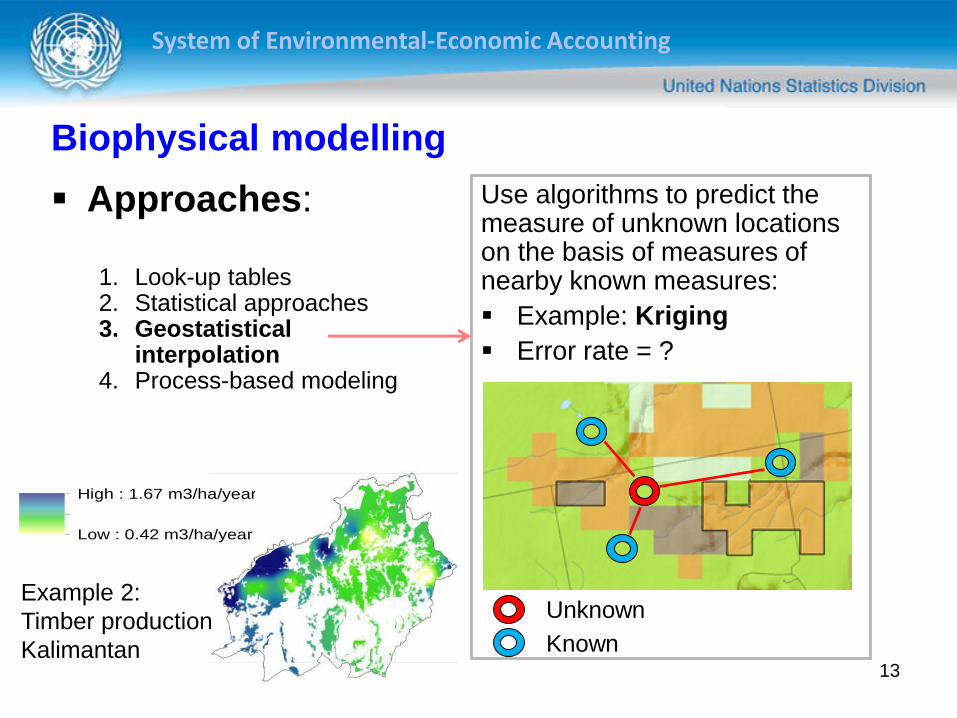
Use algorithms to predict the measure of unknown locations on the basis of measures of nearby known measures:
Example: Kriging
Error rate = ?
Known
Unknown
13
Biophysical modelling
Approaches:
1. Look-up tables 2. Statistical approaches 3. Geostatistical
interpolation 4. Process-based modeling
High : 1.67 m3/ha/year
Low : 0.42 m3/ha/year
Example 2:
Timber production
Kalimantan
System of Environmental-Economic Accounting
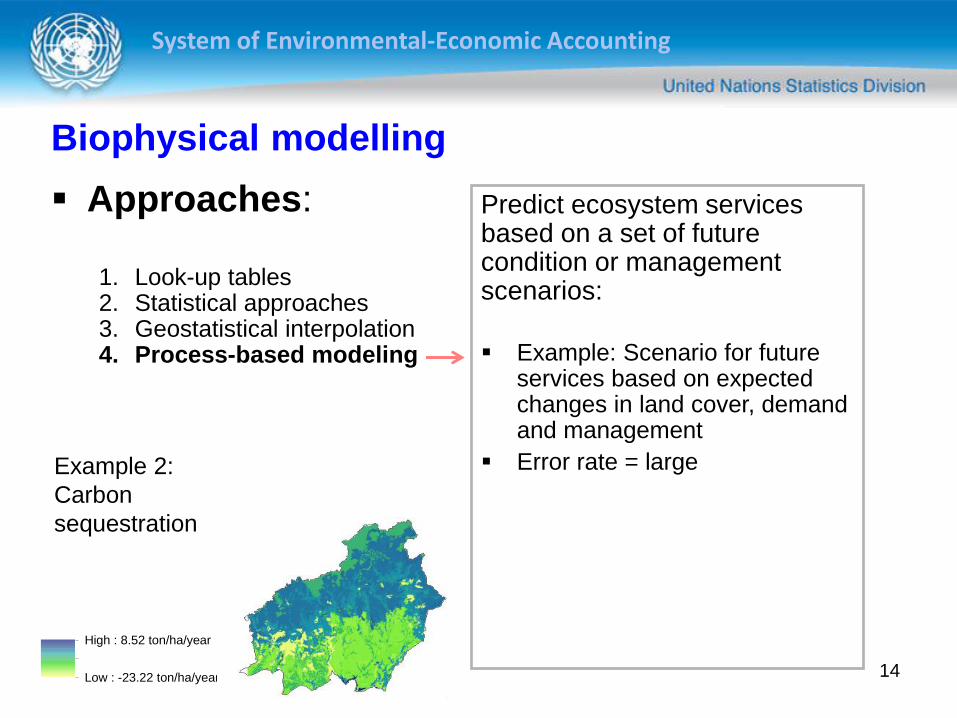
Predict ecosystem services based on a set of future condition or management scenarios:
Example: Scenario for future services based on expected changes in land cover, demand and management
Error rate = large
14
Biophysical modelling
Approaches:
1. Look-up tables 2. Statistical approaches 3. Geostatistical interpolation 4. Process-based modeling
High : 8.52 ton/ha/year
Low : -23.22 ton/ha/year
Example 2:
Carbon
sequestration
System of Environmental-Economic Accounting
Which models to choose for ecosystem accounting?
Is there an ideal set of models that can be used
by all Statistical Offices? • With an optimal resolution, scale, data needs ….
There are many variables that might be different in each country:
Purpose, policy relevancy
Implementation scale: Global versus national versus local
Data availability
Desired level of detail
Available capacity and budget
etc.
15
Issues for testing: 1. Selection of models
System of Environmental-Economic Accounting
First define requirements for your country and organization:
Who will be using the results and what for? • Policy makers (for local, national, international issues), sectors, organizations,
type of use, end users, desired accuracy, integration with existing assessments
What output is required? • Type ES, scale / level of detail, quantitative or qualitative, time requirement,
frequency, monetary or non-monetary valuation, accuracy, uncertainty
What input data do you have? • Indicators, sources, scale, data quality, data frequency
Who will implement, use and develop the models? • Type of organizations, institutional framework, independency, required skill
level, allocated capacity
What is the budget? • For data collection, purchase & implementation & development of models
16
Issues for testing: 1. Selection of models

System of Environmental-Economic Accounting
Selection criteria: Characteristics of model
Model theme • What type of ES are supported, what drivers and indicators are used
• Quantitative or qualitative, includes valuation or not, policy context
Model dimensions: • Model resolution, temporal coverage, scalability
• What input is required, can it use standard statistical data and make use of SEEA
classification system?
• What are the minimum data requirements and how does it handle data gaps?
• Can it calculate projections over time?
Model use: • Complexity, required skills, ownership, international acceptance, ownership,
preparation (data) and run time, stand alone or dependent on input of other models,
integration with environmental themes
Model development • Developed by who + purpose, open source or not, script language, can it be adjusted
to local conditions, how to calibrate data and carry out uncertainty analysis
17
Issues for testing: 1. Selection of models
System of Environmental-Economic Accounting
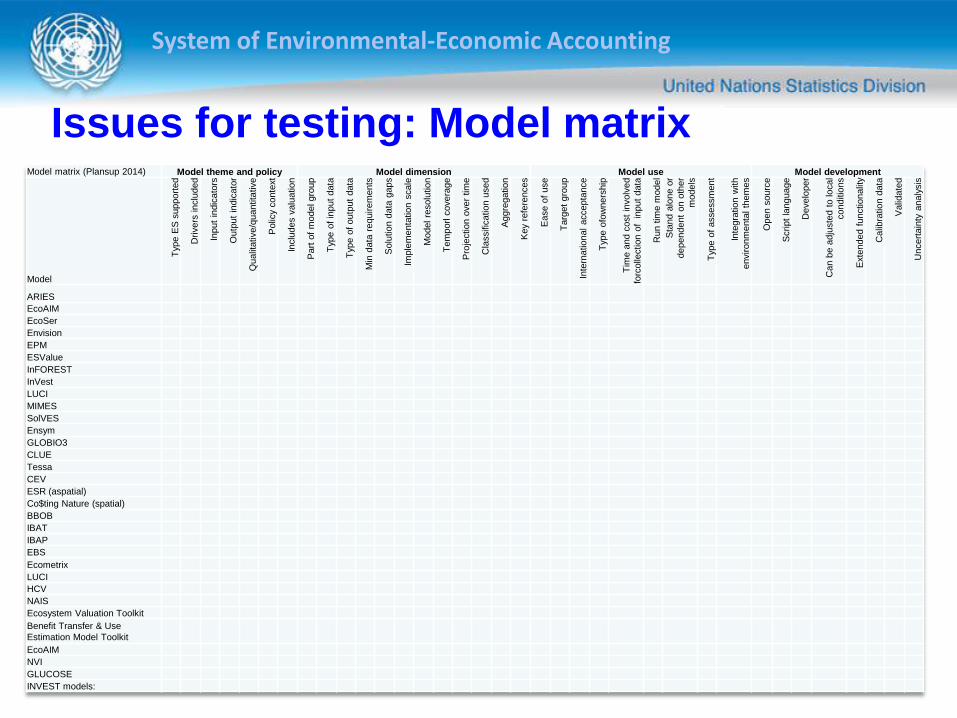
Issues for testing: Model matrix
18
Model matrix (Plansup 2014) Model theme and policy Model dimension Model use Model development
Model
Typ
e E
S s
upport
ed
Drivers
inclu
ded
Input
indic
ato
rs
Outp
ut
indic
ato
r
Qualit
ative/q
uantita
tive
Polic
y conte
xt
Inclu
des v
alu
ation
Part
of
model gro
up
Typ
e o
f in
put
data
Typ
e o
f outp
ut
data
Min
data
requirem
ents
Solu
tion d
ata
gaps
Imple
menta
tion s
cale
Model re
solu
tion
Tem
porl c
overa
ge
Pro
jection o
ver
tim
e
Cla
ssific
ation u
sed
Aggre
gation
Key
refe
rences
Ease o
f use
Targ
et
gro
up
Inte
rnational
accepta
nce
Typ
e o
fow
ners
hip
Tim
e a
nd c
ost
involv
ed
forc
olle
ction o
f input
data
Run t
ime m
odel
Sta
nd a
lone o
r
dependent
on o
ther
models
Typ
e o
f assessm
ent
Inte
gra
tion w
ith
environm
enta
l th
em
es
Open s
ourc
e
Script
language
Develo
per
Can b
e a
dju
ste
d t
o local
conditio
ns
Exte
nded f
unctionalit
y
Calib
ration d
ata
Valid
ate
d
Uncert
ain
ty a
naly
sis
ARIES
EcoAIM
EcoSer
Envision
EPM
ESValue
InFOREST
InVest
LUCI
MIMES
SolVES
Ensym
GLOBIO3
CLUE
Tessa
CEV
ESR (aspatial)
Co$ting Nature (spatial)
BBOB
IBAT
IBAP
EBS
Ecometrix
LUCI
HCV
NAIS
Ecosystem Valuation Toolkit
Benefit Transfer & Use
Estimation Model Toolkit
EcoAIM
NVI
GLUCOSE
INVEST models:
System of Environmental-Economic Accounting
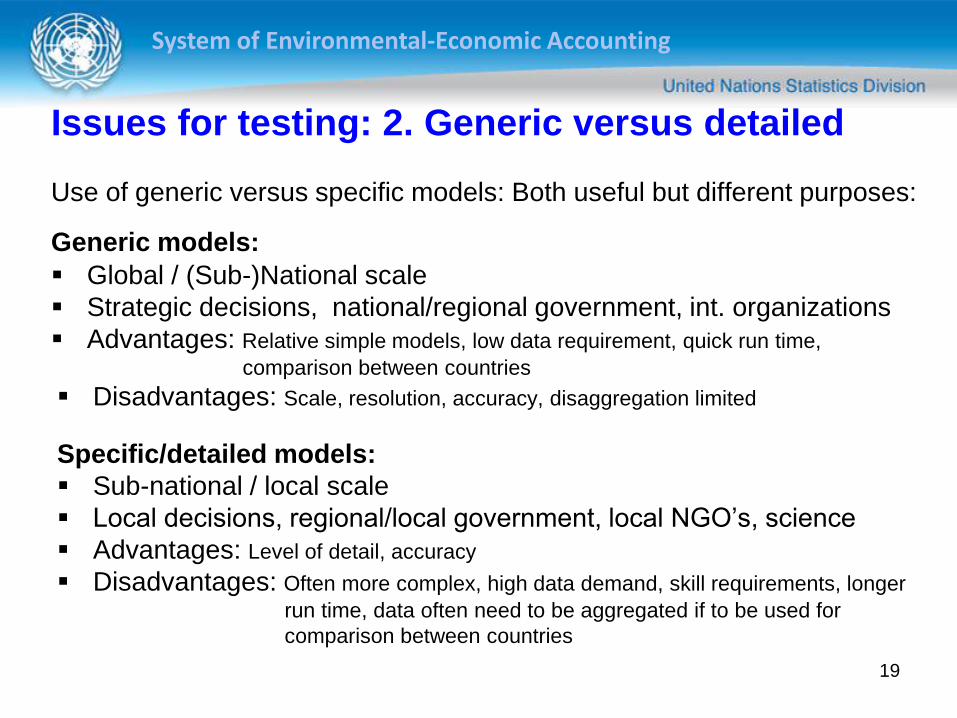
Use of generic versus specific models: Both useful but different purposes:
Generic models: Global / (Sub-)National scale
Strategic decisions, national/regional government, int. organizations
Advantages: Relative simple models, low data requirement, quick run time,
comparison between countries
Disadvantages: Scale, resolution, accuracy, disaggregation limited
Specific/detailed models:
Sub-national / local scale
Local decisions, regional/local government, local NGO’s, science
Advantages: Level of detail, accuracy
Disadvantages: Often more complex, high data demand, skill requirements, longer
run time, data often need to be aggregated if to be used for
comparison between countries
19
Issues for testing: 2. Generic versus detailed
System of Environmental-Economic Accounting
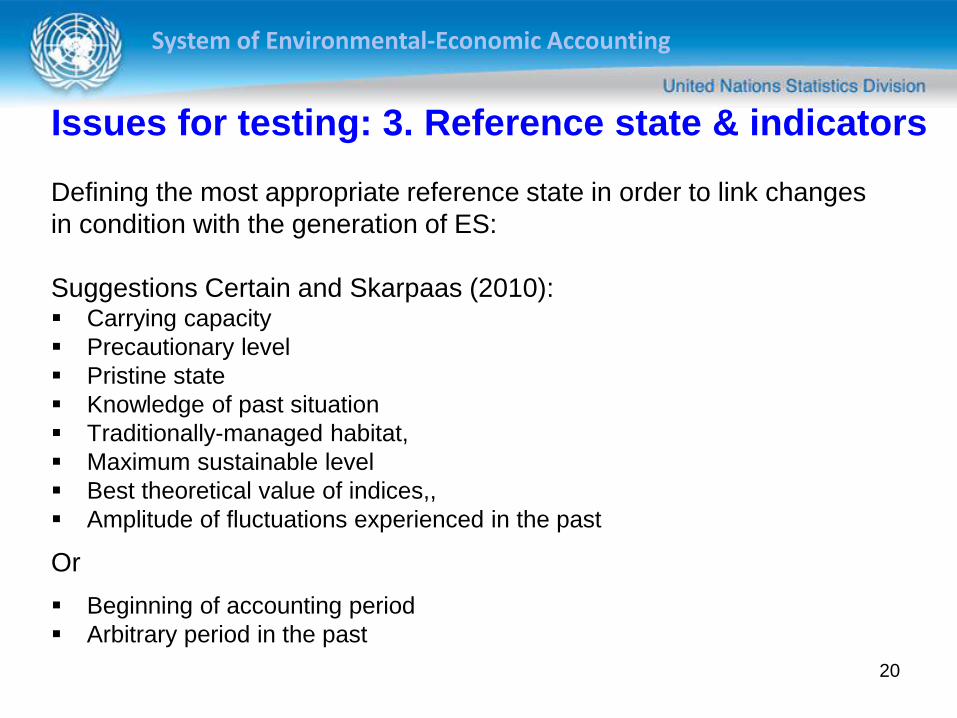
Defining the most appropriate reference state in order to link changes
in condition with the generation of ES:
Suggestions Certain and Skarpaas (2010): Carrying capacity
Precautionary level
Pristine state
Knowledge of past situation
Traditionally-managed habitat,
Maximum sustainable level
Best theoretical value of indices,,
Amplitude of fluctuations experienced in the past
Or
Beginning of accounting period
Arbitrary period in the past
20
Issues for testing: 3. Reference state & indicators
System of Environmental-Economic Accounting
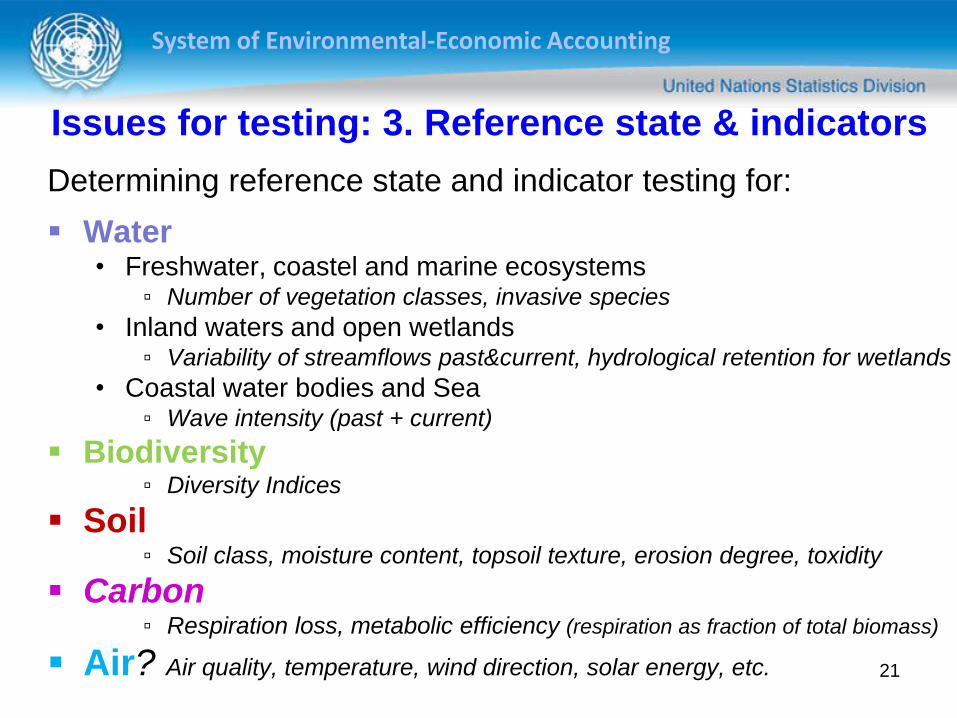
Determining reference state and indicator testing for:
Water • Freshwater, coastel and marine ecosystems
▫ Number of vegetation classes, invasive species
• Inland waters and open wetlands ▫ Variability of streamflows past¤t, hydrological retention for wetlands
• Coastal water bodies and Sea ▫ Wave intensity (past + current)
Biodiversity ▫ Diversity Indices
Soil ▫ Soil class, moisture content, topsoil texture, erosion degree, toxidity
Carbon ▫ Respiration loss, metabolic efficiency (respiration as fraction of total biomass)
Air? Air quality, temperature, wind direction, solar energy, etc. 21
Issues for testing: 3. Reference state & indicators
System of Environmental-Economic Accounting
Linkage between asset condition and capacity
As some services increase (e.g., crops, timber) the quality of other
services (biodiversity, heterogeneity) may decrease
• Intensive cropping creates ecosystems that are less resilient to
change.
Some services (e.g., iconic species habitat) may be very sensitive
to disturbance.
Research on resilience of all ecosystem functions trying to
understand how to better link conditions with all services.
22
Issues for testing: 4. Link condition and capacity
System of Environmental-Economic Accounting
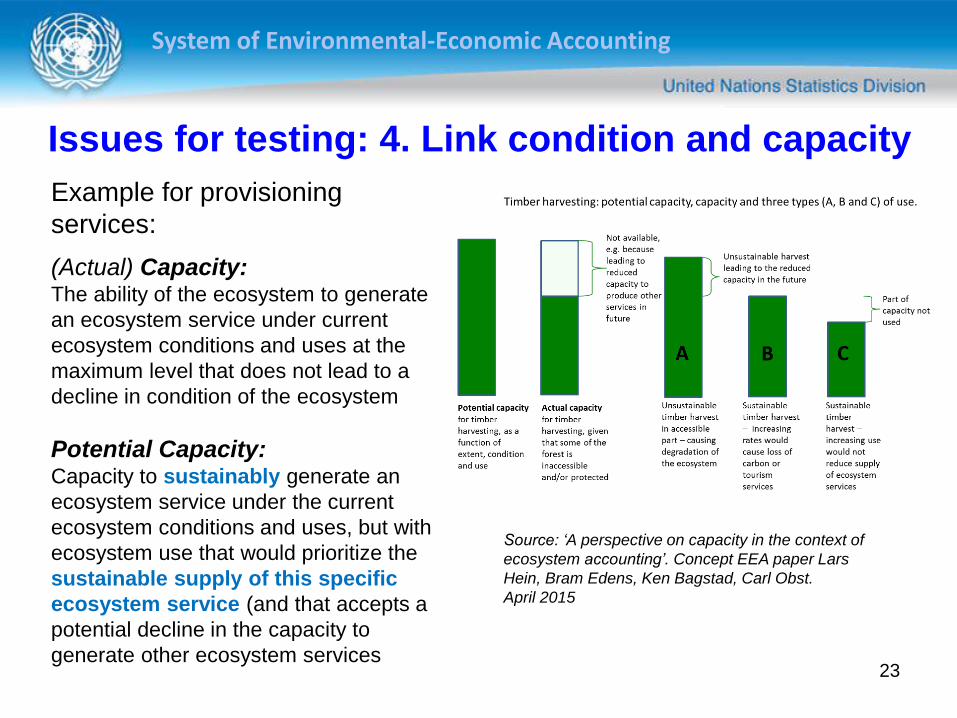
Example for provisioning
services:
(Actual) Capacity: The ability of the ecosystem to generate
an ecosystem service under current
ecosystem conditions and uses at the
maximum level that does not lead to a
decline in condition of the ecosystem
Potential Capacity: Capacity to sustainably generate an
ecosystem service under the current
ecosystem conditions and uses, but with
ecosystem use that would prioritize the
sustainable supply of this specific
ecosystem service (and that accepts a
potential decline in the capacity to
generate other ecosystem services
23
Issues for testing: 4. Link condition and capacity
Source: ‘A perspective on capacity in the context of
ecosystem accounting’. Concept EEA paper Lars
Hein, Bram Edens, Ken Bagstad, Carl Obst.
April 2015
System of Environmental-Economic Accounting
Would a separate driver account, that records available socio-
economic information, provide information that can be used to explain
changes in condition?
Socio economic data, e.g. on:
Changes in population density,
Land use, incl. agricultural and forest use intensity and lu change
Global, national and regional drivers, such as:
Commodity prices,
Economic growth rates
Export and import of crops and timber
Urban growth
Policies on land use change and nature conservation 24
Issues for testing: 5. Driver account
System of Environmental-Economic Accounting
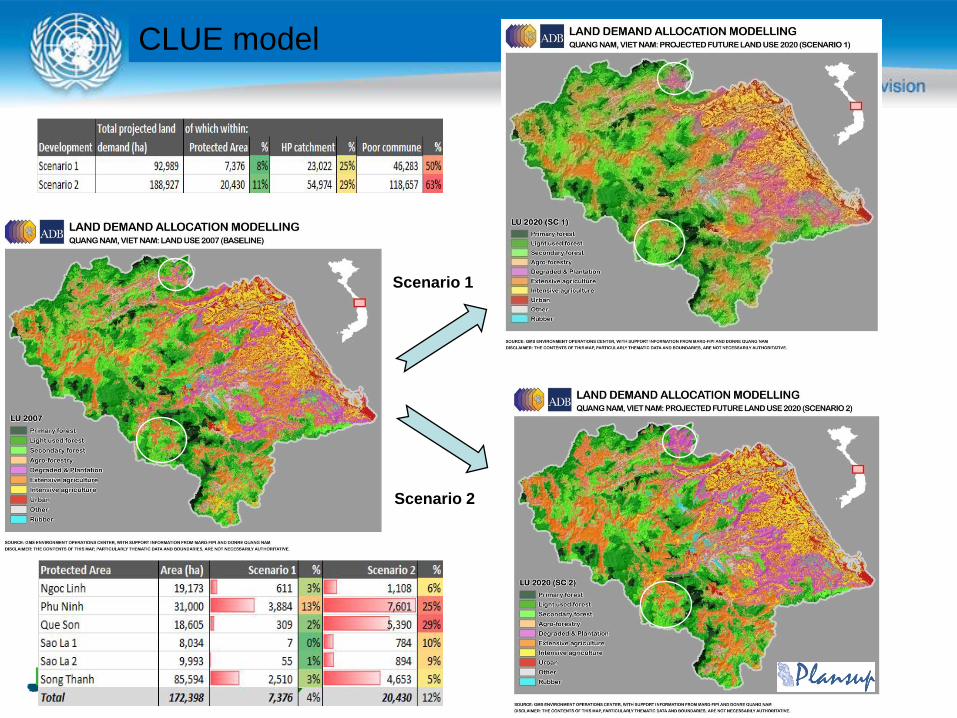
Could scenario analysis provide information to derive information on
future services?
Example: Clue land use model
Using land use scenarios to quantify future land use
Land use relation with Ecosystem Condition Ecosystem Function
e.g. In GLOBIO biodiversity model:
Relation between land use and biodiversity
+ infrastructure + fragmentation + nitrogen deposition + climate change
Future land use: Relation with future Biodiversity
25
Issues for testing: 6. Scenario Analysis
System of Environmental-Economic Accounting
26
Scenario 1
Scenario 2
CLUE model

System of Environmental-Economic Accounting
Scenario 1
Protected areas
GLOBIO3 model
System of Environmental-Economic Accounting
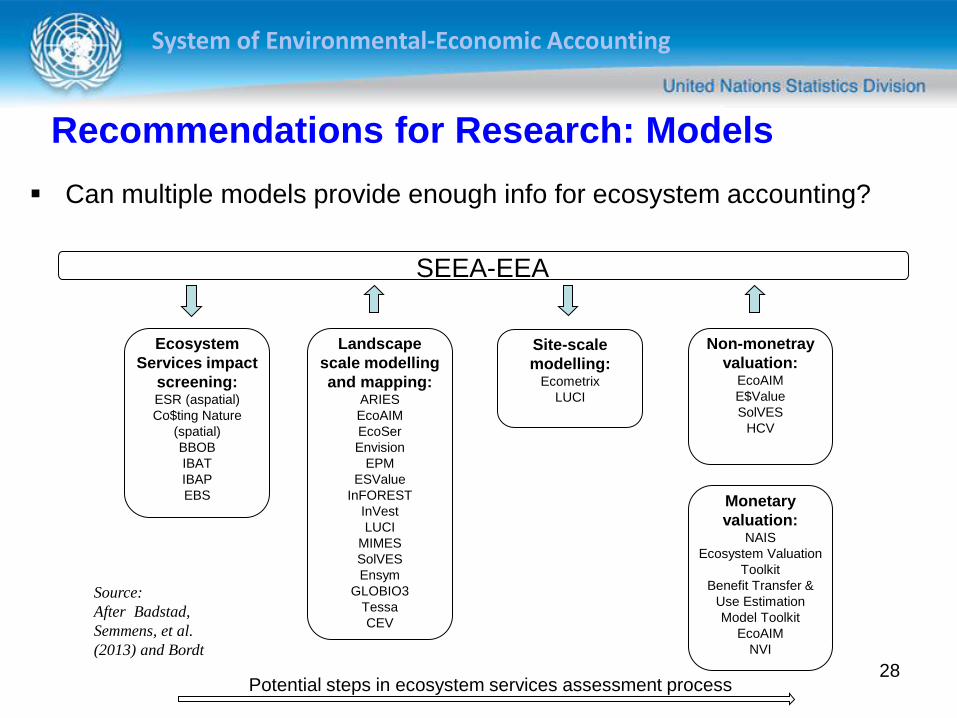
Recommendations for Research: Models
Can multiple models provide enough info for ecosystem accounting?
28
Source:
After Badstad,
Semmens, et al.
(2013) and Bordt
Ecosystem
Services impact
screening: ESR (aspatial)
Co$ting Nature
(spatial)
BBOB
IBAT
IBAP
EBS
Landscape
scale modelling
and mapping: ARIES
EcoAIM
EcoSer
Envision
EPM
ESValue
InFOREST
InVest
LUCI
MIMES
SolVES
Ensym
GLOBIO3
Tessa
CEV
Site-scale
modelling: Ecometrix
LUCI
Non-monetray
valuation: EcoAIM
E$Value
SolVES
HCV
Monetary
valuation: NAIS
Ecosystem Valuation
Toolkit
Benefit Transfer &
Use Estimation
Model Toolkit
EcoAIM
NVI
SEEA-EEA
Potential steps in ecosystem services assessment process
System of Environmental-Economic Accounting
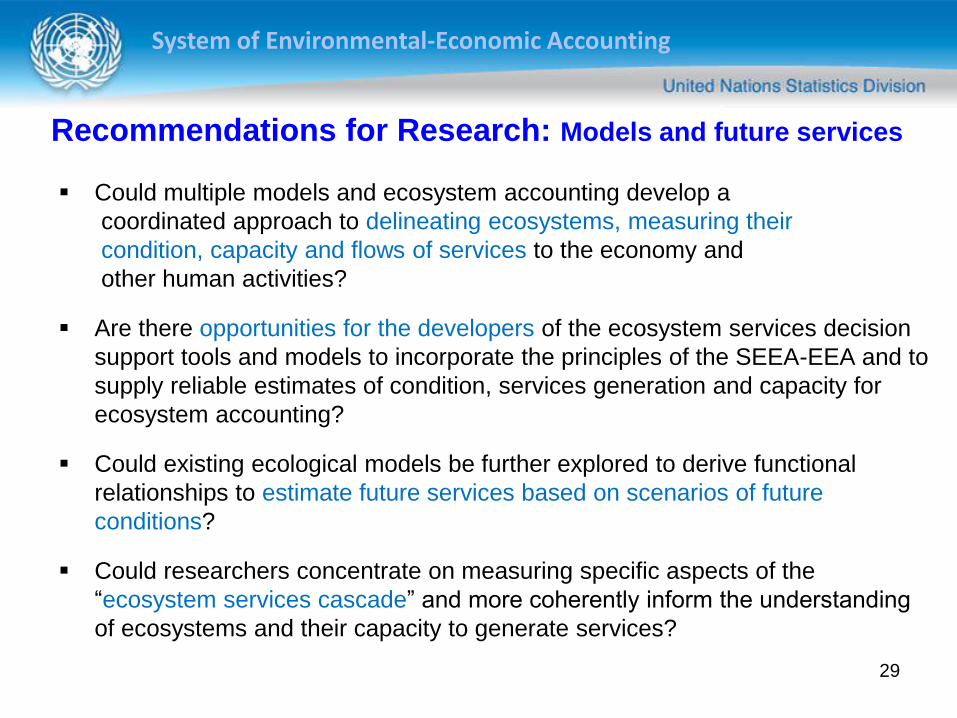
Recommendations for Research: Models and future services
29
Could multiple models and ecosystem accounting develop a
coordinated approach to delineating ecosystems, measuring their
condition, capacity and flows of services to the economy and
other human activities?
Are there opportunities for the developers of the ecosystem services decision
support tools and models to incorporate the principles of the SEEA-EEA and to
supply reliable estimates of condition, services generation and capacity for
ecosystem accounting?
Could existing ecological models be further explored to derive functional
relationships to estimate future services based on scenarios of future
conditions?
Could researchers concentrate on measuring specific aspects of the
“ecosystem services cascade” and more coherently inform the understanding
of ecosystems and their capacity to generate services?
System of Environmental-Economic Accounting
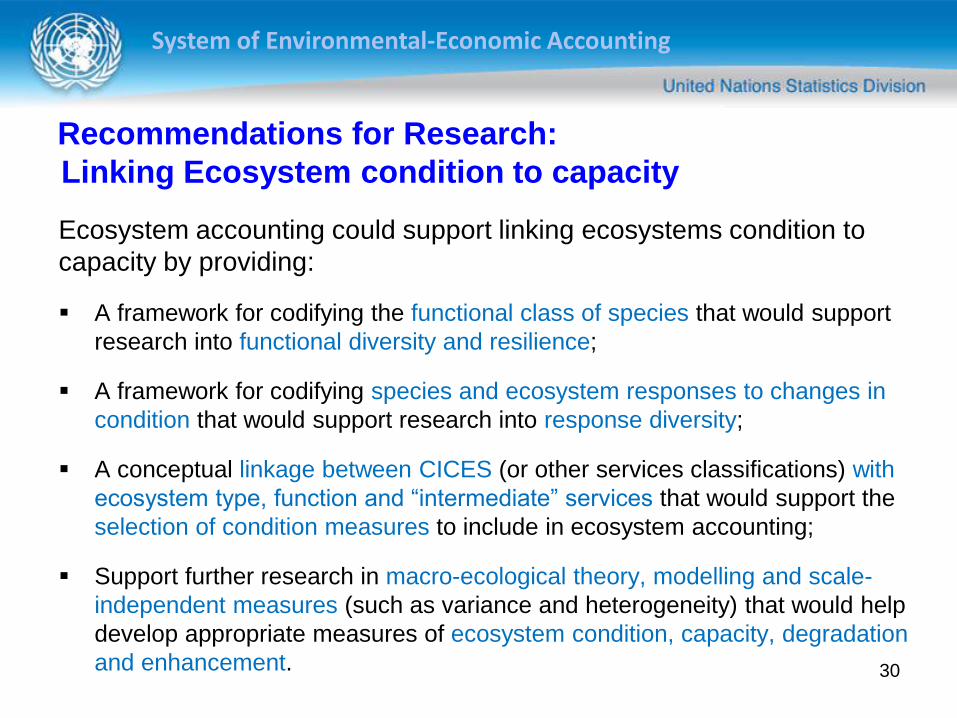
Recommendations for Research:
Linking Ecosystem condition to capacity
Ecosystem accounting could support linking ecosystems condition to
capacity by providing:
A framework for codifying the functional class of species that would support
research into functional diversity and resilience;
A framework for codifying species and ecosystem responses to changes in
condition that would support research into response diversity;
A conceptual linkage between CICES (or other services classifications) with
ecosystem type, function and “intermediate” services that would support the
selection of condition measures to include in ecosystem accounting;
Support further research in macro-ecological theory, modelling and scale-
independent measures (such as variance and heterogeneity) that would help
develop appropriate measures of ecosystem condition, capacity, degradation
and enhancement.
30

System of Environmental-Economic Accounting
Suggestions for breakout groups
1. Selection of models: a: What are the most important criteria (-groups) and
b: the minimum requirements, per Ecosystem Component Account
(ECA: land, water, biodiversity, carbon)?
Criteria; data, scale, users, gaps, link with economic data, etc.
2. Generic versus detailed (data and models): Give examples for both types
Local versus global, policy relevance, type of users and use, are details
important, multiple scales
3. Reference state and indicators: Discuss reference state(s) for common
indicators per ECA
4. Link between asset condition and capacity: Give examples per ECA
Capacity and Potential Capacity
5. Driver account: Discuss additional value and give examples
Would a separate driver account, that records available socio-economic
information, provide information that can be used to explain changes in
condition?
6. Scenario analysis: How useful are scenarios for the SEEA?
31
System of Environmental-Economic Accounting
Acknowledgements
This project is a collaboration of The United Nations
Statistics Division, United Nations Environment Programme
and the Secretariat of the Convention on Biological
Diversity and is supported by the Government of Norway.