Effects of Grain Size and Sorting on Quartz Cementation ... · PDF fileEffects of Grain Size...
1
Effects of Grain Size and Sorting on Quartz Cementation and Pore Space Evolution Randolph Williams 1,2 , John Farver 1 , Charles Onasch 1 1 Department of Geology, Bowling Green State University 2 Department of Geosciences, University of Wisconsin-Madison • Quantify the effect of grain size, sorting, and fracture density on the rate of quartz cementation in quartz sandstones. • Examine how sedimentary fabric driven differences in precipitation rate effect pore space development in end-member grain size and sorting experiments. • Use experimental results to calibrate numerical models using a randomized grain pack to further constrain the effects of differences in precipitation rate on pore space development. Objectives 0 5E-12 1E-11 1.5E-11 2E-11 2.5E-11 3E-11 3.5E-11 4E-11 4.5E-11 0 200 400 600 800 1000 1200 1400 1600 Time (hours) Rate (mol / cm 2 *s -1 ) Observed Precipitation Rate Figure 3. Back- calculated surface area normalized growth rates for mixed grain size experiments within 1 mm of the reactant substrate interface at 450 ̊C. These data are used to calibrate numerical models of quartz cementation shown below. Experimental Results Figure 2. CL mosaic of experiment conducted at 450 ̊C for 1 week. Fracture sealing (FS) precedes grain boundary overgrowth (GBO) formation, and cement vol% decreases with distance from the reactant substrate interface (bottom of image) suggesting transport limited growth. FS No Growth GBO + FS 0% 5% 10% 15% 20% 25% 30% 35% 0 2 4 6 8 10 12 14 16 Numerical Model: Total Porosity Coarse Fine Mixed Model Time Steps Total Porosity (Vol %) Figure 6. Modeled total porosity using a randomized grain pack. Similar to experimental results, total porosity for all grain size fractions quickly converges following approximately 8 modeled time steps. 0 10 20 30 40 50 60 70 80 90 100 0 2 4 6 8 10 12 14 16 Numerical Model: Pore Space Connectivity Coarse Fine Mixed Model Time Steps Pore Density (pores / mm 2 ) Figure 7. Modeled pore space connectivity. Similar to experimental results, pore density reaches peak values in all grain size fractions at equivalent modeled total porosity. Conclusions • Experimental data and numerical models show that sedimentary fabric has little effect on total porosity. • Pore space connectivity varies markedly as a function of grain size and sorting. • Numerical models of fracture sealing and diffusive flux indicate that in areas of sufficient fracture density precipitation rate may exceed diffusive flux, resulting in transport limited quartz growth. Figure 8. A) CL image showing sealed fracture in quartz grain. B) Modeled diffusive flux across the experimental charge as a function of time for 450, 300, and 250 ̊C. Calculated fracture seal rates in our experiments outpace modeled diffusive flux. 0 0.00001 0.00002 0.00003 0.00004 0.00005 0.00006 0.00007 0.00008 0.00009 0.0001 0 100 200 300 400 500 600 700 800 Diffusive Flux Across Charge Diffusive Flux Across Charge at 450 Diffusive Flux Across Charge at 350 Diffusive Flux Across Charge at 250 Diffusive Flux (mg / cm 2 *s -1 ) Time (hours) FS Laboratory Experiments Figure 1. Dual grain size fraction experiments were weld-sealed in Au tubes and conducted in hydrothermal cold-seal vessels at 450 ̊C and 150 MPa. Coarse (425 - 500 ɥm), fine (90 - 125 ɥm), and mixed (100 - 500 ɥm; Winslow, 2012) grain size fractions were examined. Charges also contained 25 wt% NaCl brine and 10 mg AlCl 3 as a luminescent tracer. 5 mm 0 5 10 15 20 25 0 50 100 150 200 250 300 350 400 Effects of Grain Size and Sorting: Porosity Coarse Fine Mixed Time (hours) Total Porosity (Vol %) Figure 4. Total porosity decrease in 450 ̊C experiments as a function of time. Rapidly decreasing precipitation rates in fine grain size samples result in total porosity convergence following 1 week. 0 5 10 15 20 25 30 35 40 0 50 100 150 200 250 300 350 400 Effects of Grain Size and Sorting: Pore Space Connectivty Coarse Fine Mixed Time (hours) Pore Density (Pores / mm 2 ) Figure 5. Pore space connectivity assessed as pore density. While all grain size fractions share a similar total porosity following one week, pore space connectivity varies markedly as a function of grain size and sorting. Numerical Modeling Acknowledgements Fracture Density Implications for Diagenesis A B •Differences in precipitation rate between grain size fractions result in significant differences in pore space connectivity at equivalent total porosities. •In areas of high fracture density, the rate limiting mechanism for quartz cementation may oscillate be- tween transport and preciptation as fractures are pro- gressively sealed. Partial support provided by the GDL Foundation and the Fox Practical Geophysics Fund. Analyical resources were provided by the BGSU Center’s for Microscopy and Photo- chemical Sciences. References R 2 = 0.945 Lander, R.H., Larese, R.E., Bonnell, L.M., 2008. Toward more accurate quartz cement models: The importance of euhedral versus noneuhedral growth rates. American AAPG Bulletin v. 92 p. 1537-1563. Winslow, D., 2012. The effect of grain substrate and iron on the nature and rate of silica cementation quartz-rich reservoir rocks. Master’s Thesis: Bowling Green State University. 50 ɥm
Transcript of Effects of Grain Size and Sorting on Quartz Cementation ... · PDF fileEffects of Grain Size...
Effects of Grain Size and Sorting on Quartz Cementation and Pore Space EvolutionRandolph Williams1,2, John Farver1, Charles Onasch1
1Department of Geology, Bowling Green State University2Department of Geosciences, University of Wisconsin-Madison
• Quantify the effect of grain size, sorting, and fracture density on the rate of quartz cementation in quartz sandstones.
• Examine how sedimentary fabric driven differences in precipitation rate effect pore space development in end-member grain size and sorting experiments.
• Use experimental results to calibrate numerical models using a randomized grain pack to further constrain the effects of differences in precipitation rate on pore space development.
Objectives
Acknowledgments
References
0
5E-12
1E-11
1.5E-11
2E-11
2.5E-11
3E-11
3.5E-11
4E-11
4.5E-11
0 200 400 600 800 1000 1200 1400 1600
Time (hours)
Rat
e (m
ol /
cm2 *
s-1)
Observed Precipitation RateFigure 3. Back-calculated surface area normalized growth rates for mixed grain size experiments within 1 mm of the reactant substrate interface at 450 ̊C. These data are used to calibrate numerical models of quartz cementation shown below.
Experimental ResultsFigure 2. CL mosaic of experiment conducted at 450 ̊C for 1 week. Fracture sealing (FS) precedes grain boundary overgrowth (GBO) formation, and cement vol% decreases with distance from the reactant substrate interface (bottom of image) suggesting transport limited growth.
FS
No Growth
GBO + FS
0%
5%
10%
15%
20%
25%
30%
35%
0 2 4 6 8 10 12 14 16
Numerical Model: Total Porosity
Coarse
Fine
Mixed
Model Time Steps
Tota
l Por
osity
(Vol
%)
Figure 6. Modeled total porosity using a randomized grain pack. Similar to experimental results, total porosity for all grain size fractions quickly converges following approximately 8 modeled time steps.
0
10
20
30
40
50
60
70
80
90
100
0 2 4 6 8 10 12 14 16
Numerical Model: Pore Space Connectivity
Coarse
Fine
Mixed
Model Time Steps
Por
e D
ensi
ty (p
ores
/ m
m2 )
Figure 7. Modeled pore space connectivity. Similar to experimental results, pore density reaches peak values in all grain size fractions at equivalent modeled total porosity.
Conclusions• Experimentaldataandnumericalmodelsshowthatsedimentaryfabrichaslittleeffectontotalporosity.
• Porespaceconnectivityvariesmarkedlyasafunctionofgrainsizeandsorting.
• Numericalmodelsoffracturesealinganddiffusivefluxindicatethatinareasofsufficientfracturedensityprecipitationratemayexceeddiffusiveflux,resultingintransportlimitedquartzgrowth.
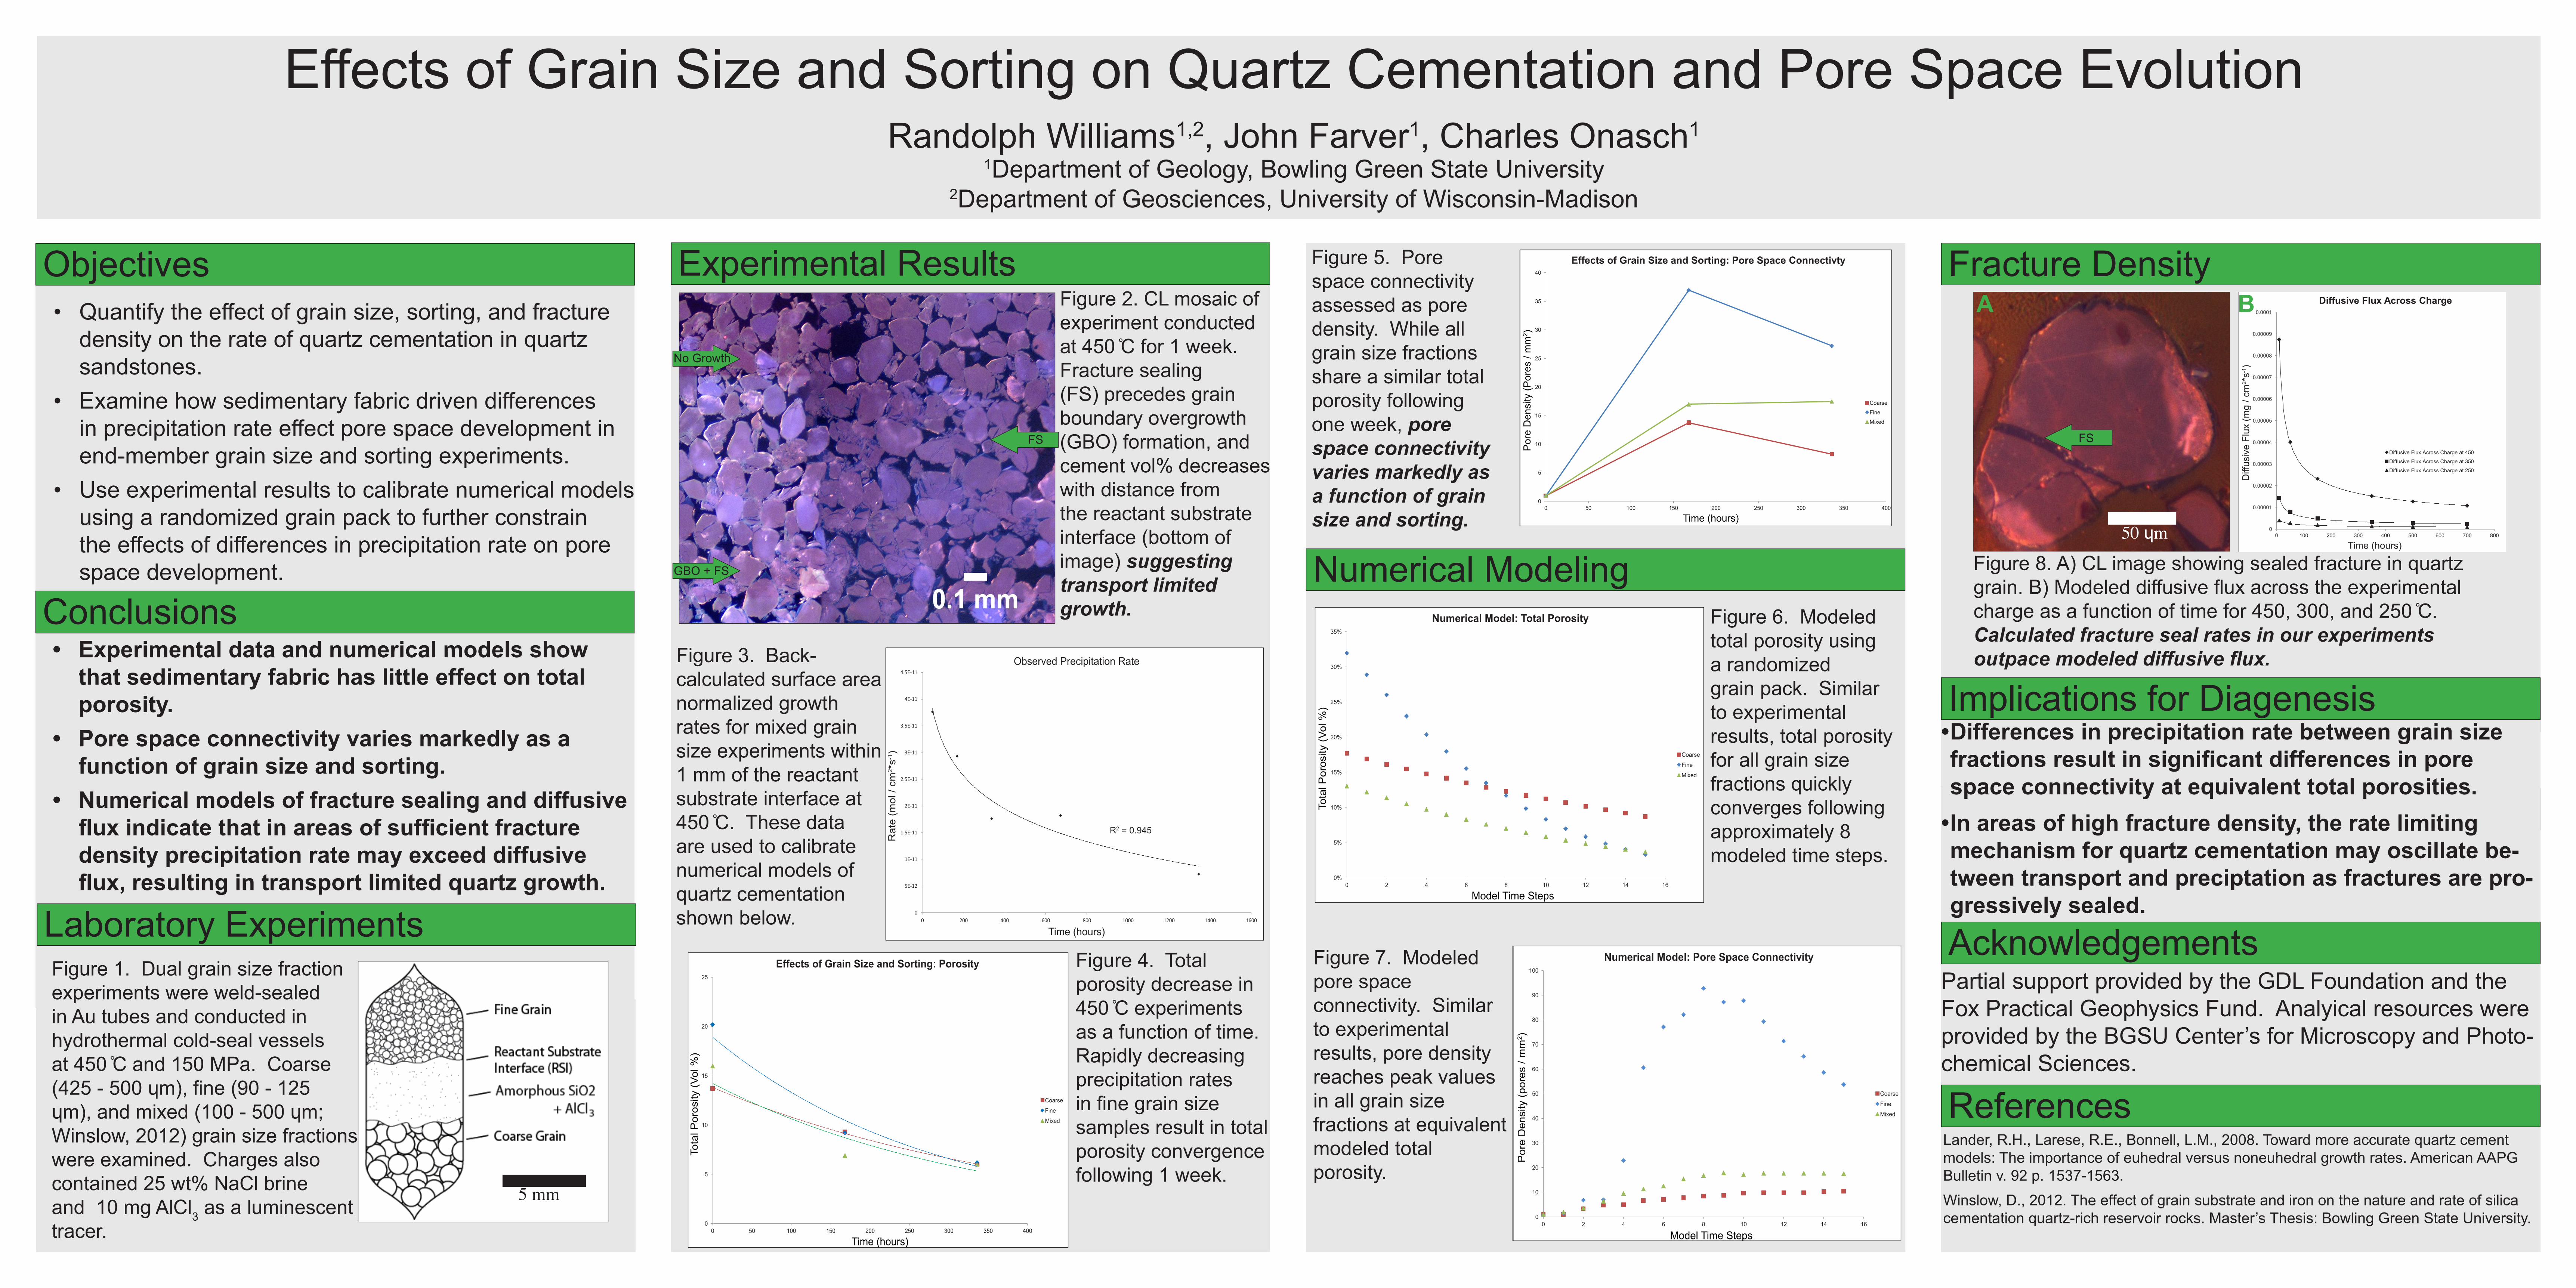
Figure 8. A) CL image showing sealed fracture in quartz grain. B) Modeled diffusive flux across the experimental charge as a function of time for 450, 300, and 250 ̊C. Calculated fracture seal rates in our experiments outpace modeled diffusive flux.
0
0.00001
0.00002
0.00003
0.00004
0.00005
0.00006
0.00007
0.00008
0.00009
0.0001
0 100 200 300 400 500 600 700 800
Diffusive Flux Across Charge
Diffusive Flux Across Charge at 450
Diffusive Flux Across Charge at 350
Diffusive Flux Across Charge at 250
Diff
usiv
e Fl
ux (m
g / c
m2 *
s-1)
Time (hours)
FS
Laboratory ExperimentsFigure 1. Dual grain size fraction experiments were weld-sealed in Au tubes and conducted in hydrothermal cold-seal vessels at 450 ̊C and 150 MPa. Coarse (425 - 500 ɥm), fine (90 - 125 ɥm), and mixed (100 - 500 ɥm; Winslow, 2012) grain size fractions were examined. Charges also contained 25 wt% NaCl brine and 10 mg AlCl3 as a luminescent tracer.
5 mm0
5
10
15
20
25
0 50 100 150 200 250 300 350 400
Effects of Grain Size and Sorting: Porosity
Coarse
Fine
Mixed
Time (hours)
Tota
l Por
osity
(Vol
%)
Figure 4. Total porosity decrease in 450 ̊C experiments as a function of time. Rapidly decreasing precipitation rates in fine grain size samples result in total porosity convergence following 1 week.
0
5
10
15
20
25
30
35
40
0 50 100 150 200 250 300 350 400
Effects of Grain Size and Sorting: Pore Space Connectivty
Coarse
Fine
Mixed
Time (hours)
Por
e D
ensi
ty (P
ores
/ m
m2 )
Figure 5. Pore space connectivity assessed as pore density. While all grain size fractions share a similar total porosity following one week, pore space connectivity varies markedly as a function of grain size and sorting.
Numerical Modeling
Acknowledgements
Fracture Density
Implications for Diagenesis
A B
•Differencesinprecipitationratebetweengrainsizefractionsresultinsignificantdifferencesinporespaceconnectivityatequivalenttotalporosities.•Inareasofhighfracturedensity,theratelimitingmechanismforquartzcementationmayoscillatebe-tweentransportandpreciptationasfracturesarepro-gressivelysealed.
Partial support provided by the GDL Foundation and the Fox Practical Geophysics Fund. Analyical resources were provided by the BGSU Center’s for Microscopy and Photo-chemical Sciences.
References
R2 = 0.945
Lander, R.H., Larese, R.E., Bonnell, L.M., 2008. Toward more accurate quartz cement models: The importance of euhedral versus noneuhedral growth rates. American AAPG Bulletin v. 92 p. 1537-1563.Winslow, D., 2012. The effect of grain substrate and iron on the nature and rate of silica cementation quartz-rich reservoir rocks. Master’s Thesis: Bowling Green State University.
50 ɥm