QUARTZ CEMENTATION HISTORY OF SANDSTONES REVEALED …wiscsims/pdfs/Harwood_JSR2013.pdf · quartz...
9
Journal of Sedimentary Research, 2013, v. 83, 522–530 Research Article DOI: 10.2110/jsr.2013.29 QUARTZ CEMENTATION HISTORY OF SANDSTONES REVEALED BY HIGH-RESOLUTION SIMS OXYGEN ISOTOPE ANALYSIS JOSEPH HARWOOD, 1 ANDREW C. APLIN,* 1 CLAIRE I. FIALIPS, {1 JAMES E. ILIFFE, 2 REINHARD KOZDON, 3 TAKAYUKI USHIKUBO, 3 AND JOHN W. VALLEY 3 1 School of Civil Engineering and Geosciences, Newcastle University, Newcastle upon Tyne, NE1 7RU, U.K. 2 BP Exploration and Production, Sunbury-on-Thames, U.K. 3 WiscSIMS, Department of Geoscience, University of Wisconsin, Madison, Wisconsin 53706, U.S.A. e-mail: [email protected] ABSTRACT: Evaluating the timing and origin of quartz cement is central to understanding how porosity is lost in sandstones during burial. Kinetic models of quartz cementation have been calibrated using large–scale datasets but have never been tested at the microscopic level at which cement forms. Here, we use high-precision, in situ oxygen isotope analyses on sandstone from the Jurassic Ness Formation from the North Sea to reveal the growth history of single quartz overgrowths to a resolution of 2 mm. Measured d 18 O (cement) range from +28 to +20% V-SMOW in early to late cement and are consistent with quartz cementation models that propose the bulk of quartz precipitates as a continuous process beginning at 60–70 uC. Quantitative X- ray Diffraction analyses and clay mineralogical analysis of interbedded shales are inconsistent with a silica source from shale, implying that silica for the cement is sourced internally to the sand. These isotope data are broadly consistent with predictive, conceptual quartz cementation models and provide a critical link from micron-scale measurements to basin-scale predictions and observations. INTRODUCTION Since quartz is the most abundant diagenetic mineral in sandstones, constraining the rates and mechanisms of quartz cementation is fundamental to quantifying changes in the physical properties of sandstones during burial, and central to the prediction of the quality of many petroleum reservoirs (Worden and Morad 2000). Many studies have thus attempted to evaluate the temperature and timing of precipitation as well as the origin of silica during the ‘‘cementation window,’’ typically through the combined use of fluid-inclusion (Haszeldine et al. 1984; Walderhaug 1994; Wilkinson et al. 1998), petrographic (Blanche and Whitaker 1978; Hogg et al. 1992; Oelkers et al. 1996), and isotopic investigations (Brint et al. 1991; Aplin and Warren 1994; Williams et al. 1997; Girard et al. 2001; Marchand et al. 2002). By combining data on fluid inclusions and cement abundance acquired from sandstones buried with well-defined thermal histories to a range of temperatures, Walderhaug (1994) estimated the rate of quartz cementa- tion as a function of time, temperature, and quartz surface area. These data form the basis of commonly used kinetic models of quartz cementation (Walderhaug 1996; Lander and Walderhaug 1999; Lander et al. 2008). Furthermore, since (a) quartz cement is infrequently observed in sandstones which have never been buried to greater than 70–80uC and (b) fluid inclusions in quartz overgrowths seldom reveal homogenization temperatures below 70–80uC, conceptual models commonly assume that quartz cementation has an effective threshold temperature of around 70– 80uC (Lander and Walderhaug 1999; Walderhaug 2000). Some authors (Girard et al. 2001; Marchand et al. 2002) propose an episodic cementation process once cementation has been initiated, whilst others (Walderhaug 1996; Oelkers et al. 2000) suggest that cementation is a continuous process, with cement developing as a function of both temperature and quartz surface area, and with most cement precipitating between 100 and 120uC. Although many studies suggest that silica is sourced internally within the sandstone as a result of quartz stylolitization, other potential silica sources have also been recognized (see reviews by McBride 1989 and Worden and Morad 2000). Internally, other possible silica sources include recrystallization of biogenic silica (Jahren and Ramm 2000; Goldstein and Rossi 2002; Haddad et al. 2006) and feldspar dissolution (Bjørlykke and Egeberg 1993). Other authors propose a more open chemical system in which silica may be transported from local shale units (e.g., Day-Stirrat et al. 2010); in this scenario, clay-mineral reactions, most notably the transformation of smectite to illite (Hower et al. 1976; van de Kamp 2008), are thought to contribute towards the silica budget. To date, it has proved difficult to validate the precipitation kinetics established for these broadly based quartz cementation models on the microscopic scale at which cement forms. In principle, detailed profiles of either fluid-inclusion and oxygen isotopic data, or both, across single overgrowths can be used to constrain cementation history. However, fluid inclusions occur mainly close to the boundary of overgrowths and detrital grains, and thus constrain only the early phase of cementation (Osborne and Haszeldine 1993). Early isotopic studies isolated whole overgrowths and could not generate temporal data (Lee and Savin 1985; Brint et al. 1991; Aplin and Warren 1994), whilst neither the resolution (20–30 mm) * Present Address: Department of Earth Sciences, Durham University, Durham, DH1 3LE, U.K. { Present Address: TOTAL SA, CSTJF, Avenue Larribau, 64018 Pau, France Published Online: June 2013 Copyright E 2013, SEPM (Society for Sedimentary Geology) 1527-1404/13/083-522/$03.00
-
Upload
truongdieu -
Category
Documents
-
view
217 -
download
3
Transcript of QUARTZ CEMENTATION HISTORY OF SANDSTONES REVEALED …wiscsims/pdfs/Harwood_JSR2013.pdf · quartz...
Journal of Sedimentary Research, 2013, v. 83, 522–530
Research Article
DOI: 10.2110/jsr.2013.29
QUARTZ CEMENTATION HISTORY OF SANDSTONES REVEALED BY HIGH-RESOLUTION SIMS OXYGENISOTOPE ANALYSIS
JOSEPH HARWOOD,1 ANDREW C. APLIN,*1 CLAIRE I. FIALIPS,{1 JAMES E. ILIFFE,2 REINHARD KOZDON,3
TAKAYUKI USHIKUBO,3 AND JOHN W. VALLEY3
1School of Civil Engineering and Geosciences, Newcastle University, Newcastle upon Tyne, NE1 7RU, U.K.2BP Exploration and Production, Sunbury-on-Thames, U.K.
3WiscSIMS, Department of Geoscience, University of Wisconsin, Madison, Wisconsin 53706, U.S.A.
e-mail: [email protected]
ABSTRACT: Evaluating the timing and origin of quartz cement is central to understanding how porosity is lost in sandstonesduring burial. Kinetic models of quartz cementation have been calibrated using large–scale datasets but have never been testedat the microscopic level at which cement forms. Here, we use high-precision, in situ oxygen isotope analyses on sandstone fromthe Jurassic Ness Formation from the North Sea to reveal the growth history of single quartz overgrowths to a resolution of2 mm. Measured d18O(cement) range from +28 to +20% V-SMOW in early to late cement and are consistent with quartzcementation models that propose the bulk of quartz precipitates as a continuous process beginning at 60–70 uC. Quantitative X-ray Diffraction analyses and clay mineralogical analysis of interbedded shales are inconsistent with a silica source from shale,implying that silica for the cement is sourced internally to the sand. These isotope data are broadly consistent with predictive,conceptual quartz cementation models and provide a critical link from micron-scale measurements to basin-scale predictionsand observations.
INTRODUCTION
Since quartz is the most abundant diagenetic mineral in sandstones,constraining the rates and mechanisms of quartz cementation isfundamental to quantifying changes in the physical properties ofsandstones during burial, and central to the prediction of the quality ofmany petroleum reservoirs (Worden and Morad 2000). Many studieshave thus attempted to evaluate the temperature and timing ofprecipitation as well as the origin of silica during the ‘‘cementationwindow,’’ typically through the combined use of fluid-inclusion(Haszeldine et al. 1984; Walderhaug 1994; Wilkinson et al. 1998),petrographic (Blanche and Whitaker 1978; Hogg et al. 1992; Oelkers et al.1996), and isotopic investigations (Brint et al. 1991; Aplin and Warren1994; Williams et al. 1997; Girard et al. 2001; Marchand et al. 2002).
By combining data on fluid inclusions and cement abundance acquiredfrom sandstones buried with well-defined thermal histories to a range oftemperatures, Walderhaug (1994) estimated the rate of quartz cementa-tion as a function of time, temperature, and quartz surface area. Thesedata form the basis of commonly used kinetic models of quartzcementation (Walderhaug 1996; Lander and Walderhaug 1999; Landeret al. 2008). Furthermore, since (a) quartz cement is infrequently observedin sandstones which have never been buried to greater than 70–80uC and(b) fluid inclusions in quartz overgrowths seldom reveal homogenizationtemperatures below 70–80uC, conceptual models commonly assume thatquartz cementation has an effective threshold temperature of around 70–
80uC (Lander and Walderhaug 1999; Walderhaug 2000). Some authors(Girard et al. 2001; Marchand et al. 2002) propose an episodiccementation process once cementation has been initiated, whilst others(Walderhaug 1996; Oelkers et al. 2000) suggest that cementation is acontinuous process, with cement developing as a function of bothtemperature and quartz surface area, and with most cement precipitatingbetween 100 and 120uC.
Although many studies suggest that silica is sourced internally within
the sandstone as a result of quartz stylolitization, other potential silica
sources have also been recognized (see reviews by McBride 1989 and
Worden and Morad 2000). Internally, other possible silica sources include
recrystallization of biogenic silica (Jahren and Ramm 2000; Goldstein
and Rossi 2002; Haddad et al. 2006) and feldspar dissolution (Bjørlykke
and Egeberg 1993). Other authors propose a more open chemical system
in which silica may be transported from local shale units (e.g., Day-Stirrat
et al. 2010); in this scenario, clay-mineral reactions, most notably the
transformation of smectite to illite (Hower et al. 1976; van de Kamp
2008), are thought to contribute towards the silica budget.
To date, it has proved difficult to validate the precipitation kineticsestablished for these broadly based quartz cementation models on themicroscopic scale at which cement forms. In principle, detailed profiles ofeither fluid-inclusion and oxygen isotopic data, or both, across singleovergrowths can be used to constrain cementation history. However, fluidinclusions occur mainly close to the boundary of overgrowths and detritalgrains, and thus constrain only the early phase of cementation (Osborneand Haszeldine 1993). Early isotopic studies isolated whole overgrowthsand could not generate temporal data (Lee and Savin 1985; Brint et al.1991; Aplin and Warren 1994), whilst neither the resolution (20–30 mm)
* Present Address: Department of Earth Sciences, Durham University,
Durham, DH1 3LE, U.K.
{ Present Address: TOTAL SA, CSTJF, Avenue Larribau, 64018 Pau, France
Published Online: June 2013
Copyright E 2013, SEPM (Society for Sedimentary Geology) 1527-1404/13/083-522/$03.00

nor the precision (6 2%; 2SD) of earlier in situ studies by single-collectorsecondary ion mass spectrometer (SIMS) were sufficient to constraingrowth histories (Graham et al. 1996; Williams et al. 1997; Lyon et al.2000; Girard et al. 2001; Marchand et al. 2002).
In this study, we present high-precision, high-accuracy, high-spatial-resolution SIMS analyses on quartz overgrowths from a Jurassicsandstone from the North Sea; similar sandstones have been extensivelycharacterized in previous studies with analysis of bulk samples (Hogg etal. 1992; Hogg et al. 1995; Wilkinson et al. 1998; Walderhaug 2000;Marchand et al. 2002). This study reports the first use of a 2 mm analysisspot across individual quartz overgrowths, a method that delineatessmall-scale oxygen isotope zonation and provides a previously unattain-able record of quartz precipitation history. The isotopic data arecombined with petrographic data from the sands and mineralogical datafrom local shale units to (a) evaluate quartz cementation histories, (b)provide data which help to test commonly used quartz cementationmodels, and (c) constrain likely sources of silica and thus the openness ofthe sand-shale diagenetic system.
MATERIALS AND METHODS
Samples of interbedded sandstone and shale were selected from fourwells penetrating the Ness Formation, part of the Middle Jurassic BrentGroup in the East Shetland Basin and the northern Viking Graben of thenorthern North Sea (Fig. 1). The Brent Group was deposited in a rangeof shallow marine and deltaic environments and comprises five units: theBroom, Rannoch, Etive, Ness, and Tarbert formations (e.g., Brown andRichards 1989; Richards 1992). The post-Brent sediment succession isfully marine. The object of this study, the Ness Formation, includesinterbedded sandstone, siltstone, and shale, and was deposited in a range
of delta-plain and coastal-plain environments (e.g., Brown and Richards1989; Livera 1989; Richards 1992). Composite logs from the wellssampled in this study suggest that the sand-to-shale ratio in the NessFormation is typically 50:50, although a small number of thin coal bedsare present. In hand specimen, sand is fine to medium grained andcommonly contains varying amounts of silt- and clay-grade matrixmaterial.
The quantitative mineralogy of 14 shale units from the four wells wasdetermined using X-ray diffraction. All samples were prepared using thespray-drying technique described by Hillier (2003) with a 20% corundumstandard added to each sample. All analyses were carried out onrandomly oriented powders using Cu-Ka radiation on a PANalyticalX’Pert Pro MPD diffractometer, fitted with an X’Celerator and asecondary monochromator. All analyses were run over a range of 2–70u2h with a nominal step size of 0.0167u 2h and time per step of 100 seconds.The quantitative analysis of the different mineral constituents wascompleted using FullPat, a full-pattern mineral quantification packagedeveloped by Chipera and Bish (2002).
The , 2 mm fractions of the crushed shale samples were separated bycentrifugation of dilute suspensions, prepared as oriented mounts andanalyzed from 2 to 40u 2h after successive (1) air drying, (2) ethyleneglycol saturation (at 60uC for 24 hours), and (3) heat treatment to 375uC(for 1–2 hours). The percentage of illite within the illite–smectite mixed-layer phases (I/S) were determined using the methodology of Moore andReynolds (1997).
For the eight sandstones, total volumes of quartz, porosity, non-quartzminerals, and quartz cement were quantified using a combination ofback-scattered electron (BSE) and cathodoluminescence (SEM-CL)microscopy using a Philips/FEI XL30 Environmental Scanning ElectronMicroscope–Field Emission Gun (XL30 ESEM-FEG). Image analysis
FIG. 1.—Thermal history of the Ness Formation constructed using Genesis 4.8 and calibrated with vitrinite reflectance and measured temperature data. Depths are inmeters below Kelly-Bushing.
QUARTZ CEMENTATION HISTORIES FROM HIGH-RESOLUTION SIMS OXYGEN ISOTOPE ANALYSIS 523J S R
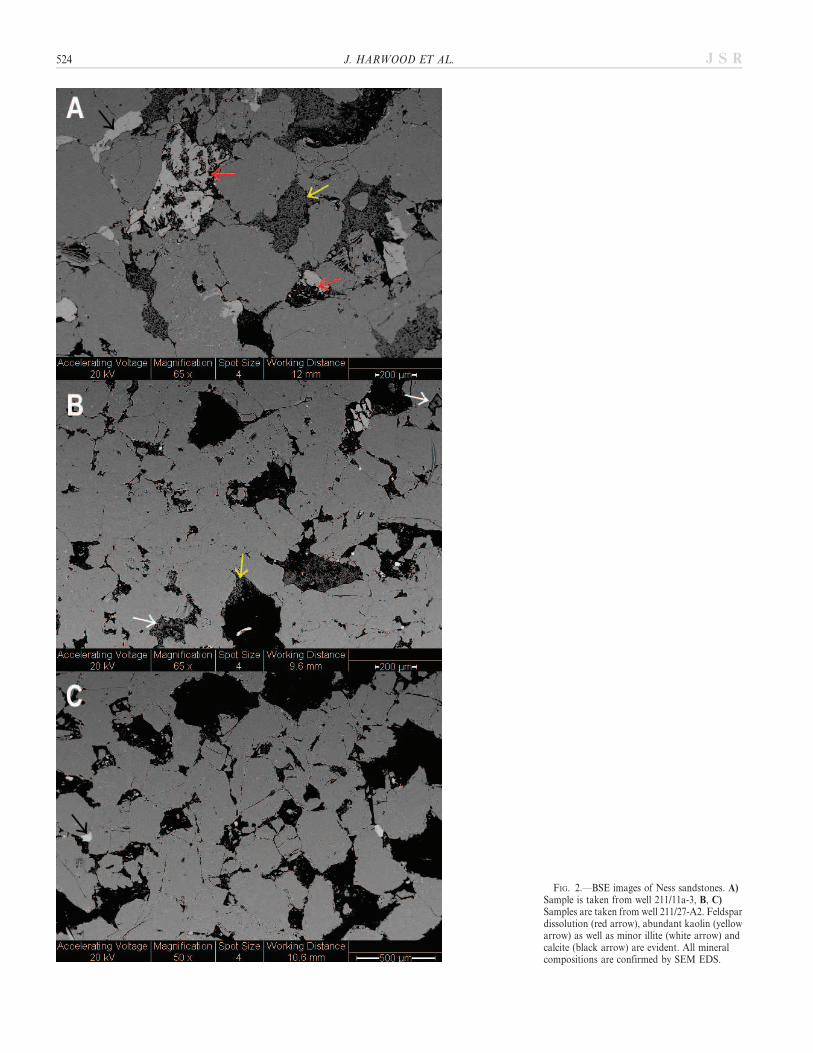
FIG. 2.—BSE images of Ness sandstones. A)Sample is taken from well 211/11a-3, B, C)Samples are taken from well 211/27-A2. Feldspardissolution (red arrow), abundant kaolin (yellowarrow) as well as minor illite (white arrow) andcalcite (black arrow) are evident. All mineralcompositions are confirmed by SEM EDS.
524 J. HARWOOD ET AL. J S R

was carried out according to methods described by Evans et al. (1994) andCooper et al. (2000). The average grain size was determined by measuringthe long axis of 100 randomly selected, non-ductile detrital grains.
Three samples were selected for secondary-ion mass spectrometer(SIMS) analysis, one from well 211/11a-3 and two from well 211/27-A2(Fig. 2). Oxygen isotope ratios were measured on eleven separateovergrowths using a CAMECA IMS-1280 ion microprobe at theWiscSIMS Laboratory, University of Wisconsin–Madison (Kita et al.2009). SEM-CL examination of the analysis pits enabled us to determinewhether the analyzed volume comprised detrital or authigenic quartz, or amixture of both. Analyses of detrital and mixed authigenic–detrital quartzare identified in the Supplementary Material (see Acknowledgments). Fullanalytical details can be found in Kelly et al. (2007), Page et al. (2007),Valley and Kita (2009), Kita et al. (2009), and Pollington et al. (2011).
Stratigraphic data were used in Genesis 4.8, a 1D thermal modelingsoftware, to construct time–temperature histories for all wells. These
histories were calibrated to present-day sample temperatures of 109, 118,122, and 133uC (Fig. 1).
Potential quartz cementation histories were constructed using Walder-haug’s (1996) empirical kinetic model. This predicts the volume of quartzcement precipitated per unit time over a volume of, for example, 1 cm3, asa function of temperature, quartz surface area, and porosity prior to theonset of cementation. Assumptions implicit in the model are thatcementation starts at a threshold temperature and then occurscontinuously through to maximum burial. In this work, we estimatedquartz surface area through the quantitative petrographic analysis of percent detrital quartz and quartz grain size. Initial porosity was taken to bethe minus-cement porosity, and the time–temperature history was derivedfrom the Genesis models. This allows the volume of cement to becalculated as a function of either time or temperature in a specifiedvolume of sandstone. However, in order to compare the micron-scaled18O data with modeled cementation histories, we need to consider howindividual overgrowths have developed through time. We have done thisby assuming that (a) the relative rate of cementation at the scale of asingle overgrowth is the same as the bulk rate predicted by Walderhaug’s(1996) model over a given temperature interval, (b) growth occurs radiallyoutwards from the detrital grain, and (c) growth starts around 80uC andcontinues to maximum (present-day) temperature.
RESULTS
Shale Composition
The main mineralogical components in the shales (Fig. 3) suggest thatany potential mineralogical trends with temperature are concealed bysample heterogeneity. Phyllosilicates are dominated by illite/muscoviteand kaolin, with lesser abundances of illite–smectite (I-S). Mixed layer I-Scontains 64% I at 109uC, increasing to 82% at 133uC (Fig. 3F). K-feldsparis present at all temperatures, but in amounts varying between 0 and 12%(Fig. 3B).
Sandstone Composition
By bulk volume, the sandstone samples consist of 78–84% total quartzwith a mean grain size of 250–300 mm; modal porosities range from 5 to15% (bv). The non-quartz constituent largely comprises K-feldspar withminor calcite; illite and kaolin cements are also observed filling primarymacroporosity. The replacement of feldspar by kaolin is seen commonlyin all samples (Fig. 2). Quartz cement varies from 16 to 23% bv (Fig. 3A),
FIG. 3.—Mineralogical analysis of the Ness Formation. A) Percentage of quartz cement in Ness Formation sandstone based on image analysis of SEM-CL images.Gray crosses are data from similar North Sea Brent Group sandstones (Harris 1992; Walderhaug 1994). B–E) Quantitative bulk mineralogy of Ness shales. F) Percentageof illite in mixed layer illite–smectite of , 2 mm fraction of Ness shales.
FIG. 4.—Measured quartz cement versus quartz cement predicted fromWalderhaug’s (1996) model.
QUARTZ CEMENTATION HISTORIES FROM HIGH-RESOLUTION SIMS OXYGEN ISOTOPE ANALYSIS 525J S R
with more cement at higher temperatures. Measured volumes of quartzcement in the eight sandstone samples studied show reasonable agreementwith the volumes predicted by Walderhaug’s (1996) kinetic model(Fig. 4). SEM-CL shows very limited zonation in quartz overgrowths,although a thin zone of brighter luminescing, authigenic quartz is evident
at the edge of detrital grain 1 and a darker 8 mm zone in grain 2(Fig. 5B). SEM analysis also highlighted the widespread, incipientillitization of kaolin booklets. Furthermore, both fibrous illite andkaolin booklets are enclosed by authigenic quartz overgrowthsthroughout both samples, indicating that quartz continued to precipitateafter the formation of illite and kaolin, and thus after the main phase ofK-feldspar dissolution. Nodular calcite locally occludes porosity andpredates quartz overgrowths. Similar paragenetic sequences wereobserved by both Glasmann et al. (1989) and Harris (1992) in otherBrent sandstones.
Isotopic Composition of Quartz Cement
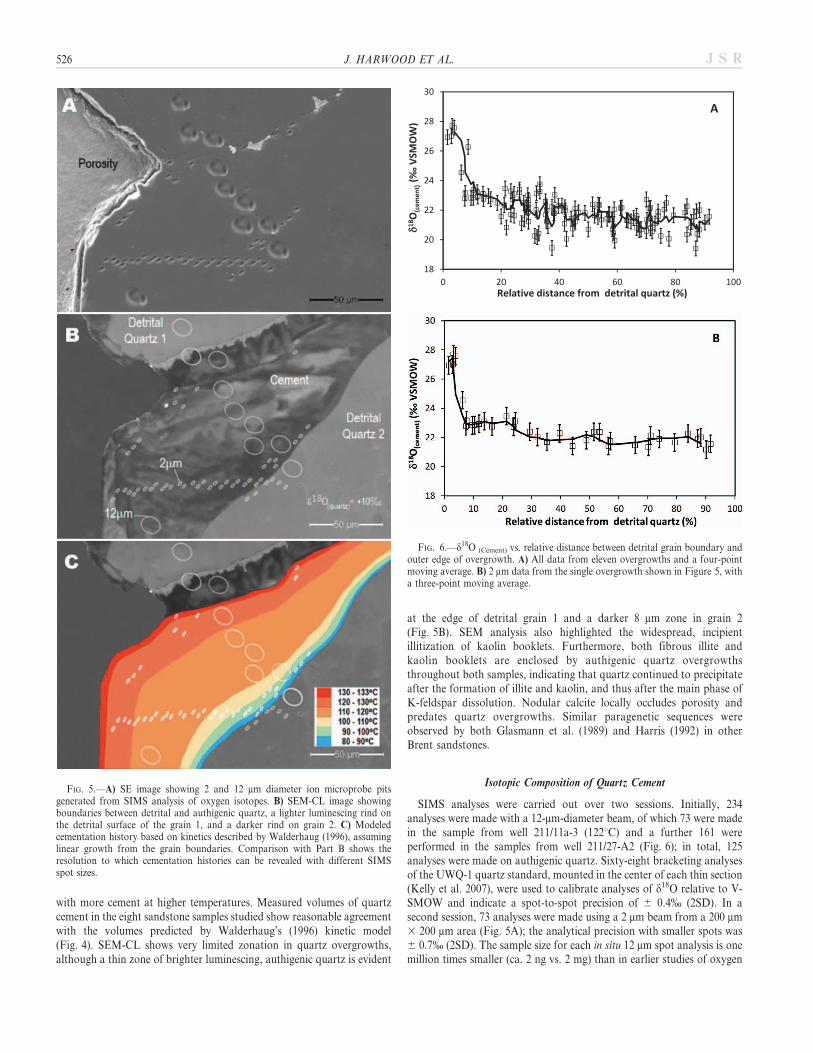
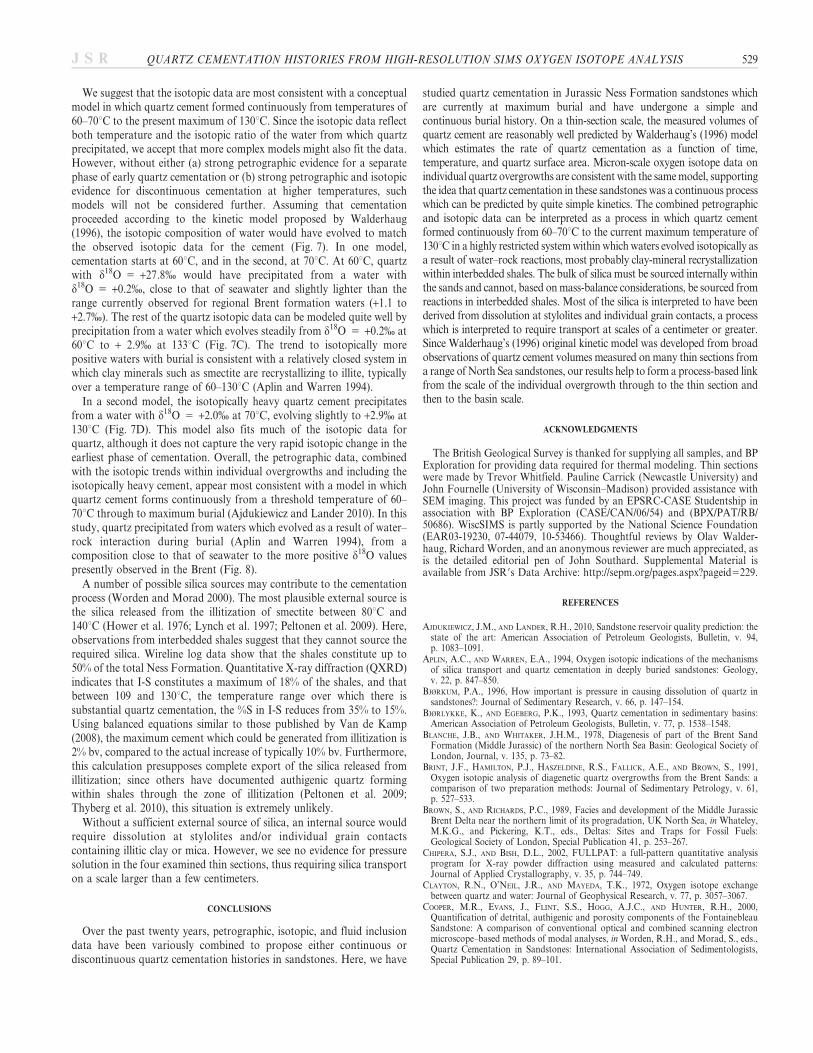
SIMS analyses were carried out over two sessions. Initially, 234analyses were made with a 12-mm-diameter beam, of which 73 were madein the sample from well 211/11a-3 (122uC) and a further 161 wereperformed in the samples from well 211/27-A2 (Fig. 6); in total, 125analyses were made on authigenic quartz. Sixty-eight bracketing analysesof the UWQ-1 quartz standard, mounted in the center of each thin section(Kelly et al. 2007), were used to calibrate analyses of d18O relative to V-SMOW and indicate a spot-to-spot precision of 6 0.4% (2SD). In asecond session, 73 analyses were made using a 2 mm beam from a 200 mm3 200 mm area (Fig. 5A); the analytical precision with smaller spots was6 0.7% (2SD). The sample size for each in situ 12 mm spot analysis is onemillion times smaller (ca. 2 ng vs. 2 mg) than in earlier studies of oxygen
FIG. 6.—d18O (Cement) vs. relative distance between detrital grain boundary andouter edge of overgrowth. A) All data from eleven overgrowths and a four-pointmoving average. B) 2 mm data from the single overgrowth shown in Figure 5, witha three-point moving average.
FIG. 5.—A) SE image showing 2 and 12 mm diameter ion microprobe pitsgenerated from SIMS analysis of oxygen isotopes. B) SEM-CL image showingboundaries between detrital and authigenic quartz, a lighter luminescing rind onthe detrital surface of the grain 1, and a darker rind on grain 2. C) Modeledcementation history based on kinetics described by Walderhaug (1996), assuminglinear growth from the grain boundaries. Comparison with Part B shows theresolution to which cementation histories can be revealed with different SIMSspot sizes.
526 J. HARWOOD ET AL. J S R

isotope ratios that employed fluorination and gas-source mass spectrom-etry (Page et al. 2007). Nevertheless, the slow kinetics of quartzcementation at low temperatures means that even smaller beam sizesare required to resolve the few microns of cement that are predicted toprecipitate in the early phases of cementation. For example, given acementation history based on the kinetics described by Walderhaug(1996), cement has been built up in 10uC increments (Fig. 5C). It isapparent that even a 12 mm SIMS analysis spot cannot resolve cementsformed around or below 80uC under these conditions. In this study, wetherefore used a 2 mm isotopic analysis spot to generate a more detailedcementation history. All analyses of sample and standard are reported inorder of analysis in the Supplementary Material.
Twenty-two analyses were taken from detrital grains across the twosamples; d18O(Quartz) averaged +10.6% V-SMOW, a value very different
from that of the authigenic quartz but characteristic of detrital igneousquartz. In the absence of CL sector zoning, the initial assumption is thatcementation has occurred in an essentially concentric fashion outwardsfrom the edges of detrital quartz grains (e.g., Pollington et al. 2011).Oxygen isotope data are thus plotted as a function of the relative distanceacross the overgrowth (Figs. 6, 7). The data display a remarkable 8.4%range, between +19.3% and +27.7% V-SMOW, although the vastmajority of the data are between +20 and +23.5%. Five 2 mm spotstaken within and close to the darker luminescing cement next to detritalgrain 2 (Fig. 5B) have d18O(Cement) values of +24.5 to +27.7%, valueswhich are also hinted at by the 12 mm data. Whereas it is clear that thetwo points at +27.0 and 27.7% are taken within the darker-luminescingzone, it is impossible to be certain if the two data points between +24.5and +25.2% represent a mixed analysis of two isotopically distinct
FIG. 7.—d18O (Cement) vs. relative distance between detrital grain boundary and outer edge of overgrowth. Filled squares are 2 mm data and open squares are 12 mmdata. The temperature vs. distance is calculated using quartz precipitation kinetics suggested by Walderhaug (1994). Whereas the analytical data in each of the four figuresare identical, each figure has circles which show how the oxygen isotopic composition of quartz would change as a function of temperature and the isotopic compositionof water. A) cementation occurs from 80 to 133uC in a water with a constant isotopic composition of 3.6%; B) a thin zone of cement forms at 30uC in a water withd18O 5 26.1%, and then between 80 and 133uC in a water which evolves from d18O 5 21% to 2.9%; C) cementation occurs between 60 and 133uC in a water whichevolves from d18O 5 0.2% to 2.9%; D) cementation occurs between 70 and 133uC in a water which evolves from d18O 5 2% to 2.9%. See text for further details.
QUARTZ CEMENTATION HISTORIES FROM HIGH-RESOLUTION SIMS OXYGEN ISOTOPE ANALYSIS 527J S R

zones—implying two phases of cementation—or represent part of asingle, continuous cementation history which nevertheless generated twoCL zones.
Beyond the isotopically heavy cement close to the detrital grain, theremaining data fall between +20 and +23.5% (Fig. 6A). Whilst there isvariability in the data, perhaps reflecting the fact that the analyses weremade on eleven overgrowths from two samples, a four-point movingaverage through the data suggests that the main trend is towardsisotopically lighter later cement (Fig. 6A); there is no evidence for eithercyclicity or major breaks in the data.
Given their typical thickness of 50–70 mm, only the 2 mm data canreveal detailed isotopic histories across individual overgrowths. Resultsfor the 2 mm profile taken across the overgrowth in Figure 5 are reportedin Figure 6B. The trends are similar to but smoother than those observedin the full dataset: a sharp decrease from +27.5 to +23.5% over the inner10% of the overgrowth, with a further general decrease to around +21.3%close to the edge of the overgrowth. A three-point moving averagethrough the data indicate some minor fluctuations in the data but revealno evidence of either cyclicity or abrupt shifts.
DISCUSSION
Since d18O(Cement) is a dual function of precipitation temperature andd18O(Water) (Clayton et al. 1972), isotopic data alone cannot define uniquecementation histories. However, they can be used in combination withd18O(Water) values of 26 to 27% for Jurassic meteoric water, 21% forJurassic seawater, and a range of +1.1 to +2.7% for present-dayformation waters in other Brent sandstones (Egeberg and Aagaard1989; Aplin and Warren 1994; Warren and Smalley 1994) to place someimportant constraints on cementation. Precipitation of the last-formedcement with d18O around +21% close to present-day burial temperaturewould occur in a formation water with d18O 5 +2.9%, close to thoseseen in other Brent sands (Fig. 8). However, with a d18O(Cement) of+27.7%, if cementation started at 80uC (Walderhaug 1996), it would haveto occur in a formation water with d18O 5 +3.6%, markedly heavierthan any Brent formation water measured to date. Continuingprecipitation of quartz from 80 to 133uC in formation water withd18O 5 +3.6% would then result in d18O(Cement) around 2% morepositive than actually observed over much of the cementation history
(Fig. 7A). To realistically model the observed quartz-cement isotopedata, the oxygen isotopic composition of the formation waters would alsoneed to reduce from +3.6% at 80uC to around +3.1% at 133uC. Since theoxygen isotope composition of formation waters generally evolve to morepositive values with burial as a result of water–rock reactions (e.g., Aplinand Warren 1994), the assumed value of heavier waters (initiald18O 5 3.6%) during earlier diagenesis is unlikely.
It is more probable that quartz cementation began below the 70–80uCthreshold recognized by current cementation models, as also suggested inseveral previous studies (Morad et al. 1994; Vagle et al. 1994; Kraishan etal. 2000; Marchand et al. 2002; Kelly et al. 2007; Pollington et al. 2011).Since d18O(Cement) is a dual function of temperature and d18O(Water), theisotopic data are inevitably consistent with several scenarios. The early,isotopically heavy cement could have formed in Jurassic meteoric waters(close to 26%) at temperatures around 30uC, with the rest of the cementforming between 80 and 130uC in a water which as a result of water–rockinteraction evolved isotopically from a value of 21.0% (close toseawater) to +2.9% (close to values currently observed in Brentsandstones in this region; Fig. 7B). In this case, silica for the earlycement could have been sourced from the kaolinization of feldspars, aprocess observed both in our samples (Fig. 2) and by others in the Brentdelta (e.g., Wilkinson et al. 2006). Indeed, Wilkinson et al. (2006) showedthat d18O values for Brent vermiform kaolin are consistent withformation at temperatures below 40uC. On the other hand, thepetrographic evidence for a distinctly luminescing early phase of cementresulting from the silica released from K-feldspar dissolution (e.g.,Kraishan et al. 2000) is weak.
Another possible source for the high-d18O early cement is therecrystallization of biogenic silica (Jahren and Ramm 2000; Goldsteinand Rossi 2002; Haddad et al. 2006), for example at 50uC from Jurassicseawater (21%) or at lower temperatures from mixed meteoric water andseawater (Fig. 8). Sands containing biogenic silica generally are depositedin marine environments, whereas the Ness is nonmarine. Nevertheless,coals and shales in the Ness testify to a humid, swampy environment inwhich opaline freshwater algae could have existed. However, althoughMackenzie and Gees (1971) successfully precipitated small amounts ofquartz at low temperatures from seawaters supersaturated with respect toquartz, this reaction results in the formation of microquartz (e.g., Weibelet al. 2010), for which there is no textural evidence in these samples.
FIG. 8.—Plot of d18O(Water) in equilibriumwith quartz cement (d18O (Cement) 5 19.3%,23.5%, 27.0%, and 27.7%, V-SMOW contours)as a function of temperature (Clayton et al.1972). Jurassic meteoric (27%) and marine(21%) water compositions are indicated by thelight shaded region. Modern Brent d18O(Water)
are represented by the diamonds (Warren andSmalley 1994).
528 J. HARWOOD ET AL. J S R
We suggest that the isotopic data are most consistent with a conceptualmodel in which quartz cement formed continuously from temperatures of60–70uC to the present maximum of 130uC. Since the isotopic data reflectboth temperature and the isotopic ratio of the water from which quartzprecipitated, we accept that more complex models might also fit the data.However, without either (a) strong petrographic evidence for a separatephase of early quartz cementation or (b) strong petrographic and isotopicevidence for discontinuous cementation at higher temperatures, suchmodels will not be considered further. Assuming that cementationproceeded according to the kinetic model proposed by Walderhaug(1996), the isotopic composition of water would have evolved to matchthe observed isotopic data for the cement (Fig. 7). In one model,cementation starts at 60uC, and in the second, at 70uC. At 60uC, quartzwith d18O 5 +27.8% would have precipitated from a water withd18O 5 +0.2%, close to that of seawater and slightly lighter than therange currently observed for regional Brent formation waters (+1.1 to+2.7%). The rest of the quartz isotopic data can be modeled quite well byprecipitation from a water which evolves steadily from d18O 5 +0.2% at60uC to + 2.9% at 133uC (Fig. 7C). The trend to isotopically morepositive waters with burial is consistent with a relatively closed system inwhich clay minerals such as smectite are recrystallizing to illite, typicallyover a temperature range of 60–130uC (Aplin and Warren 1994).
In a second model, the isotopically heavy quartz cement precipitatesfrom a water with d18O 5 +2.0% at 70uC, evolving slightly to +2.9% at130uC (Fig. 7D). This model also fits much of the isotopic data forquartz, although it does not capture the very rapid isotopic change in theearliest phase of cementation. Overall, the petrographic data, combinedwith the isotopic trends within individual overgrowths and including theisotopically heavy cement, appear most consistent with a model in whichquartz cement forms continuously from a threshold temperature of 60–70uC through to maximum burial (Ajdukiewicz and Lander 2010). In thisstudy, quartz precipitated from waters which evolved as a result of water–rock interaction during burial (Aplin and Warren 1994), from acomposition close to that of seawater to the more positive d18O valuespresently observed in the Brent (Fig. 8).
A number of possible silica sources may contribute to the cementationprocess (Worden and Morad 2000). The most plausible external source isthe silica released from the illitization of smectite between 80uC and140uC (Hower et al. 1976; Lynch et al. 1997; Peltonen et al. 2009). Here,observations from interbedded shales suggest that they cannot source therequired silica. Wireline log data show that the shales constitute up to50% of the total Ness Formation. Quantitative X-ray diffraction (QXRD)indicates that I-S constitutes a maximum of 18% of the shales, and thatbetween 109 and 130uC, the temperature range over which there issubstantial quartz cementation, the %S in I-S reduces from 35% to 15%.Using balanced equations similar to those published by Van de Kamp(2008), the maximum cement which could be generated from illitization is2% bv, compared to the actual increase of typically 10% bv. Furthermore,this calculation presupposes complete export of the silica released fromillitization; since others have documented authigenic quartz formingwithin shales through the zone of illitization (Peltonen et al. 2009;Thyberg et al. 2010), this situation is extremely unlikely.
Without a sufficient external source of silica, an internal source wouldrequire dissolution at stylolites and/or individual grain contactscontaining illitic clay or mica. However, we see no evidence for pressuresolution in the four examined thin sections, thus requiring silica transporton a scale larger than a few centimeters.
CONCLUSIONS
Over the past twenty years, petrographic, isotopic, and fluid inclusiondata have been variously combined to propose either continuous ordiscontinuous quartz cementation histories in sandstones. Here, we have
studied quartz cementation in Jurassic Ness Formation sandstones whichare currently at maximum burial and have undergone a simple andcontinuous burial history. On a thin-section scale, the measured volumes ofquartz cement are reasonably well predicted by Walderhaug’s (1996) modelwhich estimates the rate of quartz cementation as a function of time,temperature, and quartz surface area. Micron-scale oxygen isotope data onindividual quartz overgrowths are consistent with the same model, supportingthe idea that quartz cementation in these sandstones was a continuous processwhich can be predicted by quite simple kinetics. The combined petrographicand isotopic data can be interpreted as a process in which quartz cementformed continuously from 60–70uC to the current maximum temperature of130uC in a highly restricted system within which waters evolved isotopically asa result of water–rock reactions, most probably clay-mineral recrystallizationwithin interbedded shales. The bulk of silica must be sourced internally withinthe sands and cannot, based on mass-balance considerations, be sourced fromreactions in interbedded shales. Most of the silica is interpreted to have beenderived from dissolution at stylolites and individual grain contacts, a processwhich is interpreted to require transport at scales of a centimeter or greater.Since Walderhaug’s (1996) original kinetic model was developed from broadobservations of quartz cement volumes measured on many thin sections froma range of North Sea sandstones, our results help to form a process-based linkfrom the scale of the individual overgrowth through to the thin section andthen to the basin scale.
ACKNOWLEDGMENTS
The British Geological Survey is thanked for supplying all samples, and BPExploration for providing data required for thermal modeling. Thin sectionswere made by Trevor Whitfield. Pauline Carrick (Newcastle University) andJohn Fournelle (University of Wisconsin–Madison) provided assistance withSEM imaging. This project was funded by an EPSRC-CASE Studentship inassociation with BP Exploration (CASE/CAN/06/54) and (BPX/PAT/RB/50686). WiscSIMS is partly supported by the National Science Foundation(EAR03-19230, 07-44079, 10-53466). Thoughtful reviews by Olav Walder-haug, Richard Worden, and an anonymous reviewer are much appreciated, asis the detailed editorial pen of John Southard. Supplemental Material isavailable from JSR9s Data Archive: http://sepm.org/pages.aspx?pageid5229.
REFERENCES
AJDUKIEWICZ, J.M., AND LANDER, R.H., 2010, Sandstone reservoir quality prediction: thestate of the art: American Association of Petroleum Geologists, Bulletin, v. 94,p. 1083–1091.
APLIN, A.C., AND WARREN, E.A., 1994, Oxygen isotopic indications of the mechanismsof silica transport and quartz cementation in deeply buried sandstones: Geology,v. 22, p. 847–850.
BJØRKUM, P.A., 1996, How important is pressure in causing dissolution of quartz insandstones?: Journal of Sedimentary Research, v. 66, p. 147–154.
BJØRLYKKE, K., AND EGEBERG, P.K., 1993, Quartz cementation in sedimentary basins:American Association of Petroleum Geologists, Bulletin, v. 77, p. 1538–1548.
BLANCHE, J.B., AND WHITAKER, J.H.M., 1978, Diagenesis of part of the Brent SandFormation (Middle Jurassic) of the northern North Sea Basin: Geological Society ofLondon, Journal, v. 135, p. 73–82.
BRINT, J.F., HAMILTON, P.J., HASZELDINE, R.S., FALLICK, A.E., AND BROWN, S., 1991,Oxygen isotopic analysis of diagenetic quartz overgrowths from the Brent Sands: acomparison of two preparation methods: Journal of Sedimentary Petrology, v. 61,p. 527–533.
BROWN, S., AND RICHARDS, P.C., 1989, Facies and development of the Middle JurassicBrent Delta near the northern limit of its progradation, UK North Sea, in Whateley,M.K.G., and Pickering, K.T., eds., Deltas: Sites and Traps for Fossil Fuels:Geological Society of London, Special Publication 41, p. 253–267.
CHIPERA, S.J., AND BISH, D.L., 2002, FULLPAT: a full-pattern quantitative analysisprogram for X-ray powder diffraction using measured and calculated patterns:Journal of Applied Crystallography, v. 35, p. 744–749.
CLAYTON, R.N., O’NEIL, J.R., AND MAYEDA, T.K., 1972, Oxygen isotope exchangebetween quartz and water: Journal of Geophysical Research, v. 77, p. 3057–3067.
COOPER, M.R., EVANS, J., FLINT, S.S., HOGG, A.J.C., AND HUNTER, R.H., 2000,Quantification of detrital, authigenic and porosity components of the FontainebleauSandstone: A comparison of conventional optical and combined scanning electronmicroscope–based methods of modal analyses, in Worden, R.H., and Morad, S., eds.,Quartz Cementation in Sandstones: International Association of Sedimentologists,Special Publication 29, p. 89–101.
QUARTZ CEMENTATION HISTORIES FROM HIGH-RESOLUTION SIMS OXYGEN ISOTOPE ANALYSIS 529J S R
DAY-STIRRAT, R.J., MILLIKEN, K.L., DUTTON, S.P., LOUCKS, R.G., HILLIER, S., APLIN,A.C., AND SCHLEICHER, A.M., 2010, Open-system chemical behavior in deep WilcoxGroup mudstones, Texas Gulf Coast, USA: Marine and Petroleum Geology, v. 27,p. 1804–1818.
EGEBERG, P.K., AND AAGAARD, P., 1989, Origin and evolution of formation waters fromoil fields on the Norwegian shelf: Applied Geochemistry, v. 4, p. 131–142.
EVANS, J., HOGG, A.J.C., HOPKINS, M.S., AND HOWARTH, R.J., 1994, Quantification ofquartz cements using combined SEM, CL, and image analysis: Journal ofSedimentary Research v. A 64, p. 334–338.
GIRARD, J.P., MUNZ, I.A., JOHANSEN, H., HILL, S., AND CANHAM, A., 2001, Conditionsand timing of quartz cementation in Brent reservoirs, Hild Field, North Sea:constraints from fluid inclusions and SIMS oxygen isotope microanalysis: ChemicalGeology, v. 176, p. 73–92.
GLASMANN, J.R., CLARK, R.A., LARTER, S., BRIEDIS, N.A., AND LUNDEGARD, P.D., 1989,Diagenesis and hydrocarbon accumulation, Brent Sandstone (Jurassic), Bergen HighArea, North Sea: American Association of Petroleum Geologists, Bulletin, v. 73,p. 1341–1360.
GOLDSTEIN, R.H., AND ROSSI, C., 2002, Recrystallization in quartz overgrowths: Journalof Sedimentary Research, v. 72, p. 432–440.
GRAHAM, C.M., VALLEY, J.W., AND WINTER, B.L., 1996, Ion microprobe analysis of18O/16O in authigenic and detrital quartz in the St. Peter Sandstone, Michigan Basinand Wisconsin Arch, USA: contrasting diagenetic histories: Geochimicaet Cosmochimica Acta, v. 60, p. 5101–5116.
HADDAD, S.C., WORDEN, R.H., PRIOR, D.J., AND SMALLEY, P.C., 2006, Quartz cement inthe Fontainebleau Sandstone, Paris Basin, France: crystallography and implicationsfor mechanisms of cement growth: Journal of Sedimentary Research, v. 76, p. 244–256.
HARRIS, N.B., 1992, Burial diagenesis of Brent sandstones: a study of Statfjord, Huttonand Lyell fields, in Morton, A.C., Haszeldine, R.S., Giles, M.R., and Brown, S., eds.,Geology of the Brent Group: Geological Society of London, Special Publication 61,p. 351–375.
HASZELDINE, R.S., SAMSON, I.M., AND CORNFORD, C., 1984, Dating diagenesis in apetroleum basin, a new fluid inclusion method: Nature, v. 307, p. 354–357.
HILLIER, S., 2003, Quantitative analysis of clay and other minerals in sandstones by X-ray powder diffraction (XRPD), in Worden, R.H., and Morad, S., eds., Clay MineralCements in Sandstones: International Association of Sedimentologists, SpecialPublication 34, p. 213–251.
HOGG, A.J.C., SELLIER, E., AND JOURDAN, A.J., 1992, Cathodoluminescence of quartzcements in Brent Group sandstones, Alwyn South, UK North Sea, in Morton, A.C.,Haszeldine, R.S., Giles, M.R., and Brown, S., eds., Geology of the Brent Group:Geological Society of London, Special Publication 61, p. 421–440.
HOGG, A.J.C., PEARSON, M.J., FALLICK, A.E., AND HAMILTON, P.J., 1995, An integratedthermal and isotopic study of the diagenesis of the Brent group, Alwyn South, U.K.North Sea: Applied Geochemistry, v. 10, p. 531–546.
HOWER, J., ESLINGER, E.V., HOWER, M.E., AND PERRY, E.A., 1976, Mechanism of burialmetamorphism of argillaceous sediment: 1. Mineralogical and chemical evidence:Geological Society of America, Bulletin, v. 87, p. 725–737.
JAHREN, J., AND RAMM, M., 2000, The porosity-preserving effects of microcrystallinequartz coating in arenitic sandstones: Examples from the Norwegian continental shelf,in Worden, R.H., and Morad, S., eds., Quartz Cementation in Sandstones:International Association of Sedimentologists, Special Publication 29, p. 271–280.
KELLY, J.L., FU, B., KITA, N.T., AND VALLEY, J.W., 2007, Optically continuous silcretequartz cements of the St. Peter Sandstone: High precision oxygen isotope analysis byion microprobe: Geochimica et Cosmochimica Acta, v. 71, p. 3812–3832.
KITA, N.T., USHIKUBO, T., FU, B., AND VALLEY, J.W., 2009, High precision SIMS oxygenisotope analysis and the effect of sample topography: Chemical Geology, v. 264,p. 43–57.
KRAISHAN, G.M., REZAEE, M.R., AND WORDEN, R.H., 2000, Significance of traceelement composition of quartz cement as a key to reveal the origin of silica insandstones: an example from the Cretaceous of the Barrow Sub-Basin, WesternAustralia, in Worden, R.H., and Morad, S., eds., Quartz Cementation in Sandstones:International Association of Sedimentologists, Special Publication 29, p. 317–331.
LANDER, R.H., AND WALDERHAUG, O., 1999, Predicting porosity through simulatingsandstone compaction and quartz cementation: American Association of PetroleumGeologists, Bulletin, v. 83, p. 433–449.
LANDER, R.H., LARESE, R.E., AND BONNELL, L.M., 2008, Toward more accurate quartzcement models: the importance of euhedral versus noneuhedral growth rates:American Association of Petroleum Geologists, Bulletin, v. 92, p. 1537–1563.
LEE, M., AND SAVIN, S.M., 1985, Isolation of diagenetic overgrowths on quartz sandgrains for oxygen isotopic analysis: Geochimica et Cosmochimica Acta, v. 49, p. 497–501.
LIVERA, S.E., 1989, Facies associations and sand-body geometries in the Ness Formationof the Brent Group, Brent Field, in Whateley, M.K.G., and Pickering, K.T., eds.,Deltas: Sites and Traps for Fossil Fuels: Geological Society of London, SpecialPublication 41, p. 269–286.
LYNCH, F.L., MACK, L.E., AND LAND, L.S., 1997, Burial diagenesis of illite/smectite inshales and the origins of authigenic quartz and secondary porosity in sandstones:Geochimica et Cosmochimica Acta, v. 61, p. 1995–2006.
LYON, I.C., BURLEY, S.D., MCKEEVER, P.J., SAXTON, J.M., AND MACaULAY, C., 2000,Oxygen isotope analysis of authigenic quartz in sandstones: a comparison of ionmicroprobe and conventional analytical techniques, in Worden, R.H., and Morad, S.,eds., Quartz Cementation in Sandstones: International Association of Sedimentolo-gists, Special Publication 29, p. 299–316.
MACKENZIE, F.T., AND GEES, R., 1971, Quartz: synthesis at Earth-surface conditions:Science, v. 173, p. 533–535.
MARCHAND, A.M.E., MACAULAY, C.I., HASZELDINE, R.S., AND FALLICK, A.E., 2002, Porewater evolution in oilfield sandstones: constraints from oxygen isotope microanalysesof quartz cement: Chemical Geology, v. 191, p. 285–304.
MCBRIDE, E.F., 1989, Quartz cement in sandstones: a review: Earth-Science Reviews,v. 26, p. 69–112.
MOORE, D.M., AND REYNOLDS, R.C.J., 1997, X-Ray Diffraction and the Identificationand Analysis of Clay Minerals: New York, Oxford University Press, 378 p.
MORAD, S., ISMAIL, H.N.B., DE ROS, L.F., AL-AASM, I.S., AND SERRHINI, N.E., 1994,Diagenesis and formation water chemistry of Triassic reservoir sandstones fromsouthern Tunisia: Sedimentology, v. 41, p. 1253–1272.
OELKERS, E.H., BJØRKUM, P.A., AND MURPHY, W.M., 1996, A petrographic andcomputational investigation of quartz cementation and porosity reduction in NorthSea sandstones: American Journal of Science, v. 296, p. 420–452.
OELKERS, E.H., BJØRKUM, P.A., WALDERHAUG, O., NADEAU, P.H., AND MURPHY, W.M.,2000, Making diagenesis obey thermodynamics and kinetics: the case of quartzcementation in sandstones from offshore mid-Norway: Applied Geochemistry, v. 15,p. 295–309.
OSBORNE, M., AND HASZELDINE, S., 1993, Evidence for resetting of fluid inclusiontemperatures from quartz cements in oilfields: Marine and Petroleum Geology, v. 10,p. 271–278.
PAGE, F.Z., USHIKUBO, T., KITA, N.T., RICIPUTI, L.R., AND VALLEY, J.W., 2007, High-precision oxygen isotope analysis of picogram samples reveals 2 mm gradients andslow diffusion in zircon: American Mineralogist, v. 92, p. 1772–1775.
PELTONEN, C., MARCUSSEN, Ø., BJØRLYKKE, K., AND JAHREN, J., 2009, Clay mineraldiagenesis and quartz cementation in mudstones: The effects of smectite to illitereaction on rock properties: Marine and Petroleum Geology, v. 26, p. 887–898.
POLLINGTON, A.D., KOZDON, R., AND VALLEY, J.W., 2011, Evolution of quartzcementation during burial of the Cambrian Mount Simon Sandstone, Illinois Basin:in situ microanalysis of d18O: Geology, v. 39, p. 1119–1122.
RICHARDS, P.C., 1992, An introduction to the Brent Group: a literature review, inMorton, A.C., Haszeldine, R.S., Giles, M.R., and Brown, S., eds., Geology of theBrent Group: Geological Society of London, Special Publication 61, p. 15–26.
THYBERG, B., JAHREN, J., WINJE, T., BJØRLYKKE, K., FALEIDE, J.I., AND MARCUSSEN, Ø.,2010, Quartz cementation in Late Cretaceous mudstones, northern North Sea:changes in rock properties due to dissolution of smectite and precipitation of micro-quartz crystals: Marine and Petroleum Geology, v. 27, p. 1752–1764.
VAGLE, G.B., HURST, A., AND DYPVIK, H., 1994, Origin of quartz cements in somesandstones from the Jurassic of the Inner Moray Firth (UK): Sedimentology, v. 41,p. 363–377.
VALLEY, J.W., AND KITA, N.T., 2009, In situ oxygen isotope geochemistry by ionmicroprobe, in Fayek, M., ed., Secondary Ion Mass Spectrometry in the EarthSciences: Gleaning the Big Picture from a Small Spot: Mineralogical AssociationCanada, Short Course 41, p. 19–63.
VAN DE KAMP, P.C., 2008, Smectite–Illite–Muscovite transformations, quartz dissolu-tion, and silica release in shales: Clays and Clay Minerals, v. 56, p. 66–81.
WALDERHAUG, O., 1994, Precipitation rates for quartz cement in sandstones determinedby fluid-inclusion microthermometry and temperature-history modeling: Journal ofSedimentary Research 64, p. 324–333.
WALDERHAUG, O., 1996, Kinetic modeling of quartz cementation and porosity loss indeeply buried sandstone reservoirs: American Association of Petroleum Geologists,Bulletin, v. 80, p. 731–745.
WALDERHAUG, O., 2000, Modeling quartz cementation and porosity in Middle JurassicBrent Group sandstones of the Kvitebjørn field, northern North Sea: AmericanAssociation of Petroleum Geologists, Bulletin, v. 84, p. 1325–1339.
WARREN, E.A., AND SMALLEY, P.C., eds., 1994, North Sea Formation Waters Atlas:Geological Society of London, Memoir 15, 208p.
WEIBEL, R., FRIIS, H., KAZEROUNI, A.M., SVENDSEN, J.B., STOKKENDAL, J., AND POULSEN,M.L.K., 2010, Development of early diagenetic silica and quartz morphologies—examples from the Siri Canyon, Danish North Sea: Sedimentary Geology, v. 228,p. 151–170.
WILKINSON, J.J., LONERGAN, L., FAIRS, T., AND HERRINGTON, R.J., 1998, Fluid inclusionconstraints on conditions and timing of hydrocarbon migration and quartzcementation in Brent Group reservoir sandstones, Columba Terrace, northern NorthSea, in Parnell, J., ed., Dating of Fluid Flow and Fluid–Rock Interaction: GeologicalSociety of London, Special Publication 144, p. 69–89.
WILKINSON, M., HASZELDINE, R.S., AND FALLICK, A.E., 2006, Jurassic and Cretaceousclays of the northern and central North Sea hydrocarbon reservoirs reviewed: ClayMinerals, v. 41, p. 151–186.
WILLIAMS, L.B., HERVIG, R.L., AND BJØRLYKKE, K., 1997, New evidence for the origin ofquartz cements in hydrocarbon reservoirs revealed by oxygen isotope microanalyses:Geochimica et Cosmochimica Acta, v. 61, p. 2529–2538.
WORDEN, R.H., AND MORAD, S., 2000, Quartz cementation in oil field sandstones: Areview of the key controversies, in Worden, R.H., and Morad, S., eds., QuartzCementation in Sandstones: International Association of Sedimentologists, SpecialPublication 29, p. 1–2.
Received 12 October 2011; accepted 20 December 2012.
530 J. HARWOOD ET AL. J S R