Effects of Feeding Field Peas on Fresh Beef Quality
84
University of Nebraska - Lincoln DigitalCommons@University of Nebraska - Lincoln eses and Dissertations in Animal Science Animal Science Department 12-2016 Effects of Feeding Field Peas on Fresh Beef Quality Hope Voegele University of Nebraska-Lincoln, [email protected] Follow this and additional works at: hp://digitalcommons.unl.edu/animalscidiss Part of the Meat Science Commons is Article is brought to you for free and open access by the Animal Science Department at DigitalCommons@University of Nebraska - Lincoln. It has been accepted for inclusion in eses and Dissertations in Animal Science by an authorized administrator of DigitalCommons@University of Nebraska - Lincoln. Voegele, Hope, "Effects of Feeding Field Peas on Fresh Beef Quality" (2016). eses and Dissertations in Animal Science. 132. hp://digitalcommons.unl.edu/animalscidiss/132
Transcript of Effects of Feeding Field Peas on Fresh Beef Quality

University of Nebraska - LincolnDigitalCommons@University of Nebraska - Lincoln
Theses and Dissertations in Animal Science Animal Science Department
12-2016
Effects of Feeding Field Peas on Fresh Beef QualityHope VoegeleUniversity of Nebraska-Lincoln, [email protected]
Follow this and additional works at: http://digitalcommons.unl.edu/animalscidiss
Part of the Meat Science Commons
This Article is brought to you for free and open access by the Animal Science Department at DigitalCommons@University of Nebraska - Lincoln. It hasbeen accepted for inclusion in Theses and Dissertations in Animal Science by an authorized administrator of DigitalCommons@University of Nebraska- Lincoln.
Voegele, Hope, "Effects of Feeding Field Peas on Fresh Beef Quality" (2016). Theses and Dissertations in Animal Science. 132.http://digitalcommons.unl.edu/animalscidiss/132
EFFECTS OF FEEDING FIELD PEAS ON FRESH BEEF QUALITY
by
Hope Voegele
A THESIS
Presented to the Faculty of
The Graduate College at the University of Nebraska
In Partial Fulfillment of Requirements
For the Degree of Master of Science
Major: Animal Science
Under the Supervision of Professor Chris R. Calkins
Lincoln, Nebraska
December, 2016
ii
EFFECTS OF FEEDING FIELD PEAS ON FRESH BEEF QUALITY
Hope Voegele, M.S.
University of Nebraska, 2016
Advisor: Chris Calkins
The objective of this study was to evaluate the use of field peas during two phases of
production (grazing and finishing) on fresh beef quality. A total of 232 crossbred steers
and heifers were randomly assigned to one of six dietary treatments in a 3x2 factorial
consisting of 3 pasture and 2 finishing supplementations. The pasture phase consisted of
1) no supplement, 2) field peas at 0.5% BW, or 3) dry-rolled corn supplement at 0.5% of
BW. The finishing phase consisted of 1) field peas at 20% DM or 2) no field peas.
During this two-year study, steers (year 1) and heifers (year 2), strip loin samples were
aged for 14 d. Steaks were subject to retail display for a total of 7 d. Analyses included
tenderness (WBSF and SSF), objective (L*, a*, and b*) and subjective color, lipid
oxidation (TBARS) and fatty acid composition. There were minimal effects due to diet.
Dietary treatment had no effect on tenderness (WBSF or SSF) or content of saturated
fatty acids, unsaturated fatty acids, monounsaturated fatty acids or polyunsaturated fatty
acids (p > 0.05). Although there was a significant interaction between pasture and
finishing treatments for fatty acid C15:1 (p = 0.0331), the range in values was relative
low and no implications from these differences could be identified. Supplementing cattle
on pasture with field peas resulted in more C18:2 (p = 0.0381) fatty acids than when
cattle were supplemented with corn, while cattle without supplement were intermediate.
Meat from cattle finished with field peas had slightly greater lipid oxidation than samples

iii
from cattle not receiving field peas during finishing (1.56 vs. 1.44 mg malonaldehyde/kg
tissue, respectively; p = 0.0541). Discoloration, L*, and a* displayed a triple interactions
for retail display, pasture and finishing diets (p < 0.0001, p = 0.0524 and p = 0.024,
respectively). Although these interactions were statistically significant, no consistent
patterns could be identified. These data indicate field peas may be used for cattle with
minimal negative impact on fresh meat quality.
Keyword: Beef, fatty acid composition, field peas

ACKNOWLEDGMENTS
The successful completion of a graduate degree is contingent upon the support,
advice, and guidance of many people and it is my pleasure to thank those who have made
this thesis possible.
I am thankful to my fellow Aggies from Texas A&M University, all of who
sparked my interest in meat judging and meat science, prior to coming to Nebraska. In
particular, I want to thank my meat judging coaches – Meagan Haymes and Melanie
Light – who provided me countless opportunities while judging, which ultimately led me
to pursue a career in meat science. In addition, I thank my mentors – Dr.’s Mark and
Leslie Frenzel and Dr. Lindsey Ulbrich – for their continued support and encouragement
regardless of the time that has passed or the distance between us.
I am grateful for my advisor, Dr. Chris Calkins, who has thankfully had the
patience to put up with my sarcasm and stubbornness since day one. I have truly enjoyed
the opportunity to work with him and his assistance in my graduate career has been more
valuable than he will ever realize. It has also been an honor to have Dr. Steven Jones and
Dr. Dennis Burson on my committee. Both of these men have challenged me to grow
intellectually and broaden my experiences in and outside of the classroom. Having the
ability to learn from these three professors has provided me with a greater understanding
and appreciation of meat science.
Perhaps even more importantly, I must thank my fellow graduate students, not
only for their assistance with my research, but also their friendship and support. The
group of students that have made this trek with me – Emery Kunze, Kelly McCarty, Chad
Bower, Joe Buntyn, Regan Stanley, Sara Sieren, Michael Chao, Alessandra Rosa, Keni

ii
Nubiato, and Felipe Ribeiro - have become my second family and I will forever be
thankful for each of them. I would like to especially thank Katherine Domenech-Peres, as
she has been an outstanding mentor and has always reminded me to be positive regardless
of stress or circumstances. I doubt we will remember the stressful times and all the long
hours, but I will always be thankful for the trips to the lake, the barbeques and quite a few
office pranks. I could not rightly claim my success without the help of these students.
Furthermore, I want to thank Tommi Jones for her assistance with my lab work,
as well as her patience as I learned protocols and even becoming a soundboard when I
needed to vent. I greatly appreciate Sherri Pitchie for always being available to give
advice and answer my questions, no matter how minor. I must thank Calvin Schrock for
teaching me new perspectives in the meat lab and having the ability to speak fluent
sarcasm. Moreover, I would like to thank those undergraduate students on my quiz bowl
team who allowed me to teach and mentor to them and regardless of my stress level,
could always make me laugh.
I would like to extend my gratitude to Dr. Jim MacDonald, Karla Jenkins, Matt
Luebbe and Hannah Greenwell, as these are the people responsible for initiating the
project and securing funding as well as feeding and maintaining the cattle. Thank you to
the donors of Helen R. Sampson Memorial Fund, Frances Jorgenson Research Fund,
Ralph H. Bainbridge Memorial Fund, and Helen Porter Van Spronssen Charitable Trust
Fund, which helped make this project possible.
Lastly, I would like to thank my family, especially my parents, for their support
during my time spent in Nebraska. Although they still believe my career choices are

iii
limited to being a skilled butcher or a meat inspector and my siblings believe that what I
do is gross, I will never be able to say that I have boring conversations when I visit home.
I know that without your support and my faith in the Lord, I would not be where I am
today and I will remember this long after this thesis has collected dust on a shelf.
iv
TABLE OF CONTENTS
INTRODUCTION………………………………………………………….……2
LITERATURE REVIEW………………………………………………………..3
Field Peas………………………………………………………………...3
Nutrients in Field Pea…………………………………………………….5
Field Peas in Ruminant’s Diet…………………………………………...9
Beef Cattle Creep Feed Diets…………………………………….9
Beef Cattle Receiving Diets……………………………………...10
Beef Cattle Growing Diets……………………………………….11
Beef Cattle Finishing Diets………………………………………12
Dairy Cattle………………………………………………………13
Lamb Diets……………………………………………………….14
Effects of Processing.………………………………………….…14
Field Peas in Monogastric’s Diet………………………………………...15
Swine Diets………………………………………………………15
Poultry Diets…………………………………………………..…17
Carcass Characteristics, Meat Quality & Sensory Attributes……………18
Conclusions………………………………………………………………20
MATERIALS AND METHODS………………………………………………...21
Sampling and Experimental Design…………………………………...…21
Fabrication……………………………………………………………….22
Retail Display……………………………………………………………23
Objective and Subjective Color………………………………………….23

v
Tenderness Evaluation…………………………………………………...24
Lipid Oxidation…………………………………………………………..25
Fatty Acid Analysis………………………………………………………25
Proximate Analysis………………………………………………………27
Statistical Analysis…………………………………………………….…27
LITERATURE CITED…………………………………………………………..28
MANUSCRIPT………………………………………………………………..…35
Abstract………………………………………………………………..…36
Introduction………………………………………………………………37
Materials and Methods………………………………………………...…38
Results & Discussion…………………………………………………….44
Conclusion……………………………………………………………….47
Literature Cited………………………………………………………..…49
Tables………………….…………………………………………………52
Figures……………………………………………………………………57
RECOMMENDATIONS FOR FUTURE RESEARCH…………………………60
APPENDIX I: Dietary Treatment (Experiment 1 & 2)………………….62
APPENDIX II: Number of Cattle per Treatment………………………..63
APPENDIX III: Quality Grade Assessment…………………………….64
APPENDIX IV: Color and Discoloration.................................................65
APPENDIX V: Lipid Oxidation: Thiobarbituric Acid Assay Protocol….69
APPENDIX VI: Fatty Acid Determination……………………………...71
APPENDIX VII: Fat extraction with Soxhlet method…………….…….72

vi
APPENDIX VIII: a* Values Table………………………………………73
APPENDIX IX: b* Values Table ……………………………………….74
APPENDIX X: Discoloration Figure………………………………….…75
APPENDIX XI: L* Figure ………………………………………………76
2
INTRODUCTION
The overall goal of this study was to determine the impacts on fresh beef quality
from cattle being fed field peas (Pisum sativum) in a crested wheatgrass pasture
production system and subsequent use in the feedlot. In recent years, field pea production
has grown rapidly within the northern Great Plains. Reasons for increased production
include adaptability to the climate and agronomic benefits including fixing nitrogen in
soil. As the availability of field peas increase, the portion of the crop that does not meet
quality standards for human consumption are being considered as an alternate nutritional
feedstuff in livestock production.
Due to the nutritional value, field peas have been used as a protein supplement in
ruminants (Soto-Navarro et al., 2011; Vander Pol et al., 2008, 2009) and as an energy
source for monogastrics (Smith et al., 2013). Slight to no differences have been found
with the inclusion of field peas on carcass quality or yield grades (Pesta et al., 2012).
Researchers have also focused on tenderness differences and results indicate that dietary
inclusion of field peas does not negatively impact beef palatability (Jenkins et al., 2011).
To date, shelf-life studies and fatty acid profile determination of beef fed field peas has
not yet beef defined. Overall, there is plenty of data that has been published to determine
the effects of field peas in various beef production environments but very few studies
have examined the effects on fresh meats, even fewer have assessed fresh meats
characteristics past tenderness determinations.
The objective of this study was to determine the impacts of field peas on meat
quality. More specifically, evaluation for treatment differences on 1) Warner-Bratzler
Shear Force and Slice Shear Force as indications of tenderness, 2) fatty acid profile of the

3
muscle, and 3) impacts on retail display and fat oxidation which impacts shelf-life and
consumer acceptance of fresh beef.
REVIEW OF LITERATURE
I. Field Peas
Field peas (Pisum sativum) are rapidly becoming a significant crop in the
Midwest and northern Great Plains of the United States and consequently have become
an interest for both agronomists and livestock producers (Stein et al., 2004; Lardy et al.,
2009). Pea cultivation and selection has led to various benefits of the crop including
agronomic suitability and improved nutritional content of the seed. Annual production of
field pea is used for multiple purposes including commercial, forage, rotational and cover
crops (Ingels et al., 1994; Chen et al., 2006; Clark, 2007; Elzebroek and Wind, 2008).
During harvest, field peas that are rejected from human consumption become a source of
protein, carbohydrates, and amino acids in various livestock diets (Anderson et al., 2007).
All peas belong to the same species, Pisum savitum, and they are an annual cool-
season legume crop that is grown in temperate climates around the world. Peas are
planted in both spring and fall. “Field peas” refers to two types: winter and spring; and
are also known as Austrian winter peas (black peas) and Canadian field peas, respectively
(Bowman et al., 2012). The color, shape and size of the seed range in different production
settings. Initially, varieties of peas were distinguished based on the purpose of the end
product. According to Davies (1976), the subspecies Arvense, typically grown in fields,
was used for animal feed and characterized by long vines, colored flowers, small pods,
and dark seeds. The subspecies Hortense, commonly known as garden peas, were
4
identified with white flowers and large green or yellow seeds and were typically used for
monogastric livestock or included in the human diet. Lastly, the subspecies Axiphium, or
sugar peas, were grown for human consumption alone due to edible pods.
Peas grow best in fertile, well-drained soils with approximately 16-39 inches of
annual precipitation. Pea plants grow optimally at temperatures of 12 to 17°C; however,
uncovered peas can withstand temperatures as low as -10°C and if covered with snow,
may tolerate temperatures as low as -30°C (Hartmann et al., 1998; Elzebroek and Wind,
2008). Winter peas, or fall-planted seeds, have a growing season of 300-320 days
whereas spring peas, or spring-planted peas have a growing season of approximately 60-
150 days. This includes phases from planting through flowering (Pavec, 2012).
Field peas grown as a forage crop may be grown alone or with cereals for silage
and green fodder (Elzerbroek and Wind, 2008). Peas can also be grazed while in the field
and will regrow after being grazed multiple times (Clark, 2007). Peas and other legumes
are desired as a rotational crop because they have the ability to break up disease and pest
cycles, improve soil microbe diversity and activity, improve soil aggregation, and provide
nitrogen (Biederbeck et al., 2005; Chen et al., 2006). Lastly, field peas are grown as
green manures and cover crops especially for their nitrogen-fixing capabilities. Pea roots
have nodules, formed by the bacteria Rhizobium leguminosarum, which converts
atmospheric nitrogen (N2) to ammonia (NH3). Pea plants also produce an abundance of
vines that breakdown quickly and provide additional nitrogen (Sarrantonio and Gallandt,
1994, as cited by Clark, 2007). Austrian winter peas are the most common type of pea
used as a cover crop as they adapt to cold temperatures and fit in many crop rotations.
5
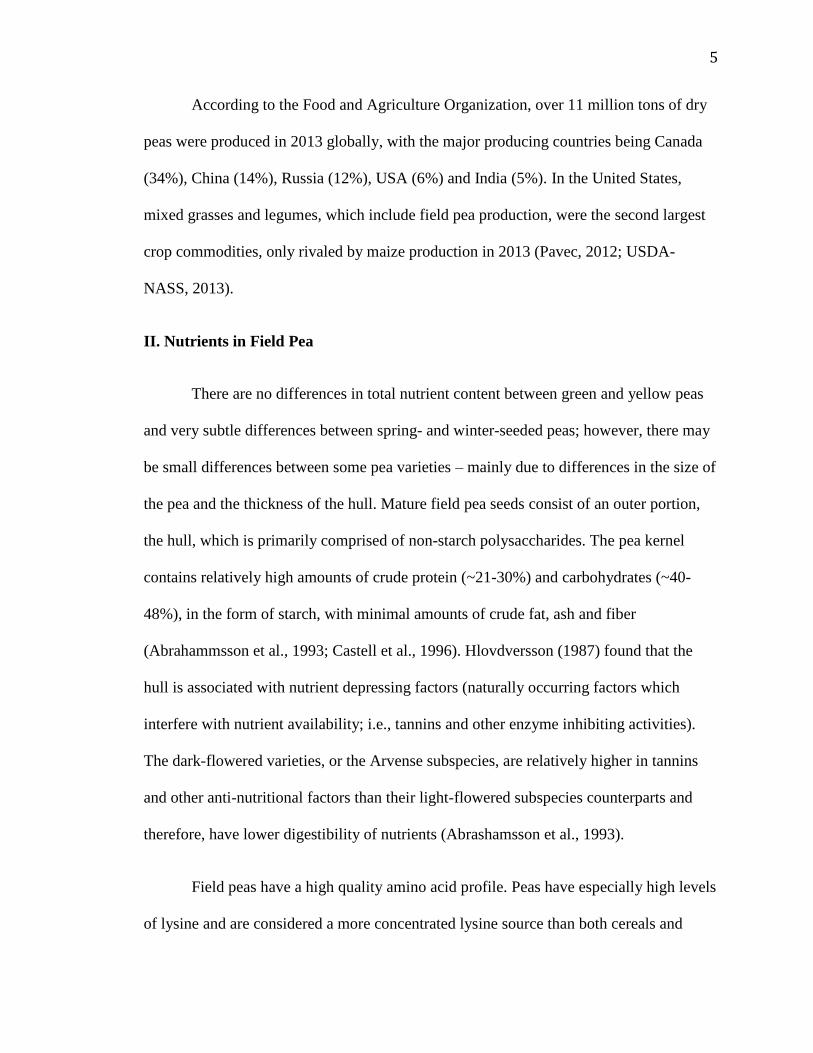
According to the Food and Agriculture Organization, over 11 million tons of dry
peas were produced in 2013 globally, with the major producing countries being Canada
(34%), China (14%), Russia (12%), USA (6%) and India (5%). In the United States,
mixed grasses and legumes, which include field pea production, were the second largest
crop commodities, only rivaled by maize production in 2013 (Pavec, 2012; USDA-
NASS, 2013).
II. Nutrients in Field Pea
There are no differences in total nutrient content between green and yellow peas
and very subtle differences between spring- and winter-seeded peas; however, there may
be small differences between some pea varieties – mainly due to differences in the size of
the pea and the thickness of the hull. Mature field pea seeds consist of an outer portion,
the hull, which is primarily comprised of non-starch polysaccharides. The pea kernel
contains relatively high amounts of crude protein (~21-30%) and carbohydrates (~40-
48%), in the form of starch, with minimal amounts of crude fat, ash and fiber
(Abrahammsson et al., 1993; Castell et al., 1996). Hlovdversson (1987) found that the
hull is associated with nutrient depressing factors (naturally occurring factors which
interfere with nutrient availability; i.e., tannins and other enzyme inhibiting activities).
The dark-flowered varieties, or the Arvense subspecies, are relatively higher in tannins
and other anti-nutritional factors than their light-flowered subspecies counterparts and
therefore, have lower digestibility of nutrients (Abrashamsson et al., 1993).
Field peas have a high quality amino acid profile. Peas have especially high levels
of lysine and are considered a more concentrated lysine source than both cereals and

6
soybeans. However, peas have relatively low levels of methionine, cysteine, and sulfur
amino acids (Castell et al., 1990; Hickling., 2003). In 1977, Macnicol noted the pea
kernel had the ability to synthesize and inter-convert amino acids during the growing
season. Albumins, globulins, and glutenlins are the main protein extracts in peas.
Although most non-ruminant diets must be balanced in order to meet all amino acid
requirements, the amino acids in peas are highly digestible by both swine and poultry
(Stein et al., 2006). The digestibility is similar or higher than in grain, and only slightly
lower than in soybean meal. In ruminants, however, this protein is highly rumen
degradable (Anderson et al., 2007). Amino acid content is correlated with protein content.
Several factors contribute to the crude protein variability including genotypes, seed
characteristics (smooth vs. wrinkled seeds), growing season, and the analytical methods
(Hlodversson, 1987; Gatel and Grosjean, 1990). Peas are intermediate to cereal grains
and soybeans in their crude protein content. The NRC (2001) and Hickling (2003) report
an average crude protein value of 23% for peas; however, mature seeds have been
reported to contain approximately 25% crude protein (Gatel and Grosjean, 1990). Spring
varieties tend to have less crude protein than winter varieties (Castell et al., 1996).
Additionally, wrinkled seeds are higher in average crude protein content then smooth
seeds (Myer and Brendemuhl, 2001).
Like most legumes, starch is the predominant form of storage energy and is
almost half of the total weight of the pea. The starch content of peas ranges from 41-54%
of dry matter with approximately 50% of this being soluble. For ruminants, in high
concentrate diets, the ruminal degradation rate of pea starch is similar to corn and much
slower than wheat, oats, or barley. All peas, regardless of species, store starch in oval

7
granules. However, varietal types of peas may contain differences in the shape of the
starch grains as well as the glucose polymer content: amylose and amylopectin
(Grosjean, 1985; Walhain et al.,1992). Peas also contain approximately 5%
oligosaccharides, made mainly of sucrose, stachyose, verbascose and raffinose. The
presence of oligosaccharides represents a potential problem for swine, as pigs are
deficient in galactosidase enzymes and therefore have issues in the hindgut that cause
flatulence (Aman and Graham, 1987; Hickling, 2003). Also, in 1997, Igbasan et al.
profiled non-starch polysaccharide content of peas, which was predominantly made of
glucose, uronic acids, arabinose, xylose and galactose. The crude fiber, ash and starch
content of a feedstuff influence the feed’s energy and dry matter digestibility. Crude fiber
levels range from 5-8%, dry matter basis, with the pea hull containing up to 75% fiber;
twice as much crude fiber as corn (Coxon and Wright, 1985; Castell, 1990).
The oil, or fat, content of field peas is relatively low. The fatty acid profile of the
oil in peas is similar to cereal grains, being primarily polyunsaturated. While the
saturated fat content is approximately only 15%, the majority of the composition is
unsaturated fatty acids (80-84%). The major unsaturated fatty acids are linoleic (45-
50%), oleic (20%) and linolenic (12%) (Savage and Deo,1989).
Field peas, like cereal grains, are low in calcium but contain a slightly higher level
of phosphorus content (0.4%). Field peas also contain phytic acid (~1.2%), which binds
phosphorus so that it is less available to the animal and compares favorably to soybeans
(1.0-1.93%) (Hlodversson, 1987; Gatel and Grosjean, 1990). In 1998, NRC reported the
an amout of 0.39% phosphorus and 0.11% calcium while corn contained 0.28% and
0.03%, respectively. However, Jurgens (2002) reported the phosphorus content of pea
8
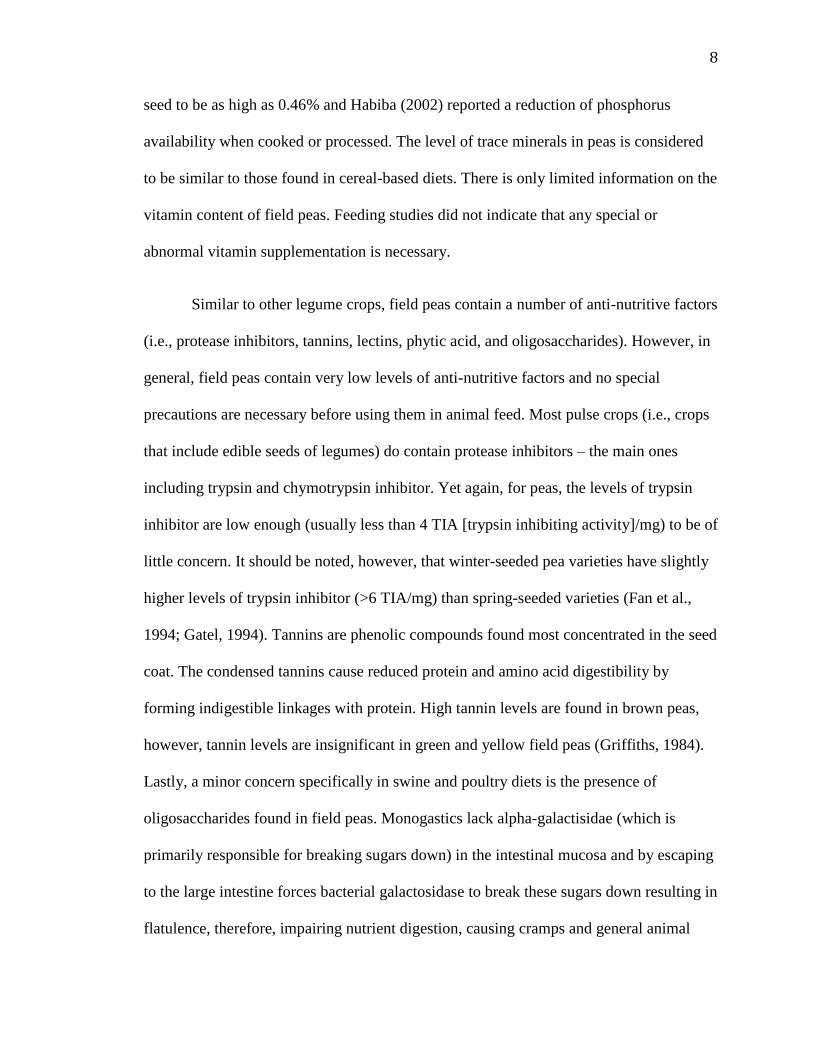
seed to be as high as 0.46% and Habiba (2002) reported a reduction of phosphorus
availability when cooked or processed. The level of trace minerals in peas is considered
to be similar to those found in cereal-based diets. There is only limited information on the
vitamin content of field peas. Feeding studies did not indicate that any special or
abnormal vitamin supplementation is necessary.
Similar to other legume crops, field peas contain a number of anti-nutritive factors
(i.e., protease inhibitors, tannins, lectins, phytic acid, and oligosaccharides). However, in
general, field peas contain very low levels of anti-nutritive factors and no special
precautions are necessary before using them in animal feed. Most pulse crops (i.e., crops
that include edible seeds of legumes) do contain protease inhibitors – the main ones
including trypsin and chymotrypsin inhibitor. Yet again, for peas, the levels of trypsin
inhibitor are low enough (usually less than 4 TIA [trypsin inhibiting activity]/mg) to be of
little concern. It should be noted, however, that winter-seeded pea varieties have slightly
higher levels of trypsin inhibitor (>6 TIA/mg) than spring-seeded varieties (Fan et al.,
1994; Gatel, 1994). Tannins are phenolic compounds found most concentrated in the seed
coat. The condensed tannins cause reduced protein and amino acid digestibility by
forming indigestible linkages with protein. High tannin levels are found in brown peas,
however, tannin levels are insignificant in green and yellow field peas (Griffiths, 1984).
Lastly, a minor concern specifically in swine and poultry diets is the presence of
oligosaccharides found in field peas. Monogastics lack alpha-galactisidae (which is
primarily responsible for breaking sugars down) in the intestinal mucosa and by escaping
to the large intestine forces bacterial galactosidase to break these sugars down resulting in
flatulence, therefore, impairing nutrient digestion, causing cramps and general animal
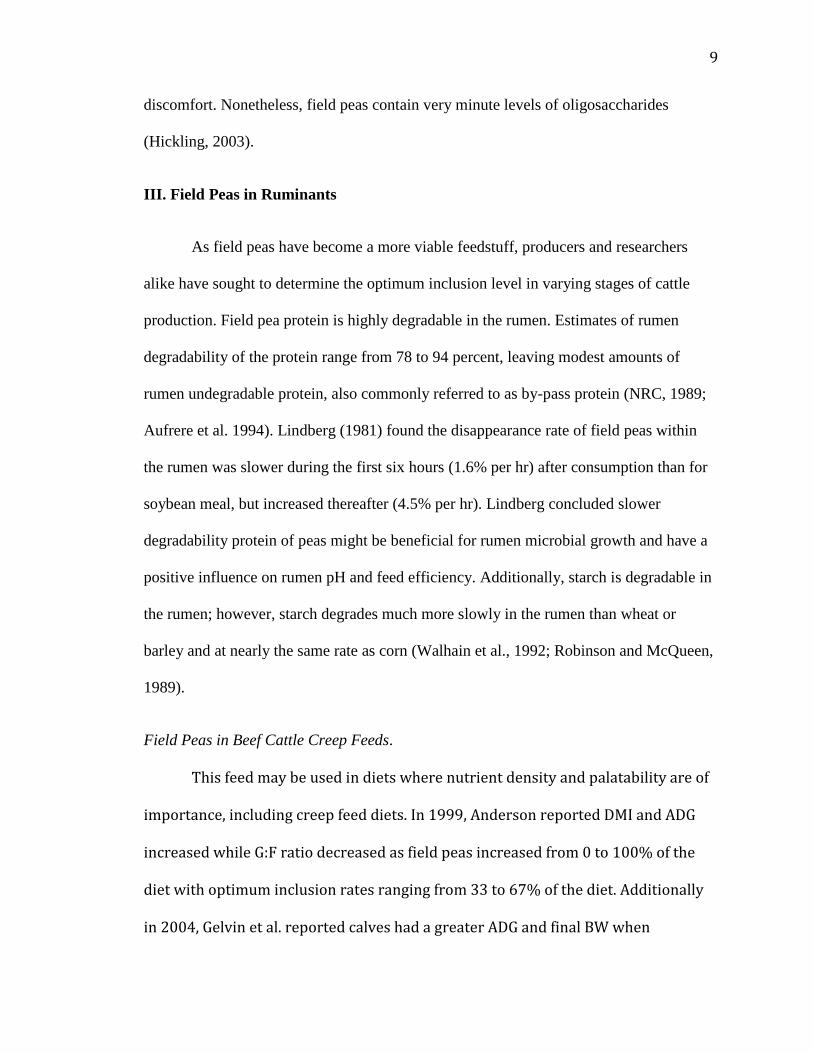
9
discomfort. Nonetheless, field peas contain very minute levels of oligosaccharides
(Hickling, 2003).
III. Field Peas in Ruminants
As field peas have become a more viable feedstuff, producers and researchers
alike have sought to determine the optimum inclusion level in varying stages of cattle
production. Field pea protein is highly degradable in the rumen. Estimates of rumen
degradability of the protein range from 78 to 94 percent, leaving modest amounts of
rumen undegradable protein, also commonly referred to as by-pass protein (NRC, 1989;
Aufrere et al. 1994). Lindberg (1981) found the disappearance rate of field peas within
the rumen was slower during the first six hours (1.6% per hr) after consumption than for
soybean meal, but increased thereafter (4.5% per hr). Lindberg concluded slower
degradability protein of peas might be beneficial for rumen microbial growth and have a
positive influence on rumen pH and feed efficiency. Additionally, starch is degradable in
the rumen; however, starch degrades much more slowly in the rumen than wheat or
barley and at nearly the same rate as corn (Walhain et al., 1992; Robinson and McQueen,
1989).
Field Peas in Beef Cattle Creep Feeds.
This feed may be used in diets where nutrient density and palatability are of
importance, including creep feed diets. In 1999, Anderson reported DMI and ADG
increased while G:F ratio decreased as field peas increased from 0 to 100% of the
diet with optimum inclusion rates ranging from 33 to 67% of the diet. Additionally
in 2004, Gelvin et al. reported calves had a greater ADG and final BW when

10
supplemented with field peas at 0.45% BW on a dry-matter basis. In a separate
experiment, supplemented calves had greater total intake (g/kg of BW; forage +
milk + creep) compared with control calves when supplemented with field peas
with 8 to 16% salt in a soybean meal based diet (Gelvin et al., 2004). However, a
different study found no differences in calf performance as field peas replaced up to
100% of wheat middlings (Landblomen et al., 2000). Furthermore, a study that
evaluated the effect of processing field pea grains (at an inclusion rate of 40%) for
creep feeds found that calves tended to have a greater daily gain than those fed
ground or whole field peas (Anderson et al., 2006).
Field Peas in Beef Cattle Receiving Diets.
Multiple studies have been conducted to determine the effects of field peas
replacing cereal grains for newly-weaned calves. In 2002, Anderson and Stoltenow
conducted a study in which receiving calves were divided into the following treatment
groups: 100% barly, 50% barley and 50% field peas, or 100% field peas. The study lasted
42 d and DMI and BW were evaluated after 21 d and again, at the end of the study. As
field pea inclusion increased, DMI increased; however, there were no differences in daily
gains and G:F slightly decreased. These results were similar to a separate experiment
conducted with a field pea inclusion ranging from 0 to 56% in a barley-based diets
(Anderson and Stoltenow, 2004). Additionally, Gilbery et al. (2007) examined the effects
of pulse grains (field peas, lentils, or chickpea) compared to a control diet of corn and
canola meal for 39 d and had similar results. Calves fed field peas, lentils or chickpeas
had greater overall DMI but there were no reported differences in gain efficiency due to
dietary treatment. Lentils and chickpea had the greatest ADG, however, field peas were
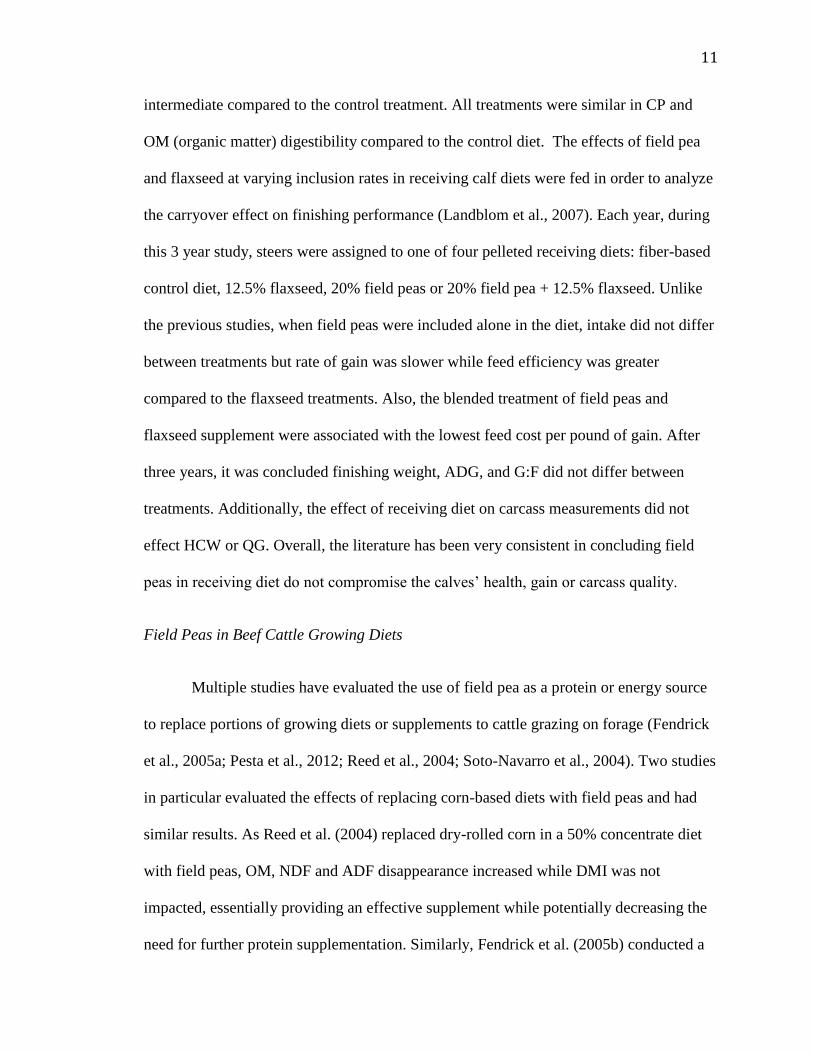
11
intermediate compared to the control treatment. All treatments were similar in CP and
OM (organic matter) digestibility compared to the control diet. The effects of field pea
and flaxseed at varying inclusion rates in receiving calf diets were fed in order to analyze
the carryover effect on finishing performance (Landblom et al., 2007). Each year, during
this 3 year study, steers were assigned to one of four pelleted receiving diets: fiber-based
control diet, 12.5% flaxseed, 20% field peas or 20% field pea + 12.5% flaxseed. Unlike
the previous studies, when field peas were included alone in the diet, intake did not differ
between treatments but rate of gain was slower while feed efficiency was greater
compared to the flaxseed treatments. Also, the blended treatment of field peas and
flaxseed supplement were associated with the lowest feed cost per pound of gain. After
three years, it was concluded finishing weight, ADG, and G:F did not differ between
treatments. Additionally, the effect of receiving diet on carcass measurements did not
effect HCW or QG. Overall, the literature has been very consistent in concluding field
peas in receiving diet do not compromise the calves’ health, gain or carcass quality.
Field Peas in Beef Cattle Growing Diets
Multiple studies have evaluated the use of field pea as a protein or energy source
to replace portions of growing diets or supplements to cattle grazing on forage (Fendrick
et al., 2005a; Pesta et al., 2012; Reed et al., 2004; Soto-Navarro et al., 2004). Two studies
in particular evaluated the effects of replacing corn-based diets with field peas and had
similar results. As Reed et al. (2004) replaced dry-rolled corn in a 50% concentrate diet
with field peas, OM, NDF and ADF disappearance increased while DMI was not
impacted, essentially providing an effective supplement while potentially decreasing the
need for further protein supplementation. Similarly, Fendrick et al. (2005b) conducted a

12
study that replaced corn silage-based diets with field peas ranging from only 0 to 26.3%
of the diet and resulted in no differences with ADG and F:G, however, DMI did increase
linearly with increased field pea addition in the diet. These improvements over the corn-
based diets could be contributed to the lower starch content of field peas, and
furthermore, could reduce the negative association effects of starch on fiber digestion
issues that are often associated with growing diets. However, Soto-Navarro et al. (2004)
replaced soybean hulls, barley malt sprouts, and wheat middlings in a 45% hay diet with
field peas ranging from 0 to 45% and found a decrease in DMI and OMI while DM, OM,
and NDF digestibility were unaffected. Conflicting research responses to field pea
inclusion in growing diets appear to be at least partially due to the variation of the basal
diet, which alters other characteristics such as starch content, fiber content, CP
percentages and degradability and digestibility. Additionally, binder acceptability has
been evaluated while feeding DDGS and field peas combined on pasture. Pesta et al.
(2012) assigned heifers to treatments that were supplemented with DDGS meal on the
ground, in a bunk or a 25% field pea and 75% DDGS cube on the ground. Crude protein
concentrations were equal across the treatments. The cube and bunk treatments had no
differences but both performed better than the ground treatment resulting in an increase
in ADG and in final BW. The researchers concluded field peas could not only be fed on
the ground as a protein supplement but suggest that field peas may also be used as
acceptable binder for DDGS to reduce protein supplementation waste during the grazing
phase of cattle production.
Field Peas in Beef Cattle Finishing Diets
Multiple studies have utilized field peas in finishing diets in comparison to other

13
grains (Fendrick et al, 2005a; Lardy et al., 2009; Jenkins et al. 2011) with varying results
in cattle performance. Fendrick et al. (2005a) replaced dry-rolled corn with whole field
peas at 0, 20, 40 or 59% inclusion levels for 143 d. There were no significant differences
observed in ADG or G:F, however, a quadratic response was observed for DMI, with
intake increasing up to 40% inclusion, then decreasing at 59%, but still remained higher
than cattle that were not fed field peas. Jenkins et al. (2011) replaced dry-rolled corn with
only slightly different field pea inclusions of 0, 10, 20 or 30% for a 119 d finishing period
but saw no differences in performance, including DMI. Lardy et al. (2009) also published
the results of three experiments; two experiments replaced dry-rolled corn at 0, 10, 20, or
30% with field peas on a DM basis and the third experiment replaced corn and barley
sprouts diet with field peas at 0, 18, 27, or 36% cracked field peas on a DM basis. No
differences were observed on final BW, ADG, G:F, DMI or calculated NEm or NEg. The
variation in DMI response to field peas is possibly due to variances in inclusion rate. At
the lower inclusion rates, field peas fill the role of protein supplementation; while at the
higher rates, field peas replace grains as a source of starch.
Field Peas in Dairy Cattle Rations
Two studies have assessed the use of field peas in dairy cattle diets and similarly
to beef cattle producers, relevant research, cost and availability are the key factors that
determine the feasibility of feeding field peas to dairy cows (Corbett et al., 1995; Vander
Pol et al., 2008). Both studies divided Holstein cows into two groups based on stage of
lactation, parity, and level of milk yield. Corbett et al. (1995) replaced a based diet of
soybean meal and canola meal with approximately 25% field peas as the major source of
protein and the study’s duration lasted 6 months, which grain levels were adjusted

14
monthly based on milk yield. There was a greater milk yield for cows fed pea based
concentrates in early lactation. Fat-corrected milk yield was not affected by diet
regardless of lactation period. Milk fat percent was significantly higher for early and mid-
lactation cows fed the pea supplement. Additionally, Vander Pol et al. (2008) replaced a
control diet of soybean meal and corn grain with 15% field peas (DM basis) however,
this study only lasted 70 d. DMI, milk yield, 4% fat-corrected milk yield, milk fat, milk N
efficiency were not affected by diet but intake of NDF was lower and total tract apparent
digestibility of starch was lower with the pea diet compared to that of the control. Other
studies recorded similar results but all studies have determined field peas are an
acceptable source of protein for dairy producers to use in varying lactating stages without
negative consequence (Khorasani et al., 2001; Vander Pol et al., 2009).
Field Peas fed in Lamb Diets
Studies have confirmed that sheep can effectively digest field peas and that peas
can support excellent performance (Lanza et al., 2003; Loe et al., 2004; Scerra et al.,
2011). These studies, similarly to studies in cattle, have focused on replacing based diets
with field peas in order to evaluate pea protein degradation and growth performance.
Lanza et al. (2003) and Loe et al. (2004) both replaced soybean meal diets with field peas
ranging from 0 to 45% with no differences among treatment groups for performance or
carcass characteristics among treatment groups.
Effects of Processing Field Peas.
Rolling, ensiling, grinding, or steam flaking processing has been shown to
improve metabolizable energy of various grains (Owens et al., 1997). Previously
15
discussed research has shown field peas to be suitable alternative to other grains, it
follows that further processing of field peas would also impact their feeding value.
Birkelo et al. (2000) replaced whole corn and soybean meal with 10% dry-rolled peas. No
differences in performance were observed due to either inclusion or degree of processing.
Alternatingly, Anderson et al. (2006) observed a response in DMI and ADG when heifers
were fed dry-rolled peas compared to whole or ground peas.
IV. Field Peas in Monogastrics
Field Peas in Swine Diets
The primary use of field peas as an alternative diet around the world is in swine
diets. Pigs are able to extract a great deal of energy from peas. Additionally, field peas
have a high level of lysine that is invaluable for pig growth. Lastly, peas are very
palatable and since peas are a good source of energy and amino acids, they tend to
displace cereal grains when used in pig feeds. Several studies have been conducted to
determine the effects of including field peas in all swine production settings (Castell,
1990; Cline & Richert, 2001; Stein et al., 2004). Although conditions may vary, the
results from these experiments indicate that the diet has no negative effect on the
palatability of the diet or growth of the animal.
For growing pigs, field peas present a potential problem due to the trypsin
inhibitor. Heat processing, via extrusion, has shown some benefit to combat the effects of
this anti-nutritive component. Freire et al. (1991) conducted a study to determine the
difference in performance of young pigs fed raw peas (45% spring-seeded variety) or
extruded peas (30% spring-seeded). Even at these very high dietary inclusion rates, the

16
peas did not have enough trypsin inhibitor to cause problems for growth, as the diet had
no effect on the pig’s performance. Research studies that evaluated the use of raw peas in
the diet have resulted in mixed results throughout literature. Stein et al. (2004)
demonstrated feeding field peas (6-18%) to pigs approximately two weeks after weaning
had no effect on growth performance relative to control, presumably due to a relative
mature digestive system. In contrast, it has been shown that pigs fed raw peas have
depressed growth performance when piglets weigh between 5-10 kg; suggesting at this
weight range that a poorly developed digestive system and low levels of amylase and
trypsin are more critical to piglets nutrition (Owusu-Asiedu et al. 2002). This study was
further supported by Friesen et al. (2006) when raw peas depressed ADG and ADFI in all
aging periods of young pigs (21-56 d) after replacing corn and soybean meal with 15-
30% raw peas. The researcher suggested that other factors such as poorly developed
digestive systems and low levels of amylase and trypsin (which are critical for piglets
nutrition) might also influence growth performance of piglets (weigh < 20 kg).
A number of studies have shown excellent performance results when raw peas are
used in growing-finishing pig diets (Bell and Keith, 1990; Stein et al., 2004, 2006).
Practical inclusion levels of field peas generally range from 20-40%, depending on
relative nutritional value to other available feedstuffs. Provided that diets are properly
balanced, especially considering the high levels of lysine and low levels of methionine
and cysteine in peas, then high levels of performance can be obtained at dietary inclusion
levels of near 50%. Brand et al. (2000) replaced soybean oilcake and maize meal with
field peas at 16%, 32%, 48%, and 64% resulting in increased DM intake, ADG and feed
conversion efficiency up to the 48% inclusion treatment. It should be noted that all of
17
these traits were depressed on the highest field pea level in the diet. Stein et al. (2004)
evaluated the effects of field peas in both the growing period (up to 18% field peas, as-
fed basis) and the finishing period (up to 36% field pea, as fed basis). These authors
concluded pig performance would not be negatively affected with the assumption that the
diet is properly balanced for the digestion of lacking amino acids.
Research has also been conducted, mainly in European countries, to find the
effects of including field peas in breeding swine diets – particularly gestating and
lactating sow diets. Peas were supplemented during gestation (16% inclusion rate) and
during lactation (24% inclusion rate) for soybean meal with no negative effects for
number of pigs weaned per litter, birth weights or lactation growth rate (Gatel et al.,
1988).
Field Peas in Poultry Diets
Peas provide an alternate feedstuff with a good source of protein and moderate
source of energy for all classes of poultry. Similar to swine, it is of extreme importance
for their diet to be balanced in order to meet nutritional requirements for amino acids.
The nutrient profile of field peas seems to be of more value in laying hen diets rather than
broiler diets due to the broiler’s higher energy requirements. It should also be noted that
in order to feed field peas to poultry, they have to be processed and reduced in size so the
bird may be able to digest the intracellular starch.
Multiple studies have been conducted to determine how effective field peas are in
laying hen diets. Ivusic et al. (1994) published a study in which field peas were included
up to 59% of the diet and compared to soy or corn diets, the only differences observed

18
were a lighter yolk color and thinner egg shells with increasing levels of peas in the diet.
In a separate study, Ivusic et al. substituted raw peas for wheat, after heat treatments, at
inclusion rates of 0, 20, 40 and 60% had similar results (1994). The authors concluded
maximum performance was attained at 40% pea inclusion level but performance then
decreased at the higher level. Opposite to the study of Ivusic et al. (1994), the yolk color
became darker; this could be a result of replacing wheat rather than a base cereal grain
(Igbasan et al., 1997). This study also presented an earlier study looking at the same diet
for broilers with finding only slight improvements in nutrient digestibility but did not find
any differences in performance. Brenes et al. (1989) showed feeding field peas up to 80%
in a broiler diet had no negative effects on performance as well as a slight increase in
growth rate. However, it is important to note that as the rate of including field peas
increased, so did the supplementation of oil, in order to balance the feeds for energy
levels.
V. Carcass Characteristics, Meat Quality, and Sensory Attributes
The majority of the research has observed little to no differences in carcass
characteristics due to field pea inclusion in finishing diets, regardless of species. The
studies that have evaluated carcass characteristics and sensory profiles over beef from
cattle fed field peas have only been evaluated at only 0 to 30% of the diet with
contradictory results (Anderson et al., 2007; Jenkins et al., 2014; Pesta et al., 2012). Pesta
et al. (2012) reported no results for smaller inclusion rates (less than 30%) of field peas
but did report an increase in HCW, dressing percentage, and 12th rib fat depth at a 30%
inclusion rate. However, Jenkins et al. (2011) reported a study with no differences among
treatments for HCW, LM area, fat thickness at the 12th rib, yield grade or marbling

19
scores. The only difference recorded in this study was a quadratic response for an
increase in KPH as the inclusion of field peas also increased. Lastly, Carlin et al. (2006),
cited by Anderson et al. (2007), reported no differences in carcass characteristics but
reported differences in WBSF (Warner-Bratzler Shear Force), as well as sensory profiles.
As field peas increased from 0 to 30%, a quadratic decrease in WBSF and a linear
increase in sensory tenderness were reported. Also, an increase in juiciness and perceived
tenderness was detected during the sensory panel but no overall flavor differences were
reported among treatments.
A few studies have also been conducted for pork quality. Stein et al. (2006)
reported no differences in pork carcass composition among treatment groups (36-66%
field peas) including pH, marbling, and 10th rib backfat. The objective color scores
indicated dietary field peas made the LM darker and pork chops from this treatment also
had less moisture compared to other treatments. Smith et al. (2014) also reported no
differences in carcass quality when field peas were added to soybean diets ranging from 7
to 30%. Skatole and indole concentrations in the backfat were quantified; there were no
differences in skatole concentrations but indole concentration was linearly reduced with
increasing inclusion. Both studies imply field pea inclusions in finishing diets do not
negatively impact carcass quality or pork palatability.
Only one study to date was found evaluating field pea diets and their impact on
poultry carcass composition and quality. Laudadio and Tufarelli (2010), evaluated field
peas in the diet compared to soybean meal but reported no effect on the dressing
percentage, however, total collagen and water-holding capacity increased in the pea
treatment. Fatty acid analysis was also reported with an increase in polyunsaturated fatty
20
acid concentration in the breast and drumstick, whereas, the saturated fatty acid was
similar among treatments. The authors concluded pea treatments had a positive effect on
the meat quality of broilers without any negative impacts on broiler chicken performance.
Minimal literature can be found regarding meat quality in lambs and goats.
However, Scerra et al. (2011) evaluated intramuscular fatty acid composition of lambs
fed diets containing alternate protein sources (soybean meal, faba beans, or field peas).
Meat from the field pea treatment had higher proportions of the essential fatty acids
C18:2 ω-6 and C18:3 ω-3, and consequently its derivatives, C20:4 ω-6 and C20:5 ω-3
respectively, were higher in meat from animals fed the field pea treatment compared to
other protein sources. Additionally, linolenic acid (C18:3 ω-3) was markedly greater in
the intramuscular fat from lambs fed peas that its counterparts. The author concluded the
inclusion of field peas in the diets given to finishing lambs does affect their fatty acid
composition; nevertheless, these results could justify the use of field peas as a protein
source without negatively impacting meat quality. To this date, fatty acid compositions
have not been analyzed in other species.
Conclusion
Field peas have become a practical feed ingredient in nearly for all livestock
producers. Much time and energy have been invested in evaluating the replacement of
high priced corn with feedstuffs that compare favorably, and compete as a competitive
protein and energy source. The production of field peas, livestock production settings,
optimal inclusion rates, and cost should all be considered. However, little to no research
has been conducted further than the feedlot and carcass characteristics. Therefore, the

21
objective of this study was to determine the effects on overall fresh beef quality from
cattle fed field peas during the grazing and finishing phases of production.
MATERIALS AND METHODS
Sampling and Experimental Design
Crossbred steers and heifers were arranged in a 2x3 factorial design (replicated
over 2 yrs) to evaluate the use of field peas during two phases of production (grazing and
finishing cattle). In the factorial design, three treatments were applied during the grazing
phase, and two treatments were applied during the finishing phase. During the first year,
119 crossbred steers (345 kgs) were randomly allotted to one of twelve wheatgrass
pastures. Pastures were assigned to receive one of three treatments 1) no supplement, 2)
field peas at 0.5% body weight (BW), or 3) dry-rolled corn supplemented at 0.5% BW.
The no supplement treatment served as a negative control while the dry-rolled corn
supplementation served as a positive control. During the second year, 113 crossbred
heifers (249 kgs) were assigned to the same factorial design. All cattle grazed on crested
wheatgrass pastures at the High Plains Agriculture Lab near Sidney, NE and were then
transported to the UNL Panhandle Research Feedlot near Scottsbluff, NE. All cattle were
slaughtered at Tyson Fresh Meats Inc. (Lexington, Nebraska). Cattle performance data
were reported by Greenwell et al. (2016).
Carcasses were chilled for 24 h before marbling attributes (score, texture and
distribution) were evaluated by a United States Department of Agriculture (USDA) beef
carcass supervisor. After grading, an approximate 7.62 cm-thick slice of the anterior
portion of the strip loin (Longissimus lumborum) was collected at the 12th/13th rib area
22
from each side of every carcass. All samples were vacuum packaged and transferred to
the Loeffel Meat Laboratory at the University of Nebraska-Lincoln.
Fabrication
Samples were immediately fabricated upon returning to the Loeffel Meat
Laboratory. All samples were deboned by hand and were cut using a slicer (SE 12D
manual slicer, Bizerba, Piscataway, NJ). The samples taken from the right side of the
carcass were used for tenderness evaluation and fatty acid analysis. After facing the
surface on both sides (<0.635 cm), a 2.54 cm steak was cut for Warner-Bratzler Shear
Force (WBSF) and Slice Shear Force (SSF) testing for day 0 of retail display and the
remaining portion was used for fatty acid analysis. The samples taken from the left side
of the carcass were used for retail display, tenderness evaluation and oxidation. After
facing the surface of both sides (<0.635 cm), a 2.54 cm steak was cut for WBSF and SSF
testing for day 7 of retail display and the remaining portion was used for thiobarbituric
acid reactive substances (TBARS). Samples for TBARS for day 0, 4 and 7 come from
one steak (1.27 cm thick) that was divided into three portions and trimmed of all
subcutaneous fat. The portion for day 0 was its own steak but it also was a steak sampled
for proximate analysis. The steaks that were used to evaluate fatty acid composition and
oxidation were vacuum packaged using a MULTIVAC 500 (Multivac, Inc., Kansas City,
MO) in Prime Source Vacuum pouches (15.24 x 25.4 cm 3 mil STD Barrier). Steaks for
tenderness evaluation and retail display were packaged using an INTACT machine
(Cryovac, Inc., Kansas City, MO) and placed in boxes and aged for 14 days.

23
Retail Display
The steaks from the left side of the carcass that were cut for retail display and
tenderness, as well as TBARS, were placed into labeled foam trays (Stryo-Tech Foam
Manufacturing, Denver CO, white foam tray 21.6 x 15.9 x 2.1 cm). Labels were
randomly assigned to the treatments so that there would be no bias as to the treatment of
each steak during retail display. These steaks were overwrapped with the same oxygen-
permeable polyvinyl chloride film (PSM18, Prime Source, St. Louis, MO) and were
subjected to retail display conditions. All steaks were kept in the same room with (2 ±
2°C) and were exposed to continuous 1,000-1,800 lux warm white fluorescence lighting.
Tenderness steaks were taken out after 7 days for SSF and WBSF evaluation. The steaks
for TBARS were taken out of the retail display case at day 4 or day 7, vacuum packaged
and frozen at -80°C until analyzed.
Objective and Subjective Color
Objective color measurements were made each day for seven days at about 10:00
am each day. Measurements were obtained for CIE L*, a*, and b* values using a Minolta
CR-400 colorimeter (Minolta, Osaka, Japan) set at a D65 light source and 2° observer
with an 8 mm diameter measurement area. The colorimeter was calibrated daily using a
white ceramic tile provided by the manufacturer, and color measures were obtained by
averaging 6 readings from different areas of the steak surface. The CIE L* measured
lightness (black = 0, white = 100), a* measured redness (red = positive values, green
=negative values) and b* measured yellowness (yellow = positive values, blue = negative
values).

24
Percent discoloration, or subjective color, was estimated every day about the same
time as objective color scoring for seven days by six graduate students during the first
year and eight graduate students the second year, all of whom had previous experience
with tabulating subjective color scores. Zero percent discoloration was given to a steak
that had no discoloration, and as the percentages increased, so did the discoloration
ratings of the steak.
Tenderness Evaluation
Steaks from the right side of the carcass were used to evaluate tenderness on day
0 of retail display while steaks from the left side of the carcass were used to measure
tenderness on day 7. Steaks were removed from foam trays and an internal raw
temperature and weight were recorded prior to cooking. All steaks were cooked to a
target temperature of 71°C on a Belt Grill (TBG60-V3 MagiGril, MagiKitch’n Inc.,
Quakertown, PA). Belt grill specifications were as follows: preheat = 149°C, top heat =
163°C, bottom heat = 163°C, height of gap = 2.16 cm, and cook time was approximately
5.5 minutes. After cooking, an internal temperature and weight were recorded, and slice
shear force evaluation was conducted using a Food Texture Analyzer (TMS-Pro, Food
Technology Corp., Sterling, VA.) with a Slice Shear force blade. The remainder of the
steak was individually bagged and stored in a cooler (maintained at 2 + 2°C).
Approximately 24 h after SSF evaluation was conducted; six (1.27 cm diameters) cores
were removed with a drill press parallel to the orientation of the muscle fibers. Cores
were measured using a Food Texture Analyzer (TMS-Pro, Food Technology Corp.,
Sterling, VA.) with a Warner-Bratzler blade.

25
Lipid Oxidation
Steaks in the simulated retail display condition for 0, 4, and 7 d were used to
measure the oxidation status. At the end of the respective retail display period, samples
were vacuum packaged and kept at -80°C. Lipid oxidation was measured by the
thiobarbituric acid assay (TBA) described by Ahn et al. (1998; see appendix 3) with
modifications. Fourteen ml of ddH2O and 1 mL of 10% butylated hydroxyanisole (BHA)
in 90% ethanol were added to 5 g of powdered sample. After homogenizing for 15 s
using a Polytron homogenizer (model CH-6010; Kinematica, Luzern, Switzerland), the
homogenate was centrifuged for 3,000 x g for 5 min. One ml of homogenate was added
to 2 mL of 2-thiobarbituric acid (TBA) and trichloroacetic acid (TCA) mixture (15% w/v
TCA and 20 nM TBA in ddH2O) and vortexed for 5 s. The sample mixture was incubated
at 70°C in a water bath for 30 min to develop color. The samples were cooled in a cold-
water bath for 10 min and centrifuged at 3,000 x g for 15 min. Duplicate 200 μL of
supernatant aliquots from each sample were transferred to 96-well microplates (Microtest
III sterile 96-well flat-bottomed microplate; Becton Dickinson & Company, Lincoln
Park, NJ) and read with a microplate spectrophotometer (Model Epoch, Biotek,
Winooski, VT) at 540 nm. All 96-well microplated contained standards to calculate
standard curves, and each sample was calculated as mg of malonaldehyde per kg of tissue
using the standard curve from each plate.
Fatty Acid Analysis
Total lipid was extracted following the chloroform-methanol procedure of Folch
et al. (1957; see appendix 4). After extraction, the lipids were converted to fatty acid
methyl esters according to Morrison and Smith (1964) and Metcalfe et al. (1966).
26
Following dicing, each lean portion of the steak was dipped in liquid nitrogen and
macerated using a Waring commercial blender (Model 51BL32, Waring Commercial,
Torrington, CT). Powdered samples were stored at -80°C until analysis. Each fatty acid
was determined by gas chromatography (GC) after fat extraction from samples followed
by formation of methyl esters of fatty acids. Powdered lean samples (approximately one
g) were dissolved in 5 mL of 2:1 chloroform: methanol (v/v) to extract the lipid fraction
after vortexing for 5 s and letting them stand for 1 h at room temperature. The
homogenate was filtered three times through Watman #2 filter paper into a 13 x 150 mm
screw-cap tube and the final volume was brought up to 10 mL with 2:1 chloroform:
methanol mix. Afterwards, 2 mL of 0.74% KCl solution were added to the lipid extract
and vortexed for 5 s to separate extracted proteins. Samples were centrifuged at 1000 x g
for 5 min. Following centrifugation, the aqueous layer was aspirated and evaporated to
dryness under nitrogen at 60°C (Folch et al., 1957). Then, 0.5 mL of 0.5 M NaOH in
methanol was added, vortexed again for 5 s and heated for 5 min at 100°C under nitrogen
for saponification. To methylate the fatty acids, 0.5 mL of boron triflouride in 14%
methanol was added and heated for 5 min at 100°C (Metcalfe et al., 1966). One mL of
saturated salt solution and 1 mL of hexane were added and vortexed for 5 s. Following
centrifugation at 1,000 x g for 5 min, the hexane layer was removed and placed in a GC
vial. All GC vials were purged with nitrogen before capping and stored at -80°C until the
sample was read on a Hewlett-Packard Gas Chromatograph (Agilent Technologies,
model 5890A series, Santa Clara, CA). Total fatty acids converted to methyl esters were
separated on a fused silica column (Chrompack CP-Sil 88; 0.25 mm x 100 m, Santa
Clara, CA), which was placed in an oven programmed from 140°C for 10 min to 220°C

27
at a rate of 2°C/min and held at 220°C for 20 min. Total run time was 70 min. The
injector and detector were programmed to work at 270°C and 300°C, respectively. Each
lipid extract was separated into fatty acids by using helium as the carrier gas at a flow
rate of 1mL/min. Individual fatty acids of each sample were determined by comparison of
retention times with known standards. Each standard contained fatty acids that were run
through GC at the same time as a set of samples in order to provide a reference point to
identify fatty acids in the sample. Each fatty acid was expressed as weight percentage
value, which were relative proportions of all peaks observed by gas chromatography.
Proximate Analysis
Moisture and total fat of pulverized raw meat samples were determined.
Approximately 2 g of pulverized tissue in duplicate were used to quantify moisture and
ash using a LECO thermogravimetric analyzer (LECO Corporation, model 604 – 100 –
400, St. Joseph, MI). Total fat was determined as outlined by AOAC (1990) using the
Soxhlet extraction procedure (See Appendix 5).
Statistical Analysis
This study was conducted with a treatment design of a 3 x 2 factorial
(backgrounding diet x finishing diet) and analyzed using SAS® 9.4 package, SAS
Institute, Inc., USA. Objective color and percent discoloration were analyzed for
treatment main effects using the PROC GLIMMIX procedure of SAS with day as
repeated measures when traits were measured over time. All other analyses were
conducted with PROC GLIMMIX as well; all means were separated with the LS
MEANS statement and TUKEY adjustment with an alpha level of 0.05 and tendencies
were considered at an alpha level of 0.10.

28
LITERATURE CITED
Abrahamsson, M., H. Graham, Y.D. Daveby, and P. Aman. 1993. Ileal and faecal
digestibility of light- or dark-colored peas (Pisum savitum) in growing pigs.
Anim. Feed Sci. Tech. 42(1-2): 15-24. doi:10.1016/0377-8401(93)90020-K
Anderson, V.L. 1999. Field peas in diets for growing and finishing steer calves. NDSU
Carrington Research Extension Center Beef and Bison Field Day Proceedings.
Vol. 22. 9-15.
Anderson, V.L. and C.S. Stoltenow. 2002. Feeding field peas to livestock. North Dakota
State University Extension Bulletin. Extension Bulletin. Vol. 76. 1-4.
Anderson, V.L., and J.P. Schoonmaker. 2004. Effect of pulse grains on performance of
newly-weaned steer calves. NDSU Carrington Research Extension Center Beef
Production Field Day Proceedings. Vol. 27. 6-8.
Anderson, V.L., J.P. Schoonmaker, and B. Ilse. 2006. Effects of processing field pea in
feedlot, creep feed, and gestating cow diets. J. Anim. Sci. 84: (Suppl. 2): 86.
(Abstr.)
Anderson, V.L., G.P Lardy, and B.R. Ilse. 2007. REVIEW: Field pea grain for beef
cattle. Prof. Anim. Sci. 23:1-7
Aman, P. and H. Graham. 1987. Whole crop peas I. Changes in botanical and chemical
compostion and rumen in vitro degradability during maturation. Anim. Feed Sci.
Tech. 17(1):15-31 doi:10.1016/0377-8401(87)90049-6
Aufrére, J., D. Graviou, and B. Michalet-Doreau. 1994. Degradation in the rumen of
proteins of 2 legumes: soybean meal and field pea. Reprod. Nutr. Dev. 34(5):483-
490
Bell, J.M. and M.O. Keith. 1990. Combinations of canola meal and field peas for use in
rations for market pigs. Tenth Project Report, Research on Canola Meal, Canola
Council of Canada, Winnipeg, MB., Canada, R3B 0T6. p. 91-100.
Biederbeck, V.O., R.P. Zentner, and C.A. Campbell. 2005. Soil microbial populations
and activities as influenced by legume green fallow in a semiarid climate. J. Soil
Bio. 37(10): 1775-1784 doi:10.1016/j.soilbio.2005.02.011
Birkelo, C.P., B.J. Johnson, and B.D. Rops. 2000. Field peas in finishing cattle diets and
the effect of processing. South Dakota State University Beef Reports. 5:14-17
Bowman, G., C. Cramer, and C. Shirley. 2012. Managing cover crops profitability.
SARE Handbook No. 9. SARE-USDA, College Park, MD.

29
Brand, T.S., D.A. Brandt, J.P. van der Merwe, and C.W. Cruywagen. 2000. Field peas
(Pisum sativum) as protein source in diets of growing-finishing pigs. J. App.
Anim. Research 18(2):159-164. doi:10.1080/09712119.2000.9706338
Brenes, A., J. Treviño, C. Centeno, and P. Yuste. 1989. Influence of peas (Pisum
sativum) as a dietary ingredient and flavomycin supplementation on the
performance and intestinal microflora of broiler chicks. Brit. Poultry Sci.
30(1):81-89. doi:10.1080/00071668908417127
Carlin, K.M., V.L. Anderson, D.M. Larson, B.R. Ilse, R.J. Maddock, M.L. Bauer, and
G.P.Lardy. 2013. Effects of increasing field pea (Pisum savitum) level in high-
concentrate diets on meat tenderness and sensory taste panel attributes in finishing
steers and heifers. Prof. Anim. Sci. 29.1:33-38
Castell, A.G. 1990. Field peas. In: P.A. Thacker and R.N. Kirkwood, editor,
Nontraditional feed sources for use in swine production. Butterworths, Stoneham,
MA. p. 185-196.
Castell, A.G., W.Guenter, and F.A. Igbasan. 1996. Nutritive value of peas for
nonruminant diets. Anim. Feed Sci. Tech. 60:209-227. doi:10.1016/0377-
8401(96)00979-0
Chen, C., P. Miller, F. Muehlbauer, K. Neill, D. Wichman, and K. McPhee. 2006. Winter
pea and lentil response to seeding date and micro- and macro- environments.
Agron. J. 98:1655-1663. doi: 10.2134/agronj2006.0085
Clark, A. 2007. Managing cover crops profitably. 3rd ed. Agri. Handbook No. 9.
Sustainable Agriculture Research and Education, College Park, MD.
Cline, R.T. and T.B. Richert. 2001. Feeding growing-finishing pigs. In: A.J. Lewis and
L.L. Southern, editors, Swine Nutrition. CRC Press LLC, Boca Raton, FL. p. 717-
723.
Corbett, R.R., L.A. Goonewardene, and E.K. Okine. 1995. Effects of feeding peas to
high-producing dairy cows. Can. J. Anim. Sci. 75(4):625-629.
doi:10.4141/cjas95-092
Coxon, D.T. and D.J. Wright. 1985. Analysis of pea lipid content by gas chromatographic
and microgravimetic methods. genotype variation in lipid content and fatty acid
composition. J. Sci. Food and Agri. 36(9):847-856. doi:10.1002/jsfa.2740360914
Davies, D.R. 1976. Peas. In: Simmonds N.W., editor, Evolution of crop plants. Longman,
London, UK. p. 172-174.
Elzebroek and Wind. 2008. Guide to cultivated plants. CAB International, Oxfordshire,
UK. p.226-262.
30
Fan, M.Z., W.C. Sauer, and S. Jaikaran. 1994. Amino acid and energy digestibility in
peas (Pisum sativum) from white-flowered spring cultivars for growing pigs. J.
Sci. Food and Agri. 64(2):249-256. doi:10.1002/jsfa.2740640215
Fendrick, E.M., I.G. Rush, D.R. Brink, G.E. Erickson, and D.D. Baltensperger. 2005a.
Effects of field peas in beef finishing diets. 2005 Nebraska Beef Report:49-50.
Fendrick, E.M., I.G. Rush, D.R. Brink, G.E. Erickson, and D.D. Baltensperger. 2005b.
Effects of level and processing of field peas in growing and finishing diets. J.
Anim. Sci. 83 (Suppl. 1): 261. (Abstr.)
Freire, J.B., A. Aumaitre, and J. Peiniau. 1991. Effects of feeding raw and extruded peas
on ileal digestibility, pancreatic enzymes and plasma glucose and insulin in early
weaned pigs. J. Anim. Phys. Anim. Nutr. 65(1-5):154-164. doi: 10.1111/j.1439-
0396.1991.tb00253.x
Friesen, M.J., E. Kiarie, and C.M. Nyachoti. 2006. Response to nursery pigs to diets with
increasing levels of raw peas. Can. J. Anim. Sci. 86(4): 531-533.
doi:10.4141/A05-063
Gatel, F., F. Grosjean, and M. Leuillet. Utilization of white-flowered smooth-seeded
spring peas (Pisum sativum hortense, CV Amino) by the breeding sow. Anim.
Feed Sci. Tech. 22(1-2):91-104. doi:10.1016/0377-8401(88)90077-6
Gatel, F. 1994. Protein quality of legume seeds for non-ruminant animals: A literature
review. Anim. Feed. Sci. Tech. 45:317-348. doi:10.1016/0377-8401(94)90036-1
Gatel, F., and F.Grosjean. 1990. Composition and nutritive value of peas for pigs: a
review of European results. Lvstk. Prod. Sci. 26:155-175. doi:10.1016/0301-
6226(90)90077-J
Gelvin, A.A., G.P. Lardy, S.A. Soto-Navarro, D.G. Landblom, and J.S. Caton. 2004.
Effect of field pea-based creep feed on intake, digestibility, ruminal fermentation,
and performace by nursing calves grazing native range in western North Dakota.
J. Anim. Sci. 82(12):3589-3599. doi:10.2527/2004.82123589x
Gilbery, T.C., G.P. Lardy, S.A. Soto-Navarro, M.L. Bauer, and V.L. Anderson. 2007.
Effects of field peas, chickpeas, and lentils on rumen fermentation, digestion,
microbial protein synthesis, and feedlot performance in receiving diets for beef
cattle. J. Anim. Sci. 85:3045-3053. doi:10.2527/jas.2006-651
Greenwell, H.L., J. L. Gramkow, M. Jolly-Breithaupt. K.H. Jenkins, and J.C.
MacDonald. 2016. Effect of field pea usage in growing and finishing diets for
beef cattle. In preparation.
Griffiths, D.W. 1984. The trypsin and chymotrypsin inhibitor activites of various pea
(Pisum spp.) and field bean (Vicia faba) cultivars. J. Sci. Food Agri. 35(5):481-
486. doi:10.1002/jsfa.2740350502

31
Grosjean, F. 1985. Combining pea for animal feed. In: P.D. Hebblethwaite, M.C. Heath,
and T.C.K. Dawkins, editors, A basis for improvement. Butterworths, London,
UK. p. 453-462.
Habiba, R.A. 2002. Changes in anti-nutrients, protein solubility, digestibility, and HCl-
extractability of ash and phosphorus in vegetable peas as affected by cooking
methods. Food Chem. 77:187-192. doi: 10.1016/S0308-8146(01)00335-1
Hartmann, H.T., A.M. Kofranek, V.E. Rubatzky, and W.J. Flocker. 1988. Growth,
development and utilization of cultivated plants. 2nd ed. Prentice Hall Career and
Technology, Englewood Cliffs, NJ.
Hickling, D. 2003. Canadian feed peas industry guide. 3rd ed. Pulse Canada, Winnipeg,
Manitoba, Canada.
Hlodversson, R. 1987. The nutritive value of white- and dark-flowered cultivars of pea
for growing-finishing pigs. Anim. Feed Sci. Tech. 17:245-255. doi:10.1016/0377-
8401(87)90056-3
Igbasan, F.A., W. Guenter, and B.A. Slominski. 1997. Field peas: chemical composition
and energy and amino acid availabilities for poultry. Can. J. Anim. Sci.
77(2):293-300 doi:10.4141/A96-103
Ingels, C.A., R.L. Bugg, and F.L. Thomas. 1994. Cover Crop Species and Descriptions.
In: C.A. Ingels, R.L. Bugg, G.T. McGourty, and L.P. Christensen, editor, Cover
cropping in vineyards. Agriculture and Natural Resourcees, Oakland, CA.
Ivusic, S.I., L.W. Mirosh, and H.S. Nakaue. 1994. Productivity of laying pullets fed diets
containing yellow peas (Pisum sativum L var. Miranda). Anim. Feed and Tech.
45(2): 205-210. doi: 10.1016/0377-8401(94)90027-2
Jenkins, K.H., J.C. MacDonald, F.T. McCollum III, and S.A. Amosson. 2009. Effect of
level of supplementary dried distiller’s grains on calves grazing native pastures
and subsequent wheat pasture performance. Prof. Anim. Sci. 25:596-604
Jenkins, K.H., J.T. Vasconcelos, J.B. Hinkle, S.A. Furman, A.S. de Mello, L.S.
Senaratne, S. Pokharel, and C.R. Calkins. 2011. Evaluation of performance,
carcass characteristics, and sensory attributes of beef from finishing steers fed
field peas. J. Anim. Sci. 89: 1167-1172. doi: 10.2527/jas.2009-2552
Jurgens, M.H. 2002. Animal Feeding and Nutrition. 9th ed. Kendall-Hunt Publishing
Company, Dubuque, IA.
Khorasani, G.R., E.K. Okine, E.K. Corbett, and J.J. Kennelly. 2001. Nutritive value of
peas for lactating dairy cattle. Can. J. Anim. Sci. 81(4):541-551.
doi:10.4141/A01-019

32
Landblom, D.G., W.W. Poland, and G.P. Lardy. 2000. Application of salt-limited
pea/wheat midds creep diets in southwestern North Dakota. North Dakota
Cow/Calf Conference and Beef Cattle Range and Research Report. p. 8-12.
Landblom, D.G., D.K. Olson, and C.J. Wachenheim. 2007. Effect of field pea and
flaxseed inclusion in receiving calf diets and carryover effect on finishing
performance, immune response, carcass quality, and economics. Proceedings
from American Society of Animal Science - Western Section. Vol. 58:156
Lanza, M., M. Bella, A. Priolo, and V. Fasone. 2003. Peas (Pisum sativum L.) as an
alternative protein source in lamb diets: growth performances, and carcass and
meat quality. Sm. Rum. Research 47(1):63-68. doi:10.1016/S0921-
4488(02)00244-4
Lardy, G.P., B.A. Loken, V.L. Anderson, D.M. Larson, K.R. Maddock-Carlin, B.R. Ilse,
R. Maddock, J.L. Leupp. R. Clark, J.A. Paterson, and M.L. Bauer. 2009. Effects
of increasing field pea (Pisum savitum) level in high-concentrate diets on growth
performance and carcass traits in finishing steers and heifers. J. Anim. Sci.
87:3335-3341. doi:10.2527/jas.2009-1785
Laudadio, V. and V. Tufarelli. 2010. Growth performance and carcass and meat quality
of broiler chickens fed diets containing micronized-dehulled peas (Pisum sativum
cv. Spriale) as a substitute of soybean meal. Poultry Sci. 89(7):1537-1543.
doi:10.3382/ps.2010-00655
Lindberg, J.E. 1981. The effect of basal diet on ruminal degradation of dry-matter,
nitrogenous compounds and cell walls in nylon bags. Roughage and cereals in
various proportions [cattle]. Swed. J. Agric. Res. 11:159
Loe, E.R., M.L. Bauer, G.P. Lardy, J.S. Caton, and P.T. Berg. 2004. Field pea (Pisum
savitum) inclusion in corn-based lamb finishing diets. Small Rumin. Res. 53:39-
45. doi:10.1016/j.smallrumres.2003.08.020
Macnicol, P.K. 1977. Synthesis and interconversion of amino acids in developing
cotyledons of pea (Pisum sativum l.) Plant Physiol. 60:344-348 doi:
10.1104/pp.60.3.344
Myer, R.O., and J.H. Brendemuhl. 2001. Miscellaneous feedstuffs: Peas. In: A.J. Lewis
and L.L. Southern, editors, Swine nutrition. CRC Press, Boca Raton, FL. p. 131-
150.
NRC. 1989. Nutrient Requirements of Beef Cattle. 6th ed. National Academy Press,
Washington, D.C.
NRC. 1998. Nutrient Requirements of Swine. 10th ed. National Academy Press.,
Washington, DC.

33
NRC. 2001. Nutrient Requirements of Swine. 11th ed. National Academy Press,
Washington, DC.
Owens, F.N., D.S. Secrist, W.J. Hill, and D.R. Gill. 1997. The effect of grain source and
grain processing on performance of feedlot cattle: a review. J. Anim. Sci. 75:868-
879. doi:10.2527/1997.753868x
Owusu-Asiedu, A., S.K. Baidoo, and C.M. Nyachoti. 2002. Effect of heat processing on
nutrient digestibility in pea and supplementing amylase and xylanase to raw,
extruded or micronized pea-based diets on performance of early-weaned pigs.
Can. J. Anim. Sci. 82(3): 367-374. doi:10.4141/A01-051.
Pavec, P.L.S. 2012. Plant guide for pea (Pisum sativum L.). USDA-Natural Resources
Conservation Service, Pullman, WA.
Pesta, A.C., A.H. Titlow, J.A. Hansen, A.L. Berger, S.A. Furman, M.K. Luebbe, G.E.
Erickson, and K.H. Jenkins. 2012. Effects of feeding field peas in combination
with distillers grains plus solubles in finishing and growing diets on cattle
performance and carcass characteristics. Prof. Anim. Sci. 28:534-540
Reed, J.J., G.P. Lardy, M.L. Bauer, T.C. Gilbery, and J.S. Caton. 2004. Effect of field pea
level on intake, digestion, microbial efficiency, ruminal fermentation, and in situ
disappearance in beef steers fed forage-based diets. J. Anim. Sci. 82:2185-2192.
doi:10.2527/2004.8272123x
Robinson, P.H. and R.E. McQueen. 1989. Non-structural carbohydrates in rations for
dairy cattle. Proceedings of the Western Canadian Dairy Seminar, p. 153-167
Sarrantonio, M. and E. Gallandt. 2003. The role of cover crops in North American
cropping systems. J. Crop Prod. 8(1-2): 53-74. doi:10.1300/j144v08n01_04
Savage, G.P. and S. Deo. 1989. The nutritive value of peas (Pisum sativum): A literature
review. Nutr. Abst. Rev. (Series A): 59:65-87
Scerra, M., P. Caparra, F. Foti, C. Cilione, G. Zappia, C. Motta, and V. Scerra. 2011.
Intramuscular fatty acid composition of lambs fed diets containing alternative
protein sources. J. Meat Sci. 87(3): 229-233. doi:10.1016/j.meatsci.2010.10.015
Smith, L.A., J.G.M. Houdijk, D. Homer, and I. Kyriazakis. 2013. Effects of dietary
inclusion of pea and fava bean as a replacement for soybean meal on grower and
finisher pig performance and carcass quality. J. Anim. Sci. 91: 3733-3741. doi:
10.2527/jas.2012-6157
Soto-Navarro, S.A., G.J. Williams, M.L. Bauer, T.C. Gilbery, and J.S. Caton. 2004.
Effect of field pea replacement level on intake and digestion in beef steers fed
byproduct-based medium concentrate diets. J. Anim. Sci. 82:1855-1862.
doi:10.2527/2004.8261855x
34
Soto-Navarro, S.A., A.M Encinias, M.L. Bauer, G.P. Lardy, and J.S. Canton. 2011.
Feeding value of field pea as a protein source in forage-based diets fed to beef
cattle. J. Anim. Sci. 90.2:585-591. doi:10.2527/jas.2011-4098
Stein, H.H., G. Benzoni, R.A. Bohlke, and D.N. Peters. 2004. Assessment of the feeding
values of South Dakota-grown field peas (Pisum savitum L.) for growing pigs. J.
Anim. Sci. 82:2568-2578. doi:10.2527/2004.8292568x
Stein, H.H., M.G. Boersma, and C. Pedersen. 2006. Apparent and true total tract
digestibility of phosphorus in field peas (Pisum sativum L.) by growing pigs. Can.
J. Anim. Sci. 96(2):121-127. doi:10.1139/cjas-2014-0172
Stein, H.H., A.K.R. Everts, K.K. Sweeter, D.N. Peters, R.J. Maddock, D.M. Wulf, and C.
Pedersen. 2006. The influence of dietary field peas (L.) on pig performance,
carcass quality, and the palatability of pork. J. Anim. Sci. 84(11):3110-3117.
doi:10.2527/jas.2005-744
USDA- National Agricultural Statistics Service. 2013. http://www.nass.usda.gov.htm
(Accessed 10 August 2016.)
Van Der Poel, A.F.B. 1990. Effect of processing on antinutritional factors and protein
nutritional value of dry beans (phaseolus vulgaris l.): A review. Anim. Feed Sci.
Tech. 29:179-208. doi:10.1016/0377-8401(90)90027-6
Vander Pol, M., A.N. Hristov. 2008. Peas can replace soybean meal and corn grain in
dairy cow diets. J Dairy Sci. 91.2: 698-703. doi:10.3168/jds.2007-0543
Vander Pol, M., A.N. Hristov, S. Zaman, N. Delano, and C. Schneider. 2009. Effect of
inclusion of peas in dairy cow diets on ruminal fermentation, digestibility, and
nitrogen losses. J Anim. Feed Sci. 150.1: 95-105.
doi:10.1016/j.anifeedsci.2008.08.009
Walhain, P., M. Foucart, and A. Théwis. 1992. Influence of extrusion on ruminal and
intestinal disappearance in sacco of pea (Pisum sativum) protein and starch.
Anim. Feed. Sci. Tech. 38:43-55 doi:10.1016/0377-8401(92)90075-H

35
Effects of Feeding Field Peas on Fresh Beef Quality
The author acknowledges the assistance of K.I. Domenech, E.K. Kunze, F.A. Ribeiro,
K.H. Jenkins, J.C. MacDonald, and C.R. Calkins in the research discussed in the
following chapter.

36
ABSTRACT
The objective of this study was to evaluate the use field peas during two phases of
production (grazing and finishing) on fresh beef quality. Cattle (n = 232) were randomly
assigned to one of six dietary treatments in a 3x2 factorial consisting of 3 pasture and 2
finishing supplementations. The pasture phase consisted of 1) no supplement, 2) field
peas at 0.5% body weight (BW), or 3) dry-rolled corn supplement at 0.5% of BW. The
finishing phase consisted of 1) field peas at 20% dry-matter basis (DM) or 2) no field
peas. During this two-year study, strip loin samples from steers (year 1) and heifers (year
2) were aged for 14 d. Steaks were subject to retail display (RD) for a total of 7 d.
Analyses included tenderness Warner-Bratzler shear force (WBSF) and Slice Shear force
(SSF), objective (L*, a*, and b*) and subjective color, lipid oxidation (TBARS) and fatty
acid composition. There were minimal effects due to diet. Discoloration, L*, and a*
displayed a triple interaction for retail display, pasture and finishing diets (p < 0.0001, p
= 0.0524, and p = 0.024, respectively). Although these interactions were statistically
significant, no consistent patterns among treatments could be identified. Dietary
treatment had no effect on tenderness (WBSF or SSF). Meat from cattle finished with
field peas had slightly greater lipid oxidation than samples from cattle not receiving field
peas during finishing (1.56 vs. 1.44 mg malonaldehyde/kg tissue, respectively; p =
0.0541). Content of saturated fatty acids, unsaturated fatty acids, monounsaturated fatty
acids, or polyunsaturated fatty acids (p > 0.05) was unaffected. Although there was a
significant interaction between pasture and finishing treatments for C15:1 (p = 0.0331),
the range in values was relatively low and no implications from these differences could
be identified. Supplementing cattle on pasture with field peas resulted in more C18:2 (p =

37
0.0381) fatty acids than when cattle were supplemented with corn, while cattle without
supplement were intermediate. These data indicate field peas may be used for cattle with
minimal negative impact on fresh meat quality.
Keyword: beef, fatty acid composition, field peas
INTRODUCTION
In recent years, field pea (Pisum sativum) production has grown rapidly within the
northern Great Plain states. Reasons for increased production include adaptability to the
climate and agronomic benefits including fixing nitrogen in soil. As the availability of
field peas increase, the portion of the crop that does not meet quality standards for human
consumption are being considered as an alternate nutritional feedstuff for livestock
production.
Due to the nutritional value, field peas have been used as a protein supplement in
ruminants (Soto-Navarro et al., 2011; Vander Pol et al., 2008, 2009) and as an energy
source for monogastrics (Smith et al., 2013) with varying results. Slight to no differences
have been found with the inclusion of field peas on carcass quality or yield grades
(Anderson et al., 2007; Stein et al., 2014). Researchers have also focused on tenderness
differences and sensory panel response and results indicate that dietary field pea inclusion
does not negatively impact beef palatability (Carlin et al., 2013). To date, fatty acid
profiles of beef fed field peas has not yet been determined.
The decision to utilize field pea in growing and finishing rations should be based
on cost, availability, and nutrient characteristics of the ration. While previous data has
indicated no negative results for production purposes from dietary inclusion, there is very

38
limited research that has been conducted to evaluate the effect of field peas on fresh meat
quality; particularly, fresh meat quality besides yield and quality grades. Therefore, the
objective of this study was to determine the impacts of field peas on meat quality,
including retail display characteristics, lipid oxidation, tenderness and fatty acid profiles.
MATERIALS AND METHODS
Cattle and Dietary Treatments
A total of 232 crossbred cattle (replicated over 2 yrs; steers during year one,
heifers during year 2) were subjected to one of three background treatments on crested
wheatgrass pastures with either: 1) no supplement, 2) field peas at 0.5% BW, or 3) dry-
rolled corn supplemented at 0.5% BW and one of two finishing treatments: 1)
supplemented with field peas (20% on a DM basis) or 2) no peas were added to the diet. .
Upon arrival in the feedlot (University of Nebraska-Lincoln Panhandle Research and
Extension Center, Scottsbluff, NE), all cattle remained in their original block according
to original BW block in order for randomization to be fully random. During year 1, steers
were fed for approximately 119 d in the feedlot while the heifers, during year 2, were
finished for 131 d.
Sample Collection and Fabrication
All cattle were slaughtered at Tyson Fresh Meats Inc. (Lexington, NE). Carcasses
were chilled for 24 h prior to marbling determination by a United States Department of
Agriculture (USDA) beef carcass supervisor. After grading, a 7.62 cm-thick slice of the
anterior portion of the strip loin (Longissimus lumborum) was collected at the 12th/13th rib
area from each side of every carcass. All samples were vacuum packaged and transferred
to the Loeffel Meat Laboratory at the University of Nebraska-Lincoln.
39
Samples were immediately deboned by hand and were cut using a slicer (SE 12D
manual slicer, Bizerba, Piscataway, NJ). The samples taken from the right side of the
carcass were used for tenderness evaluation and fatty acid analysis. After facing the
surface on both sides (<0.635 cm), a 2.54 cm steak was cut for Warner-Bratzler shear
force and Slice Shear force testing for day 0 of retail display and the remaining portion
was used for fatty acid analysis. The samples taken from the left side of the carcass were
used for retail display, tenderness evaluation and oxidation. After facing the surface of
both sides (<0.635 cm), a 2.54 cm steak was cut for WBSF and SSF testing for day 7 of
retail display and the remaining portion was used for thiobarbituric acid reactive
substances (TBARS). Samples for TBARS for day 0, 4, and 7 come from one steak (1.27
cm thick) that was divided into three portions and trimmed of all subcutaneous fat. The
portion for d 0 was its own steak but it also was a steak sampled for proximate analysis.
The steaks that were used to evaluate fatty acid composition and oxidation were vacuum
packaged using a MULTIVAC 500 (Multivac, Inc., Kansas City, MO) in Prime Source
Vacuum pouches (15.24 x 25.4 cm 3 mil STD Barrier). Steaks for tenderness evaluation
and retail display were packaged with an INTACT machine (Cryovac, Inc., Kansas City,
MO) and placed in boxes for the aging process.
All samples were placed in boxes and aged for 14 days. After aging, steaks for
visual discoloration, tenderness and lipid oxidation were placed on foam trays (21.6 x
15.9 x 2.1 cm, Styro-Tech, Denver, CO), overwrapped with oxygen permeable film
(PVC-OW; PSM18, Prime Source, St. Louis, MO) and placed under RD conditions for 4
and 7 d (2.7°C under white fluorescence lighting at 1000 to 1800 lux). Steaks used for
fatty acid profile, proximate composition and 0 d RD were vacuum packaged and frozen

40
for further analysis (-80°C). Samples trimmed of all subcutaneous fat for proximate
analysis, fatty acids, and lipid oxidation were frozen in liquid nitrogen and powdered in a
metal cup blender (Model 51BL32, Waring Commercial, Torrington, CT). Powdered
samples were stored at -80°C.
Subjective Color (Visual Discoloration) and Objective Color (L*, a*, and b* values)
Visual discoloration was assessed daily during retail display with a trained six-
person panel. Panelists were provided a visual discoloration guide to use as a reference. A
percentage scale was used where 0% meant no discoloration and 100% meant complete
discoloration. Panelists were instructed to perform the evaluation at the same time each
day to minimize variation. Samples were randomly rotated daily to minimize any
possible location effects.
Objective color measurements were made each day for seven days at about 10
a.m. each day. Measurements were obtained for CIE L*, a*, and b* values using a
Minolta CR-400 colorimeter (Minolta, Osaka, Japan) set at a D65 light source and 2°
observer with an 8 mm diameter measurement area. The colorimeter was calibrated daily
using a white ceramic tile provided by the manufacturer, and color measures were
obtained by averaging 6 readings from different areas of the steak surface. The CIE L*
measured lightness (black = 0, white = 100), a* measured redness (red = positive values,
green = negative values) and b* measured yellowness (yellow = positive values, blue =
negative values).

41
Tenderness Evaluation –Warner-Bratzler Shear Force (WBSF) & Slice Shear Force
(SSF)
Steaks from the right side of the carcass were used to evaluate tenderness on day
0 of retail display while steaks from the left side of the carcass were used to measure
tenderness on day 7. For all steaks (never frozen), an internal raw temperature and weight
were recorded. Steaks were cooked to a target temperature of 160°F on a Belt Grill
(TBG60-V3 MagiGril, MagiKitch’n Inc., Quakertown, PA). Belt Grill specifications
were as follows: preheat = 149°C, top heat = 163°C, bottom heat = 163°C, height of gap
= 2.16 cm, and cook time was approximately 5.5 minutes. After cooking, an internal
temperature and weight were recorded and slice shear force evaluation was conducted
using a Food Texture Analyzer with a Slice Shear force blade. The remainder of the steak
was individually bagged and stored in a cooler (maintained at 33°F). Approximately 24
hours after SSF evaluation was conducted, six cores (1/2-inch diameter) were removed
parallel to the muscle fiber orientation of each steak and were measured with a Food
Texture Analyzer with a Warner-Bratzler blade.
Lipid Oxidation
Lipid oxidation was determined with the 2-thiobarbituric acid reactive substances
protocol (TBARS) as described by Ahn et al. (1998) for steaks in the stimulated retail
display condition for 0, 4, and 7 d. Approximately 5 g of powdered sample were weighed
into a 50 mL conical tube to which 14 mL of deionized distilled water and 1 mL of BHA
(10% BHA: 90% ethanol) were added. After polytroning for 15 s, the samples were
centrifuged (2,000 x g for 5 min.). One mL of the supernatant was transferred to a 15 mL
conical tube and 2 mL of TBA/TCA solution (15% TCA and 20 mm TBA in deionized
42
distilled water) was added and vortexed before placing samples in a water bath (70°C for
30 min). After cooling, samples were centrifuged (2,000 x g for 5 min) and 200 μL of
supernatant were transferred to 96-well plates. All 96-well plates had standards to
calculate standard curves and ultimately mg of malonaldehyde per kg of tissue read at
540 nm.
Proximate Analysis
Proximate analysis was conducted to determine fat, moisture and ash content;
with, protein content determined by the difference. Fat was quantified using the Soxhlet
procedure (AOAC, 1990). Samples were measured in triplicate in Whatman #2 filter
paper and fat was extracted with ether. Fat percentages were averaged per sample and
used to convert fatty acid percent data to mg/100 g tissue basis. Moisture and ash were
determined with a LECO thermogravimetric analyzer (LECO Corporation, Model 604-
100-400, St. Joseph, MI), and samples were measured in duplicate. Moisture was
determined in nitrogen atmosphere with a state temperature of 25°C and an end
temperature of 130°C (~17 min ramp rate). Ash was determined in oxygen atmosphere
with a start temperature of 130°C and an end temperature of 600°C (30 min ramp rate).
Fatty Acid Composition
Total lipid was extracted following the chloroform-methanol procedure of Folch
et al. (1957) with modifications detailed by Morisson and Smith (1964) and Metcalfe et
al. (1966). Briefly, 1 g of powdered sample was weighed into a 15 mL conical tube to
which 5 mL of 2:1 chloroform:methanol was added and vortexed for 5 s. After one hour,
samples at room temperature were filtered through Whatman #2 filter paper onto a 13 x
150 mm glass screw cap tube, volume was brought up to 10 mL with 2:1

43
chloroform:methanol and 2 mL of KCl were added and vortexed. After centrifuging
samples (1,000 x g for 5 min) the top organic matter layer was aspirated off and samples
were died down completely on a heating block (60°C) under constant nitrogen purge.
One half mL of 0.5 M NaOH in methanol was added, vortexed and heated (100°C) for 5
min. Then, boron trifluoride in 14% methanol (0.5 mL) was added, vortexed and heated
(100°C for 5 min). Subsequently, 1 mL of saturated salt solution and 1 mL of hexane
were added and samples were centrifuged (1,000 x g for 5 min). The top hexane layer
was carefully pipetted into gas chromatography glass vials, nitrogen purged and lids were
immediately crimped on. Chromatography was done using a Chromopack CP-Sil (0.25
mm x 100 m) column with an injector temperature of 270°C and a detector temperature
of 300°C (Hewlett-Packard 6890 FID GC System; Agilent Technologies, Santa Clara,
CA). The head pressure was set at 40 psi with a flow rate of 1.0 mL/min. The fatty acids
were identified by their retention times in relation to known standards and the percentage
of fatty acids were determined by the peak areas in the chromatograph. Values were
adjusted according to percent fat and values were converted to mg/100 g tissue.
Statistical Analysis
This study was conducted with a treatment design of a 3 x 2 factorial
(backgrounding diet x finishing diet) and analyzed using SAS® 9.4 package, SAS
Institute, Inc., USA. Objective color and percent discoloration were analyzed for
treatment main effects using the PROC GLIMMIX procedure of SAS with day as
repeated measures when traits were measured over time. All other analyses were
conducted with PROC GLIMMIX as well; all means were separated with the LS

44
MEANS statement and TUKEY adjustment with an alpha level of 0.05 and tendencies
were considered at an alpha level of 0.10.
RESULTS AND DISCUSSION
Quality Grade Assessment
In this study, every side from all carcasses was sampled, regardless of treatment.
Due to both sides being used for various laboratory analyses, the marbling scores were
collected and averaged for the overall carcass. After the marbling scores were averaged,
the grade distribution was calculated for the total number of samples and were as follows:
2.2% low Prime, 11.2% high Choice, 33.5% average Choice, 42.8% low Choice and
10.3% Select. There were no quality grade differences due to dietary treatment (P >
0.05).
Color Evaluation
Discoloration had triple interactions of retail display, by pasture, by finishing
diets (P < 0.0001; Table 1). As expected, discoloration increased as retail display time
increased. Studies have reported a decline in the purchasing of retail displayed beef when
surface discoloration reached 20% of the surface or greater (Hood and Riordan, 1973).
However, samples only reached 1.47% discoloration (overall average) by d 7 irrespective
of dietary treatment during both combined years. It is concluded in the current study the
magnitude of difference would require extended aging periods to visually influence the
color differences perceived by consumers. L* and a* also displayed triple interactions of
retail display, by pasture, by finishing diets (p = 0.0524 and p = 0.024, Table 2 and
Figure 1, respectively). Even though a significant triple interaction was found for L*, it
45
should be noted the values only ranged between 43.61 and 44.99. Furthermore, all
treatments acted as expected for a* and followed a downward trend from d 0 to d 7.
However, on any given day, there were no statistical differences among treatments. It is
concluded the magnitude in decline of a* varied among treatments creating a significant
three- way interaction. Although there were statistically significant interactions for
discoloration, L*, and a*, no consistent patterns due to treatments could be discerned.
Evaluations of b* displayed a main effect of retail display (P ≤ 0.0001). Similarly to a*,
all values decreased in a downward trend from d 0 to d 7.
Tenderness
Tenderness (measured with WBSF and SSF) only presented differences due to
retail display, showing an increase in tenderness with days of retail display (P < 0.0001).
Neither backgrounding, nor finishing treatments influenced tenderness measurements.
The WBSF and SSF measurements decreased from day 0 to day 7 of retail display (3.61
vs. 2.90 and 17.92 vs. 15.26; respectively), thus indicating an increase in tenderness. A
strong correlation between WBSF and SSF was observed (r = 0.65; P < 0.0001). These
results are in disagreement with those observed by Hinkle et al. (2010) in which Warner-
Bratzler shear force decreased linearly as field peas increased in the diet with the lowest
shear force value occurring at the highest level of peas. Carlin et al. (2013) conducted
two experiments, one with similar results to that of Hinkle et al. with an increase in
tenderness while the other experiment had similar results to the current study with no
differences observed. It is well known the calpain-calpastatin system has an important
role in tenderization of meat (Geesink et al., 2006); therefore, the authors also found a
linear decrease in calpastatin activity with increasing dietary field peas. Although there

46
were no observed differences in the current study, these results indicate the inclusion of
field peas in the diet may alter post-mortem proteolysis and provide some explanation for
the increase in tenderness observed in other studies. Because these results are not
consistent among studies, it would be warranted to continue to evaluate the effects of
field peas in beef cattle diets that provided further research focuses on understanding the
mechanism that drives the improvement in tenderness.
Lipid Oxidation
The current study indicated meat from cattle finished with field peas had slightly
greater lipid oxidation that samples from cattle not receiving field peas during finishing
(1.56 vs. 1.44 mg malonaldehyde/kg tissue, respectively; p = 0.0541). By-products are
generated as a result of oxidation and are responsible for the development of off-flavors
in meat products (Greene, 1969). In the current study, there was a statistically significant
trend for the finishing diet, however, this is not a meaningful difference and it would
require a longer period in retail display conditions in order to promote greater levels of
oxidation. As expected, lipid oxidation increased over time of simulated retail display (d0
= 0.94, d4 = 1.46, and d7 = 2.11 mg malonaldehyde/kg tissue; P < 0.0001).
Proximate Analysis
Backgrounding and finishing diets had no effect (P > 0.05) on moisture
(70.30%), protein (21.03%), fat (7.17%), or ash (1.49%) content in beef. Table 3
represents the proximate analysis for each of the dietary treatments. These results are in
accordance to those reported by Domenech et al. (2014) where cattle receiving several
inclusion levels of full-fat or de-oiled WDGS (wet distillers grains plus solubles) had no
differences in moisture, protein, fat and ash content. Additionally, Mills et al. (1992)

47
conducted an experiment feeding corn silage and alfalfa hay to Holstein and crossbred
steers with varying levels of protein sources of either soybean meal or fish meal and
observed no differences in proximate analysis of beef.
Fatty Acid Composition
Table 3 represents the fatty acid profiles of all the dietary treatments reported in
mg/100 g of tissue basis. Dietary treatment had no effect on content of saturated fatty
acids, unsaturated fatty acids, monounsaturated fatty acids, or polyunsaturated fatty acids
(P > 0.05; Table 4). There was a significant interaction between pasture and finishing
treatments for C15:1 but the range in values was relatively low and no implications from
these differences could be identified. Supplementing cattle on pasture with field peas
resulted in significantly more C18:2 fatty acids than when cattle were supplemented with
corn, while cattle without supplement were intermediate. However, these differences did
not carry over into total PUFA content, and did not differ among treatments. Although
fatty acid composition for field peas has not been reported in beef, Scerra et al. (2011)
has reported the composition of intramuscular fatty acids for lambs. Unlike the current
study in which no differences were found, Scerra et al. found significant increase in
linolenic acid (C18:3 n-3) and total n-3 PUFA content compared to lambs given faba
bean or soybeam meal, resulting in a decrease in the n-6/n-3 ratio. Furthermore, even
with differences between the two studies as for which fatty acid was affected; both
studies conclude no negative impacts on meat quality.
CONCLUSION
Overall, there were minimal effects on color, tenderness and other shelf-life
characteristics of fresh meat. In conclusion, these data indicate field peas may be used as

48
an alternative diet for growing and finishing cattle with minimal to no negative impact on
fresh meat quality.
49
LITERATURE CITED
Ahn, D.U., D.G. Olson, C. Jo, X. Chen, C. Wu, J.I. Lee. 1998. Effect of muscle type,
packaging, and irradiation on lipid oxidation, volatile production, and color in raw
pork patties. Meat Sci. 47:27-39.
AOAC. 1990. Official methods of analysis of AOAC (Association of Official Analytical
Chemists) international. 18th edition. AOAC International, Arlington, VA, USA.
Carlin, K.M., V.L. Anderson, D.M. Larson, B.R. Ilse, R.J. Maddock, M.L. Bauer, and
G.P.Lardy. (2013). Effects of increasing field pea (Pisum savitum) level in high-
concentrate diets on meat tenderness and sensory taste panel attributes in finishing
steers and heifers. Prof. Anim. Sci. 29.1:33-38
Domenech, K.I., K.A. Varnold, M.E. Semler, M.D. Chao, T.F. Jones, G.E. Erickson, and
C.R. Calkins. 2014. Effect of feeding de-oiled wet distillers grains plus solubles
on beef fatty acid profiles. 2014 Nebraska Beef Cattle Report: 116-118.
Geesink, G.H., S. Kuchay, A.H. Chishti, and M. Koohmaraie. 2006. μ-Calpain is
essential for postmortem proteolysis of muscle proteins. J. Anim. Sci. 84:2834-
2840.
Greene, B.E. 1996. Lipid oxidation and pigment changes in raw beef. J. Food Sco.
34:110-113.
Greenwell, H.L., J. L. Gramkow, M. Jolly-Breithaupt. K.H. Jenkins, and J.C.
MacDonald. 2016. Effect of field pea usage in growing and finishing diets for
beef cattle. In preparation.
Hinkle, J.H., J. Vasconcelos, S.A. Furman, A.S. de Mello Jr., and L.S. Senaratne, S.
Pokharel, and C.R. Calkins. 2010. Sensory attributes of beef from steers fed field
peas. Nebraska Beef Report. 567.
Folch, J., M. Lees, G.H.S. Stanley. 1957. A simple method for the isolation and
purification of total lipids from animal tissue. J. Biol. Chem. 226:497-509.
Metcalfe, L.D., A.A. Schmitz, J.R. Pelka. 1966. Rapid preparation of fatty acid esters
from lipids for gas chromatographic analysis. Anal. Chem. 38:514-515.
Mills, E.W., J.W. Comerford, R. Hollender, H.W. Harpster, B. House, and W.R.
Henning. 1992. Meat composition and palatability of Holstein and beef steers as
influences by forage type and protein source. J. Anim. Sci. 70(8):2446-2451.
Morrison, W.R. and L.M. Smith. 1964. Preparation of fatty acid methyl esters and
dimethylacetals from lipids with boron fluoride-methanol. J. Lipid Res. 5:600-
608.

50
Scerra, M., P. Caparra, F. Foti, C. Cilione, G. Zappia, C. Motta, and V. Scerra.
Intramuscular fatty acid composition of lambs fed diets containing alternative
protein sources. Meat Sci. 87(3):229-233.
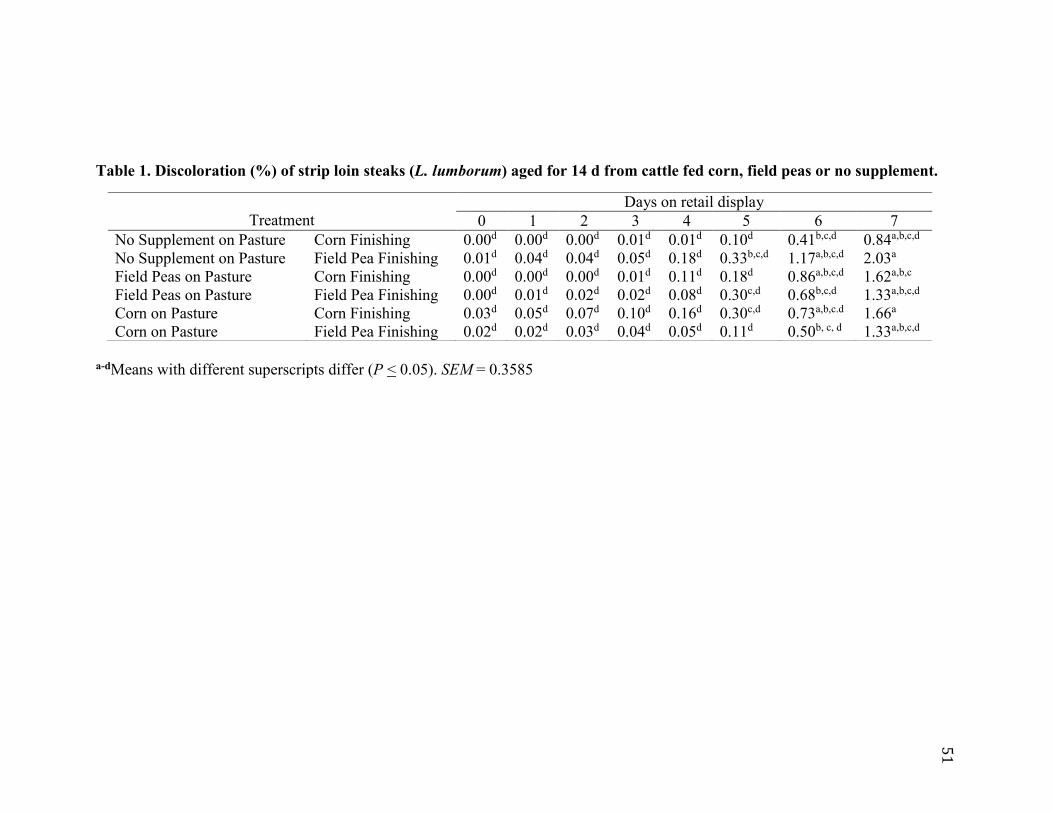
51
Table 1. Discoloration (%) of strip loin steaks (L. lumborum) aged for 14 d from cattle fed corn, field peas or no supplement.
a-dMeans with different superscripts differ (P < 0.05). SEM = 0.3585
Treatment
Days on retail display
0 1 2 3 4 5 6 7
No Supplement on Pasture Corn Finishing 0.00d 0.00d 0.00d 0.01d 0.01d 0.10d 0.41b,c,d 0.84a,b,c,d
No Supplement on Pasture Field Pea Finishing 0.01d 0.04d 0.04d 0.05d 0.18d 0.33b,c,d 1.17a,b,c,d 2.03a
Field Peas on Pasture Corn Finishing 0.00d 0.00d 0.00d 0.01d 0.11d 0.18d 0.86a,b,c,d 1.62a,b,c
Field Peas on Pasture Field Pea Finishing 0.00d 0.01d 0.02d 0.02d 0.08d 0.30c,d 0.68b,c,d 1.33a,b,c,d
Corn on Pasture Corn Finishing 0.03d 0.05d 0.07d 0.10d 0.16d 0.30c,d 0.73a,b,c.d 1.66a
Corn on Pasture Field Pea Finishing 0.02d 0.02d 0.03d 0.04d 0.05d 0.11d 0.50b, c, d 1.33a,b,c,d
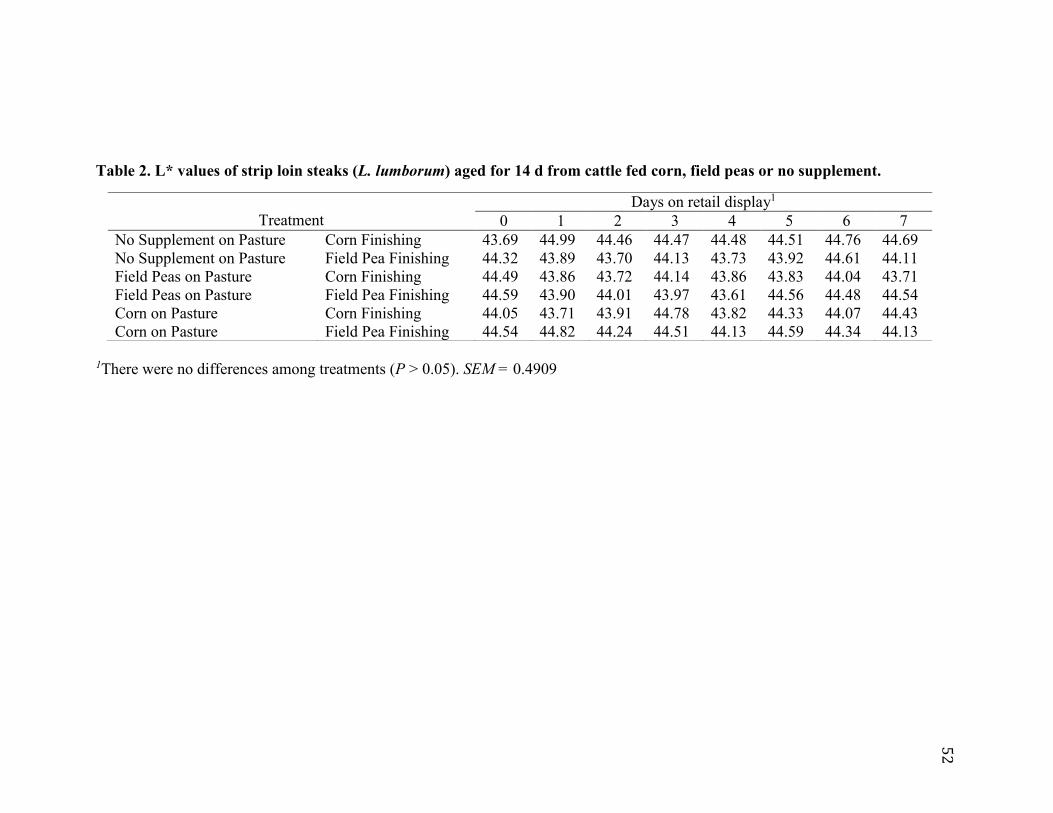
52
Table 2. L* values of strip loin steaks (L. lumborum) aged for 14 d from cattle fed corn, field peas or no supplement.
1There were no differences among treatments (P > 0.05). SEM = 0.4909
Treatment
Days on retail display1
0 1 2 3 4 5 6 7
No Supplement on Pasture Corn Finishing 43.69 44.99 44.46 44.47 44.48 44.51 44.76 44.69
No Supplement on Pasture Field Pea Finishing 44.32 43.89 43.70 44.13 43.73 43.92 44.61 44.11
Field Peas on Pasture Corn Finishing 44.49 43.86 43.72 44.14 43.86 43.83 44.04 43.71
Field Peas on Pasture Field Pea Finishing 44.59 43.90 44.01 43.97 43.61 44.56 44.48 44.54
Corn on Pasture Corn Finishing 44.05 43.71 43.91 44.78 43.82 44.33 44.07 44.43
Corn on Pasture Field Pea Finishing 44.54 44.82 44.24 44.51 44.13 44.59 44.34 44.13

53
Table 3. Proximate analysis1 of strip loin steaks (L. lumborum) aged for 14 d from cattle fed corn, field peas or no supplement. 1There were no differences among treatments (P > 0.05). SEM = 0.3610 2Protein was calculated by subtracting the sum of moisture, fat, and ash from 100
Treatment Moisture Fat Ash Protein2
No Supplement on Pasture Corn Finishing 70.38 7.11 1.49 21.02
No Supplement on Pasture Field Pea Finishing 69.82 7.73 1.43 21.02
Field Peas on Pasture Corn Finishing 70.37 6.99 1.51 21.13
Field Peas on Pasture Field Pea Finishing 70.60 6.92 1.54 20.94
Corn on Pasture Corn Finishing 70.36 7.13 1.51 21.02
Corn on Pasture Field Pea Finishing 70.26 7.13 1.49 21.12
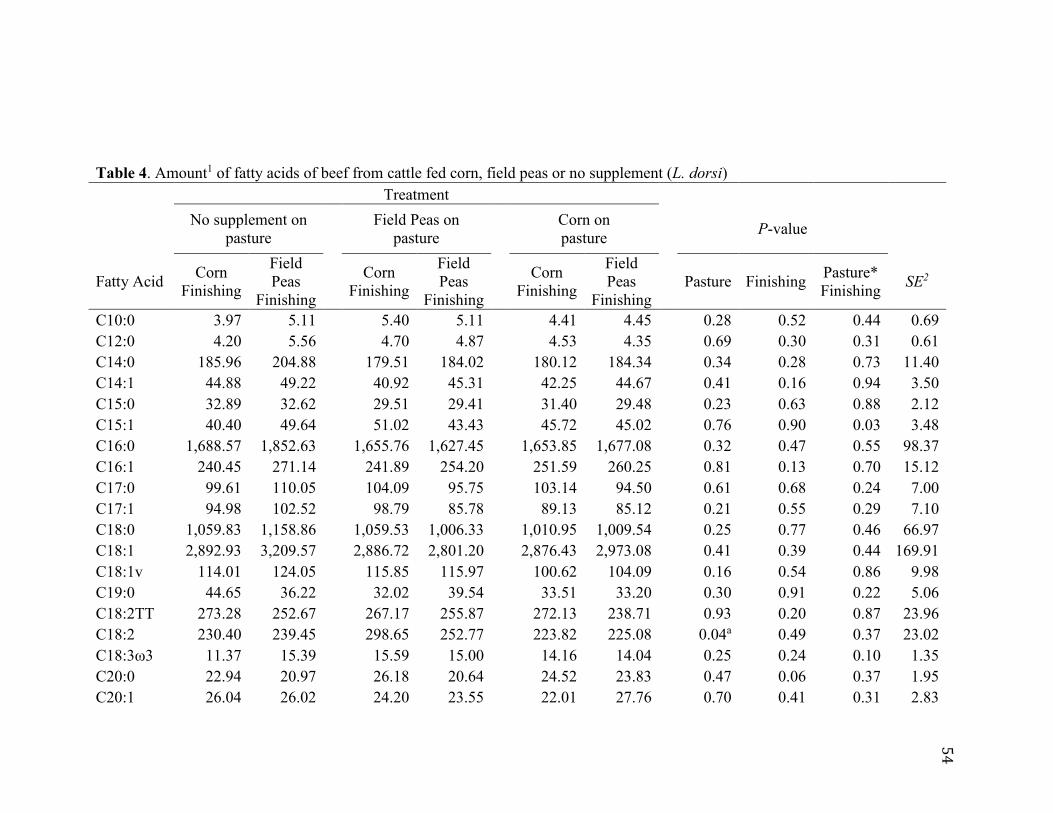
54
Table 4. Amount1 of fatty acids of beef from cattle fed corn, field peas or no supplement (L. dorsi)
Treatment
No supplement on
pasture
Field Peas on
pasture
Corn on
pasture P-value
Fatty Acid Corn
Finishing
Field
Peas
Finishing
Corn
Finishing
Field
Peas
Finishing
Corn
Finishing
Field
Peas
Finishing
Pasture Finishing Pasture*
Finishing SE2
C10:0 3.97 5.11
5.40 5.11
4.41 4.45
0.28 0.52 0.44 0.69
C12:0 4.20 5.56
4.70 4.87
4.53 4.35
0.69 0.30 0.31 0.61
C14:0 185.96 204.88
179.51 184.02
180.12 184.34
0.34 0.28 0.73 11.40
C14:1 44.88 49.22
40.92 45.31
42.25 44.67
0.41 0.16 0.94 3.50
C15:0 32.89 32.62
29.51 29.41
31.40 29.48
0.23 0.63 0.88 2.12
C15:1 40.40 49.64
51.02 43.43
45.72 45.02
0.76 0.90 0.03 3.48
C16:0 1,688.57 1,852.63
1,655.76 1,627.45
1,653.85 1,677.08
0.32 0.47 0.55 98.37
C16:1 240.45 271.14
241.89 254.20
251.59 260.25
0.81 0.13 0.70 15.12
C17:0 99.61 110.05
104.09 95.75
103.14 94.50
0.61 0.68 0.24 7.00
C17:1 94.98 102.52
98.79 85.78
89.13 85.12
0.21 0.55 0.29 7.10
C18:0 1,059.83 1,158.86
1,059.53 1,006.33
1,010.95 1,009.54
0.25 0.77 0.46 66.97
C18:1 2,892.93 3,209.57
2,886.72 2,801.20
2,876.43 2,973.08
0.41 0.39 0.44 169.91
C18:1v 114.01 124.05
115.85 115.97
100.62 104.09
0.16 0.54 0.86 9.98
C19:0 44.65 36.22
32.02 39.54
33.51 33.20
0.30 0.91 0.22 5.06
C18:2TT 273.28 252.67
267.17 255.87
272.13 238.71
0.93 0.20 0.87 23.96
C18:2 230.40 239.45
298.65 252.77
223.82 225.08
0.04a 0.49 0.37 23.02
C18:3ω3 11.37 15.39
15.59 15.00
14.16 14.04
0.25 0.24 0.10 1.35
C20:0 22.94 20.97
26.18 20.64
24.52 23.83
0.47 0.06 0.37 1.95
C20:1 26.04 26.02
24.20 23.55
22.01 27.76
0.70 0.41 0.31 2.83

55
C20:3ω6 14.01 15.24
14.47 14.28
14.96 13.46
0.91 0.84 0.35 1.03
C20:4ω6 41.11 42.05
43.15 41.96
43.01 41.34
0.91 0.73 0.83 2.44
C22:5 12.45 14.57
11.98 12.07
12.28 11.56
0.13 0.50 0.26 0.94
Total 7,106.65 7,749.47
7,092.94 6,894.24
7,000.84 7,059.18
0.41 0.57 0.49 387.66
Other 22.77 49.72
46.15 27.79
52.25 50.93
0.32 0.80 0.14 12.48
SFA2 3,123.64 3,372.91
3,075.65 2,994.65
3,024.53 3,040.94
0.33 0.65 0.60 179.91
UFA2 3,983.02 4,376.57
4,017.30 3,899.59
3,976.32 4,018.24
0.49 0.51 0.42 214.44
SFA:UFA2 0.78 0.78
0.77 0.77
0.77 0.76
0.54 0.69 0.95 0.02
MUFA2 3,433.64 3,817.86
3,429.83 3,358.83
3,419.25 3,505.81
0.44 0.38 0.46 199.74
PUFA2 549.38 558.70
587.47 540.77
557.07 512.43
0.60 0.26 0.57 32.44
ω6 52.56 52.93
54.63 54.21
55.24 51.30
0.83 0.57 0.72 3.07
ω3 11.37 15.39
15.59 15.00
14.16 14.04
0.25 0.24 0.10 1.35
ω6:ω3 4.59 3.90
3.96 3.81
4.66 4.00
0.34 0.06 0.64 0.38 1Amount (mg/100 g tissue) of fatty acid in powdered loin sample determined by gas chromatography. Fat percentage was calculated
by proximate analysis. 2SEM = Standard Error of the Mean, SFA = Saturated fatty acids, UFA= Unsaturated fatty acids, SFA:UFA = Saturated fatty acids:
Unsaturated fatty acids, MUFA= Monounsaturated fatty acids, and PUFA=Polyunsaturated fatty acids aFor C18:2, means separation were as follows: no supplement = 234.93ab, field pea = 275.71a, and corn = 224.45b.
56
Figure 1. a* values of strip loin steaks (L. lumborum) aged for 14 d from cattle fed corn,
field peas, or no supplement.
Retail display by pasture treatment by finishing treatment interaction (p = 0.0240; SEM=
0.3747)
Figure 2. b* values of strip loin steaks (L. lumborum) aged for 14 d from cattle fed corn,
field peas, or no supplement.
b* values displayed a retail display effect (P < 0.0001; SEM = 0.0690)

57
18.00
19.00
20.00
21.00
22.00
23.00
24.00
0 1 2 3 4 5 6 7
a*
RD (d)
Peas + Peas
Nothing + Peas
Corn + Peas
Peas + No Peas
Nothing + No Peas
Corn + No Peas
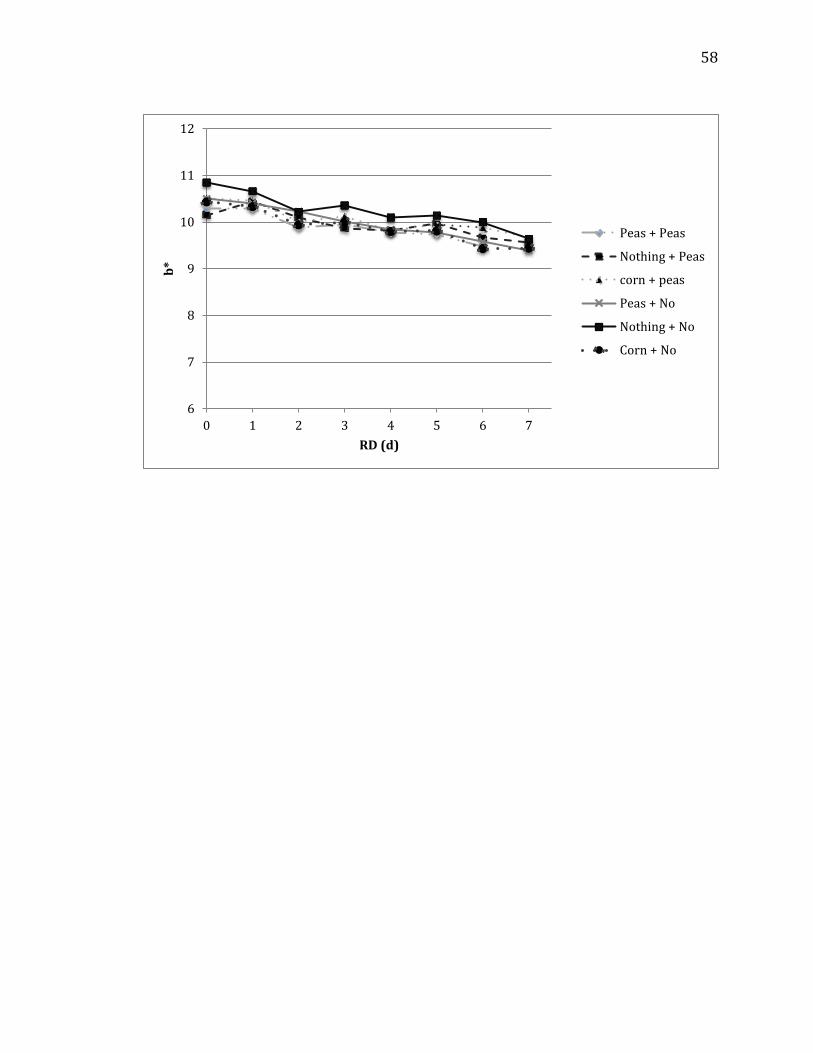
58
6
7
8
9
10
11
12
0 1 2 3 4 5 6 7
b*
RD (d)
Peas + Peas
Nothing + Peas
corn + peas
Peas + No
Nothing + No
Corn + No
59
RECOMMENDATIONS FOR FUTURE RESEARCH
Although the current study had few significant differences, I believe there are
many possibilities to build upon my work and others in literature. Some suggestions for
future research can include:
1. The current study evaluated field peas vs. other dietary treatments so rather than a
black or white study, future research may analyze the same fresh meat qualities in
varying percentages in the diet. True, this has been well established in research in
multiple production settings but fresh meat evaluation has not.
2. This study established the fatty acid profile of lean samples but it may be
interesting to establish the fatty acid profile of the subcutaneous fat. Although
very minimal discoloration was seen for the lean portion of the steak, it was noted
the fat portion of the steak not only became darker, but also looked slightly green
during the subjective color analysis. Depending on the fatty acids present, it may
explain the lack of differences in color and lipid oxidation.
3. I would have also liked to extend the retail display portion of this study.
Subjective discoloration peaked at 1.47% (overall average) across all treatments
but I am unsure if this trend would continue if the retail display portion was
extended to 10 days or more.
4. There are still very large differences in tenderness that have been reported for
beef fed field peas. I believe more differences would be found if the inclusion
level was varied.
5. To date and to the authors knowledge, only one study has evaluated the consumer
acceptance of beef fed field peas and in that study, there were positive

60
correlations between the increase inclusion of field peas and juiciness and
tenderness identified by a consumer panel. If this trend was to continue and
consumers could identify differences for treatments, it may be of value to validate
a new study.

61
Appendix I. DIETARY TREATMENT (Year 1 & 2)
Grazing Phase:
1. Control Treatment: No supplement, solely grazed pasture
2. Field Pea Treatment: Supplemented at 0.5% BW, dry matter basis
100% Field Peas
3. Corn Treatment: Supplemented at 0.5% BW, dry matter basis
70.8% Dry-rolled corn, 24% Solubles, 5.2% Urea
4. Pastures nutrient composition is below:
Table 1. Nutrient Analysis of Pastures 2015 – Year 2
Nutrient Analysis June 2015 August 2015 SEM P-value
Organic Matter 89.0% 88.9% 0.367 0.866
IVDMD
49.0% 40.3% 1.018 0.004
IVOMD 48.2% 38.8% -- --
NDF 69.5% 68.8% 0.854 0.623
ADF
CP
47.6%
8.84%
48.0%
6.39%
0.305
--
0.399
--
Finishing Phase:
Cattle were fed ad libitum during the entire feeding period. Two treatments and
composition are listed below. Percentages are on a dry matter basis. Tylan (90 mg/hd)
and Rumensin (360 mg/hd/day) were also provided in the diet.
Feedstuff “No Peas” “Peas”
DRC 60% 40%
WDGS 20% 20%
Field Peas 0% 20%
Corn Silage 14% 14%
Supplement 6% 6%
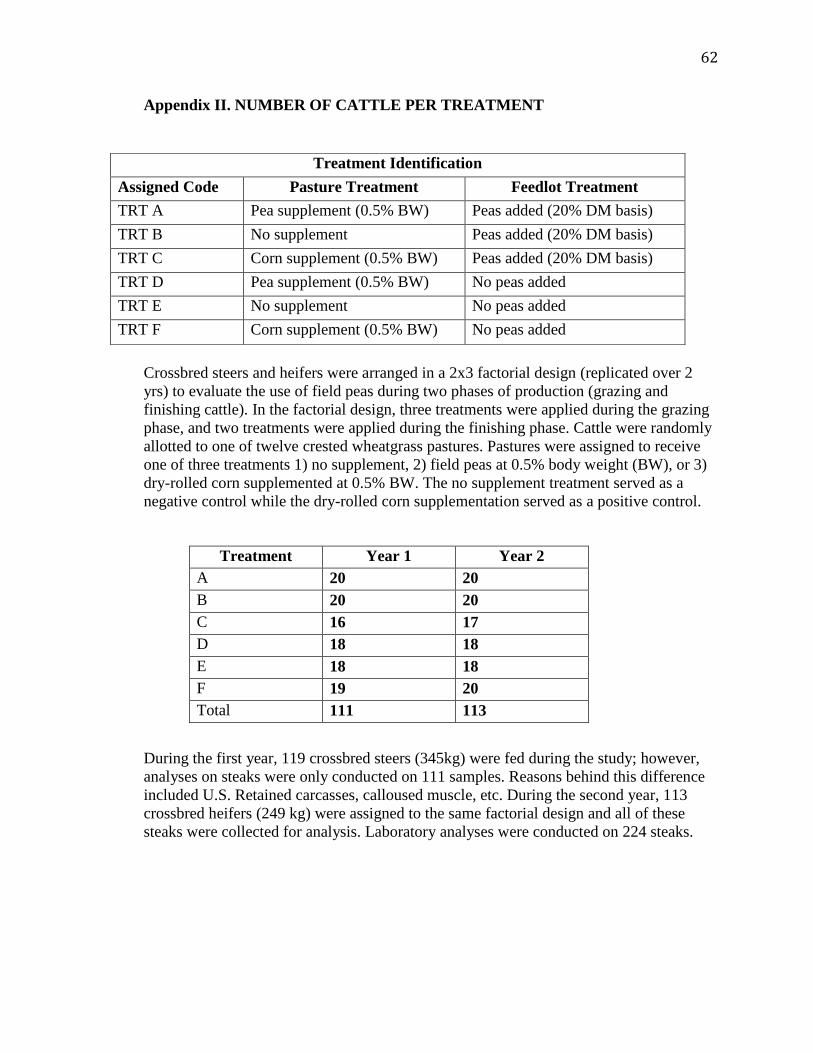
62
Appendix II. NUMBER OF CATTLE PER TREATMENT
Crossbred steers and heifers were arranged in a 2x3 factorial design (replicated over 2
yrs) to evaluate the use of field peas during two phases of production (grazing and
finishing cattle). In the factorial design, three treatments were applied during the grazing
phase, and two treatments were applied during the finishing phase. Cattle were randomly
allotted to one of twelve crested wheatgrass pastures. Pastures were assigned to receive
one of three treatments 1) no supplement, 2) field peas at 0.5% body weight (BW), or 3)
dry-rolled corn supplemented at 0.5% BW. The no supplement treatment served as a
negative control while the dry-rolled corn supplementation served as a positive control.
During the first year, 119 crossbred steers (345kg) were fed during the study; however,
analyses on steaks were only conducted on 111 samples. Reasons behind this difference
included U.S. Retained carcasses, calloused muscle, etc. During the second year, 113
crossbred heifers (249 kg) were assigned to the same factorial design and all of these
steaks were collected for analysis. Laboratory analyses were conducted on 224 steaks.
Treatment Identification
Assigned Code Pasture Treatment Feedlot Treatment
TRT A Pea supplement (0.5% BW) Peas added (20% DM basis)
TRT B No supplement Peas added (20% DM basis)
TRT C Corn supplement (0.5% BW) Peas added (20% DM basis)
TRT D Pea supplement (0.5% BW) No peas added
TRT E No supplement No peas added
TRT F Corn supplement (0.5% BW) No peas added
Treatment Year 1 Year 2
A 20 20
B 20 20
C 16 17
D 18 18
E 18 18
F 19 20
Total 111 113

63
Appendix III. QUALITY GRADE ASSESSMENT
In this study, every side from all carcasses was collected regardless of treatment.
Due to both sides being used for various laboratory analyses, the marbling scores were
collected and averaged for the overall carcass.
After the marbling scores were averaged, the marbling grade distribution was calculated
for the total number of head in the study. The grade distribution ranged from low prime
to low select. There were no quality grade differences due to dietary treatment (P > 0.05).
Quality Grade Cattle Distribution (%)
Low Prime 2.2
High Choice 11.2
Average Choice 33.5
Low Choice 42.8
Select 10.3
525
7596
23
Marbling Score Distribution (n = 224)
Slightly Abundant
Moderate
Modest
Small
Slight
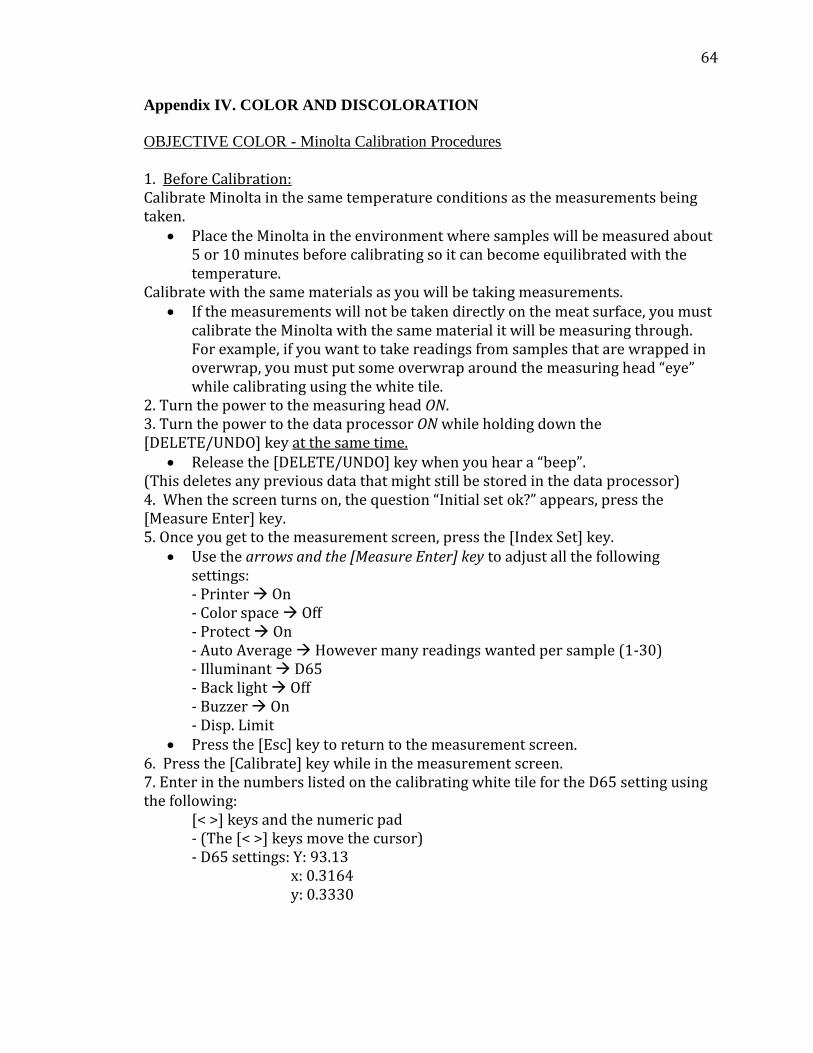
64
Appendix IV. COLOR AND DISCOLORATION
OBJECTIVE COLOR - Minolta Calibration Procedures
1. Before Calibration: Calibrate Minolta in the same temperature conditions as the measurements being taken.
Place the Minolta in the environment where samples will be measured about 5 or 10 minutes before calibrating so it can become equilibrated with the temperature.
Calibrate with the same materials as you will be taking measurements. If the measurements will not be taken directly on the meat surface, you must
calibrate the Minolta with the same material it will be measuring through. For example, if you want to take readings from samples that are wrapped in overwrap, you must put some overwrap around the measuring head “eye” while calibrating using the white tile.
2. Turn the power to the measuring head ON. 3. Turn the power to the data processor ON while holding down the [DELETE/UNDO] key at the same time.
Release the [DELETE/UNDO] key when you hear a “beep”. (This deletes any previous data that might still be stored in the data processor) 4. When the screen turns on, the question “Initial set ok?” appears, press the [Measure Enter] key. 5. Once you get to the measurement screen, press the [Index Set] key.
Use the arrows and the [Measure Enter] key to adjust all the following settings: - Printer On - Color space Off - Protect On - Auto Average However many readings wanted per sample (1-30) - Illuminant D65 - Back light Off - Buzzer On - Disp. Limit
Press the [Esc] key to return to the measurement screen. 6. Press the [Calibrate] key while in the measurement screen. 7. Enter in the numbers listed on the calibrating white tile for the D65 setting using the following: [< >] keys and the numeric pad - (The [< >] keys move the cursor)
- D65 settings: Y: 93.13 x: 0.3164 y: 0.3330

65
8. Set up the measuring head so that it is resting on the LCD screen and the “eye” is facing up. Place the white calibration tile on the measuring head, near the middle of the tile. 9. Press either the measurement button on the measuring head OR the [Measure Enter] key on the data processor after making sure the ready lamp is ON.
Make sure the white tile is completely on the measuring head “eye”. The Calibration is complete after the lamp flashes 3 times and the screen returns
to the measurement screen.
Do not move the measuring head during calibration. 10. Press the [Color Space] key until the L*, a*, b* screen shows up. 11. Calibration is finished and the Minolta is ready
To save battery life, turn both the measurer and data collector off after calibration is finished until you need it for measuring. The calibration and settings will not be erased.
When turning back on for measurements, ONLY turn on the power buttons. DO NOT hold down the [DELETE/UNDO] key at the same time. This will delete the calibration and settings and all of the steps will have to be repeated.
Cleaning
Wipe machine down with a soft, clean dry cloth. Never use solvents such as thinner or benzene.
If the white calibration tile becomes dirty, wipe it gently with a soft, clean dry cloth. If dirt is difficult to remove, wipe it with lens cleaner and cloth, then dry.
Helpful Hints 1. Make a separate data sheet
The Minolta prints out data with sample numbers 1 to 2000. In order to correlate it back to a sample, you must make a separate data sheet that has a place to record meat sample i.d. and its corresponding Minolta number.
2. Batteries The measuring head requires 4 AAA batteries and the data processor
requires 4 AA batteries 3. The auto protect setting
The Minolta can only record and store up to 2000 readings, once you go past 2000 readings it will start deleting older readings.
When the auto protect is on it will automatically prevent the 2001st reading from being taken so you cannot accidently overwrite other data.
4. Auto Average Function During calibration, if you set the Auto Average function to a reading number
above 1, for example 5, you only have to hit the measure button once and it will automatically take all 5 readings then print out the average.
It only allows a second or two between readings so make sure you are paying attention and move the measuring head to where you want it before it automatically takes the next reading.

66
5. Recalibrate regularly
If using the Minolta all day, or for long periods of time, make sure to recalibrate it regularly.
6. DELETE/UNDO KEY If you accidently take a reading, hitting the [DELETE/UNDO] key will delete
the last reading. If you accidently delete a reading by hitting the [DELETE/UNDO] key, hitting
the [DELETE/UNDO] key again will restore the previous reading. 7. Printer Paper
The paper that the data is printed on is sensitive to heat and light. The printed data should be kept in a dark cool place, like a desk drawer. In order to prevent losing any data, you must make a photocopy of the printout in order to preserve it for long-term storage.
8. More than One Color Space on Print Out If you want to print more than 1 color space (Example: L*a*b* AND XYZ) on the print out slip:
1. Press the [Index Set] key. Use the arrows and the [Measure Enter] key to adjust all the following settings:
- Color space On -Disp. Limit press the [Measure Enter] key to select this option - Once inside the Disp. Limit option, go through the list and change all the color spaces that you DO NOT want to OFF. 2. Press the [Esc] key until you return to the measurement screen.
9. Change Measurements to a Different Color Space If you get done measuring and realize that you meant to measure in a different color space (For example: measured everything using Yxy and meant to use L*a*b*), you can correct it using these steps:
1. While in the measurement screen, press the [Color Space] key until your desired color space (in this example: L*a*b*) appears. 2. Press the [Data List] key while in the measurement screen. 3. Select the desired page using the up and down arrows.
If you only have one page it will show up as P00, select this one. 4. Once you have the desired page selected, press the [Measure Enter] key. 5. Press the [Print/Feed] key 6. Select “All Meas. Data” using the up and down arrows. 7. Press the [Measure Enter] key
This will reprint all the stored data in your newly selected color space (L*a*b* in this example).
8. Press the [Esc] key to return to the measurement screen.

67
SUBJECTIVE COLOR –Percent Discoloration Chart
0%
10%
30%
50%
70%
90%
5%
20%
40%
60%
80%
100%
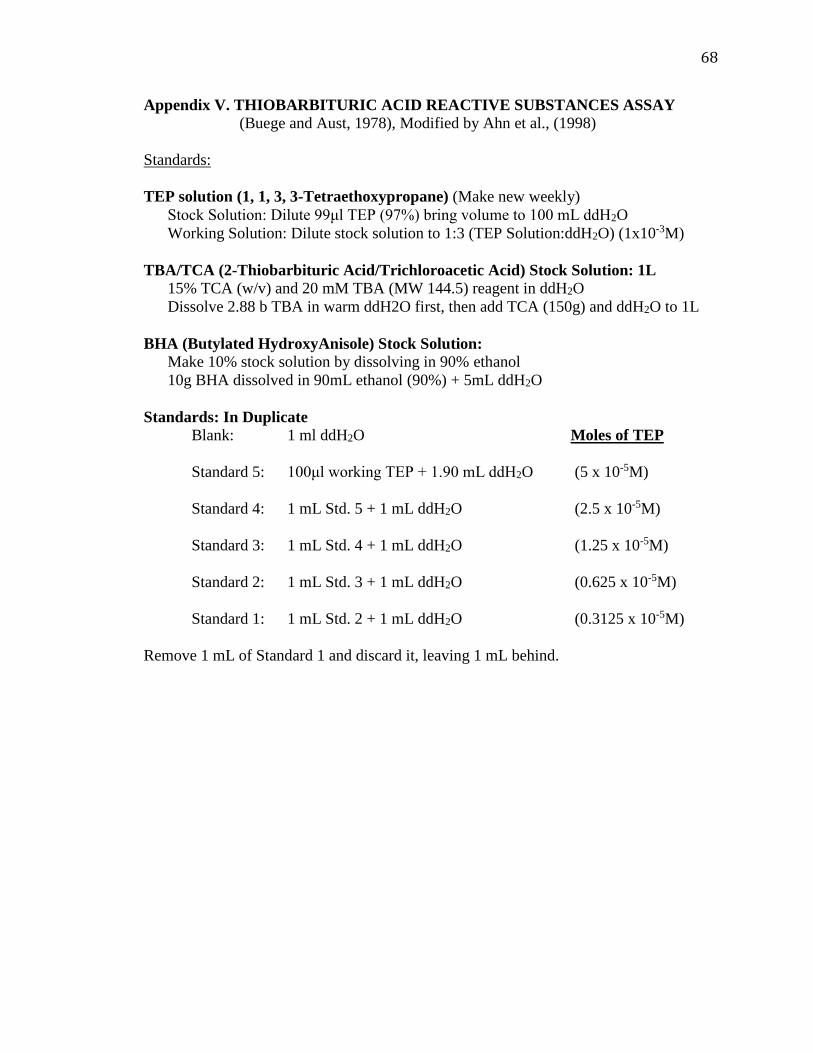
68
Appendix V. THIOBARBITURIC ACID REACTIVE SUBSTANCES ASSAY
(Buege and Aust, 1978), Modified by Ahn et al., (1998)
Standards:
TEP solution (1, 1, 3, 3-Tetraethoxypropane) (Make new weekly)
Stock Solution: Dilute 99μl TEP (97%) bring volume to 100 mL ddH2O
Working Solution: Dilute stock solution to 1:3 (TEP Solution:ddH2O) (1x10⁻³M)
TBA/TCA (2-Thiobarbituric Acid/Trichloroacetic Acid) Stock Solution: 1L
15% TCA (w/v) and 20 mM TBA (MW 144.5) reagent in ddH2O
Dissolve 2.88 b TBA in warm ddH2O first, then add TCA (150g) and ddH2O to 1L
BHA (Butylated HydroxyAnisole) Stock Solution:
Make 10% stock solution by dissolving in 90% ethanol
10g BHA dissolved in 90mL ethanol (90%) + 5mL ddH2O
Standards: In Duplicate
Blank: 1 ml ddH2O Moles of TEP
Standard 5: 100μl working TEP + 1.90 mL ddH2O (5 x 10⁻⁵M)
Standard 4: 1 mL Std. 5 + 1 mL ddH2O (2.5 x 10⁻⁵M)
Standard 3: 1 mL Std. 4 + 1 mL ddH2O (1.25 x 10⁻⁵M)
Standard 2: 1 mL Std. 3 + 1 mL ddH2O (0.625 x 10⁻⁵M)
Standard 1: 1 mL Std. 2 + 1 mL ddH2O (0.3125 x 10⁻⁵M)
Remove 1 mL of Standard 1 and discard it, leaving 1 mL behind.
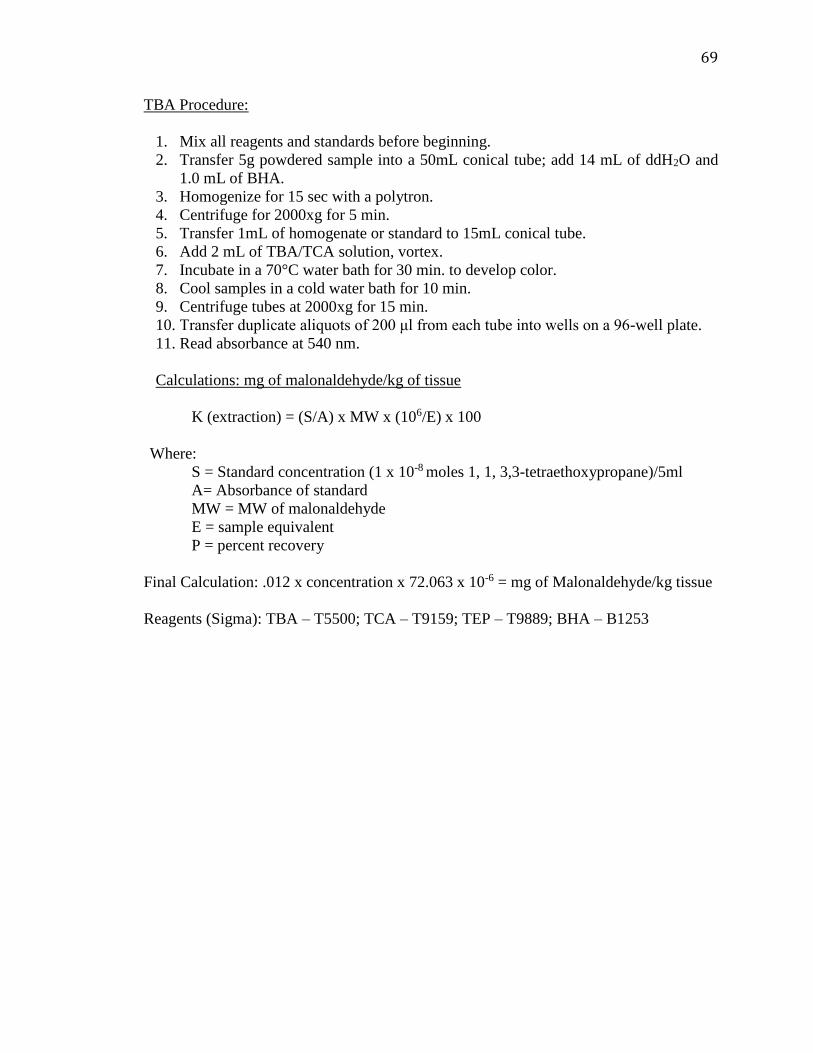
69
TBA Procedure:
1. Mix all reagents and standards before beginning.
2. Transfer 5g powdered sample into a 50mL conical tube; add 14 mL of ddH2O and
1.0 mL of BHA.
3. Homogenize for 15 sec with a polytron.
4. Centrifuge for 2000xg for 5 min.
5. Transfer 1mL of homogenate or standard to 15mL conical tube.
6. Add 2 mL of TBA/TCA solution, vortex.
7. Incubate in a 70°C water bath for 30 min. to develop color.
8. Cool samples in a cold water bath for 10 min.
9. Centrifuge tubes at 2000xg for 15 min.
10. Transfer duplicate aliquots of 200 μl from each tube into wells on a 96-well plate.
11. Read absorbance at 540 nm.
Calculations: mg of malonaldehyde/kg of tissue
K (extraction) = (S/A) x MW x (106/E) x 100
Where:
S = Standard concentration (1 x 10⁻⁸ moles 1, 1, 3,3-tetraethoxypropane)/5ml
A= Absorbance of standard
MW = MW of malonaldehyde
E = sample equivalent
P = percent recovery
Final Calculation: .012 x concentration x 72.063 x 10-6 = mg of Malonaldehyde/kg tissue
Reagents (Sigma): TBA – T5500; TCA – T9159; TEP – T9889; BHA – B1253
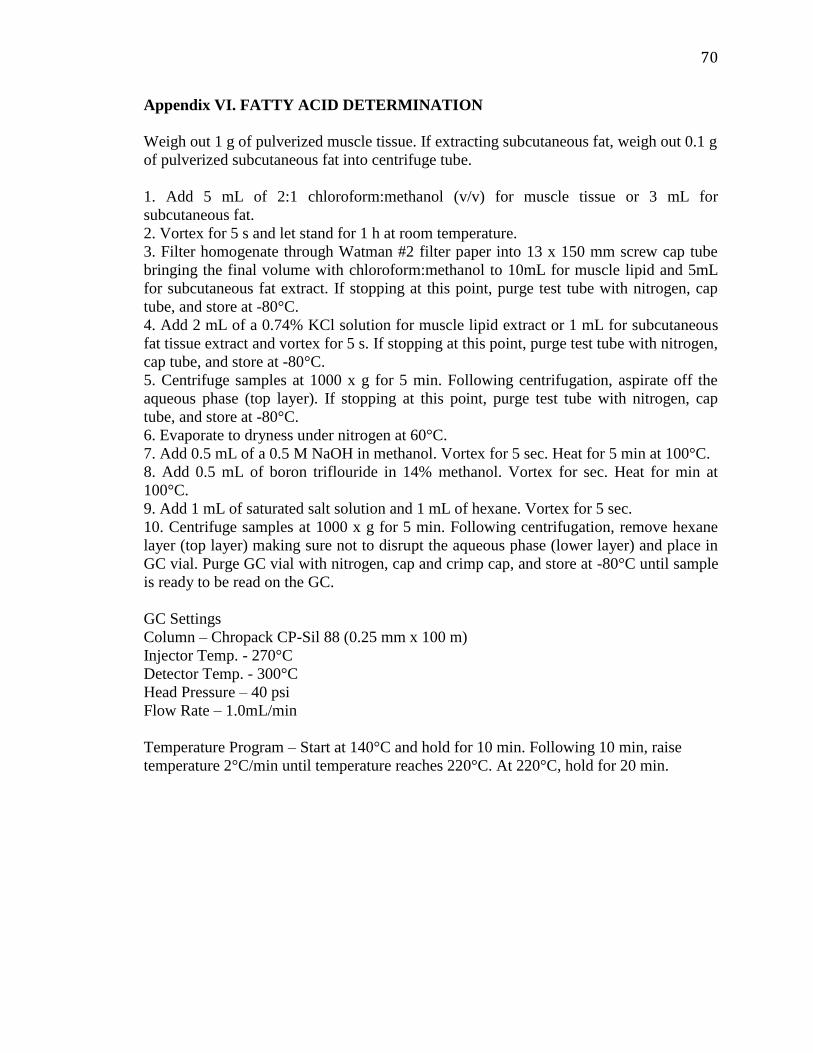
70
Appendix VI. FATTY ACID DETERMINATION
Weigh out 1 g of pulverized muscle tissue. If extracting subcutaneous fat, weigh out 0.1 g
of pulverized subcutaneous fat into centrifuge tube.
1. Add 5 mL of 2:1 chloroform:methanol (v/v) for muscle tissue or 3 mL for
subcutaneous fat.
2. Vortex for 5 s and let stand for 1 h at room temperature.
3. Filter homogenate through Watman #2 filter paper into 13 x 150 mm screw cap tube
bringing the final volume with chloroform:methanol to 10mL for muscle lipid and 5mL
for subcutaneous fat extract. If stopping at this point, purge test tube with nitrogen, cap
tube, and store at -80°C.
4. Add 2 mL of a 0.74% KCl solution for muscle lipid extract or 1 mL for subcutaneous
fat tissue extract and vortex for 5 s. If stopping at this point, purge test tube with nitrogen,
cap tube, and store at -80°C.
5. Centrifuge samples at 1000 x g for 5 min. Following centrifugation, aspirate off the
aqueous phase (top layer). If stopping at this point, purge test tube with nitrogen, cap
tube, and store at -80°C.
6. Evaporate to dryness under nitrogen at 60°C.
7. Add 0.5 mL of a 0.5 M NaOH in methanol. Vortex for 5 sec. Heat for 5 min at 100°C.
8. Add 0.5 mL of boron triflouride in 14% methanol. Vortex for sec. Heat for min at
100°C.
9. Add 1 mL of saturated salt solution and 1 mL of hexane. Vortex for 5 sec.
10. Centrifuge samples at 1000 x g for 5 min. Following centrifugation, remove hexane
layer (top layer) making sure not to disrupt the aqueous phase (lower layer) and place in
GC vial. Purge GC vial with nitrogen, cap and crimp cap, and store at -80°C until sample
is ready to be read on the GC.
GC Settings
Column – Chropack CP-Sil 88 (0.25 mm x 100 m)
Injector Temp. - 270°C
Detector Temp. - 300°C
Head Pressure – 40 psi
Flow Rate – 1.0mL/min
Temperature Program – Start at 140°C and hold for 10 min. Following 10 min, raise
temperature 2°C/min until temperature reaches 220°C. At 220°C, hold for 20 min.

71
Appendix VII. FAT EXTRACTION (SOXHLET METHOD)
WARNING: ETHER IS EXTREMELY FLAMMABLE AND PRODUCES
EXPLOSIVE PEROXIDES. NEVER BRING A RADIO OR ANY OTHER
POTENTIALLY SPARK-PRODUCING ITEM INTO THE FAT EXTRACTION
ROOM.
1. Check ground glass connections. They should be wiped clean with a dry paper
towel and given a thin coating of stopcock grease.
2. Each boiling flask must contain boiling stones. This helps prevent violent boiling
of the solvent which could be dangerous.
3. Load samples into soxhlet tubes, arranging them so that no samples are above the
level of the top bend in the narrower tubing on the outside of the soxhlet. (The
soxhlet will only fill the solvent up to this point before cycling back down into the
boiling flask.) In general, the large soxhlets will hold about 20 two-gram samples
and the small soxhlets from 4-6.
4. Fill the large (500mL) boiling flasks with @ 400 ml of solvent and the small
(125mL) flasks with 100 mL of solvent. DO THIS UNDER THE FUME HOOD!
5. Fit the soxhlet onto the boiling flask. Very carefully, bring the assembly into the
extraction room and fit it onto the condenser. Make sure all ground glass
conncections are snug and each boiling flask is resting on the heating element.
The ceramic fiber sheet should be covering the bare metal surfaces of the burners
completely.
6. Turn on the water supply to the condensers (usually a quarter turn). Check later to
make sure condensers are cool enough – if not, increase water flow.
7. Turn heating element control dials to 2 way between three and four. Each burner
has its own dial. NEVER TURN THE BURNER BEYOND FIVE. Ether has a
very low boiling point and violent boiling is dangerous. Double check fittings,
boiling stones, etc.
8. Fat extraction will take from 24-72 hours depending on the sample (beef – 48
hours, bacon – 72 hours). Check extractions twice daily to see that everything is
alright while they are running.
9. When done, turn off the burners and let solvent cool completely before removing
samples.
10. After it has cooled down, slowly uncouple the flask and soxhlet tube from the
condenser. Cover the top of the soxhlet with one palm so as to reduce ether vapors
while transporting it to the fume hood. Air-dry samples in the fume hood for two
hours to get rid of the reaming ether in the samples. Pour ether back slowly into
an approved container for reuse or discarding. DO NOT LEAVE ETHER OUT
OF THE HOOD OR THE FLAMMABLE CABINET.
11. Place samples in drying oven (105°C) for about four hours or overnight before
weighing back.
Calculation: (((Original weight including filter paper and paper clip – Fat extracted
sample weight)/Sample Wt)*100) - % Moisture = % Fat

72
APPENDIX VIII. a* values of strip loin steaks (L. lumborum) aged 14 d from cattle fed corn, field peas or no supplement.
a-mMeans with different superscripts differ (P < 0.05). SEM = 0.3747
Treatment
Days on retail display
0 1 2 3 4 5 6 7
No Supplement
on Pasture
Corn
Finishing
23.29a 21.72b,c,d,e
,f
21.92a,b,c,d
,e,f
21.73b,c,d,e
,f
21.07d,e,f,g
,h,i,j,k
21.21c,d,e,f
,g,h,I,j,k
20.88e,f,g,h
,I,j,k,l,m
20.02j,k,l,m
,n
No Supplement
on Pasture
Field Pea
Finishing
22.14a,b,
c,d,e
22.08a,b,c,d
,e
21.81b,c,d,e
,f
21.24c,d,e,f
,g,h,i,j
20.80e,f,g,h
,i,j,k,l,m
21.05d,e,f,g
,h,i,j,k,l
20.24g,h,i,j,
k,l,m,n
19.61m,n
Field Peas
on Pasture
Corn
Finishing
22.81a,b 21.82b,c,d,e
,f
21.84a,b,c,d
,e,f
21.35c,d,e,f
,g,h,i,j
20.58f,g,h,i,
j,k,l,m,n
20.73e,f,g,h
,i,j,k,l,m,n
20.19g,h,i,j,
k,l,m,n
19.70l,m,n
Field Peas
on Pasture
Field Pea
Finishing
22.40a,b,
c,d
21.89a,b,c,d
,e,f
21.52b,c,d,e
,f,g,h,i
21.35c,d,e,g
,g,h,i,j
20.75e,f,g,h
,i,j,k,l,m
20.53f,g,h,i,
j,k,l,m,n
20.08j,k,l,m
,n
19.40n
Corn on Pasture Corn
Finishing
22.57a,b,
c
22.10a,b,c,d
,e
21.58b.c,d,e
,f,g,h
21.22c,d,e,f
,g,h,i,j
20.80e,f,g,h
,i,j,k,l,m
20.79e,f,g,h
,i,j,k,l,m
20.16i,j,k,l,
m,n
19.78k,l,m,
n
Corn on Pasture Field Pea
Finishing
22.68a,b,
c
21.53b,c,
d,e,f,g,h,i
21.73b,c,d,e
,f
21.65b,c,d,e
,f,g
20.85e,f,g,h
,i,j,,k,l,m
20.99d,e,f,g
,h,i,j,k,l,m
20.70e,f,g,h
,i,j,k,l,m,n
20.19h,i,j,k,
l,m,n

73
APPENDIX IX. b* values of strip loin steaks (L. lumborum) aged for 14 d from cattle fed corn, field peas or no supplement.
1 b* values displayed a significant retail display effect (P < 0.0001). SEM = 0.05891. 2There were no differences among treatments (P > 0.05). SEM = 0.0690.
Treatment
Days on retail display1
0 1 2 3 4 5 6 7
No Supplement on Pasture Corn Finishing 10.85 10.66 10.22 10.36 10.10 10.14 10.00 9.64
No Supplement on Pasture Field Pea Finishing 10.15 10.43 10.09 9.87 9.82 9.96 9.66 9.56
Field Peas on Pasture Corn Finishing 10.50 10.40 10.23 10.02 9.84 9.78 9.58 9.39
Field Peas on Pasture Field Pea Finishing 10.29 10.29 9.89 9.94 9.77 9.74 9.47 9.21
Corn on Pasture Corn Finishing 10.43 10.33 9.94 10.00 9.80 9.81 9.43 9.44
Corn on Pasture Field Pea Finishing 10.51 10.46 10.01 10.13 9.81 9.95 9.88 9.66
Overall Means1 10.46a 10.43a 10.06b 10.05b 9.86cd 9.90cb 9.67d 9.48e

74
APPENDIX X: Discoloration (%) of strip loin steaks (L lumoborum) aged for 14 d from
cattle fed corn, field peas, or no supplement.
Discoloration displayed a retail display by pasture treatment by finishing treatment
interaction (P < 0.0001; SEM=0.3585)
0.00
0.50
1.00
1.50
2.00
2.50
0 1 2 3 4 5 6 7
Dis
colo
rati
on
(%
)
RD (d)
Peas + Peas
Nothing + Peas
Corn + Peas
Peas+ No Peas
Nothing + No Peas
Corn + No Peas

75
APPENDIX XI: L* values of strip loin steaks (L lumoborum) aged for 14 d from cattle
fed corn, field peas, or no supplement.
L* displayed a retail display by pasture treatment by finishing treatment interaction (p =
0.0524; SEM = 0.4909)
42.50
43.00
43.50
44.00
44.50
45.00
45.50
0 1 2 3 4 5 6 7
L*
RD (d)
Peas + Peas
Nothing + Peas
Corn + Peas
Peas + No Peas
Nothing + No Peas
Corn + No Peas