Feeding Distillers Grains to Beef Cattle in the Southern Plains
28
Feeding Distillers Grains to Beef Cattle in the Southern Plains: Texas Tech University Results M. L. Galyean Department of Animal and Food Sciences Feeding Distillers Grains to Beef Cattle in the Southern Plains: Texas Tech University Results M. L. Galyean Department of Animal and Food Sciences
Transcript of Feeding Distillers Grains to Beef Cattle in the Southern Plains

Feeding Distillers Grains to BeefCattle in the Southern Plains: Texas Tech
University Results
M. L. Galyean
Department of Animal and Food Sciences
Feeding Distillers Grains to BeefCattle in the Southern Plains: Texas Tech
University Results
M. L. Galyean
Department of Animal and Food Sciences
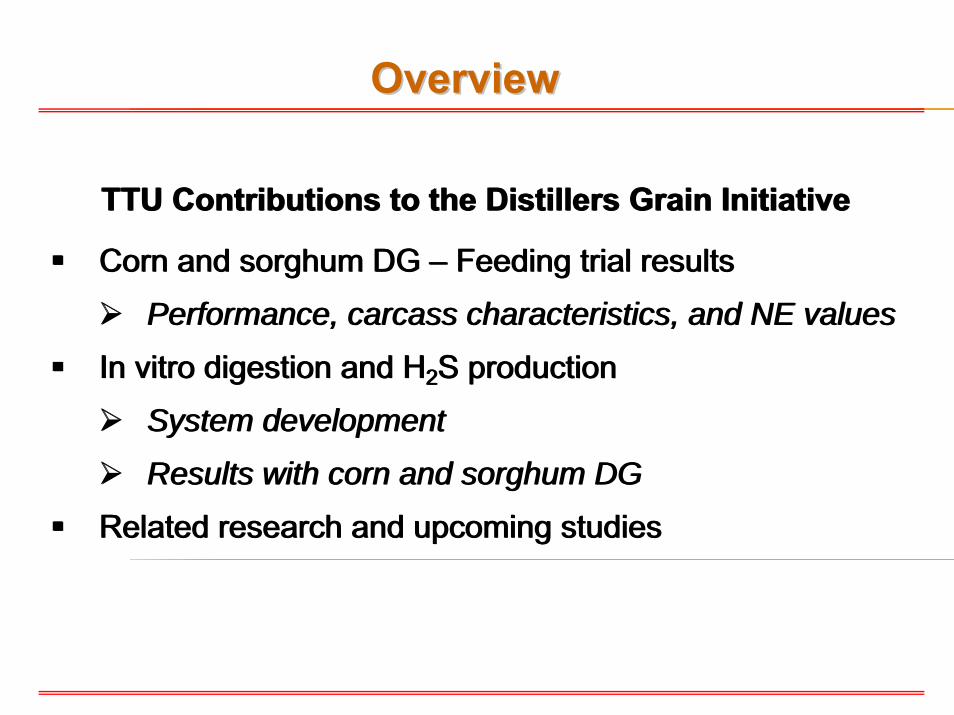
TTU Contributions to the Distillers Grain Initiative
Corn and sorghum DG – Feeding trial results
Performance, carcass characteristics, and NE values
In vitro digestion and H2S production
System development
Results with corn and sorghum DG
Related research and upcoming studies
TTU Contributions to the Distillers Grain Initiative
Corn and sorghum DG – Feeding trial results
Performance, carcass characteristics, and NE values
In vitro digestion and H2S production
System development
Results with corn and sorghum DG
Related research and upcoming studies
OverviewOverview
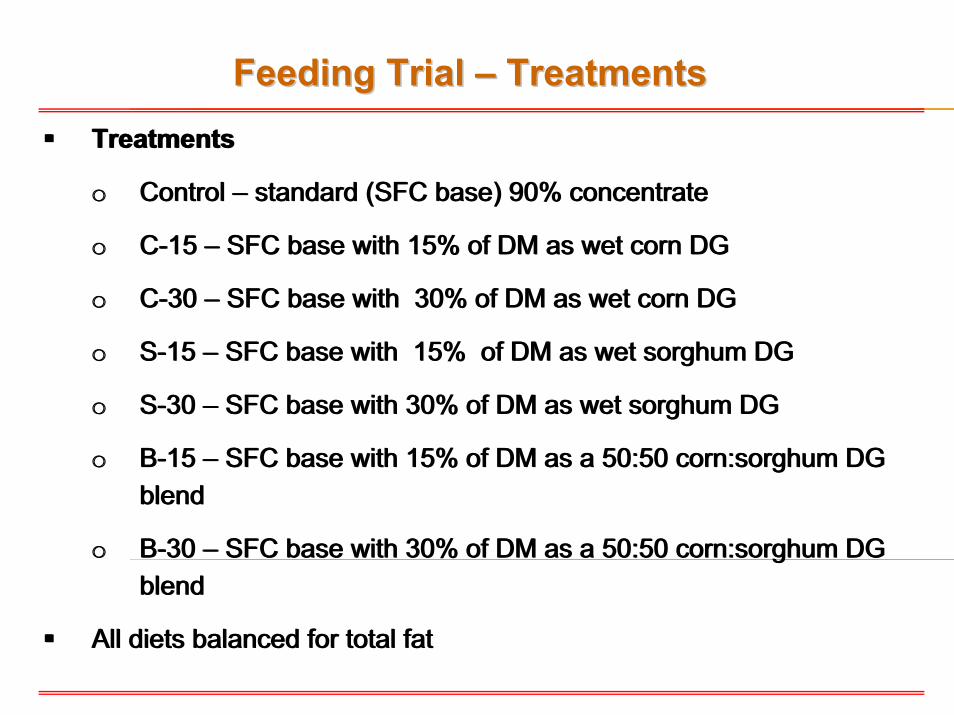
Treatments
o Control – standard (SFC base) 90% concentrate
o C-15 – SFC base with 15% of DM as wet corn DG
o C-30 – SFC base with 30% of DM as wet corn DG
o S-15 – SFC base with 15% of DM as wet sorghum DG
o S-30 – SFC base with 30% of DM as wet sorghum DG
o B-15 – SFC base with 15% of DM as a 50:50 corn:sorghum DG blend
o B-30 – SFC base with 30% of DM as a 50:50 corn:sorghum DG blend
All diets balanced for total fat
Feeding Trial Feeding Trial –– TreatmentsTreatments

Wet corn DG from Quality Distillers Grain, Hereford, TX
Wet sorghum DG from Abengoa Bioenergy (Portales, NM) and Levelland/Hockley County Ethanol, LLC (Levelland, TX) – source change for final 30 d
Both sources of DG stored in silage bags (tarp wrap in commoditybarn for last 30 d with sorghum DG)
Corn and sorghum DG during the experiment averaged 31.2 and 28.7%, respectively (standard deviation = 1.49 and 0.98%, respectively).
Feeding Trial Feeding Trial –– Wet Distillers GrainWet Distillers Grain

224 steers received from Southwestern Missouri in January 2008
Approximately 75% Angus or Angus x Hereford; remainder Red Angus, Charolais, or Charolais cross
Arrival BW = approximately 530 lb; pre-vaccinated – minor health problems
Standard receiving period, followed by group-housing with limited intake of a 75% concentrate diet (to gain 2 lb/d) for approximately 8 wk; switched to 80% concentrate 10 d before starting experiment
Blocked by BW (average initial BW = 862 lb)
Assigned to pens (7 pens/block) – trial began May 8, 2008
Feeding Trial Feeding Trial –– Cattle and ProceduresCattle and Procedures

BW measured initially and on d 35, 70, and before shipment to slaughter
Blocks 1 through 3, 4 through 6, 7, and 8 were on feed for 165, 137, 123, and 96 d, respectively – average = 140.6 d on feed
Carcass data collected at slaughter:
HCW, LM area, KPH, 12th rib fat, marbling and maturity scores
Calculated yield grade; quality grade based on marbling call
Diet samples collected weekly – composite samples analyzed
Feeding Trial Feeding Trial –– Cattle and ProceduresCattle and Procedures

Diet NEm and NEg concentrations calculated from performance
NRC feed NE values were “adjusted” for deviation of performance-based values from calculated values (≈ 98%)
Adjusted NE contribution from all feeds besides DG were determined
Performance-based NE value minus contribution from non-DG feeds divided by % of DG in diet = NE value of DG
Feeding Trial Feeding Trial –– Calculations and StatisticsCalculations and Statistics

Randomized complete block design for performance and carcass data
Contrasts used to evaluate treatment means:
Standard SFC diet vs. the average of DG diets
Corn DG vs. the average of sorghum DG and blend DG
Sorghum DG vs. blend DG
15 vs. 30% DG
Interactions of level with other DG contrasts
Randomized complete block design for performance and carcass data
Contrasts used to evaluate treatment means:
Standard SFC diet vs. the average of DG diets
Corn DG vs. the average of sorghum DG and blend DG
Sorghum DG vs. blend DG
15 vs. 30% DG
Interactions of level with other DG contrasts
Feeding Trial Feeding Trial –– Calculations and StatisticsCalculations and Statistics
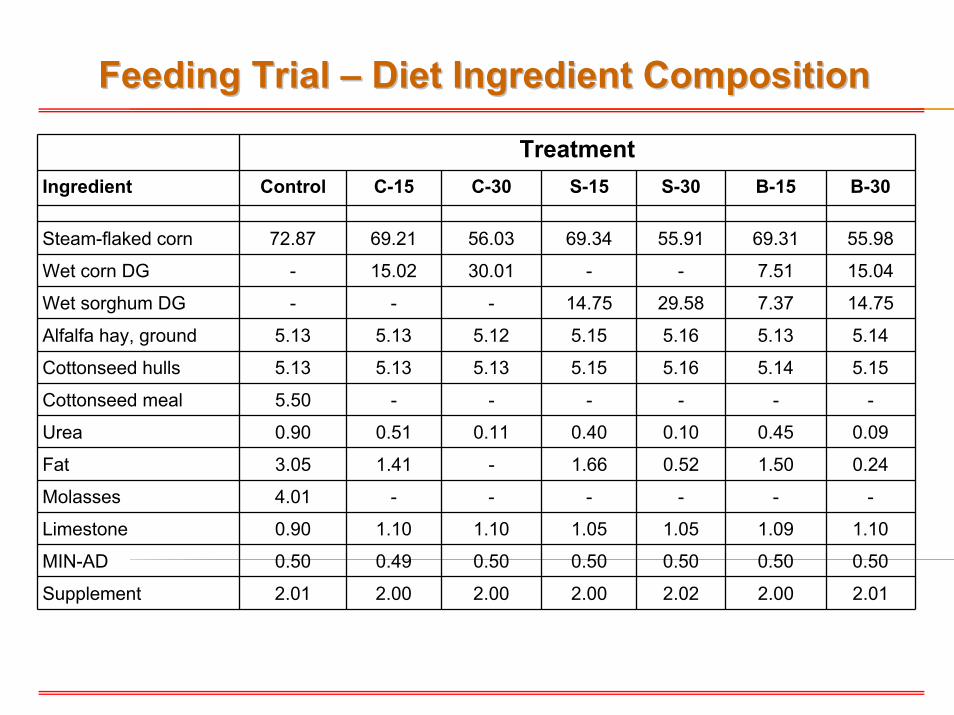
Feeding Trial Feeding Trial –– Diet Ingredient CompositionDiet Ingredient Composition
TreatmentIngredient Control C-15 C-30 S-15 S-30 B-15 B-30
Steam-flaked corn 72.87 69.21 56.03 69.34 55.91 69.31 55.98
Wet corn DG - 15.02 30.01 - - 7.51 15.04
Wet sorghum DG - - - 14.75 29.58 7.37 14.75
Alfalfa hay, ground 5.13 5.13 5.12 5.15 5.16 5.13 5.14
Cottonseed hulls 5.13 5.13 5.13 5.15 5.16 5.14 5.15
Cottonseed meal 5.50 - - - - - -
Urea 0.90 0.51 0.11 0.40 0.10 0.45 0.09
Fat 3.05 1.41 - 1.66 0.52 1.50 0.24
Molasses 4.01 - - - - - -
Limestone 0.90 1.10 1.10 1.05 1.05 1.09 1.10
MIN-AD 0.50 0.49 0.50 0.50 0.50 0.50 0.50
Supplement 2.01 2.00 2.00 2.00 2.02 2.00 2.01

Feeding Trial Feeding Trial –– BW DataBW Data
Treatment
Item Control C-15 C-30 S-15 S-30 B-15 B-30 SE Contrast
Initial BW, lb 861.9 867.1 861.3 866.0 861.6 859.1 859.9 20.96 NS
Final BW, lb 1,341.7 1,322.7 1,297.1 1,323.1 1,295.1 1,309.7 1,287.6 16.39 C*, L*
Adjusted final BW, lb 1,352.3 1,325.7 1,305.5 1,320.3 1,297.3 1,306.8 1,271.7 17.40 C*, L*
Contrasts: C = Control vs. others; L = 15 vs. 30% DG; NS = not significant, P > 0.10.* = P ≤ 0.05.

Feeding Trial Feeding Trial –– Overall Shrunk ADGOverall Shrunk ADG
Control vs. others, P ≤ 0.05ADG, lb
Treatment
3.40
3.243.13
3.27
3.09 3.173.08

Feeding Trial Feeding Trial –– Overall DMIOverall DMI
Control vs. others, 0.05< P ≤ 0.10S vs. B, P ≤ 0.05DMI, lb/d
Treatment
21.60
20.2820.60
21.4120.97
19.9820.50
SE = 0.502

Feeding Trial Feeding Trial –– Overall G:FOverall G:F
15 vs. 30% DG, P ≤ 0.05G:F
Treatment
0.157 0.160 0.152 0.153 0.148 0.159 0.150
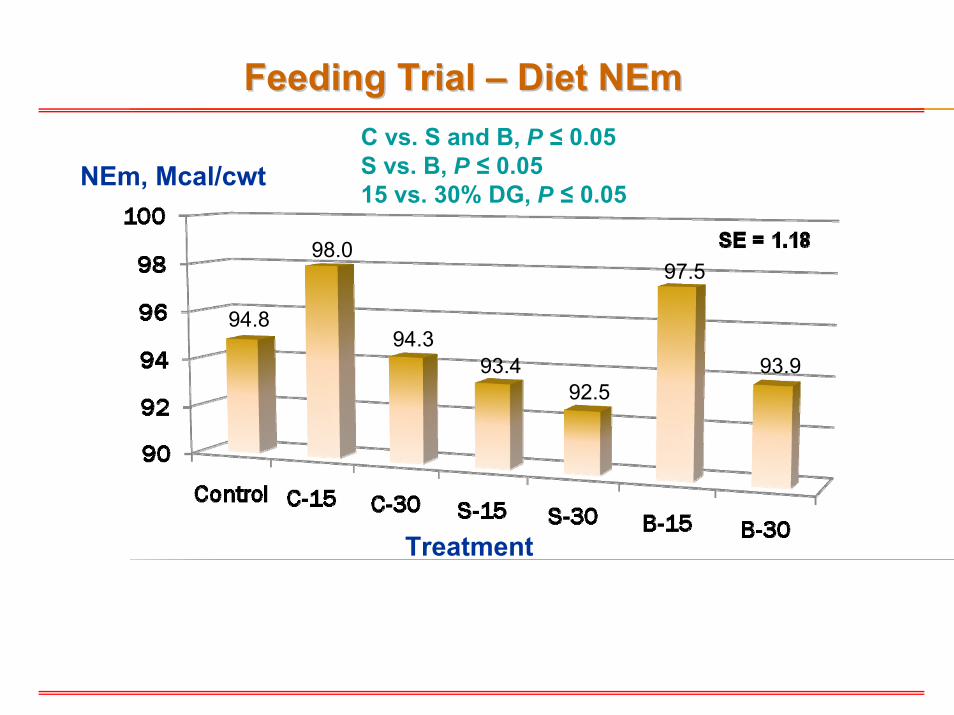
Feeding Trial Feeding Trial –– Diet NEmDiet NEmC vs. S and B, P ≤ 0.05S vs. B, P ≤ 0.0515 vs. 30% DG, P ≤ 0.05
NEm, Mcal/cwt
Treatment
94.8
98.0
94.393.4
92.5
97.5
93.9

Feeding Trial Feeding Trial –– Diet NEgDiet NEgC vs. S and B, P ≤ 0.05S vs. B, P ≤ 0.0515 vs. 30%, P ≤ 0.05
NEg, Mcal/cwt
Treatment
64.4
67.1
64.463.5
62.6
67.1
63.9

Feeding Trial Feeding Trial –– Carcass DataCarcass Data
Treatment
Item Control C-15 C-30 S-15 S-30 B-15 B-30 SE Contrast
Hot carcass weight, lb 879.4 862.1 849.0 858.6 843.7 849.8 827.0 11.31 C*, L*
Dressing percent 62.94 62.57 62.87 62.28 62.34 62.33 61.66 0.348 C†, S*
LM area, sq. in. 12.75 13.04 12.59 13.04 12.46 12.47 12.42 0.227 L*
12th rib fat, in. 0.43 0.37 0.33 0.36 0.37 0.36 0.34 0.025 C*
KPH, % 2.52 2.26 2.32 2.57 2.78 2.61 2.47 0.141 S*
Yield grade 3.33 2.97 2.99 3.00 3.23 3.15 3.01 0.116 C*, BI†
Marbling score 418.8 422.9 414.3 415.4 418.7 401.0 414.0 13.88 NS
Choice or greater, % 56.25 56.25 62.50 52.08 59.38 47.92 66.67 - NS
Select or less, % 43.75 43.75 37.50 47.92 40.62 52.08 33.33 - NS
Abscessed livers, % 3.13 9.38 3.13 0.00 6.25 0.00 9.38 - NS
Contrasts: C = Control vs. others; S = average of C vs. the average of S and B; L = 15 vs. 30% DG; BI = interaction of S vs. B with level; NS = not significant , P > 0.10.* = P ≤ 0.05; † = 0.05< P ≤ 0.10.

Feeding Trial Feeding Trial –– Relative NEg valuesRelative NEg values
Based on substitution calculations, dietary NEg (Mcal/cwt) values for DG sources would be:
Wet corn DG at 15% = 84.8 (118.5% of SF corn)
Wet corn DG at 30% = 71.7 (100% of SF corn)
Wet sorghum DG at 15% = 58.5 (81.7% of SF corn)
Wet sorghum DG at 30% = 63.9 (89.5% of SF corn)
Wet blend DG at 15% = 83.9 (117% of SF corn)
Wet blend DG at 30% = 69.4 (96.7% of SF corn)
FYI – Concurrent study – essentially the same diet and sources of DG and cattle – at 15% of DM wet corn DG = 77.1% value of SF corn!

In Vitro HIn Vitro H22S Trial S Trial –– Development of MethodsDevelopment of Methods
Increased S concentration in wet corn DG – concerns with production of H2S in the gastrointestinal tract
Corn and sorghum DG used in feeding trial = 0.59 and 0.66% S, respectively
Objectives:
Develop a repeatable in vitro system for determining how DG source and level affect ruminal H2S production
Determine effects of wet DG source and level on rate and extent of in vitro DM disappearance
Used basic in vitro techniques with slight modifications

In Vitro HIn Vitro H22S Trial S Trial –– MethodsMethods
All in vitro studies – 2 ruminally cannulated steers fed a 75% concentrate (SF corn base) diet – no DG and no Rumensin/Tylan
Ruminal fluid collected approximately 4 h after feeding
Treatment substrates evaluated:
Control – SF corn, cottonseed meal, urea, corn oil
C-15 – corn DG at 15% of DM
C-30 – corn DG at 30% of DM
S-15 – sorghum DG at 15% of DM
S-30 – sorghum DG at 30% of DM
All substrates balanced for fat and degradable intake protein

In Vitro HIn Vitro H22S Trial S Trial –– SubstratesSubstrates
*Wet corn and sorghum DG were air-dried at room temperature before use
TreatmentIngredient Control C-15 C-30 S-15 S-30
Steam-flaked corn 88.16 77.87 69.43 77.63 68.98Wet corn DG* - 15.00 30.00 - -Wet sorghum DG* - - - 15.00 30.00Cottonseed meal 8.00 5.00 - 5.00 -Urea 0.89 0.66 0.57 0.62 0.50Corn oil 2.95 1.47 - 1.75 0.52
Analyzed % S, DM basis 0.13 0.19 0.29 0.22 0.31

In Vitro HIn Vitro H22S Trial S Trial –– MethodsMethodsIVDMD – 24-h buffer:ruminal fluid (3:1) incubation, followed by 48-h pepsin digest
Duplicate tubes per run – 3 runs
Rate of digestion tracked with Ankom wireless gas pressure monitoring system
Duplicate flasks per run – 3 runs
Curves fitted to modified Gompertz equation to estimate lag (L),rate (k), and maximum extent (M); area under curve calculated
Total gas production and H2S measurements
Sealed 125-mL vials for fermentation – (3:1) buffer:ruminal fluid –duplicate vials in 2 runs
Gas production by water displacement
H2S in headspace gas – N-N-dimethyl-p-phenylenediamine method
IVDMD – 24-h buffer:ruminal fluid (3:1) incubation, followed by 48-h pepsin digest
Duplicate tubes per run – 3 runs
Rate of digestion tracked with Ankom wireless gas pressure monitoring system
Duplicate flasks per run – 3 runs
Curves fitted to modified Gompertz equation to estimate lag (L),rate (k), and maximum extent (M); area under curve calculated
Total gas production and H2S measurements
Sealed 125-mL vials for fermentation – (3:1) buffer:ruminal fluid –duplicate vials in 2 runs
Gas production by water displacement
H2S in headspace gas – N-N-dimethyl-p-phenylenediamine method

In Vitro HIn Vitro H22S Trial S Trial –– MethodsMethods
Collection of ruminal fluid
Standard IVDMD
Sealed vial gas production system
Measurement of gas production

In Vitro HIn Vitro H22S Trial S Trial –– MethodsMethods
Measurement of H2S in gas
Ankom wireless gas pressure recording system

In Vitro HIn Vitro H22S, IVDMD, and Gas Production S, IVDMD, and Gas Production
Treatment
Item Control C-15 C-30 S-15 S-30 SE ContrastH2S, µmoles/g of fermentable DM 3.54 5.09 7.57 5.68 7.36 0.39 C*, L*
IVDMD, % 70.34 67.35 64.59 64.31 62.93 3.30 C*, S*, L*
Gas production, mL/gof fermentable DM 314.2 325.6 328.8 337.8 331.0 3.3 C*, S†
Contrasts: C = Control vs. others; S = average of C-15 and C-30 vs. average of S-15 and S-30; L = 15 vs. 30% DG; NS = not significant , P > 0.10.* = P ≤ 0.05; † = 0.05< P ≤ 0.10.

In Vitro Gas Production KineticsIn Vitro Gas Production Kinetics
Contrasts: C = Control vs. others; S = average of C-15 and C-30 vs. average of S-15 and S-30; L = 15 vs. 30% DG; NS = not significant , P > 0.10.* P ≤ 0.05.
TreatmentItem Control C-15 C-30 S-15 S-30 SE Contrast
k, min-1 0.0111 0.0104 0.0098 0.0094 0.0092 0.0006 C*, S*
lag, min 50.84 45.47 49.64 28.09 61.20 10.47 NS
M, mL 178.4 175.2 170.9 165.6 160.6 8.0 NS
AUC, mL × min 141,795 137,248 130,093 127,768 120,023 4,952 C*, S*, L*

ConclusionsConclusions
All DG sources resulted in lower DMI and ADG than the standard SFC diet
Only DG level affected G:F
NEg values of wet corn DG and 50:50 blend of corn and sorghum DG were equal to or greater than SF corn, but NEg for wet sorghum DG was less
IVDMD and rate of gas production were less with corn and sorghumDG than with a SF corn-based substrate
Corn > sorghum DG
15 > 30% DG for IVDMD and AUC
Corn and sorghum DG increased in vitro H2S production
H2S production increased with increasing DG level – values followed expectations from S concentration

Related and Upcoming ResearchRelated and Upcoming Research
Currently analyzing samples from digestion study with Control, C-15, and S-15 diets
9 steers/treatment – conducted during feeding study
Measurements of DM, OM, N, and fiber digestibility
Feeding trial planned for Spring 2009
Control diet, 15 and 30% wet corn DG, 3 roughage levels (7.5, 10, and 12.5% alfalfa hay)

Thank you!Thank you!