Effectiveness Of Supportive Periodontal Therapy On...
62
Effectiveness Of Supportive Periodontal Therapy On Tooth Survival Among Patients With Chronic Periodontitis by Alanoud Alotaibi B.D.S, King Abdul-Aziz University, 2009 Submitted to the Graduate Faculty of The School of Dental Medicine in partial fulfillment of the requirements for the degree of Master of Science University of Pittsburgh 2016
Transcript of Effectiveness Of Supportive Periodontal Therapy On...
Effectiveness Of Supportive Periodontal Therapy On Tooth Survival Among Patients With Chronic Periodontitis
by
Alanoud Alotaibi
B.D.S, King Abdul-Aziz University, 2009
Submitted to the Graduate Faculty of
The School of Dental Medicine in partial fulfillment
of the requirements for the degree of
Master of Science
University of Pittsburgh
2016

ii
UNIVERSITY OF PITTSBURGH
School of Dental Medicine
This thesis was presented
by
Alanoud Alotaibi
It was defended on
April 27, 2016
and approved by
Charles Sfeir D.D.S, PhD., Associate Professor, Department of Periodontics and Preventive Dentistry, School
of Dental Medicine, University of Pittsburgh
Kelly Williams D.M.D, Director, Advanced Dental Education Residency Program, Department of Periodontics
and Preventive Dentistry, School of Dental Medicine, University of Pittsburgh
Thesis Director: Alexandre Vieira, D.D.S, PhD., Associate Professor, Department of Oral Biology, School of
Dental Medicine, University of Pittsburgh

iii
Copyright © by Alanoud Alotaibi
2016

iv
INTRODUCTION: Prevention of tooth loss and maintaining favorable periodontal status are
the ultimate goals of periodontal therapy. The aim of this study was to evaluate the effectiveness
of non-surgical periodontal therapy and supportive periodontal care in arresting the progression
of chronic periodontitis and in preventing tooth loss.
MATERIALS AND METHODS: Periodontal charts, self-reported medical history, and
interleukin-1 (IL-1) polymorphism genotypes of 100 patients were obtained from the University
of Pittsburgh School of Dental Medicine Dental Registry and DNA Repository (DRDR) after
screening of 4,825 subjects. In our study we have included third molars, teeth lost during active
periodontal treatment (APT), and those lost during supportive periodontal care (SPC). We used
tooth loss (TL) and clinical attachment loss (CAL) as outcomes of disease affection in our
analysis. Fisher’s exact test was used to investigate the association between tooth loss and
Effectiveness Of Supportive Periodontal Therapy On Tooth Survival Among Patients
With Chronic Periodontitis
Alanoud Alotaibi, B.D.S, M.S.
University of Pittsburgh, 2016

v
different risk factors. Paired t-test was conducted to detect the difference in means of CAL
between baseline and final periodontal assessments.
RESULTS: There were 59 patients (36 males and 23 females with an average age of 52 years)
that lost at least one tooth. Tooth mortality rate declined in patients who attended supportive
periodontal program for six years compared to those who received supportive periodontal
therapy for one year only (0.52 and 3.4 teeth/patient/year, respectively). Increased risk of tooth
loss was found to be associated with diabetes (P=0.01), as well as high blood pressure
(P<0.0001). We did not find an association between tooth loss and polymorphisms in interleukin
IL-1α/IL-1β (rs1800587, P=0.36 and rs1143634, P=0.51, respectively). During the first year of
supportive periodontal treatment, the clinical attachment loss showed a significant reduction
(CAL gain of 0.36 mm, P=0.0697). Moreover, a significant increase in CAL was noted in the
group of patients who attended regular periodontal maintenance for six years (CAL progression
of 0.38mm, P=0.037).
CONCLUSION: Our findings suggested that supportive periodontal therapy is effective for the
long-term stability of periodontal disease in high-risk patients in our sample.
KEYWORDS: Supportive periodontal therapy, Tooth loss, Chronic periodontitis.

vi
TABLE OF CONTENTS
PREFACE ..................................................................................................................................... X
1.0 INTRODUCTION ................................................................................................................ 1
1.1 PERIODONTAL DISEASE ........................................................................................ 1
1.2 SUSCEPTIBILITY TO PERIODONTAL DISEASE PROGRESSION ................ 2
1.2.1 Diabetes .............................................................................................................. 3
1.2.2 Hypertension ..................................................................................................... 4
1.2.3 Smoking ............................................................................................................. 5
1.2.4 Interleukin-1 Genotype (IL-1) ......................................................................... 5
1.3 TREATMENT OF CHRONIC PERIODONTITIS .................................................. 7
1.3.1 Non-Surgical Periodontal Therapy ................................................................. 7
1.3.2 Supportive Periodontal Therapy (SPT) .......................................................... 8
1.4 SPECIFIC AIMS AND OBJECTIVES .................................................................... 10
2.0 SUBJECTS AND METHODS ........................................................................................... 11
2.1 STUDY SETTING ..................................................................................................... 11
2.2 STUDY PARTICIPANTS ......................................................................................... 11
2.3 CASE DEFINITION .................................................................................................. 14
2.4 IL-1 GENOTYPES ..................................................................................................... 14
2.5 PERIODNTAL ASSESMENTS ................................................................................ 14

vii
2.6 STATISTICAL ANALYSIS ...................................................................................... 15
3.0 RESULTS ............................................................................................................................ 16
3.1 TOOTH LOSS ............................................................................................................ 16
3.2 TOOTH LOSS AND RISK FACTORS ................................................................... 21
3.3 TOOTH LOSS AND IL-1 GENOTYPES ................................................................ 22
3.4 TOOTH LOSS AND AGE ......................................................................................... 23
3.5 TOOTH LOSS AND HEALTH STATUS ............................................................... 28
3.6 CLINICAL ATTACHMENT LOSS LEVEL (CAL) .............................................. 29
3.7 PERIODONTAL HEALTH STATUS OF THE STUDY POPULATION ........... 29
3.8 CHANGE IN THE CLINICAL ATTACHMENT LOSS ....................................... 32
3.9 CLINICAL ATTACHMENT LOSS AND AGE ..................................................... 34
3.10 CLINICAL ATTACHMENT LOSS AND HEALTH STATUS .......................... 36
4.0 DISCUSSION ...................................................................................................................... 38
5.0 CONCLUSION ................................................................................................................... 43
BIBLIOGRAPHY ........................................................................................................................ 44

viii
LIST OF TABLES
Table 1. Demographic characteristics of the study subjects .......................................................... 13
Table 2. Distribution of subjects by the number of teeth lost ....................................................... 17
Table 3. Distribution of 188 teeth lost with regards to types of teeth in (TL>0 group) ................ 18
Table 4. Distribution of missing teeth during the follow-up period in (TL=0 group) ................... 18
Table 5. Distribution of missing teeth at baseline and final periodontal evaluations .................... 19
Table 6. Distribution of missing teeth with regards to types of teeth at baseline and final
periodontal assessments ................................................................................................................. 19
Table 7. Distribution of the type of teeth lost during APT and SPC ............................................. 20
Table 8. Tooth mortality rate per patient per year ......................................................................... 20
Table 9. Association between tooth loss and risk factors .............................................................. 21
Table 10. Genotype analysis of tooth loss ..................................................................................... 22
Table 11. Genetic association of IL-1 genotypes and tooth loss ................................................... 22
Table 12. Demographic characteristics at baseline evaluation in both age groups ....................... 24
Table 13. Number of teeth lost by age during different follow-up periods ................................... 25
Table 14. Frequency of tooth loss in relation to age groups ......................................................... 26
Table 15. Missing teeth with regards to types of teeth in subjects stratified by age ..................... 26
Table 16. Tooth loss difference with regards to types of teeth in subjects stratified by age ......... 27

ix
Table 17. Tooth loss difference with regards to types of teeth in subjects stratified by health
status .............................................................................................................................................. 28
Table 18. Distribution of sites in the total sample size .................................................................. 30
Table 19. CAL difference across different groups ...................................................................... 30
Table 20. Changes in CAL at different follow-up periods ............................................................ 32
Table 21. Changes in labial/ buccal CAL at different follow-up periods ...................................... 33
Table 22. Changes in lingual /palatal CAL at different follow-up periods ................................... 33
Table 23. CAL difference with regards to teeth aspects in younger group ................................... 35
Table 24. CAL difference with regards to teeth aspects in older group ........................................ 35
Table 25. CAL difference with regards to teeth aspects in healthy individuals ............................ 37
Table 26. CAL difference with regards to the teeth aspects in patients with systemic diseases ... 37

x
LIST OF FIGURES
Figure 1. Number of teeth lost by age and follow-up periods ....................................................... 25
Figure 2. Distribution of sites at the baseline periodontal assessments ........................................ 31
Figure 3. Distribution of sites at the final periodontal assessments .............................................. 31

xi
PREFACE
I wish to express my gratitude to the large number of people who have contributed to this study.
First, I wish to thank and express my deepest gratitude and respect to my mentor Dr. Alexandre
R Vieira for his guidance, expert advices and support that made my thesis experience run more
effectively.
My thanks are due to Jacqueline Noel (DRDR lab coordinator) for her valuable assistance
throughout the course of this study and to Vieira’s lab for providing the genotyping data for our
study.
It’s my pleasure to acknowledge my Master's thesis committee members Dr. Charles Sfeir and
Dr. Kelly Williams for their time and participation. Additionally, I would like to extend my
gratitude to Dr. Mark Mooney, Chair of the Department of Oral Biology, and to all faculty
members at the University of Pittsburgh Department of Oral biology for their contribution to my
education and their continuing commitment to our profession.
And finally, I express my warmest gratitude to my parents for their support, motivation, and
unconditional love that have provided me with drive to reach and attain my goals.

1
1.0 INTRODUCTION
1.1 PERIODONTAL DISEASE
Periodontal disease (periodontitis) can be defined as an inflammatory disease that affects the
teeth-supporting tissues in response to microbial pathogens and can lead to tooth loss if left
untreated (Williams, 1990). Bacterial biofilm is the primary etiological factor for the initiation of
gingivitis and the subsequent periodontal tissues destruction (Haffajee and Socransky, 1994).
The complex interaction between periodontal pathogens and the protective host response
determines the outcome of the disease (Page et al., 1997).
The clinical diagnosis of periodontitis is based on the presence of gingival inflammation,
periodontal pockets, loss of clinical attachment and alveolar bone loss (Page and Eke, 2007).
Clinical attachment loss (CAL) is considered to be the gold standard in the diagnosis and in the
measurement of past periodontal disease activity (American Academy of Periodontology, 2003).
Measuring the Clinical attachment loss is found to be more accurate in evaluating the periodontal
disease progression compared to periodontal pocket depth (Page and Eke, 2007).
2
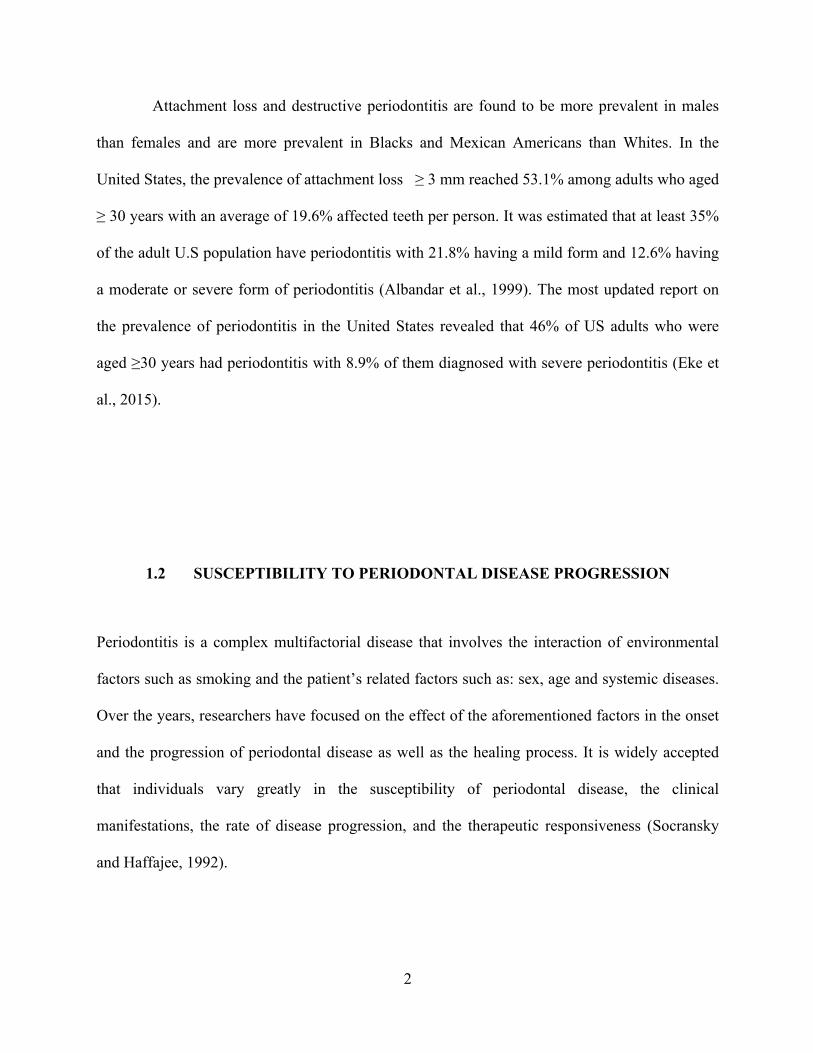
Attachment loss and destructive periodontitis are found to be more prevalent in males
than females and are more prevalent in Blacks and Mexican Americans than Whites. In the
United States, the prevalence of attachment loss ≥ 3 mm reached 53.1% among adults who aged
≥ 30 years with an average of 19.6% affected teeth per person. It was estimated that at least 35%
of the adult U.S population have periodontitis with 21.8% having a mild form and 12.6% having
a moderate or severe form of periodontitis (Albandar et al., 1999). The most updated report on
the prevalence of periodontitis in the United States revealed that 46% of US adults who were
aged ≥30 years had periodontitis with 8.9% of them diagnosed with severe periodontitis (Eke et
al., 2015).
1.2 SUSCEPTIBILITY TO PERIODONTAL DISEASE PROGRESSION
Periodontitis is a complex multifactorial disease that involves the interaction of environmental
factors such as smoking and the patient’s related factors such as: sex, age and systemic diseases.
Over the years, researchers have focused on the effect of the aforementioned factors in the onset
and the progression of periodontal disease as well as the healing process. It is widely accepted
that individuals vary greatly in the susceptibility of periodontal disease, the clinical
manifestations, the rate of disease progression, and the therapeutic responsiveness (Socransky
and Haffajee, 1992).
3
1.2.1 Diabetes
Diabetes mellitus is a group of metabolic diseases that are characterized by hyperglycemia
resulting from disturbances in either insulin production or function, or both (American Diabetes
Association, 2009). Periodontitis has been identified as the sixth complication of diabetes, and
the rate of periodontal disease among diabetic patients was found to be three times greater than
that in non-diabetics. Furthermore, diabetic patients with retinopathy are five times more likely
to have advanced periodontal disease than those without retinopathy (Löe, 1993). It has been
hypothesized that inflammatory periodontal diseases may increase insulin resistance that can
aggravate glycemic control in a way similar to obesity (Mealey and Oates, 2006).
Further research is needed to clarify the nature of this two-way relationship between
periodontal diseases and diabetes and to validate the impact of periodontal treatment on glycemic
control of diabetes taking into consideration the type of diabetes mellitus, the severity of
periodontal disease, and the types of periodontal therapy (Lalla and Papapanou, 2011).
In a national sample study by Kapp et al., a stronger association between tooth loss and
diabetes was detected among younger age groups. Furthermore, diabetic patients were 1.46 times
as likely to have at least one tooth removed than non-diabetics (Kapp et al., 2007).
4
1.2.2 Hypertension
Hypertension is a major global health issue that is considered to be the leading cause of death in
individuals with cardiovascular diseases. It was estimated that by the year 2025, there would be
1.56 billion cases of hypertension (Kearney et al., 2005).
It was reported that there is an inverse association between the number of teeth and the
increased in systolic blood pressure in men (Völzke et al., 2006). Also, a significant association
was found between tooth loss and an increased risk of hypertension in postmenopausal women
(Taguchi et al., 2004). The possible association between tooth loss and increased risk of ischemic
heart disease in men can be due to the common risk factors for both diseases (Paunio, et al.,
1993).
For a better understanding of the causal relationship between tooth loss or periodontal
disease and hypertension, large longitudinal studies that include all the possible confounding
variables are needed.
5
1.2.3 Smoking
Smoking has been established as a true risk factor for periodontitis. It was found that smokers
displayed less favorable healing responses compared with non-smokers (Ah et al., 1994).
Moreover, there is a smoking-induced suppressive effect on the hemorrhagic responsiveness
among smokers with periodontitis (Preber and Bergström, 1985; Bergström and Boström, 2001).
The relationship of smoking exposure and periodontal disease was found to be dose-dependent
and heavy exposure was consistently associated with the severity of periodontal disease
(Bergström et al., 2000). Limited information is available on the effects of smoking cessation on
the clinical outcomes of periodontal treatment. A recent meta-analysis concluded that there is a
positive impact of smoking cessation on periodontal tissue in terms of probing depth reduction
and clinical attachment gain (Chambrone et al., 2013).
1.2.4 Interleukin-1 Genotype (IL-1)
In 1997, Kornman introduced the possible association between composite interleukin-1 (IL-1)
genotype and periodontal disease. Since then, a tremendous progress has been made in
understanding the genetic basis for periodontal diseases. Interleukin-1 (IL-1) is a potent pro-
inflammatory cytokine that has two structurally distinct forms, IL-1α and IL-1 β, which are
encoded by separate genes that are located on the long arm of chromosome 2 (2q14-21). IL-1
secreted as a cluster that also includes IL-1 receptor antagonist gene that regulates the function of
IL-1 (Dinarello, 1996; Kornman et al., 1997).
6
The interaction between environmental and genetic factors to clinical measures of
periodontal disease was examined in 110 pairs of adult twins (mean age 40.3 years). The
studying population consisted of 63 monozygous and 33 dizygous twin pairs reared together and
14 monozygous twin pairs reared apart. Heritability estimates between 38% to 82% of the
population variance, indicated that periodontal measures including gingivitis, probing depth,
attachment loss and plaque may be attributed to genetic factors. Furthermore, a greater variation
was detected between monozygotic twins than between dizygotic twins (Michalowicz et al.,
1991; Seymour, 1991; Michalowicz, 1994; Michalowicz et al., 2000). Contradictory results have
been reported regarding the associations between interleukin-1 polymorphisms and the
periodontal disease progression, as well as treatment outcomes (McDevitt et al., 2000;
Papapanou et al., 2001; Rogers et al., 2002; Sakellari et al., 2003).
From the data currently available, it seems fair to suggest that the IL-1 genotype can be
tested to predict the success of periodontal therapy. However, based on a recent re-analysis of
published data by Diehl, et al., there is no evidence to support the benefits of genetic testing for
IL-1 polymorphisms, such as IL-1 periodontal sensitivity testing (PST) or PerioPredict, in high-
risk patients (Diehl et al., 2015).

7
1.3 TREATMENT OF CHRONIC PERIODONTITIS
The primary goal of periodontal therapy is to arrest the progression of periodontal destruction.
Treatment of periodontal disease depends mainly on the type and the severity of periodontal
disease in addition to other patients’ related factors. Periodontal therapy involves mechanical
removal of the sub-gingival biofilm and debridement of the mineralized deposits on the root
surface to re-establish a biocompatible environment with healthy periodontal tissues.
1.3.1 Non-Surgical Periodontal Therapy
The effectiveness of non-surgical periodontal therapy regarding clinical parameters such as
changes in clinical attachment level, probing pocket depth, and bleeding on probing for patients
with chronic periodontitis has been discussed in many studies (Badersten et al., 1984; Lindhe et
al., 1984; Cobb, 2002).
At the beginning of the 1990s, non-surgical periodontal therapy was performed using
power driven scalers instead of hand instruments. Several studies failed to detect a significant
difference between these two methods with regards to clinical parameters such as; Clinical
attachment level gain, reduction in periodontal probing depth, tooth loss and bleeding on probing
(Tunkel et al., 2002; Walmsley et al., 2008; Ioannou et al., 2009). On the other hand, ultrasonic
debridement was found to take significantly less time than mechanical debridement using hand
instruments (Tunkel et al., 2002; Walmsley et al., 2008).

8
There is no sufficient evidence of the long-term superior effectiveness of the Erbium-
doped yttrium aluminum garnet (Er:YAG) laser compared to scaling and root planning in
treating chronic periodontitis (Sculean et al., 2004; Schwarz et al., 2008; Sgolastra et al., 2012).
Chronic periodontal disease can be successfully treated, even in advanced stages by non-
surgical or surgical periodontal therapy with adequate plaque control that can be maintained
during supportive periodontal therapy (Lindhe and Nyman, 1975; Axelsson and Lindhe, 1981).
1.3.2 Supportive Periodontal Therapy (SPT)
The link between oral and systemic health is receiving significant interest in the dental field;
thereby many researchers have attempted to identify how these risk factors can influence the
progression of periodontal attachment loss as well as tooth loss. Tooth loss due to periodontal
disease is associated with several risk indicators including; age, being of the male sex, smoking,
diabetes mellitus, hypertension, rheumatoid arthritis, lack of professional maintenance, and
anterior tooth type (Al-Shammari et al., 2005). The patients’ risk assessment should be
performed after the completion of initial cause-related therapy (ICRT) and revisited continuously
(Renvert and Persson, 2004).
A twelve years longitudinal study revealed that supportive periodontal therapy can
prevent tooth loss and maintain the stability of bone and attachment loss among subjects with
normal susceptibility to periodontal disease (with mean overall attachment loss of 0.5 mm, i.e.
0.04 mm/tooth surface/year). However, highly susceptible patients who received a similar
9
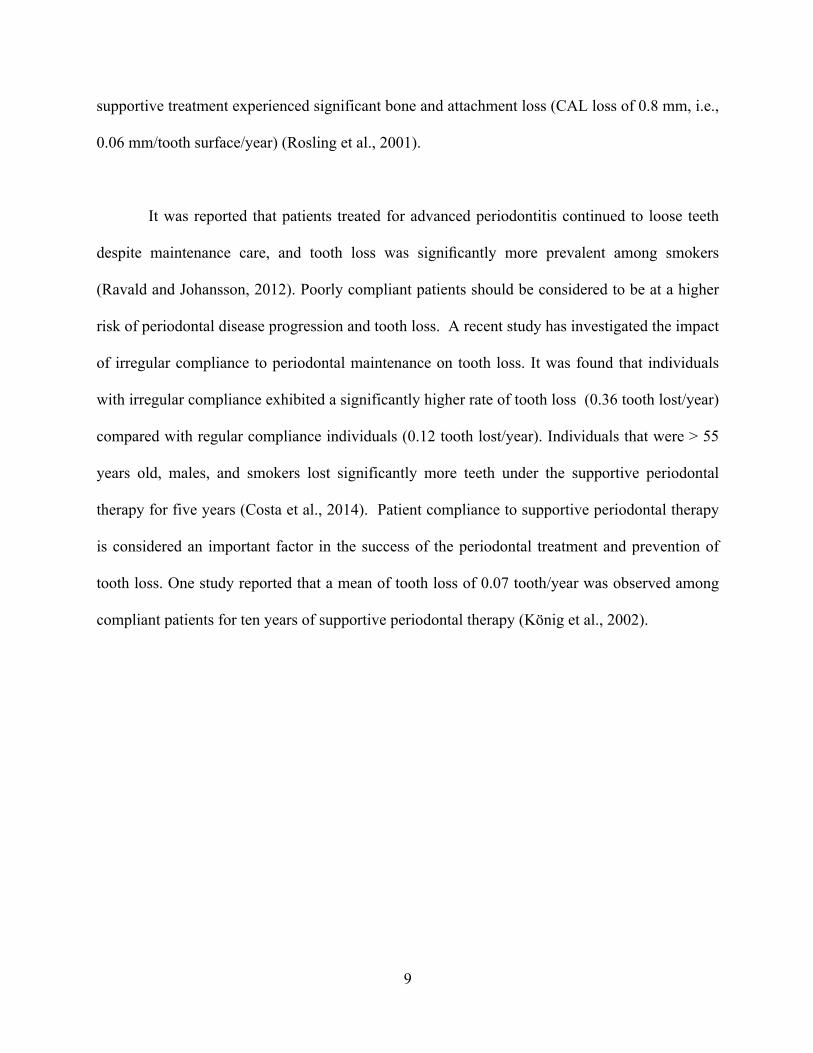
supportive treatment experienced significant bone and attachment loss (CAL loss of 0.8 mm, i.e.,
0.06 mm/tooth surface/year) (Rosling et al., 2001).
It was reported that patients treated for advanced periodontitis continued to loose teeth
despite maintenance care, and tooth loss was significantly more prevalent among smokers
(Ravald and Johansson, 2012). Poorly compliant patients should be considered to be at a higher
risk of periodontal disease progression and tooth loss. A recent study has investigated the impact
of irregular compliance to periodontal maintenance on tooth loss. It was found that individuals
with irregular compliance exhibited a significantly higher rate of tooth loss (0.36 tooth lost/year)
compared with regular compliance individuals (0.12 tooth lost/year). Individuals that were > 55
years old, males, and smokers lost significantly more teeth under the supportive periodontal
therapy for five years (Costa et al., 2014). Patient compliance to supportive periodontal therapy
is considered an important factor in the success of the periodontal treatment and prevention of
tooth loss. One study reported that a mean of tooth loss of 0.07 tooth/year was observed among
compliant patients for ten years of supportive periodontal therapy (König et al., 2002).

10
1.4 SPECIFIC AIMS AND OBJECTIVES
1. To assess the frequency and the severity of clinical attachment loss of periodontal tissue
in a sample with at least one year longitudinal follow-ups.
2. To evaluate the association between tooth loss and patient-related risk factors for
periodontal disease.
3. To evaluate the aggregate tooth loss in a sample of periodontal treated patients with at
least one year longitudinal follow-ups.
4. To evaluate the changes in clinical attachment loss in a sample of periodontal treated
patients with at least one year longitudinal follow-ups.

11
2.0 SUBJECTS AND METHODS
2.1 STUDY SETTING
Dental Registry and DNA Repository (DRDR) is a database that was established in 2006. Every
patient that has been treated at the University of Pittsburgh School of Dental Medicine receives
an invitation to participate in the registry and signs a consent form authorizing the retrieval of
information from their dental records. The study is approved by University of Pittsburgh
Institutional Review Board (IRB approval#0606091).
2.2 STUDY PARTICIPANTS
The subjects were recruited from (DRDR) and they were selected based on the following criteria:
1. Patients that have been diagnosed with moderate to severe chronic periodontitis.
2. The participant should have received at least three periodontal assessments (baseline, re-
evaluation and final evaluation).
3. The patient must have been attended regular supportive periodontal therapy for a
minimum of 12 months.
4. The participant should have completed information on medical history and IL-1
genotype.

12
Upon the screening of 4,825 dental records, 100 subjects met our selection criteria. In order to
assess the long-term effectiveness of non-surgical periodontal therapy, both tooth loss and
clinical attachment loss were used as an outcome of periodontal disease.
Tooth loss was counted when subjects lost one or more teeth after periodontal therapy and were
compared to subjects who did not have any tooth loss. In order to measure the changes in clinical
attachment loss (CAL), the patients were grouped based on the follow-up period that elapsed
from the baseline to the final periodontal assessments they had. The follow-up period ranged
from one to six years and the sample size experienced gradual attrition until it reached 17
subjects when the 6-year follow-up period was over.
Of all of the 100 enrolled patients, 69 were Caucasians, 29 were African-Americans, and one
patient was of Asian origin, and another of Hispanic origin. There were 46 females and 54 males
in the total sample. At the time of the initial examination, the average age was 53.07 years old
and ranged from 20 to 91 years old (Table 1).

13
Table 1. Demographic characteristics of the study subjects
Variables N=100
Women 46
Men 54
Asian 1
African-American 29
Caucasian 69
Hispanic 1
Smoker 22
Non-smoker 64
Former smoker 14
Diabetes 12
Hypertension 39
Hepatitis 4
Sickle cell anemia 4
Epilepsy 3
Stroke 4
Asthma 15
Tuberculosis 4
Cancer 13
Healthy 23

14
2.3 CASE DEFINITION
Severe periodontitis is defined as the presence of two or more interproximal sites with CAL ≥ 6
mm, not on the same tooth, and one or more interproximal sites with Probing Depth (PD) ≥ 5
mm. While, Moderate periodontitis is defined as the presence of two or more interproximal sites
with CAL ≥ 4 mm, not on the same tooth, or two or more interproximal sites with PD ≥ 5 mm,
not on the same tooth (Page and Eke, 2007).
2.4 IL-1 GENOTYPES
The genotypes data were provided from Vieira’s lab. Genomic DNA was extracted from saliva
and the genotypes were generated using Taqman chemistry (Ranade et al., 2001). The reactions
were carried out with the use of standard conditions as suggested by the manufacturer
2.5 PERIODNTAL ASSESMENTS
Each subject had at least two periodontal assessments in addition to the baseline assessment,
resulting in 456 periodontal assessments for the total sample size.

15
2.6 STATISTICAL ANALYSIS
All collected data were entered using Excel spreadsheets and the statistical analyses were
performed using R programming language at 5% significance level and 95% confidence interval.
Genetic Analyses were performed using PLINK Whole genome association analysis software
version 1.9.
Fisher’s exact test was used to determine the relationship between tooth loss and risk
factors including: age, sex, ethnicity, self-reported medical and smoking history.
Paired t-test was conducted to detect the difference between baseline and final CAL
measurements (labial/buccal, palatal/lingual, and full mouth CAL) in patients stratified by
follow-up periods, age and health status.
16
3.0 RESULTS
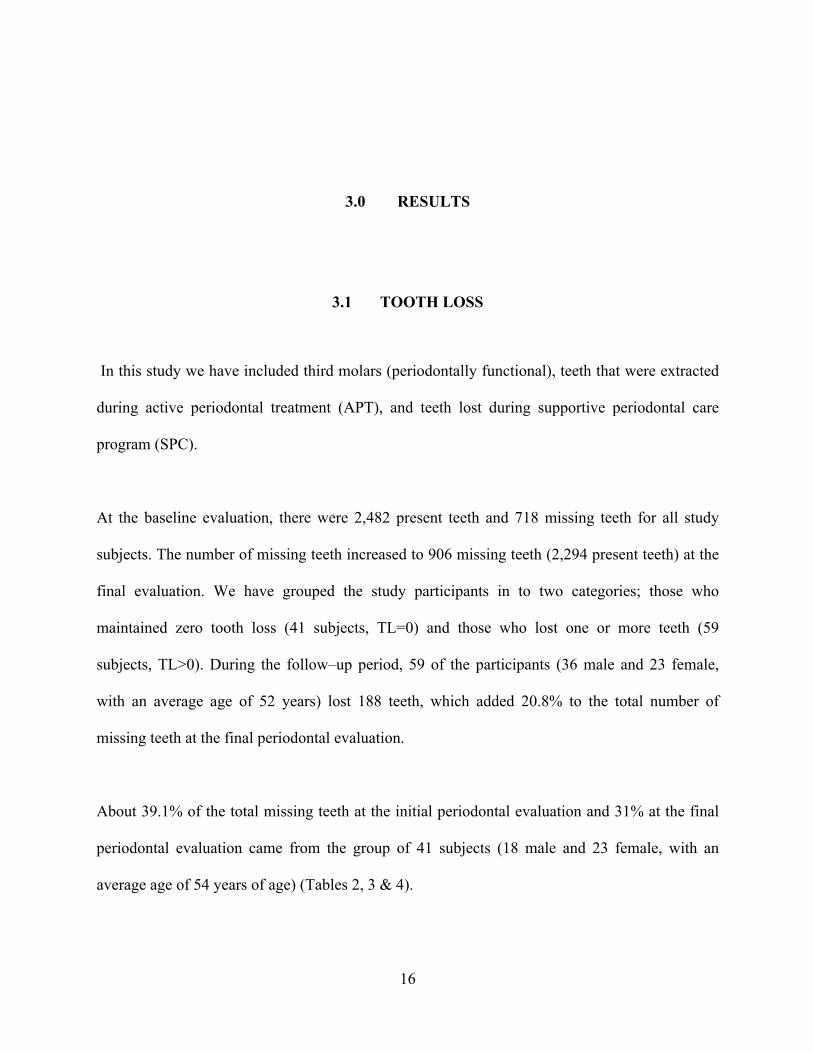
3.1 TOOTH LOSS
In this study we have included third molars (periodontally functional), teeth that were extracted
during active periodontal treatment (APT), and teeth lost during supportive periodontal care
program (SPC).
At the baseline evaluation, there were 2,482 present teeth and 718 missing teeth for all study
subjects. The number of missing teeth increased to 906 missing teeth (2,294 present teeth) at the
final evaluation. We have grouped the study participants in to two categories; those who
maintained zero tooth loss (41 subjects, TL=0) and those who lost one or more teeth (59
subjects, TL>0). During the follow–up period, 59 of the participants (36 male and 23 female,
with an average age of 52 years) lost 188 teeth, which added 20.8% to the total number of
missing teeth at the final periodontal evaluation.
About 39.1% of the total missing teeth at the initial periodontal evaluation and 31% at the final
periodontal evaluation came from the group of 41 subjects (18 male and 23 female, with an
average age of 54 years of age) (Tables 2, 3 & 4).

17
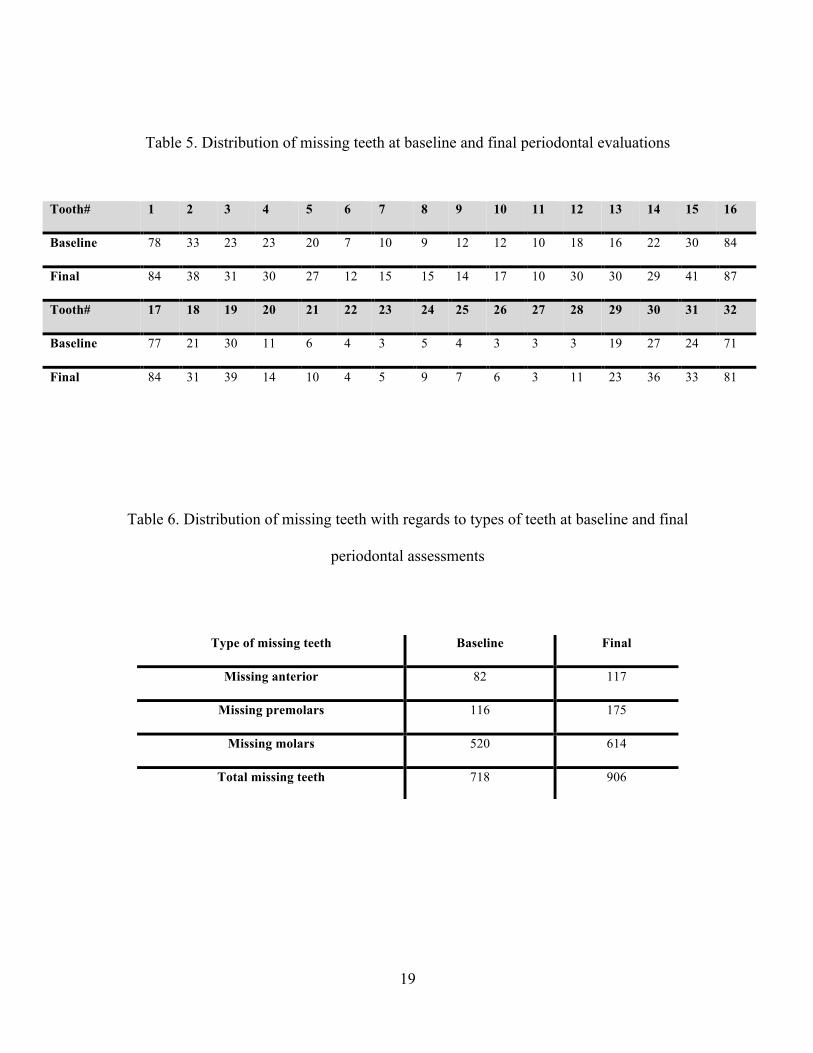
The baseline periodontal evaluations showed that molars were the most frequently missing teeth,
whereas canines were the least commonly missing teeth among all participants (Table 5 & 6).
Throughout the (APT), 68 teeth were extracted with mean tooth loss of 0.68 teeth/patient. This
number increased to 120 teeth during the (SPC) with mean tooth loss of 1.2 teeth/patient. Molars
were lost at a higher frequency compared with incisors during (APT) as well as (SPC), (Table 7).
Tooth mortality rate declined when comparing the group of patients who received supportive
periodontal therapy for one year (3.4 tooth mortality rate/patients /year) with those who were at 6
years supportive periodontal therapy (0.52 tooth mortality rate/patients /year), (Table 8).
Table 2. Distribution of subjects by the number of teeth lost
TL=0 TL=1 TL=2 TL=3 TL=4 TL=5 41 25 9 5 7 2
TL=6 TL=7 TL=13 TL=9 TL=10 Total pt with TL>0 3 2 1 3 2 59

18
Table 3. Distribution of 188 teeth lost with regards to types of teeth in (TL>0 group)
Table 4. Distribution of missing teeth during the follow-up period in (TL=0 group)
Tooth# 1 2 3 4 5 6 7 8 9 10 11 12 13 14 15 16
#Missing teeth 6 5 8 7 7 5 5 6 2 5 0 12 14 7 11 3
Tooth# 17 18 19 20 21 22 23 24 25 26 27 28 29 30 31 32
#Missing teeth 7 10 9 3 4 0 2 4 3 3 0 8 4 9 9 10
Tooth# 1 2 3 4 5 6 7 8 9 10 11 12 13 14 15 16
#Missing teeth 30 13 9 8 7 3 3 4 3 3 3 9 7 3 9 34
Tooth# 17 18 19 20 21 22 23 24 25 26 27 28 29 30 31 32
#Missing teeth 31 8 15 2 1 2 0 2 2 1 2 0 11 13 12 31
19
Table 5. Distribution of missing teeth at baseline and final periodontal evaluations
Table 6. Distribution of missing teeth with regards to types of teeth at baseline and final
periodontal assessments
Tooth# 1 2 3 4 5 6 7 8 9 10 11 12 13 14 15 16
Baseline 78 33 23 23 20 7 10 9 12 12 10 18 16 22 30 84
Final 84 38 31 30 27 12 15 15 14 17 10 30 30 29 41 87
Tooth# 17 18 19 20 21 22 23 24 25 26 27 28 29 30 31 32
Baseline 77 21 30 11 6 4 3 5 4 3 3 3 19 27 24 71
Final 84 31 39 14 10 4 5 9 7 6 3 11 23 36 33 81
Type of missing teeth Baseline Final
Missing anterior 82 117
Missing premolars 116 175
Missing molars 520 614
Total missing teeth 718 906

20
Table 7. Distribution of the type of teeth lost during APT and SPC
Table 8. Tooth mortality rate per patient per year
Missing teeth APT SPC
Missing anterior 7 28
Missing premolars 26 33
Missing molars 35 59
Total teeth loss 68 120
Follow-up period Tooth mortality rate
1-year 3.4
2-years 1.14
3-years 0.81
4-years 0.89
5-years 0.77
6-years 0.52

21
3.2 TOOTH LOSS AND RISK FACTORS
The relationships between each predictor variables and tooth loss were explored by using
Fisher’s exact test. We found a statistically significant association between tooth loss and
diabetes as well as tooth loss and hypertension (P=0.014 and P=6.7 26e-07, respectively).
Table 9. Association between tooth loss and risk factors
Variable TL=0 TL>0 Fisher’s exact test With Diabetes 9 3 0.014* Without Diabetes 32 56 Healthy 9 14 1 Systemic disease 32 45 With Epilepsy 0 3 0.267 Without Epilepsy 41 56 With Stroke 2 2 1 Without Stroke 39 57 With Asthma 7 8 0.78 Without Asthma 34 51 With Tuberculosis 2 2 1 Without Tuberculosis 39 57
With Sickle cell anemia 2 2 1 Without Sickle cell anemia 39 57 With Hepatitis 2 2 1 Without Hepatitis 39 57 With High blood pressure 18 2 6.7 26e-07* Without High blood pressure 23 57 With Cancer 5 8 1 Without Cancer 36 51 Female 23 23 0.106 Male 18 36 African-American 14 15 0.137 Other 2 0 Caucasian 25 44 Non-smoker 29 35 0.503 Smoker 7 15 Former smoker 5 9

22
3.3 TOOTH LOSS AND IL-1 GENOTYPES
Genetic analyses were performed comparing subjects who lost one or more teeth with
individuals who maintained zero tooth loss using PLINK Whole genome association analysis
software version 1.9. The results of the association analysis in the study groups are presented in
Table 10. No significant associations were observed between any of the IL-1 polymorphisms and
tooth loss (rs1800587, P = 0.36 and rs1143634, P = 0.51). These findings were confirmed by
running Fisher’s exact test under a dominant model to test the association between tooth loss and
the genotypes containing the minor allele A in both SNPs (Table 11).
Table 10. Genotype analysis of tooth loss
Table 11. Genetic association of IL-1 genotypes and tooth loss
Ch SNP BP A1 F_A F_U A2 Chi-sq P-value OR SE 95% CI MAF
2 rs1800587 112785383 A 0.25 0.195 G 0.824 0.3641 1.38 0.352 (0.69-2.74) 0.227 2 rs1143634 112832813 A 0.38 0.333 G 0.428 0.5132 1.22 0.307 (0.67-2.23) 0.361
SNP/genotypes
Test /model TL>0
TL=0
Fisher’s exact test
IL1-A (rs1800587) AA/AG/GG Genotype 7/30/21 4/18/17 0.764
AA + AG vs GG Dominant model 37/21 22/17 0.527
AA vs AG + GG Recessive model 7/51 4/35 1
IL1-B (rs1143634) AA/AG/GG Genotype 4/21/33
2/12/27 0.666
AA + AG vs GG Dominant model 25/33
14/27 0.409
AA vs AG + GG Recessive model 4/54 2/39 1

23
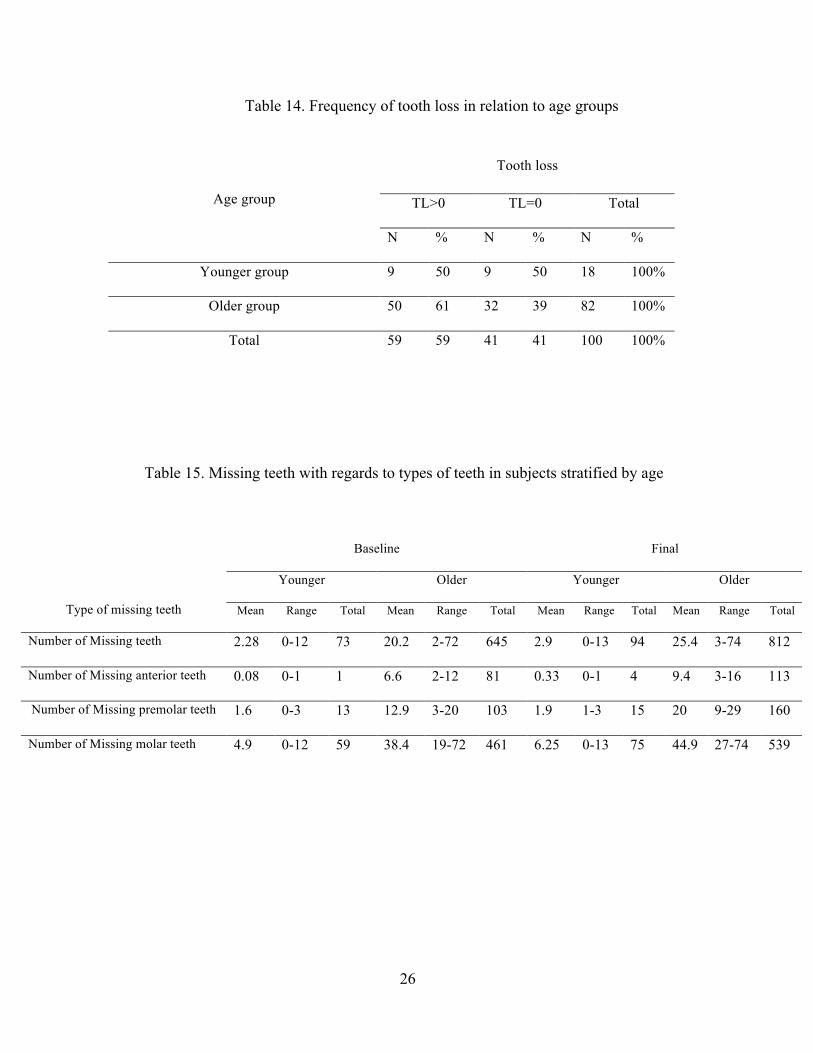
3.4 TOOTH LOSS AND AGE
Of all participants, 18% were aged between 20 - 39 years old (younger group) and 82% were
aged 40- 91 years old (older group), (Table 12). The baseline age distribution with follow-up
periods and the number of teeth lost is summarized in Table 13 and Figure 1.
In our analysis the association between tooth loss and aging was found to be non-significant
(Fisher’s exact test, P=0.43), (Table 14). When comparing situations between the two groups, the
number of missing teeth at baseline as well as at final periodontal evaluation was found to be
higher in older group (645 missing teeth in the older group compared with 73 in the younger
group at baseline and 812 missing teeth in the older group compared with 94 in the younger
group), (Table 15). The mean of tooth loss was significantly increased in both groups (younger
group, P=0.006 and for older group P=0.0001) and molars were the most significantly lost teeth
in both groups (younger group, P=0.011 and for older group P=0.0001). Older group showed
significant difference in the mean of tooth loss with respect to all teeth types (Table 16).

24
Table 12. Demographic characteristics at baseline evaluation in both age groups
Baseline evaluation Younger group (N=18) Older group (N=82)
Women 9 (50%) 37 (45.1%)
Men 9 (50%) 45 (54.9%)
African-American 6 (33.3%) 23 (28.05%)
Caucasian 11(61.1%) 58 (70.7%)
Hispanic 0 1 (1.22%)
Asian 1 (5.6%) 0
Smoker 4 (22.2%) 18 (22%)
Non-smoker 13 (72.2%) 51 (62.2%)
Former smoker 1 (5.6%) 13 (15.9%)
Diabetes 0 12 (14.6%)
Hypertension 4 (22.2%) 35 (42.7%)
Hepatitis 2 (11.1) 2 (2.4%)
Sickle cell anemia 0 4 (4.9%)
Epilepsy 1 (5.6%) 2 (2.4%)
Stroke 0 4 (4.9%)
Asthma 2 (11.1) 13 (15.9%)
Tuberculosis 1(5.6%) 3 (3.7%)
Cancer 1(5.6%) 12 (14.6%)
Healthy 6 (33.3%) 17 (20.7%)

25
Table 13. Number of teeth lost by age during different follow-up periods
Figure 1. Number of teeth lost by age and follow-up periods
Age group (years) 1-yr
2-yrs
3-yrs
4-yrs
5-yrs
6-yrs
20-29yrs 4 0 5 3 1 0 30-39yrs 0 5 0 0 1 2 40-49yrs 19 2 1 14 8 6 50-59yrs 20 0 9 26 0 20 60-69yrs 4 5 0 4 10 2 70-79yrs 0 4 2 1 7 0 80-91yrs 0 0 0 2 0 1 Total number of teeth loss
47 16 17 50 27 31
1-yr
3-yr
5-yr
0
5
10
15
20
25
30
20-29 30-39 40-49 50-59 60-69 70-79 80-91
Toot
h lo
ss
Age (years)
Number of teeth lost by age and follow-up period
1-yr
2-yr
3-yr
4-yr
5-yr
6-yr
26
Table 14. Frequency of tooth loss in relation to age groups
Table 15. Missing teeth with regards to types of teeth in subjects stratified by age
Age group
Tooth loss
TL>0 TL=0 Total
N % N % N %
Younger group 9 50 9 50 18 100%
Older group 50 61 32 39 82 100%
Total 59 59 41 41 100 100%
Type of missing teeth
Baseline Final
Younger Older Younger Older
Mean Range Total Mean Range Total Mean Range Total Mean Range Total
Number of Missing teeth 2.28 0-12 73 20.2 2-72 645 2.9 0-13 94 25.4 3-74 812
Number of Missing anterior teeth 0.08 0-1 1 6.6 2-12 81 0.33 0-1 4 9.4 3-16 113
Number of Missing premolar teeth 1.6 0-3 13 12.9 3-20 103 1.9 1-3 15 20 9-29 160
Number of Missing molar teeth 4.9 0-12 59 38.4 19-72 461 6.25 0-13 75 44.9 27-74 539

27
Table 16. Tooth loss difference with regards to types of teeth in subjects stratified by age
Types of missing teeth t P-value 95%CI Mean SD SEM Mean diff df SE of diff
You
nger
gro
up (N
=18)
# Missing teeth
3.13 0.006* -1.95 to -0.38 4.06 2.75 0.65 -1.17 17 0.37
5.22 2.78 0.65 # Missing anterior teeth
1 0.33 -0.52 to 0.18 0.06 0.24 0.06 -0.17 17 0.167
0.22 0.73 0.17
# Missing premolar teeth
1.46 0.16 -0.27 to 0.05 0.72 1.23 0.29 -0.11 17 0.076
0.83 1.34 0.32 # Missing molar teeth
2.85 0.011* -1.55 to -0.23 3.28 2.22 0.52 -0.89 17 0.31 4.17 2.43 0.57
Old
er g
roup
(N
=82)
# Missing teeth
6.37 0.0001* -2.67 to -1.40 7.87 5.04 0.56 -2.04 81 0.32 9.90 5.61 0.62
# Missing anterior teeth
3.48 0.0008* -0.61 to -0.17 0.99 1.84 0.20 -0.39 81 0.11 1.38 2.09 0.23
# Missing premolar teeth
5.27 0.0001* -0.96 to -0.43 1.26 1.78 0.20 -0.70 81 0.13 1.95 2.09 0.23
# Missing molar teeth
5.88 0.0001* -1.27 to -0.63 5.62 2.78 0.31 -0.95 81 0.162 6.57 2.74 0.30
28
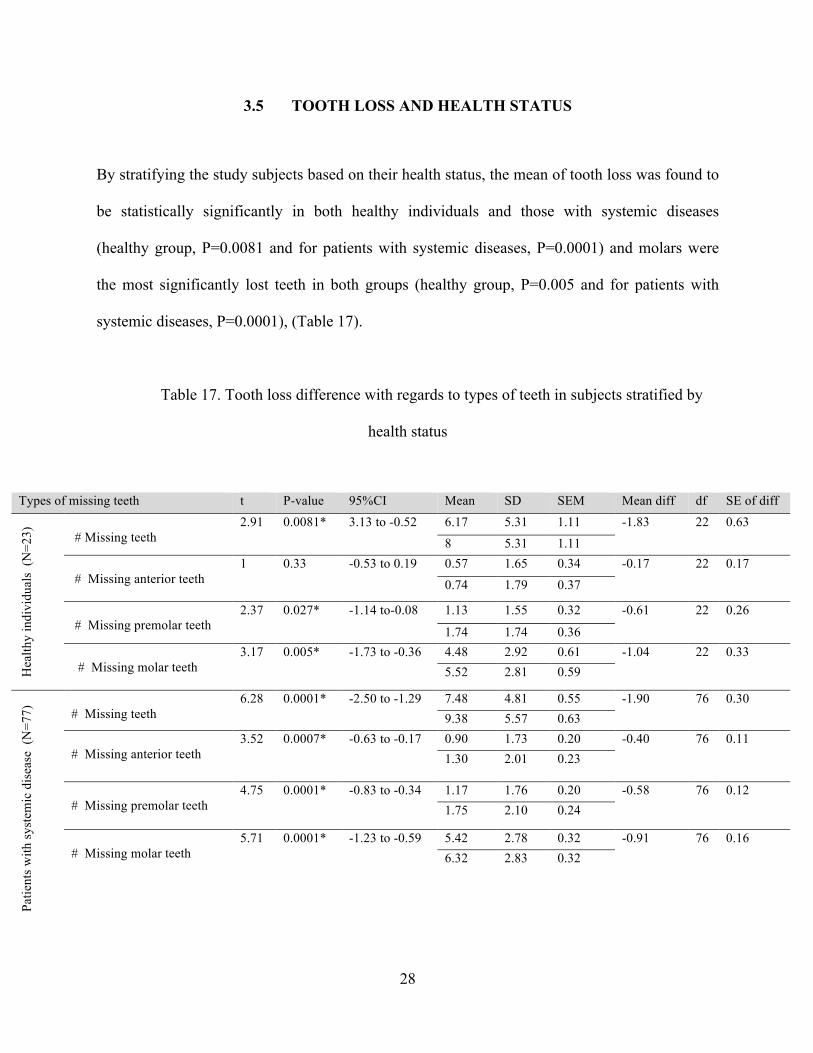
3.5 TOOTH LOSS AND HEALTH STATUS
By stratifying the study subjects based on their health status, the mean of tooth loss was found to
be statistically significantly in both healthy individuals and those with systemic diseases
(healthy group, P=0.0081 and for patients with systemic diseases, P=0.0001) and molars were
the most significantly lost teeth in both groups (healthy group, P=0.005 and for patients with
systemic diseases, P=0.0001), (Table 17).
Table 17. Tooth loss difference with regards to types of teeth in subjects stratified by
health status
Types of missing teeth t P-value 95%CI Mean SD SEM Mean diff df SE of diff
Hea
lthy
indi
vidu
als
(N=2
3)
# Missing teeth
2.91 0.0081* 3.13 to -0.52 6.17 5.31 1.11 -1.83 22 0.63 8 5.31 1.11
# Missing anterior teeth
1 0.33 -0.53 to 0.19 0.57 1.65 0.34 -0.17 22 0.17 0.74 1.79 0.37
# Missing premolar teeth
2.37 0.027* -1.14 to-0.08 1.13 1.55 0.32 -0.61 22 0.26
1.74 1.74 0.36 # Missing molar teeth
3.17 0.005* -1.73 to -0.36 4.48 2.92 0.61 -1.04 22 0.33 5.52 2.81 0.59
Patie
nts w
ith sy
stem
ic d
isea
se (
N=7
7)
# Missing teeth 6.28 0.0001* -2.50 to -1.29 7.48 4.81 0.55 -1.90 76 0.30
9.38 5.57 0.63 # Missing anterior teeth
3.52 0.0007* -0.63 to -0.17 0.90 1.73 0.20 -0.40 76 0.11 1.30
2.01 0.23
# Missing premolar teeth
4.75 0.0001* -0.83 to -0.34 1.17 1.76 0.20 -0.58 76 0.12 1.75 2.10 0.24
# Missing molar teeth
5.71 0.0001* -1.23 to -0.59 5.42 2.78 0.32 -0.91 76 0.16 6.32 2.83 0.32

29
3.6 CLINICAL ATTACHMENT LOSS LEVEL (CAL)
Periodontal diagnosis was classified according to the American Academy of Periodontology
guidelines (Armitage, 1999). The severity of periodontal disease is based on the amount of
clinical attachment loss (CAL) and is designated as mild (1–2 mm CAL), moderate (3–4 mm
CAL), and severe (>5 mm CAL). Periodontitis is classified as localized if the affected sites are
30% or less and generalized if there are more than 30% affected sites. The clinical attachment
level of all six points (the mesial, the mid, and the distal points of both labial/buccal and
lingual/palatal surfaces) of each standing tooth was recorded for every periodontal evaluation the
patients underwent.
3.7 PERIODONTAL HEALTH STATUS OF THE STUDY POPULATION
Of the 14,527 recorded measurements (missing sites were excluded), 196 (1.35%) sites were
classified as healthy sites, having no active periodontitis, yet 6,979 (48.04%), 5,762 (39.7%), and
1,590 sites (10.9%) that were included in the study defined as mild, moderate, and severe CAL
sites, respectively. The majority of sites with moderate and severe CAL were located on the
labial/buccal aspects, whereas the lingual/palatal surfaces comprised mainly of sites with mild
CAL (Tables 18, Figures 2 and 3). Based on the changes in clinical attachment loss, the patients
were sorted into three groups: progressive, regressive, and stable. The progressive group
included the patients who showed an increase in CAL (mean difference of -0.62 mm), whereas
the regressive group included the patients who showed a reduction in CAL (mean difference of
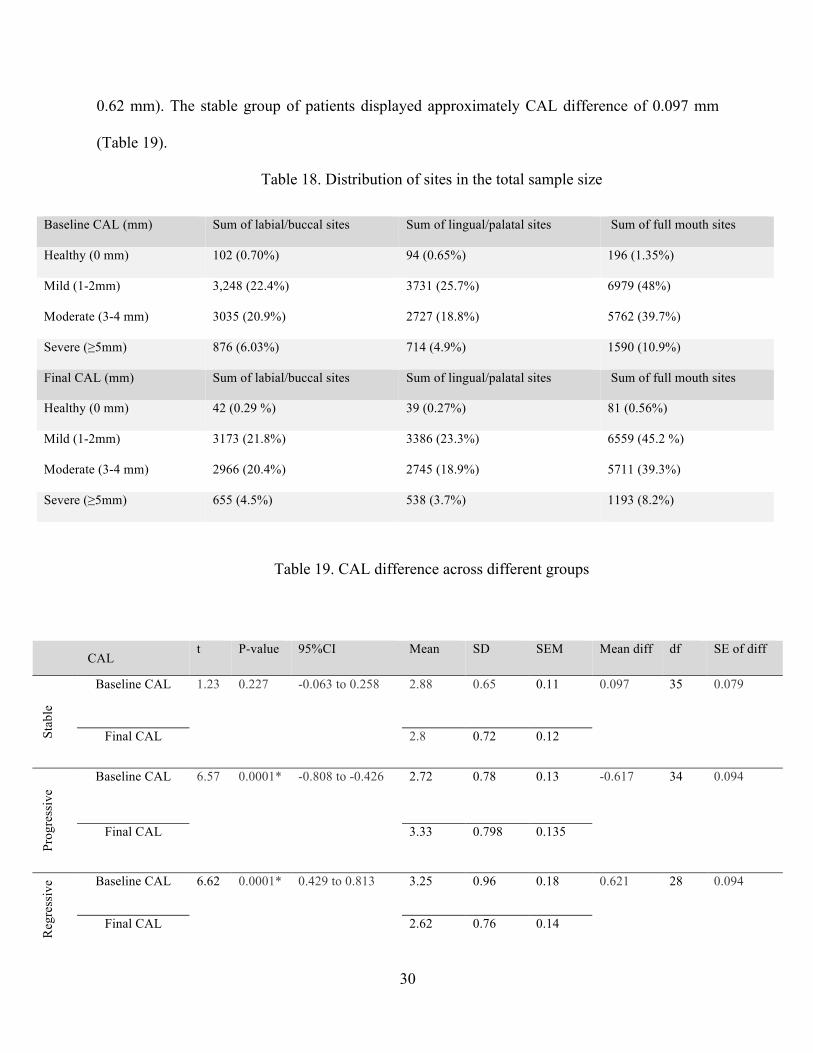
30
0.62 mm). The stable group of patients displayed approximately CAL difference of 0.097 mm
(Table 19).
Table 18. Distribution of sites in the total sample size
Table 19. CAL difference across different groups
Baseline CAL (mm) Sum of labial/buccal sites Sum of lingual/palatal sites Sum of full mouth sites
Healthy (0 mm) 102 (0.70%) 94 (0.65%) 196 (1.35%)
Mild (1-2mm) 3,248 (22.4%) 3731 (25.7%) 6979 (48%)
Moderate (3-4 mm) 3035 (20.9%) 2727 (18.8%) 5762 (39.7%)
Severe (≥5mm) 876 (6.03%) 714 (4.9%) 1590 (10.9%)
Final CAL (mm) Sum of labial/buccal sites Sum of lingual/palatal sites Sum of full mouth sites
Healthy (0 mm) 42 (0.29 %) 39 (0.27%) 81 (0.56%)
Mild (1-2mm) 3173 (21.8%) 3386 (23.3%) 6559 (45.2 %)
Moderate (3-4 mm) 2966 (20.4%) 2745 (18.9%) 5711 (39.3%)
Severe (≥5mm) 655 (4.5%) 538 (3.7%) 1193 (8.2%)
CAL t P-value 95%CI Mean SD SEM Mean diff df SE of diff
Stab
le
Baseline CAL 1.23 0.227 -0.063 to 0.258 2.88 0.65 0.11 0.097 35 0.079
Final CAL 2.8 0.72 0.12
Prog
ress
ive
Baseline CAL 6.57 0.0001* -0.808 to -0.426 2.72 0.78 0.13 -0.617 34 0.094
Final CAL 3.33 0.798 0.135
Reg
ress
ive Baseline CAL 6.62 0.0001* 0.429 to 0.813 3.25 0.96 0.18 0.621 28 0.094
Final CAL 2.62 0.76 0.14

31
Figure 2. Distribution of sites at the baseline periodontal assessments
Figure 3. Distribution of sites at the final periodontal assessments
0
1000
2000
3000
4000
5000
6000
7000
Healthy Mild Moderate Severe
Sumofsites
BaselineCAL
Labial/Buccalsites
Lingual/Palatalsites
Fullmouthsites
0
1000
2000
3000
4000
5000
6000
7000
Healthy Mild Moderate Severe
Sumofsites
FinalCAL
Labial/Buccalsites
Lingual/Palatalsites
Fullmouthsites
32
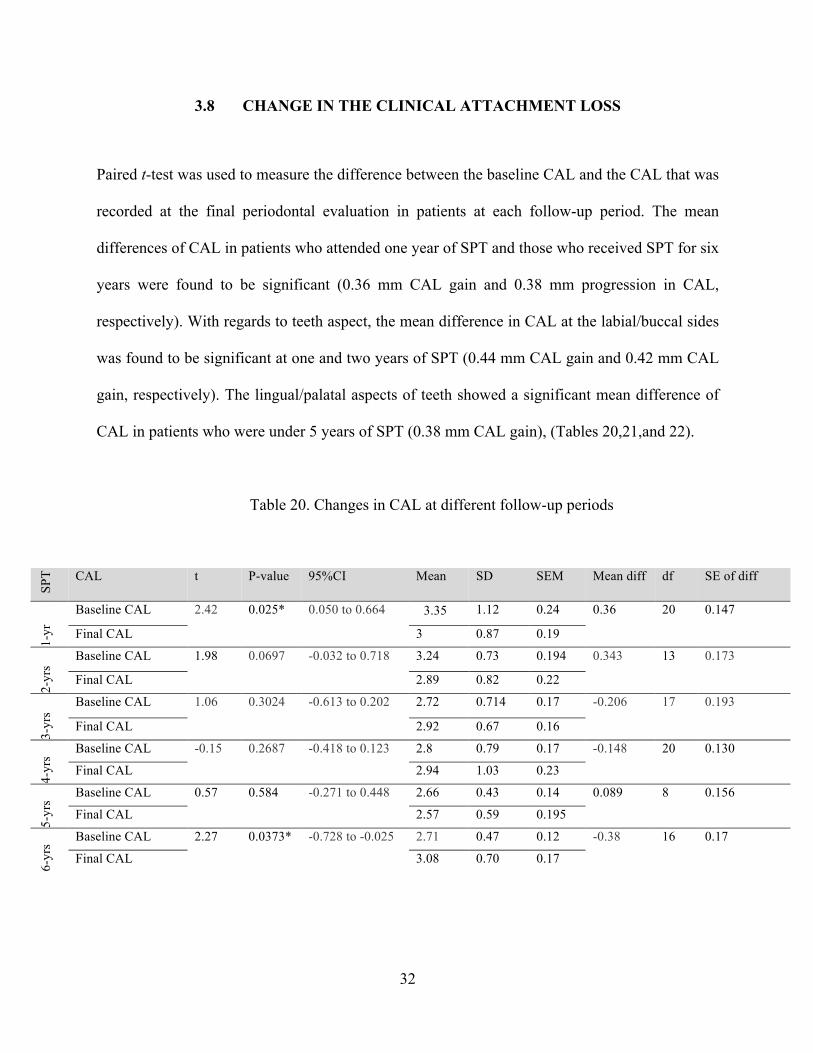
3.8 CHANGE IN THE CLINICAL ATTACHMENT LOSS
Paired t-test was used to measure the difference between the baseline CAL and the CAL that was
recorded at the final periodontal evaluation in patients at each follow-up period. The mean
differences of CAL in patients who attended one year of SPT and those who received SPT for six
years were found to be significant (0.36 mm CAL gain and 0.38 mm progression in CAL,
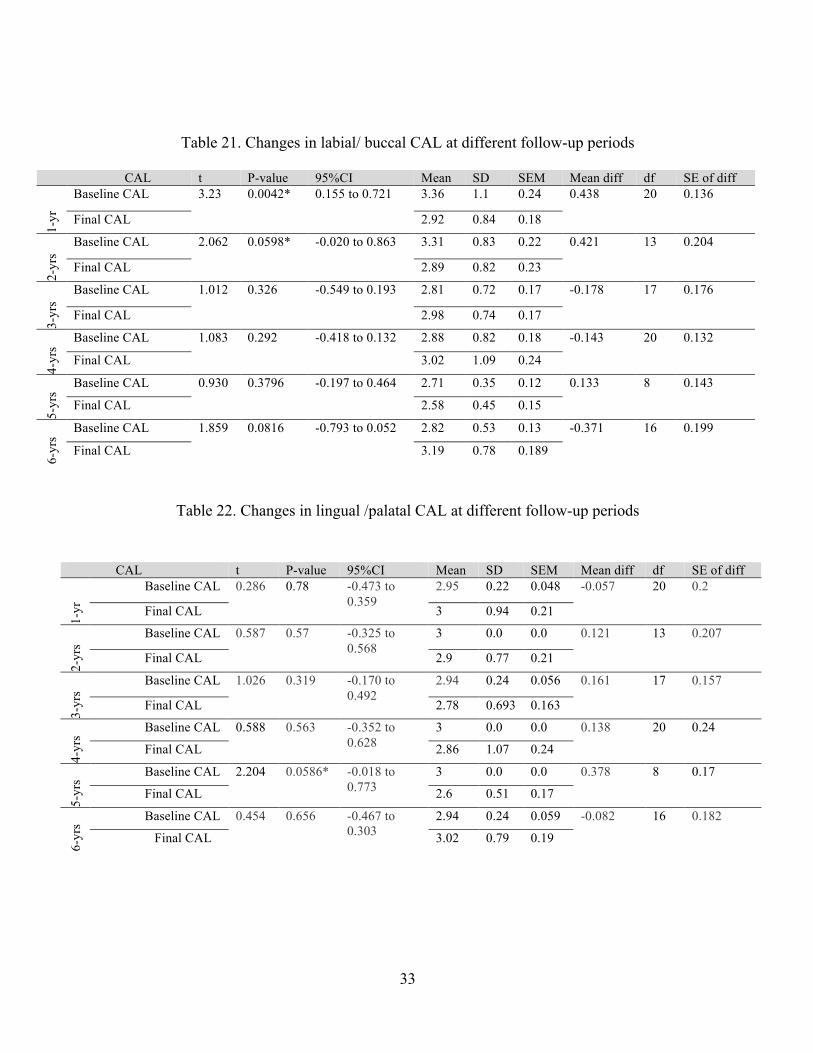
respectively). With regards to teeth aspect, the mean difference in CAL at the labial/buccal sides
was found to be significant at one and two years of SPT (0.44 mm CAL gain and 0.42 mm CAL
gain, respectively). The lingual/palatal aspects of teeth showed a significant mean difference of
CAL in patients who were under 5 years of SPT (0.38 mm CAL gain), (Tables 20,21,and 22).
Table 20. Changes in CAL at different follow-up periods
SPT CAL t P-value 95%CI Mean SD SEM Mean diff df SE of diff
1-yr
Baseline CAL 2.42 0.025* 0.050 to 0.664 3.35
1.12 0.24 0.36 20 0.147
Final CAL 3 0.87 0.19
2-yr
s
Baseline CAL 1.98 0.0697 -0.032 to 0.718 3.24 0.73 0.194 0.343 13 0.173
Final CAL 2.89 0.82 0.22
3-yr
s
Baseline CAL 1.06 0.3024 -0.613 to 0.202 2.72 0.714 0.17 -0.206 17 0.193
Final CAL 2.92 0.67 0.16
4-yr
s
Baseline CAL -0.15 0.2687 -0.418 to 0.123 2.8 0.79 0.17 -0.148 20 0.130
Final CAL 2.94 1.03 0.23
5-yr
s
Baseline CAL 0.57 0.584 -0.271 to 0.448 2.66 0.43 0.14 0.089 8 0.156
Final CAL 2.57 0.59 0.195
6-yr
s
Baseline CAL 2.27 0.0373* -0.728 to -0.025 2.71 0.47 0.12 -0.38 16 0.17
Final CAL 3.08 0.70 0.17
33
Table 21. Changes in labial/ buccal CAL at different follow-up periods
Table 22. Changes in lingual /palatal CAL at different follow-up periods
CAL t P-value 95%CI Mean SD SEM Mean diff df SE of diff
1-yr
Baseline CAL 3.23 0.0042* 0.155 to 0.721 3.36 1.1 0.24 0.438 20 0.136
Final CAL 2.92 0.84 0.18
2-yr
s
Baseline CAL 2.062 0.0598* -0.020 to 0.863 3.31 0.83 0.22 0.421 13 0.204
Final CAL 2.89 0.82 0.23
3-yr
s
Baseline CAL 1.012 0.326 -0.549 to 0.193 2.81 0.72 0.17 -0.178 17 0.176
Final CAL 2.98 0.74 0.17
4-yr
s
Baseline CAL 1.083 0.292 -0.418 to 0.132 2.88 0.82 0.18 -0.143 20 0.132
Final CAL 3.02 1.09 0.24
5-yr
s
Baseline CAL 0.930 0.3796 -0.197 to 0.464 2.71 0.35 0.12 0.133 8 0.143
Final CAL 2.58 0.45 0.15
6-yr
s
Baseline CAL 1.859 0.0816 -0.793 to 0.052 2.82 0.53 0.13 -0.371 16 0.199
Final CAL 3.19 0.78 0.189
CAL t P-value 95%CI Mean SD SEM Mean diff df SE of diff
1-yr
Baseline CAL 0.286 0.78 -0.473 to 0.359
2.95 0.22 0.048 -0.057 20 0.2
Final CAL 3 0.94 0.21
2-yr
s
Baseline CAL 0.587 0.57 -0.325 to 0.568
3 0.0 0.0 0.121 13 0.207
Final CAL 2.9 0.77 0.21
3-yr
s
Baseline CAL 1.026 0.319 -0.170 to 0.492
2.94 0.24 0.056 0.161 17 0.157
Final CAL 2.78 0.693 0.163
4-yr
s
Baseline CAL 0.588 0.563 -0.352 to 0.628
3 0.0 0.0 0.138 20 0.24
Final CAL 2.86 1.07 0.24
5-yr
s
Baseline CAL 2.204 0.0586* -0.018 to 0.773
3 0.0 0.0 0.378 8 0.17
Final CAL 2.6 0.51 0.17
6-yr
s
Baseline CAL 0.454 0.656 -0.467 to 0.303
2.94 0.24 0.059 -0.082 16 0.182
Final CAL 3.02 0.79 0.19

34
3.9 CLINICAL ATTACHMENT LOSS AND AGE
We have measured the difference in number of sites with different periodontal status at the
labial/buccal and lingual /palatal aspects of teeth in both age groups, regardless of the length of
supportive periodontal therapy. We found that the mean difference in number of sites with stable,
mild, moderate and severe CAL on both labial/buccal and lingual/palatal aspects were non-
significant in younger patients (Table 23).
In older group, patients showed a statistically significant reduction in number of sites with stable
and severe CAL on the labial/buccal aspects (mean difference of 0.41 and 1.99, respectively).
Also, the lingual/palatal aspect of teeth in older patients exhibited a significant reduction in
number of sites with stable and severe CAL with mean difference of 0.46 and 1.83 sites,
respectively (Table 24).

35
Table 23. CAL difference with regards to teeth aspects in younger group
Table 24. CAL difference with regards to teeth aspects in older group
Clinical attachment loss t P-value 95%CI Mean SD SEM Mean diff df SE of diff
La
bial
/ Buc
cal a
spec
t (N
=18)
Stable CAL 1.23 0.235 -1.03 to 3.92 3.28 9 2.12 1.44 17 1.17
1.83 5.9 1.39 Mild CAL
0.049 0.961 -7.29 to 6.96 45.2 17.24 4.06 -0.17 17 3.38
45.3 16.72 3.94
Moderate CAL 1.34 0.198 -11.88 to 2.65 25.33 12.34 2.91 -4.61 17 3.44
29.94 18.10 4.27
Severe CAL 1.358 0.192 -1.66 to 7.66 5.39 9.49 2.24 3 17 2.21
2.39 2.77 0.65
Ling
ual/P
alat
al a
spec
t (N
=18)
Stable CAL 0.911 0.375 -1.24 to 3.13 2.89 5.89 1.39 0.94 17 1.037
1.94 6.61 1.56
Mild CAL
1.468 0.161 -2.19 to 12.19 50.22 18.43 4.34 5 17 3.407
45.22 16.25 3.83
Moderate CAL 0.626 0.54 -11.65 to 6.32 23.89 14.29 3.37 -2.67 17 4.26
26.56 14.44 3.40 Severe CAL 1.434 0.1698 -0.81 to 4.26 2.89 4.98 1.17 1.72 17 1.201
1.17 1.86 0.44
Clinical attachment loss t P-value 95%CI Mean SD SEM Mean diff df SE of diff
La
bial
/ Buc
cal a
spec
t (N
=82)
Stable CAL 2.20 0.031* 0.04 to 0.79 0.52 1.53 0.17 0.41 81 0.19
0.11 0.69 0.08 Mild CAL
0.46 0.65 -3.15 to 5.05 29.7 15.24 1.68 0.95 81 2.06
28.7 16.79 1.85 Moderate CAL 1.04 0.299 -1.68 to 5.38 31.45 13.41 1.48 1.85 81 1.78
29.60 14.63 1.62 Severe CAL 2.14 0.035* 0.14 to 3.83 9.44 9.65 1.07 1.99 81 0.93
7.45 8.50 0.94
Ling
ual/P
alat
al a
spec
t (N
=82)
Stable CAL 2.10 0.039* 0.03 to 0.90 0.51 1.95 0.22 0.46 81 0.22
0.05 0.35 0.04
Mild CAL
1.55 0.124 -0.87 to 7.09 34.48 17.90 1.98 3.11 81 2
31.37 17.15 1.89
Moderate CAL 0.211 0.834 -3.09 to 3.82 28.01 12.72 1.40 0.37 81 1.74
27.65 14.51 1.60 Severe CAL 1.98 0.051* -0.01 to 3.67 8.04 9.83 1.09 1.83 81 0.92
6.21 7.46 0.82
36
3.10 CLINICAL ATTACHMENT LOSS AND HEALTH STATUS
In the group of healthy individuals, the number of sites with mild CAL reduced significantly as a
result of SPT with mean difference of 11.7 sites on the lingual/palatal aspects. Whereas, sites
with moderate CAL were increased (mean difference of 7.13 sites) on the lingual/palatal aspects
(Table 25).
Patients with systemic disease showed a significant reduction in number of sites with stable and
severe CAL on the labial/buccal aspects (mean difference of 0.53 and 2.91 sites, respectively).
On the lingual/palatal aspects, only the number of sites with severe CAL was reduced
significantly with mean difference of 2.42 sites (Table 26).

37
Table 25. CAL difference with regards to teeth aspects in healthy individuals
Table 26. CAL difference with regards to the teeth aspects in patients with systemic diseases
Clinical attachment loss
t P-value 95%CI Mean SD SEM Mean diff df SE of diff
Lab
ial/
Buc
cal a
spec
t (N
=23)
Stable CAL 1.006 0.325 -0.88 to 2.53 1.17 3.75 0.78 0.83 22 0.821 0.35 1.03 0.21
Mild CAL
1.45 0.16 -2.58 to 14.58 36.70 16.13 3.36 6 22 4.14 30.70 16.64 3.47
Moderate CAL 0.17 0.867 -7.46 to 6.33 32.04 14.76 3.08 -0.57 22 3.324 32.61 15.13 3.16
Severe CAL 0.18 0.860 -3.85 to 3.24 7.35 7.43 1.55 -0.30 22 1.710 7.65 7.81 1.63
Ling
ual/P
alat
al a
spec
t (N
=23)
Stable CAL 1.42 0.17 -0.44 to2.36 1.26 3.88 0.81 0.96 22 0.676 0.30 1.06 0.22
Mild CAL
3.084 0.0054* 3.83 to 19.56 43.96 16.14 3.37 11.7 22 3.79 32.26 16.49 3.44
Moderate CAL 2.32 0.0297* -13.49 to -0.77 25.43 11.79 2.46 -7.13 22 3.07 32.57 13.16 2.74
Severe CAL 0.14 0.89 3.43 to 2.99 6.17 9.41 1.96 -0.22 22 1.55 6.39 8.25 1.72
Clinical attachment loss t P-value 95%CI Mean SD SEM Mean diff df SE of diff
Lab
ial/
Buc
cal a
spec
t (N
=77)
Stable CAL 2.25 0.028* 0.06 to 1.00 0.97 4.24 0.48 0.53 76 0.24
0.44 2.92 .33 Mild CAL
0.42 0.68 -4.70 to3.06 31.22 16.67 1.90 -0.82 76 1.95
32.04 18.33 2.09 Moderate CAL 0.583 0.562 -2.57 to4.70 29.84 13 1.48 1.06 76 1.83
28.78 15.22 1.73 Severe CAL 2.98 0.0038* 0.97 to 4.85 9.12 10.29 1.17 2.91 76 0.98
6.21 8.10 0.92
Ling
ual/P
alat
al a
spec
t (N
=77)
Stable CAL 1.60 0.113 -0.10 to0.96 0.84 2.92 0.33 0.43 76 0.27
0.42 3.21 0.37 Mild CAL
0.522 0.602 -2.77 to4.75 35.32 19.31 2.20 0.99 76 1.89
34.34 18.16 2.07
Moderate CAL 1.04 0.302 -1.74 to5.53 27.82 13.41 1.53 1.90 76 1.83
25.92 14.52 1.65
Severe CAL 2.67 0.0091* 0.62 to 4.21 7.39 9.37 1.07 2.42 76 0.903
4.97 6.70 0.76

38
4.0 DISCUSSION
Our study evaluated the impact of supportive periodontal care program in patients diagnosed
with moderate to severe chronic periodontitis. These patients had been maintained in supportive
periodontal therapy (SPT) for a period that ranged between one to six years. We have used both
tooth loss and the changes in clinical attachment loss to evaluate the patients’ responses to
periodontal treatment.
Tooth loss has been considered a true clinical end point and it has been widely used as
a clinical parameter to evaluate the efficacy of dental treatment (Hujoel, 2004). Clinical
attachment loss is also a useful clinical measure that indicates the presence of periodontitis, but
not necessarily the activity of the disease.
This research attempted to determine the gain and the progression in CAL with respect
to different length of supportive periodontal care. An attempt was also made to find if changes in
CAL differ with respect to teeth aspects that may be influenced by the accessibility for oral-self
care. Additionally, the changes in the number of sites with different degree of CAL were studied
in patients stratified by age and health condition.

39
In our study sample, sex was not found to be significantly associated with tooth loss
(P= 0.11). Sexual disparities in tooth loss could be associated with risk factors such as smoking.
It was reported that smoking increased the risk of tooth loss in men to 2.4-folds, whereas in
women the risk of tooth loss can reach up to 3.5-folds (Krall et al., 1997). It was suggested that
testosterone levels can serve as a predictor for tooth loss in men. The testosterone levels in men
who aged 30-65 years with tooth loss of >3 or >5 were significantly lower than in those without
tooth loss (Singh et al., 2011).
The results of this retrospective study revealed that a statistically significant
relationship existed between diabetes and tooth loss as well as hypertension and tooth loss. These
findings are consistent with previous studies (Kaur et al., 2009; Peres et al., 2012). It was
previously reported that African Americans were at greater risk of tooth loss (Drake et al., 1995;
Gilbert and Shelton, 2003). In our study tooth loss was not found to be associated with ethnicity.
However, Caucasians tended to lose more teeth during SPT in our sample.
Younger individuals showed statistically significant increase in the number of
missing teeth (P=0.006). Expectedly, younger patients failed to report significant changes in
number of sites with regards to the severity of CAL on both labial/buccal and lingual/palatal
aspects. These findings can be attributed to small sample size and limited number of patients in
the younger group (Table 23).

40
At baseline, older patients reported several health issues such as diabetes and
hypertension that may contribute in periodontitis progression. Many studies have investigated the
association between periodontal disease, tooth loss, and several systemic diseases, including
diabetes mellitus, cancer, and cardiovascular disease (Axelsson and Lindhe, 1981).
In older group, a significant reduction in number of sites with periodontally stable CAL
was detected on both labial/buccal and lingual/palatal aspects (P=0.031 and P=0.039,
respectively). These findings indicated the progression of periodontal disease in older patients.
Also, the number of sites with severe CAL was significantly reduced on both labial/buccal and
lingual/palatal aspects (P=0.035 and 0.051, respectively). Greater reduction in number of sites
with severe CAL is possibly a surrogate for the significant increase in tooth loss that was seen in
older patients (P=0.0001).
Based on our analysis, there was no significant difference between healthy individuals
and patients with systemic disease in terms of tooth loss (P=1). However, both groups showed a
statistically significant difference in the number of missing teeth (healthy subjects, P=0.0081 and
patients with systemic disease, P=0.0001).
Within the healthy group of patients, we found a significant reduction in the number of
sites with mild CAL on lingual/palatal aspects (P=0.0054). Moreover, a significant increase in
the number of sites with moderate CAL was detected on the lingual/palatal aspects (P=0.0297).
These findings may be affected by the greater number of healthy individuals existed in older
group (n=17).

41
In the group of patients with systemic disease, the number of sites with stable CAL on
labial/buccal was significantly reduced (P=0.028). The number of sites with severe CAL on both
labial/buccal and lingual/palatal aspects was also found to be significantly reduced (P=0.0038
and P=0.0091, respectively) these findings resulted in the effect of systemic disease on tooth loss
and periodontal disease progression.
The changes in CAL was found to be significant in the group of patients who had been
under supportive periodontal therapy for one year (CAL gain= 0.36 mm) Also, a slight
progression in CAL of 0.38 mm was found to be statistically significant in patients in their the 6th
year of supportive periodontal therapy. This change can be the result of underlying systemic
disease that can modify the rate of periodontitis progression.
The assessment of risk level for periodontal disease progression in patients is necessary
to determine the frequency of SPT visits and the extent of professional support necessary for
each patient (Brägger et al., 1992). It has been suggested that patients with advanced
periodontitis may need SPT with visits at shorter time interval (3-4 months). While for mild-to-
moderate forms of periodontitis, one annual visit may be enough to prevent further clinical
attachment loss (Lang and Lindhe, 2015).

42
In order to make a precise measurement of incidence of tooth loss, all teeth that had
been lost, including those that were extracted during the active phase of treatment, were included
in this study. We found that tooth mortality rate was higher in the group under one year SPT
compared to those who maintained SPT for six years.
With regards to teeth aspect, the mean difference in CAL at the buccal/labial side was
found to be significant at one and two years of SPT (0.44 mm CAL gain and 0.42 mm CAL gain,
respectively). The lingual/palatal aspect of teeth showed a significant gain in CAL of 0.38 mm
among the patients who had attended SPT for 5 years.
In our study we did not find and association between tooth loss and interleukin-1
polymorphisms. Similar findings were reported in previous studies (Cattabriga et al., 2001;
Huynh‐Ba et al., 2007). According to a recent review on gene polymorphisms associated with
chronic periodontitis, several studies have failed to show significant association between IL-1
and the susceptibility to chronic periodontitis (Laine et al., 2010).
Numerous genetic polymorphisms have been identified and tested as prognostic or
diagnostic markers for the susceptibility to periodontal disease progression including vitamin D
receptor, transforming growth factor-β, interleukin 6 and 10, and interferon-γ gene
polymorphisms (Tachi et al., 2003; Babel et al., 2006 ; Wu et al., 2015).

43
5.0 CONCLUSION
The purpose of this study was to compare the use of clinical attachment loss and tooth loss in
evaluating the pattern of periodontal disease progression with regards to the patients related
factors such as; age, IL-1 polymorphisms and health condition.
Our results showed that tooth loss was associated with diabetes and hypertension.
However, no significant association was noted between tooth loss and IL-1 polymorphisms.
Although the gain in CAL appeared to be clinically non-significant, supportive periodontal
therapy was found to be effective in arresting the progression of periodontal disease in high-risk
patients.
Based on our data, we can conclude that:
1. Subjects in the sample had moderate to severe periodontitis.
2. Patients with periodontitis often have concomitant diabetes or hypertension.
3. Reduction in both tooth loss and clinical attachment loss after periodontal treatment,
suggested that periodontal treatments offered to patients in the sample is satisfactory.
44
BIBLIOGRAPHY
Ah, B., Michele, K., Johnson, G. K., Kaldahl, W. B., Patil, K. D., & Kalkwart, K. L. (1994). The effect of smoking on the response to periodontal therapy. Journal of Clinical Periodontology, 21(2), 91-97.
Al-Shammari, K. F., Al-Khabbaz, A. K., Al-Ansari, J. M., Neiva, R., & Wang, H. L. (2005). Risk indicators for tooth loss due to periodontal disease. Journal of Periodontology, 76(11), 1910-1918.
Albandar, J. M., Brunelle, J. A., & Kingman, A. (1999). Destructive periodontal disease in adults 30 years of age and older in the United States, 1988-1994. Journal of periodontology, 70(1), 13-29.
American Academy of Periodontology. (2003). Diagnosis of periodontal diseases (position paper). Journal of Periodontology, 74:1237-1247.
American Diabetes Association. (2009). Diagnosis and classification of diabetes mellitus. Diabetes Care, 32(Supplement 1), S62-S67.
Armitage, G. C. (1999). Development of a classification system for periodontal diseases and conditions. Annals of Periodontology, 4(1), 1-6.
Axelsson, P., & Lindhe, J. (1981). The significance of maintenance care in the treatment of periodontal disease. Journal of Clinical Periodontology, 8(4), 281-294.
Babel, N., Cherepnev, G., Babel, D., Tropmann, A., Hammer, M., Volk, H. D., & Reinke, P. (2006). Analysis of tumor necrosis factor-α, transforming growth factor-β, interleukin-10, IL-6, and interferon-γ gene polymorphisms in patients with chronic periodontitis. Journal of Periodontology, 77(12), 1978-1983.

45
Badersten, A., Nilveus, R., & Egelberg, J. (1984). Effect of nonsurgical periodontal therapy. Journal of Clinical Periodontology, 11(1), 63-76.
Bergström, J., & Boström, L. (2001). Tobacco smoking and periodontal hemorrhagic responsiveness. Journal of Clinical Periodontology, 28(7), 680-685.
Bergström, J., Eliasson, S., & Dock, J. (2000). Exposure to tobacco smoking and periodontal health. Journal of Clinical Periodontology, 27(1), 61-68.
Brägger, U., Håkanson, D., & Lang, N. P. (1992). Progression of periodontal disease in patients with mild to moderate adult periodontitis. Journal of Clinical Periodontology, 19(9), 659-666.
Cattabriga, M., Rotundo, R., Muzzi, L., Nieri, M., Verrocchi, G., Cairo, F., & Prato, G. P. (2001). Retrospective evaluation of the influence the interleukin-1 genotype on radiographic bone levels in treated periodontal patients over 10 years. Journal of Periodontology, 72(6), 767-773.
Chambrone, L., Preshaw, P. M., Rosa, E. F., Heasman, P. A., Romito, G. A., Pannuti, C. M., & Tu, Y. K. (2013). Effects of smoking cessation on the outcomes of non‐surgical periodontal therapy: a systematic review and individual patient data meta‐analysis. Journal of Clinical Periodontology, 40(6), 607-615.
Cobb, C. M. (2002). Clinical significance of non‐surgical periodontal therapy: an evidence‐based perspective of scaling and root planing. Journal of Clinical Periodontology, 29(s2), 22-32.
Costa, F. O., Lages, E. J. P., Cota, L. O. M., Lorentz, T. C. M., Soares, R. V., & Cortelli, J. R. (2014). Tooth loss in individuals under periodontal maintenance therapy: 5‐year prospective study. Journal of Periodontal Research, 49(1), 121 128.
Diehl, S. R., Kuo, F., & Hart, T. C. (2015). Interleukin 1 genetic tests provide no support for reduction of preventive dental care. The Journal of the American Dental Association, 146(3), 164-173.
Dinarello, C. A. (1996). Biologic basis for interleukin-1 in disease. Blood, 87(6), 2095-2147.
46
Drake, C. W., Hunt, R. J., & Koch, G. G. (1995). Three-year tooth loss among black and white older adults in North Carolina. Journal of Dental Research, 74(2), 675-680.
Eke, P. I., Dye, B. A., Wei, L., Slade, G. D., Thornton-Evans, G. O., Borgnakke, W. S., & Genco, R. J. (2015). Update on Prevalence of Periodontitis in Adults in the United States: NHANES 2009 to 2012. Journal of Periodontology, 86(5), 611-622.
Gilbert, G. H., & Shelton, B. J. (2003). Social determinants of tooth loss. Health Services Research, 38(6p2), 1843-1862.
Haffajee, A. D., & Socransky, S. S. (1994). Microbial etiological agents of destructive periodontal diseases. Periodontology 2000, 5(1), 78-111.
Hujoel, P. P. (2004) Endpoints in periodontal trials: the need for an evidence-based research approach. Periodontology 2000 36, 196–204.
Huynh‐Ba, G., Lang, N. P., Tonetti, M. S., & Salvi, G. E. (2007). The association of the composite IL‐1 genotype with periodontitis progression and/or treatment outcomes: a systematic review. Journal of Clinical Periodontology, 34(4), 305-317.
Ioannou, I., Dimitriadis, N., Papadimitriou, K., Sakellari, D., Vouros, I., & Konstantinidis, A. (2009). Hand instrumentation versus ultrasonic debridement in the treatment of chronic periodontitis: a randomized clinical and microbiological trial. Journal of Clinical Periodontology, 36(2), 132-141.
Kapp, J. M., Boren, S. A., Yun, S., & LeMaster, J. (2007). Diabetes and tooth loss in a national sample of dentate adults reporting annual dental visits. Preventing Chronic Disease, 4(3), A59.
Kaur, G., Holtfreter, B., Rathmann, W. G., Schwahn, C., Wallaschofski, H., Schipf, S., & Kocher, T. (2009). Association between type 1 and type 2 diabetes with periodontal disease and tooth loss. Journal of Clinical Periodontology, 36(9), 765-774. Kearney, P. M., Whelton, M., Reynolds, K., Muntner, P., Whelton, P. K., & He, J. (2005). Global burden of hypertension: analysis of worldwide data. The Lancet, 365(9455), 217-223.

47
König, J., Plagmann, H. C., Rühling, A., & Kocher, T. (2002). Tooth loss and pocket probing depths in compliant periodontally treated patients: a retrospective analysis. Journal of Clinical Periodontology, 29(12), 1092-1100.
Kornman, Kenneth S., Allison Crane, Hwa‐Ying Wang, Francesco S. di Giovlne, Michael G. Newman, Frederick W. Pirk, Thomas G. Wilson, Frank L. Higginbottom, and Gordon W. Duff. (1997). The interleukin‐1 genotype as a severity factor in adult periodontal disease. Journal of Clinical Periodontology, 24(1), 72-77.
Krall, E. A., Dawson-Hughes, B., Garvey, A. J., & Garcia, R. I. (1997). Smoking, smoking cessation, and tooth loss. Journal of dental Research, 76(10), 1653-1659
Laine, M. L., Loos, B. G., & Crielaard, W. (2010). Gene polymorphisms in chronic periodontitis. International Journal of Dentistry, 2010.
Lalla, E., & Papapanou, P. N. (2011). Diabetes mellitus and periodontitis: a tale of two common interrelated diseases. Nature Reviews Endocrinology, 7(12), 738-748.
Lang, N. P., & Lindhe, J. (Eds.). (2015). Clinical Periodontology and Implant Dentistry, 2 Volume Set. John Wiley & Sons.
Lindhe, J., & Nyman, S. (1975). The effect of plaque control and surgical pocket elimination on the establishment and maintenance of periodontal health. A longitudinal study of periodontal therapy in cases of advanced disease. Journal of Clinical Periodontology, 2(2), 67-79.
Lindhe, J., Westfelt, E., Nyman, S., Socransky, S. S., & Haffajee, A. D. (1984). Long‐term effect of surgical/non‐surgical treatment of periodontal disease. Journal of Clinical Periodontology, 11(7), 448-458.
Löe, H. (1993). Periodontal disease: the sixth complication of diabetes mellitus. Diabetes Care, 16(1), 329-334. McDevitt, Michael J., Hwa-Ying Wang, Carol Knobelman, Michael G. Newman, Francesco S. di Giovine, Janice Timms, Gordon W. Duff, and Kenneth S. Kornman. (2000). Interleukin-1 genetic association with periodontitis in clinical practice. Journal of Periodontology, 71(2), 156-163.

48
Mealey, B. L., & Oates, T. W. (2006). Diabetes mellitus and periodontal diseases. Journal of Periodontology, 77(8), 1289-1303.
Michalowicz, B. S. (1994). Genetic and Heritable Risk Factors in Periodontal Disease*. Journal of Periodontology, 65(5s), 479-488.
Michalowicz, B. S., Diehl, S. R., Gunsolley, J. C., Sparks, B. S., Brooks, C. N., Koertge, T. E., & Schenkein, H. A. (2000). Evidence of a substantial genetic basis for risk of adult periodontitis. Journal of Periodontology, 71(11), 1699-1707.
Michalowicz, Bryan S., Dorothee Aeppli, John G. Virag, David G. Klump, E. Hinrichs, Nancy L. Segal, Thomas J. Bouchard Jr, and Bruce L. Pihlstrom. (1991). Periodontal findings in adult twins. Journal of Periodontology, 62(5), 293-299.
Page, R. C., & Eke, P. I. (2007). Case definitions for use in population-based surveillance of periodontitis. Journal of Periodontology, 78(7S), 1387-1399.
Page, R. C., Offenbacher, S., Schroeder, H. E., Seymour, G. J., & Kornman, K. S. (1997). Advances in the pathogenesis of periodontitis: summary of developments, clinical implications and future directions. Periodontology 2000, 14(1), 216-248.
Papapanou, P. N., Neiderud, A. M., Sandros, J., & Dahlén, G. (2001). Interleukin‐1 gene polymorphism and periodontal status. Journal of Clinical Periodontology, 28(5), 389-396.
Paunio, K., Impivaara, O., Tiekso, J., & Mäki, J. (1993). Missing teeth and ischaemic heart disease in men aged 45-64 years. European Heart Journal, 14, 54-56.
Peres, M. A., Tsakos, G., Barbato, P. R., Silva, D. A., & Peres, K. G. (2012). Tooth loss is associated with increased blood pressure in adults–a multidisciplinary population‐based study. Journal of Clinical Periodontology, 39(9), 824-833.
Preber, H., & Bergström, J. (1985). Occurrence of gingival bleeding in smoker and non-smoker patients. Acta Odontologica Scandinavica, 43(5), 315-320.
Purcell, S., Neale, B., Todd-Brown, K., Thomas, L., Ferreira, M.A., Bender, D., Maller, J., Sklar, P., De Bakker, P.I., Daly, M.J. and Sham, P.C (2007). PLINK: a tool set for whole-

49
genome association and population-based linkage analyses. The American Journal of Human Genetics, 81(3), 559-575.
R Core Team (2013). R: A language and environment for statistical. Computing. R Foundation for Statistical Computing, Vienna, Austria. URL http://www.R-project.org/.
Ranade, K., Chang, M. S., Ting, C. T., Pei, D., Hsiao, C. F., Olivier, M., & Curb, D. (2001). High-throughput genotyping with single nucleotide polymorphisms. Genome Research, 11(7), 1262-1268.
Ravald, N., & Johansson, C. S. (2012). Tooth loss in periodontally treated patients. A long-term study of periodontal disease and root caries. Journal of Clinical Periodontology, 39(1), 73-79.
Renvert, S., & Persson, G. R. (2004). Supportive periodontal therapy. Periodontology 2000, 36(1), 179-195.
Rogers, M. A., Figliomeni, L., Baluchova, K., Tan, A. E., Davies, G., Henry, P. J., & Price, P. (2002). Do interleukin‐1 polymorphisms predict the development of periodontitis or the success of dental implants?. Journal of Periodontal Research, 37(1), 37-41.
Rosling, B., Serino, G., Hellström, M. K., Socransky, S. S., & Lindhe, J. (2001). Longitudinal periodontal tissue alterations during supportive therapy. Journal of Clinical Periodontology, 28(3), 241-249.
Sakellari, D., Koukoudetsos, S., Arsenakis, M., & Konstantinidis, A. (2003). Prevalence of IL‐1A and IL‐1B polymorphisms in a Greek population. Journal of Clinical Periodontology, 30(1), 35-41.
Schwarz, F., Aoki, A., Becker, J., & Sculean, A. (2008). Laser application in non‐surgical periodontal therapy: a systematic review. Journal of Clinical Periodontology, 35(s8), 29-44.
Sculean, A., Schwarz, F., Berakdar, M., Romanos, G. E., Arweiler, N. B., & Becker, J. (2004). Periodontal Treatment With an Er: YAG Laser Compared to Ultrasonic Instrumentation: A Pilot Study. Journal of Periodontology, 75(7), 966-973.

50
Seymour, G. J. (1991). Importance of the host response in the periodontium. Journal of Clinical Periodontology, 18(6), 421-426.
Sgolastra, F., Petrucci, A., Gatto, R., & Monaco, A. (2012). Efficacy of Er: YAG laser in the treatment of chronic periodontitis: systematic review and meta-analysis. Lasers in Medical Science, 27(3), 661-673.
Singh, B. P., Makker, A., Tripathi, A., Singh, M. M., & Gupta, V. (2011). Association of testosterone and bone mineral density with tooth loss in men with chronic periodontitis. Journal of Oral Science, 53(3), 333-339.
Socransky, S. S., & Haffajee, A. D. (1992). The bacterial etiology of destructive periodontal disease: current concepts*. Journal of Periodontology, 63(4s), 322-331.
Tachi, Y., Shimpuku, H., Nosaka, Y., Kawamura, T., Shinohara, M., Ueda, M., ... & Ohura, K. (2003). Vitamin D receptor gene polymorphism is associated with chronic periodontitis. Life Sciences, 73(26), 3313-3321.
Taguchi, A., Sanada, M., Suei, Y., Ohtsuka, M., Lee, K., Tanimoto, K.,& Higashi, Y. (2004). Tooth loss is associated with an increased risk of hypertension in postmenopausal women. Hypertension, 43(6), 1297-1300.
Tunkel, J., Heinecke, A., & Flemmig, T. F. (2002). A systematic review of efficacy of machine-driven and manual subgingival debridement in the treatment of chronic periodontitis. Journal of Clinical Periodontology, 29(s3), 72-81.
Völzke, Henry, Christian Schwahn, Marcus Dörr, Sabine Schwarz, Daniel Robinson, Martina Dören, Rainer Rettig, Stephan B. Felix, Ulrich John, and Thomas Kocher. (2006). Gender differences in the relation between number of teeth and systolic blood pressure. Journal of Hypertension, 24(7), 1257-1263.
Walmsley, A. D., Lea, S. C., Landini, G., & Moses, A. J. (2008). Advances in power driven pocket/root instrumentation. Journal of Clinical Periodontology, 35(s8), 22-28.

51
Williams, R. C. (1990). Periodontal disease. New England Journal of Medicine, 322(6), 373-382.
Wu, X., Offenbacher, S., Lόpez, N. J., Chen, D., Wang, H. Y., Rogus, J., ... & Wilkins, L. (2015). Association of interleukin‐1 gene variations with moderate to severe chronic periodontitis in multiple ethnicities. Journal of Periodontal Research, 50(1), 52-61.