The Implementation and Effectiveness of Supplemental Educational Services

NCEE 2009-4032 U.S. DEPARTMENT OF EDUCATION
Effectiveness of Selected Supplemental Reading Comprehension Interventions: Impacts on a First Cohort of Fifth-Grade Students

May 2009 Susanne James-Burdumy Wendy Mansfield John Deke Nancy Carey Julieta Lugo-Gil Alan Hershey Aaron Douglas Mathematica Policy Research, Inc. Russell Gersten Rebecca Newman-Gonchar Joseph Dimino RG Research Group Bonnie Faddis RMC Research Corporation Audrey Pendleton Project Officer Institute of Education Sciences
NCEE 2009-4032 U.S. DEPARTMENT OF EDUCATION
Effectiveness of Selected Supplemental Reading Comprehension Interventions: Impacts on a First Cohort of Fifth-Grade Students

U.S. Department of Education Arne Duncan Secretary
Institute of Education Sciences Sue Betka Acting Director
National Center for Education Evaluation and Regional Assistance Phoebe Cottingham Commissioner
May 2009
The report was prepared for the Institute of Education Sciences under Contract No. ED-01-C0039/0010. The project officer is Audrey Pendleton in the National Center for Education Evaluation and Regional Assistance.
IES evaluation reports present objective information on the conditions of implementation and impacts of the programs being evaluated. IES evaluation reports do not include conclusions or recommendations or views with regard to actions policymakers or practitioners should take in light of the findings in the reports.
This report is in the public domain. Authorization to reproduce it in whole or in part is granted. While permission to reprint this publication is not necessary, the citation should be: James-Burdumy, S., Mansfield, W., Deke, J., Carey, N., Lugo-Gil, J., Hershey, A., Douglas, A., Gersten, R., Newman-Gonchar, R., Dimino, J., and Faddis, B. (2009). Effectiveness of Selected Supplemental Reading Comprehension Interventions: Impacts on a First Cohort of Fifth-Grade Students (NCEE 2009-4032). Washington, DC: National Center for Education Evaluation and Regional Assistance, Institute of Education Sciences, U.S. Department of Education.
To order copies of this report,
• Write to ED Pubs, Education Publications Center, U.S. Department of Education, P.O. Box 1398, Jessup, MD
20794-1398. • Call in your request toll free to 1-877-4ED-Pubs. If 877 service is not yet available in your area, call 800-872-
5327 (800-USA-LEARN). Those who use a telecommunications device for the deaf (TDD) or a teletypewriter (TTY) should call 800-437-0833.
• Fax your request to 301-470-1244. • Order online at www.edpubs.org.
This report also is available on the IES website at http://ies.ed.gov/ncee.
Upon request, this report is available in alternate formats such as Braille, large print, audiotape, or computer diskette. For more information, please contact the Department’s Alternate Format Center at 202-260-9895 or 202-205-8113.

iii
ACKNOWLEDGEMENTS
Many individuals, organizations, and agencies contributed to the Reading Comprehension Evaluation. The members of the evaluation’s Technical Work Group—Donna Alvermann, Isabel Beck, Mark Berends, Thomas Cook, David Francis, Larry Hedges, Timothy Shanahan, Joseph Torgesen, and Joanna Williams—imparted valuable input at critical junctures.
At Mathematica Policy Research, Inc., important contributions were made by Annette
Luyegu, Valerie Williams, Melissa Dugger, Irene Crawley, Sue Golden, and Season Bedell-Boyle, who helped manage the data collection activities; Arabinda Hazarika, Mark Beardsley, and Neil DeLeon, who developed and maintained the data collection databases; Ravaris Moore, Carol Razafindrakoto, and Maricar Mabutas, who programmed the impact models; Sally Atkins-Burnett, who gave crucial psychometric assistance; Sonya Vartivarian and Amang Sukasih, who provided statistics support; and Cindy George and Jill Miller, who were instrumental in editing and producing the report. We acknowledge the unstinting support and astute advice of David Myers and Jerry West, former study directors.
At RMC Research, we thank Steve Murray for his leadership in managing the competition to
select the reading interventions and facilitating the study's pilot year, Wendy Graham for overseeing the team of RMC observers, and Margaret Beam for serving as a liaison to developers during the pilot and implementation years and for reviewing program training, classroom instruction, and materials. We are grateful to Lauren Liang at the University of Utah, who had a major role in developing the fidelity and observation measures and contributing to the development of the ETS assessments. At the University of Texas, we benefited from Sharon Vaughn’s help in recruiting schools and addressing reading issues throughout the study, and Meaghan Edmond’s assistance in creating the observation forms and in conducting the observation training. We thank Greg Roberts of Evaluation Research Services and Mary Jo Taylor at RG Research Group for their support in recruiting schools.
We appreciate the willingness of reading developers to engage in a large-scale, rigorous
evaluation and to contribute their perspectives and insights during interviews. We could not have conducted this study without the districts, schools, and teachers who agreed to participate in the study, use the reading curricula, permit observation of their classroom instruction, and share their views.


v
DISCLOSURE OF POTENTIAL CONFLICTS OF INTEREST
The research team for this evaluation consists of a prime contractor, Mathematica Policy Research, and two major subcontractors: RG Research Group and RMC Research Corporation. None of these organizations or their key staff members have financial interests that could be affected by findings from the study. None of the members of the Technical Working Group, convened by the research team to provide advice and guidance, have financial interests that could be affected by findings from the study.


vii
CONTENTS
Chapter Page
EXECUTIVE SUMMARY ......................................................................................... xix I INTRODUCTION ...........................................................................................................1
A. PAST READING RESEARCH HAS FUELED USEFUL RECOMMENDATIONS, BUT LEFT QUESTIONS UNANSWERED ................2 B. STUDY DESIGN: FOCUS ON RIGOR AND UNDERSTANDING INTERVENTIONS ..................................................................................................5 C. FOUR INTERVENTIONS SELECTED THROUGH A COMPETITIVE PROCESS ..............................................................................................................7 D. STUDY DISTRICTS AND SCHOOLS SERVE DISADVANTAGED STUDENTS ...........................................................................................................10
1. The Focus on Low-Income Schools Was Reflected in the Search for Eligible Districts and the Ultimate Sample ....................................................10 2. The Sample Design Ensured an 80 Percent Probability of Detecting Impacts of at Least 0.17 Standard Deviations ...............................................14
E. DATA COLLECTION ON TEACHERS, SCHOOLS, AND STUDENTS..........15
1. Information on Teaching and Intervention Implementation ..........................15 2. Data to Describe Teachers, Schools, and Students ........................................19 3. Data Used to Measure Student Outcomes .....................................................22 4. Year 2 Data Collection ...................................................................................22
II IMPLEMENTATION FINDINGS ................................................................................23
A. INTERVENTION FEATURES .............................................................................24 B. TEACHER TRAINING AND SUPPORT ............................................................29 C. OBSERVED FIDELITY OF IMPLEMENTATION.............................................34 D. READING COMPREHENSION INSTRUCTIONAL PRACTICES ...................44

viii
Chapter Page
III IMPACT FINDINGS ....................................................................................................55 A. TREATMENT AND CONTROL GROUPS WERE SIMILAR AT BASELINE ............................................................................................................56 B. NO STATISTICALLY SIGNIFICANT POSITIVE IMPACTS ON STUDENT TEST SCORES ...................................................................................57 C. ONE OF 24 DIFFERENCES IN TREATMENT GROUP IMPACTS IS STATISTICALLY SIGNIFICANT .......................................................................65 D. FIFTEEN OF 1,080 SUBGROUP IMPACTS ARE STATISTICALLY SIGNIFICANT ......................................................................................................71 E. COEFFICIENTS ON 3 OF 120 INTERACTIONS BETWEEN TREATMENT STATUS AND TEACHER PRACTICES ARE STATISTICALLY SIGNIFICANT .....................................................................111
IV SUMMARY ................................................................................................................119
REFERENCES ............................................................................................................121 APPENDIX A: RANDOM ASSIGNMENT APPENDIX B: FLOW OF SCHOOLS AND STUDENTS THROUGH THE STUDY APPENDIX C: OBTAINING PARENT CONSENT APPENDIX D: IMPLEMENTATION TIMELINE APPENDIX E: SAMPLE SIZES AND RESPONSE RATES APPENDIX F: CREATION AND RELIABILITY OF CLASSROOM OBSERVATION AND TEACHER SURVEY MEASURES APPENDIX G: ESTIMATING IMPACTS APPENDIX H: ASSESSING ROBUSTNESS OF THE IMPACTS APPENDIX I: KEY DESCRIPTIVE STATISTICS FOR CLASSROOM
OBSERVATION AND FIDELITY DATA APPENDIX J: STUDY INSTRUMENTS APPENDIX K: UNADJUSTED MEANS

ix
TABLES
Table Page I.1 CRITERIA FOR SELECTING PROGRAMS FOR THE PILOT STUDY .....................8 I.2 CRITERIA FOR SELECTING PROGRAMS FOR THE FULL STUDY .......................9 I.3 NUMBER OF DISTRICTS, SCHOOLS, TEACHERS, AND STUDENTS IN STUDY SAMPLE .....................................................................................................11 I.4 CHARACTERISTICS OF DISTRICTS IN THE STUDY ............................................12 I.5 CHARACTERISTICS OF SCHOOLS IN THE STUDY ..............................................13 I.6 SCHEDULE OF YEAR ONE DATA COLLECTION ACTIVITIES ...........................16 I.7 FEATURES OF TESTS USED IN THE STUDY ..........................................................21 II.1 SUMMARY OF READING COMPREHENSION PROGRAMS .................................25 II.2 PROGRAM COSTS .......................................................................................................28 II.3 ESTIMATED PROGRAM COSTS FOR TYPICAL SMALL, MEDIUM, AND LARGE DISTRICTS ............................................................................................30 II.4 SUMMARY OF TEACHER TRAINING ......................................................................31 II.5 TEACHER TRAINING PARTICIPATION AND PREPARATION ............................32 II.6 DIFFERENCES IN TRAINING PARTICIPATION AND PREPARATION BETWEEN TREATMENT TEACHERS.......................................................................33 II.7 PARTICIPATION OF TREATMENT AND CONTROL TEACHERS IN READING INSTRUCTION PROFESSIONAL DEVELOPMENT ..............................35 II.8 DIFFERENCES IN PARTICIPATION IN READING INSTRUCTION PROFESSIONAL DEVELOPMENT ACROSS TREATMENT GROUPS ..................36 II.9 FIDELITY OF IMPLEMENTATION FOR THE PROJECT CRISS CURRICULUM ..............................................................................................................38 II.10 FIDELITY OF IMPLEMENTATION FOR THE READ FOR REAL CURRICULUM ..............................................................................................................39

x
Table Page II.11 FIDELITY OF IMPLEMENTATION FOR THE READABOUT CURRICULUM .....41 II.12 FIDELITY OF IMPLEMENTATION FOR THE READING FOR KNOWLEDGE CURRICULUM, DIRECT INSTRUCTION OBSERVATION DAYS ................................................................................................42 II.13 FIDELITY OF IMPLEMENTATION FOR THE READING FOR KNOWLEDGE CURRICULUM, COOPERATIVE GROUPS OBSERVATION DAYS ................................................................................................43 II.14 ERC ITEMS CONTAINED IN STUDY SCALES ........................................................46 II.15 DIFFERENCES IN SPRING CLASSROOM PRACTICES BETWEEN TREATMENT AND CONTROL GROUP TEACHERS ..............................................48 II.16 DIFFERENCES IN SPRING CLASSROOM PRACTICES ACROSS TREATMENT GROUP TEACHERS ............................................................................50 II.17 DIFFERENCES IN SPRING CLASSROOM PRACTICES BETWEEN TREATMENT AND CONTROL GROUP TEACHERS FOR ITEMS CONTAINED IN THE TRADITIONAL INTERACTION SCALE ..............................52 III.1 READING CURRICULA IN USE JUST PRIOR TO 2006-2007 SCHOOL YEAR ..............................................................................................................................58 III.2 BASELINE SCHOOL CHARACTERISTICS, BY TREATMENT AND CONTROL STATUS......................................................................................................60 III.3 BASELINE TEACHER CHARACTERISTICS, BY TREATMENT AND CONTROL STATUS......................................................................................................61 III.4 BASELINE STUDENT CHARACTERISTICS, BY TREATMENT AND CONTROL STATUS......................................................................................................62 III.5 DIFFERENCES IN SPRING TEST SCORES BETWEEN TREATMENT AND CONTROL GROUPS ...........................................................................................63 III.6 DIFFERENCES IN READING CURRICULA IN USE JUST PRIOR TO 2006-2007 SCHOOL YEAR ..........................................................................................66 III.7 DIFFERENCES IN BASELINE CHARACTERISTICS BETWEEN TREATMENT SCHOOLS .............................................................................................68 III.8 DIFFERENCES IN BASELINE CHARACTERISTICS BETWEEN TREATMENT TEACHERS ...........................................................................................69

xi
Table Page III.9 DIFFERENCES IN BASELINE CHARACTERISTICS BETWEEN TREATMENT STUDENTS ...........................................................................................70 III.10 DIFFERENCES IN SPRING TEST SCORES BETWEEN TREATMENT GROUPS .........................................................................................................................72 III.11 DIFFERENCES IN SPRING TEST SCORES BETWEEN EACH INTERVENTION GROUP AND THE CONTROL GROUP, COMPARING STUDENTS WITH BASELINE FLUENCY LEVELS ABOVE AND BELOW THE NATIONAL NORM SAMPLE AVERAGE..................74 III.12 DIFFERENCES IN SPRING TEST SCORES BETWEEN EACH INTERVENTION GROUP AND THE CONTROL GROUP, COMPARING STUDENTS WITH BASELINE FLUENCY LEVELS ABOVE AND BELOW THE SAMPLE MEDIAN .......................................................76 III.13 DIFFERENCES IN SPRING TEST SCORES BETWEEN EACH INTERVENTION GROUP AND THE CONTROL GROUP, COMPARING STUDENTS IN THE TOP AND BOTTOM THIRDS OF THE BASELINE FLUENCY DISTRIBUTION ......................................................78 III.14 DIFFERENCES IN SPRING TEST SCORES BETWEEN EACH INTERVENTION GROUP AND THE CONTROL GROUP, COMPARING STUDENTS IN THE MIDDLE AND BOTTOM THIRDS OF THE BASELINE FLUENCY DISTRIBUTION ......................................................80 III.15 DIFFERENCES IN SPRING TEST SCORES BETWEEN EACH INTERVENTION GROUP AND THE CONTROL GROUP, COMPARING STUDENTS IN THE MIDDLE AND TOP THIRDS OF THE BASELINE FLUENCY DISTRIBUTION ......................................................82 III.16 DIFFERENCES IN SPRING TEST SCORES BETWEEN EACH INTERVENTION GROUP AND THE CONTROL GROUP, COMPARING STUDENTS WITH BASELINE COMPREHENSION LEVELS ABOVE AND BELOW THE NATIONAL NORM SAMPLE AVERAGE .....................................................................................................................84 III.17 DIFFERENCES IN SPRING TEST SCORES BETWEEN EACH INTERVENTION GROUP AND THE CONTROL GROUP, COMPARING STUDENTS WITH BASELINE COMPREHENSION LEVELS ABOVE AND BELOW THE SAMPLE MEDIAN .......................................86

xii
Table Page III.18 DIFFERENCES IN SPRING TEST SCORES BETWEEN EACH INTERVENTION GROUP AND THE CONTROL GROUP, COMPARING STUDENTS IN THE TOP AND BOTTOM THIRDS OF THE BASELINE COMPREHENSION DISTRIBUTION ......................................88 III.19 DIFFERENCES IN SPRING TEST SCORES BETWEEN EACH INTERVENTION GROUP AND THE CONTROL GROUP, COMPARING STUDENTS IN THE MIDDLE AND BOTTOM THIRDS OF THE BASELINE COMPREHENSION DISTRIBUTION ......................................90 III.20 DIFFERENCES IN SPRING TEST SCORES BETWEEN EACH INTERVENTION GROUP AND THE CONTROL GROUP, COMPARING STUDENTS IN THE MIDDLE AND TOP THIRDS OF THE BASELINE COMPREHENSION DISTRIBUTION ......................................92 III.21 DIFFERENCES IN SPRING TEST SCORES BETWEEN EACH INTERVENTION GROUP AND THE CONTROL GROUP, BY ENGLISH LANGUAGE LEARNER STATUS .............................................................94 III.22 DIFFERENCES IN SPRING TEST SCORES BETWEEN EACH INTERVENTION GROUP AND THE CONTROL GROUP, COMPARING STUDENTS WITH TEACHERS ABOVE AND BELOW THE MEDIAN TEACHER EXPERIENCE IN THE STUDY SAMPLE .......96 III.23 DIFFERENCES IN SPRING TEST SCORES BETWEEN EACH INTERVENTION GROUP AND THE CONTROL GROUP, COMPARING STUDENTS WITH TEACHERS WITH LESS THAN OR MORE THAN 5 YEARS TEACHING EXPERIENCE ..........................................98 III.24 DIFFERENCES IN SPRING TEST SCORES BETWEEN EACH INTERVENTION GROUP AND THE CONTROL GROUP, BY TEACHER PAST PROFESSIONAL DEVELOPMENT ............................................100 III.25 DIFFERENCES IN SPRING TEST SCORES BETWEEN EACH INTERVENTION GROUP AND THE CONTROL GROUP, BY TEACHER EFFICACY ................................................................................................102 III.26 DIFFERENCES IN SPRING TEST SCORES BETWEEN EACH INTERVENTION GROUP AND THE CONTROL GROUP, BY PROFESSIONAL CULTURE IN SCHOOL ...............................................................104 III.27 DIFFERENCES IN SPRING TEST SCORES BETWEEN EACH INTERVENTION GROUP AND THE CONTROL GROUP, BY PERCENTAGE OF STUDENTS IN THE SCHOOL ELIGIBLE FOR FREE OR REDUCED-PRICE LUNCH .......................................................................106

xiii
Table Page III.28 DIFFERENCES IN SPRING TEST SCORES BETWEEN EACH INTERVENTION GROUP AND THE CONTROL GROUP, BY PERCENTAGE OF STUDENTS IN THE SCHOOL CLASSIFIED AS ENGLISH LANGUAGE LEARNERS.........................................................................108 III.29 DIFFERENCES IN SPRING TEST SCORES BETWEEN EACH INTERVENTION GROUP AND THE CONTROL GROUP, BY TRADITIONAL INTERACTION SCALE SCORE ....................................................113 III.30 DIFFERENCES IN SPRING TEST SCORES BETWEEN EACH INTERVENTION GROUP AND THE CONTROL GROUP, BY READING STRATEGY GUIDANCE SCALE SCORE .............................................115 III.31 DIFFERENCES IN SPRING TEST SCORES BETWEEN EACH INTERVENTION GROUP AND THE CONTROL GROUP, BY CLASSROOM MANAGEMENT SCALE SCORE .....................................................117 B.1 FLOW OF SCHOOLS THROUGH STUDY ............................................................... B.3 B.2 FLOW OF STUDENTS THROUGH STUDY ............................................................. B.4 C.1 CONSENT RATES, BY TYPE OF CONSENT .......................................................... C.4 C.2 CONSENT RATES, BY INTERVENTION ................................................................ C.4 D.1 IMPLEMENTATION SCHEDULE FOR INTERVENTIONS: NUMBER OF SCHOOL DAYS FROM START OF SCHOOL, BY DISTRICT ....... D.3 E.1 TEACHER SURVEY SAMPLE AND RESPONSE RATES ...................................... E.4 E.2 STUDENT SAMPLE.................................................................................................... E.4 E.3A STUDENT TEST SAMPLE AND RESPONSE RATES, FALL 2006. ....................... E.5 E.3B STUDENT TEST SAMPLE AND RESPONSE RATES, SPRING 2007 ................... E.6 E.4 CLASSROOM OBSERVATION SAMPLE AND RESPONSE RATES .................... E.7 E.5 FIDELITY OBSERVATION SAMPLE AND RESPONSE RATES .......................... E.7 F.1 PERCENT AGREEMENT RELIABILITY FOR ACTIVE INTERVALS, BY ITEM ...................................................................................................................... F.4

xiv
Table Page F.2 ITEM RESPONSE MODEL DIFFICULTY PARAMETERS, STANDARD ERRORS, OUTFIT AND INFIT STATISTICS, AND CORRECTED ITEM-TOTAL CORRELATIONS FOR ITEMS OF EACH SCALE .............................................................................................................. F.9 F.3 DESCRIPTIVE STATISTICS OF SCALE SCORES ................................................ F.11 F.4 RELIABILITY OF THE TEACHER EFFICACY OVERALL SCALE AND SUBSCALES .................................................................................................... F.16 F.5 DESCRIPTIVE STATISTICS AND PERSON SEPARATION RELIABILITIES FOR THE OVERALL SCHOOL CULTURE SCALE AND SUBSCALES .................................................................................................... F.18 F.6 PSYCHOMETRIC STATISTICS FOR SCHOOL CULTURE SUBSCALES. ........ F.19 G.1 PROPORTION OF SAMPLE MISSING EACH COVARIATE, BY OUTCOME ............................................................................................................ G.7 G.2 PROPORTION OF STUDENTS WITH FOLLOW-UP TEST SCORES, BY EXPERIMENTAL CONDITION .......................................................................... G.8 G.3 AVERAGE BASELINE CHARACTERISTICS OF STUDENTS WITH FOLLOW-UP GRADE SCORES, BY EXPERIMENTAL CONDITION .................. G.9 G.4 AVERAGE BASELINE CHARACTERISTICS OF STUDENTS WITH FOLLOW-UP SOCIAL STUDIES READING COMPREHENSION SCORES, BY EXPERIMENTAL CONDITION ....................................................... G.11 G.5 AVERAGE BASELINE CHARACTERISTICS OF STUDENTS WITH FOLLOW-UP SCIENCE READING COMPREHENSION SCORES, BY EXPERIMENTAL CONDITION ........................................................................ G.13 G.6 BASELINE CHARACTERISTICS OF STUDENTS WITH AND WITHOUT FOLLOW-UP TEST SCORES ............................................................... G.15 H.1 SENSITIVITY OF IMPACT ESTIMATES TO ALTERNATIVE SPECIFICATIONS ....................................................................................................... H.4 H.2 COMPARISON OF BENCHMARK AND HLM MODELS. ..................................... H.6 H.3 DIFFERENCES IN SPRING TEST SCORES BETWEEN TREATMENT AND CONTROL GROUPS, FOR STUDENTS WITH BASELINE AND FOLLOW-UP SCORES ............................................................................................. H.10

xv
Table Page H.4 DIFFERENCES IN SPRING TEST SCORES BETWEEN TREATMENT AND CONTROL GROUPS, INTERACTING TREATMENT STATUS WITH STUDENT BASELINE FLUENCY ............................................................... H.12 H.5 DIFFERENCES IN SPRING TEST SCORES BETWEEN TREATMENT AND CONTROL GROUPS, INTERACTING TREATMENT STATUS WITH STUDENT BASELINE COMPREHENSION. ............................................... H.14 H.6 DIFFERENCE IN SPRING CLASSROOM PRACTICES BETWEEN TREATMENT AND CONTROL GROUP TEACHERS, FOR SCALES BASED ON SUMS OF TALLIES ACROSS OBSERVATION INTERVALS ........ H.18 H.7 DIFFERENCES IN SPRING CLASSROOM PRACTICES BETWEEN TREATMENT AND CONTROL GROUP TEACHERS, FOR TEACHING COMPREHENSION AND TEACHING VOCABULARY SCALES. ..................................................................................................................... H.19 I.1 DESCRIPTIVE STATISTICS FOR EXPOSITORY READING COMPREHENSION CLASSROOM OBSERVATION INSTRUMENT ITEMS, BASED ON THE AVERAGE NUMBER OF TIMES EACH PRACTICE WAS OBSERVED DURING THE 10-MINUTE OBSERVATION INTERVALS .................................................................................... I.3 I.2 DESCRIPTIVE STATISTICS FOR PROJECT CRISS FIDELITY OBSERVATION ITEMS .............................................................................................. I.5 I.3 DESCRIPTIVE STATISTICS FOR READ FOR REAL FIDELITY OBSERVATION ITEMS .............................................................................................. I.6 I.4 DESCRIPTIVE STATISTICS FOR READABOUT FIDELITY OBSERVATION ITEMS .............................................................................................. I.8 I.5 DESCRIPTIVE STATISTICS FOR FIDELITY OBSERVATION ITEMS FOR READING FOR KNOWLEDGE DIRECT INSTRUCTION OBSERVATION DAYS ............................................................................................... I.9 I.6 DESCRIPTIVE STATISTICS FOR FIDELITY OBSERVATION ITEMS FOR READING FOR KNOWLEDGE COOPERATIVE GROUPS OBSERVATION DAYS ............................................................................................. I.10


xvii
FIGURES
Figure Page 1 EFFECTS OF READING COMPREHENSION CURRICULA ON GRADE SCORE ..........................................................................................................................xxx 2 EFFECTS OF READING COMPREHENSION CURRICULA ON SOCIAL STUDIES READING COMPREHENSION ASSESSMENT SCORE ........................xxx 3 EFFECTS OF READING COMPREHENSION CURRICULA ON SCIENCE READING COMPREHENSION ASSESSMENT SCORE ..................... xxxi 4 EFFECTS OF READING COMPREHENSION CURRICULA ON COMPOSITE TEST SCORES ................................................................................... xxxi FI.A LINK BETWEEN AVERAGE NUMBER OF TIMES BEHAVIORS WERE OBSERVED AND TRADITIONAL INTERACTION SCALE SCORES ................ F.12 FI.B LINK BETWEEN AVERAGE NUMBER OF TIMES BEHAVIORS WERE OBSERVED AND TRADITIONAL INTERACTION SCALE SCORES ................ F.13 F.2 LINK BETWEEN AVERAGE NUMBER OF TIMES BEHAVIORS WERE OBSERVED AND READING STRATEGY SCALE SCORES ............................... F.14 F.3 LINK BETWEEN AVERAGE LIKERT-SCALE ITEM RATINGS AND SCALE SCORES FOR CLASSROOM MANAGEMENT ........................................ F.15


xix
EXECUTIVE SUMMARY
EFFECTIVENESS OF SELECTED SUPPLEMENTAL READING COMPREHENSION INTERVENTIONS: IMPACTS ON A FIRST COHORT OF
FIFTH-GRADE STUDENTS
There are increasing cognitive demands on student knowledge in middle elementary grades where students become primarily engaged in reading to learn, rather than learning to read (Chall 1983). Children from disadvantaged backgrounds often lack general vocabulary, as well as vocabulary related to academic concepts that enable them to comprehend what they are reading and acquire content knowledge (Hart and Risley 1995). They also often do not know how to use strategies to organize and acquire knowledge from informational text in content areas such as science and social studies (Snow and Biancarosa 2003). Instructional approaches for improving comprehension are not as well developed as those for decoding and fluency (Snow 2002). Although multiple techniques for direct instruction of comprehension in narrative text have been well demonstrated in small studies, there is not as much evidence on teaching reading comprehension within content areas (National Institute of Child Health and Human Development 2000).
Improving the ability of disadvantaged students to read and comprehend text is an important
element in federal education policy aimed at closing the achievement gap. Title I of the No Child Left Behind Act (NCLB) calls on educators to close the gap between low- and high-achieving students using approaches that scientifically based research has shown to be effective. Such rigorous research is relatively scarce, however, so it is difficult for educators to determine how best to use Title I funds to improve student outcomes. Identifying interventions that improve reading comprehension is part of this challenge.
The Institute of Education Sciences (IES) of the Department of Education (ED) has
undertaken a rigorous evaluation of curricula designed to improve reading comprehension as one step toward meeting that research challenge. In 2004, ED contracted with Mathematica Policy Research, Inc. (MPR) and its subcontractors to conduct the study.1 The study team worked with ED to refine the study design and select the curricula to be tested, and then recruited districts and schools, collected data on implementation and outcomes, and analyzed the data. The study was conducted based on a rigorous experimental design for assessing the effects of four reading comprehension curricula on reading comprehension among fifth-grade students in selected districts across the country, where schools were randomly assigned to use one of the four treatment curricula or to a control group.
1These subcontractors were RMC Research Corporation, RG Research Group, the Vaughn Gross Center for
Reading and Language Arts at the University of Texas at Austin, the University of Utah, and Evaluation Research Services.

xx
The experimental design ensures a strong basis for answering the study’s key research questions:
1. What is the impact of the reading comprehension curricula as a whole on reading
comprehension, and how do the impacts of the individual curricula compare to one another?
2. How are student, teacher, and school characteristics related to impacts of the curricula?
3. Which instructional practices are related to impacts of the curricula?
This report focuses on findings based on the first year of data collected for the study. It presents findings about the impacts of the reading comprehension interventions over one school year (2006-2007) for a first cohort of fifth graders.2 The main finding from the first year of the study regarding the basic question of intervention effectiveness is:
• Reading comprehension test scores in schools randomly assigned to use one of the four reading comprehension curricula were not statistically significantly higher than scores in control schools. In addition, there was evidence that test scores were lower in treatment schools than in control schools (4 of the 20 impacts3 comparing treatment and control group test scores were negative and statistically significant, effect sizes: -0.14 and -0.21 for Reading for Knowledge on the composite test score and science comprehension test score, respectively, and -0.08 for the combined treatment group on both the composite test score and Group Reading Assessment and Diagnostic Evaluation (GRADE) test score).4
2Impacts are reported as “effect sizes” to facilitate comparisons of impacts on different outcomes. The effect
size is the impact divided by the standard deviation of the outcome for students in the control group. For example, an impact of 4 units on an outcome with a standard deviation of 20 would be reported as an effect size of 0.20. When control group means are shown in tables in the report, they are the actual control group means (they are not regression-adjusted means). Unadjusted means for treatment groups are presented in Table K.1 in Appendix K.
3The 20 impacts arise from having 4 reading comprehension assessments (Group Reading Assessment and Diagnostic Evaluation (GRADE) (Williams 2001), ETS science comprehension (Educational Testing Service 2007a), ETS social studies comprehension (Educational Testing Service 2007b), and a composite test score that is an average of the three tests listed here) and 5 intervention groups for whom impacts were estimated (4 individual intervention groups and the combined treatment group, which groups the 4 interventions together).
4To put this in perspective, for a student at the 50th percentile, an effect size of 0.10 represents about 4 percentile points, an effect size of 0.15 represents about 6 percentile points, and an effect size of 0.20 represents about 8 percentile points. To provide additional perspective, a meta-analysis by Rosenshine and Meister (1994) found an average effect size of 0.32 across nine studies examining the impact of multiple reading comprehension strategy instruction on standardized test scores (this meta-analysis focused on reciprocal teaching, which involves the use of guided practice and dialogue between students and teachers to teach students about four comprehension strategies including question generation, summarization, prediction, and clarification). Another meta-analysis by Rosenshine, Meister, and Chapman (1996) found an average effect size of 0.36 across 13 studies examining the impact of question generation on standardized test scores.

xxi
The main finding from the first year of the study regarding questions about for whom and under what conditions the interventions may be effective is:
• Reading comprehension test scores in schools using the selected reading
comprehension curricula were statistically significantly lower than scores in control schools for some subgroups defined by student, teacher, and school characteristics. These subgroups include students with:
- above-average baseline fluency levels (effect size: -0.23 for the combined
treatment group on the social studies comprehension test score),
- students with baseline comprehension levels in the lowest third of the sample (effect sizes: -0.08 and -0.09 for the combined treatment group on GRADE and composite test scores, respectively),5
- students in schools with below-average School Professional Culture scale scores6 (effect size: -0.14 for the combined treatment group on the composite test score),
- students in schools with an above-average concentration of students eligible for free or reduced-price lunch (effect size: -0.11 for the combined treatment group on the composite test score),
- students in schools with a below-average concentration of English language learners (effect sizes: -0.15 for the combined treatment group on the composite test score and -0.19 for the difference in impacts [on the composite test score and for the combined treatment group] between students in schools with below-average and above-average concentrations of English language learners),
- students whose teachers had more than five years of experience (effect size: -0.09 for the combined treatment group on the composite test score), and
- students whose teachers had more than 10 years of experience (effect size: -0.36 for Reading for Knowledge on the science comprehension test score).
5These effect sizes are from impact models that included the middle and bottom third of students to permit an
assessment of whether there was a difference in impacts between these two groups. We found effect sizes of -0.14 and -0.15 on the GRADE and composite test scores for students in the lowest third of the sample when the impact models included the top and bottom third of students.
6The School Professional Culture scale is based on 35 items from the study’s Teacher Survey and reflects teachers’ perceptions of the culture in their school, including relationships with colleagues, access to professional development, experiences with changes being implemented in their school, and leadership support in their school. See Chapter I and Appendix F for details.

xxii
Study Design
Drawing on input from the Title I Independent Review Panel (IRP) and the study’s technical working group (TWG), IES decided on an evaluation plan (Glazerman and Myers 2004).7 The study focused on upper elementary students—fifth graders—so that it complemented other IES initiatives to understand the effectiveness of Reading First for younger students, and to reflect the concern that disadvantaged students in upper elementary grades may still struggle with reading. The focus of the study was on testing curricula designed to improve comprehension of expository text. Outcomes were defined as the ability to comprehend such text generally and in two specific content areas, science and social studies.
Schools in districts that agreed to participate were randomly assigned to one of the five
study arms (four intervention groups and one control group). Teachers in schools assigned to an intervention group developed their own strategies for incorporating the assigned reading comprehension curriculum into their daily schedules and their core reading instruction. (As described in more detail in the next section, the curricula being evaluated in this study were designed to supplement—not replace—the core curriculum being used by each teacher.) Teachers in control group schools continued to teach reading using whatever methods they had
7The Title I Independent Review Panel (IRP) was set up by Congress to provide ED with policy
recommendations on Title I research. The MPR study design team worked with the IRP, TWG, and IES on defining the key elements of this study’s design (as laid out in the text that follows) (Glazerman and Myers 2004).
SUMMARY OF FIRST-YEAR EVALUATION DESIGN Intervention: Four reading comprehension curricula (Project CRISS, ReadAbout, Read for Real, and Reading for Knowledge) were selected as interventions for the study based on public submissions and ratings by an expert review panel. Participants: 10 districts, 89 schools, 268 teachers, and 6,350 fifth-grade students. Districts were recruited from among those with at least 12 Title I schools, and schools were recruited only if they did not already use any of the four selected curricula. Students in those schools were eligible to participate if they were enrolled in fifth-grade classes when the baseline tests were administered in fall 2006 or if they enrolled after the baseline administration but before January 1, 2007. Students in combined fourth-/fifth- or fifth-/sixth-grade classes were excluded, as were those in special education classes, although special education students mainstreamed in regular fifth-grade classes were eligible to participate. Research Design: Within each district, schools were randomly assigned to an intervention group that would use one of the four curricula or a control group that did not have access to any of the four curricula being tested. For example, in a district with 10 schools, 2 schools were assigned to each treatment group and 2 schools were assigned to the control group. Control group teachers could, however, use other supplemental reading programs. The study administered tests to students in intervention and control schools near the beginning and end of the 2006-2007 school year. It also observed classrooms during the school year and collected data from teacher questionnaires, student and school records, and from the intervention developers. Outcomes: Impact estimates focused on student reading comprehension test scores.

xxiii
been using in the absence of the study. Due to the experimental design, differences in outcomes of students in the treatment and control groups are attributable to the curricula being tested.8
This study provides educators with a sense of the effectiveness of these curricula when used
for the first time by teachers in “real-world” conditions. Although the study team worked to facilitate study activities such as the collection of data in study schools, the developers provided teacher training and follow-up support to teachers throughout the year, and teachers and schools could discontinue use of the curricula if they believed they were ineffective or too challenging to use. Therefore, the study conditions may be comparable to those many districts might face if they implemented these curricula in their schools.
Selecting Curricula for the Study
The goal of the reading comprehension evaluation is to test “high quality” supplemental curricula that would be available to schools searching for ways to improve students’ comprehension skills. An open, competitive process was used to solicit proposals from curriculum developers and to select study curricula. The plan, based upon the evaluation design and available resources, was to select four curricula for the study.
Proposals were formally solicited by the study team. The Request for Proposals (RFP) described the type of interventions to be included in the study. The reading comprehension interventions needed to supplement—not displace—the core reading, science, and/or social studies instruction in fifth-grade classrooms. They also needed to take an average of 30 to 45 minutes per day to implement and to encompass an entire school year.
In response to the RFP, a total of 13 proposals were submitted to the study team. Those that
met a set of predetermined, minimum requirements were forwarded to the panel of reading experts for review.9 The expert panel then assessed the extent to which the proposals met substantive criteria for inclusion in a pilot implementation stage. These criteria related to the theoretical and empirical underpinnings of the curriculum, evidence of the intervention’s effectiveness, the support developers proposed to provide for teachers, the developers’ institutional capability, and the appropriateness of the curriculum for the study’s target population.
Five programs were selected to participate in a pilot implementation for the 2005-2006 academic year.10 After the pilot year, four of the five curricula that were included in the pilot year were selected for the full implementation of the study. Based on the study team’s recommendations, IES selected the following curricula:
8The study design just discussed is also described in James-Burdumy et al. (2006). Early study design proposals are laid out in Glazerman and Myers (2004).
9To meet the minimum requirements, a proposal needed to include a technical discussion of the intervention, teacher training materials, classroom materials, and a budget.
10During the pilot year, each developer recruited three Title I schools, trained an average of three teachers per school, and provided support to teachers during the year. The study team observed training and instruction, reviewed training and instructional materials, and provided formative feedback to the developers.

xxiv
• Project CRISS (developed by CRISS) (Santa et al. 2004): Project CRISS focuses on five keys to learning—background knowledge, purpose setting, author’s craft (which involves using text structure to improve comprehension), active learning, and metacognition. The program is designed to be used each day during language arts, science, or social studies periods.
• ReadAbout (developed by Scholastic) (Scholastic 2005): Students are taught reading comprehension skills such as author’s purpose, main idea, cause and effect, compare and contrast, summarizing, and inferences, primarily through a computer program. Students apply what they have learned to a selection of science and social studies trade books.
• Read for Real (developed by Chapman University and Zaner-Bloser) (Crawford et al. 2005): In Read for Real, teachers work with a six-volume set of books to teach reading strategies students can use before, during, and after reading (such as previewing, activating prior knowledge, setting a purpose, main idea, graphic organizers, and text structures). Each of these units includes vocabulary, fluency, and writing activities.
• Reading for Knowledge (developed by the Success for All Foundation) (Madden and Crenson 2006): Reading for Knowledge makes extensive use of cooperative learning strategies and a process called SQRRRL (Survey, Question, Read, Restate, Review, Learn).
Recruiting Districts and Schools for the Study
The study team recruited school districts for the study beginning in January 2006. The team focused on districts that served low-income students and had enough schools to support the random assignment of schools in each participating district to the five arms of the study.
Interested districts worked with the study team to identify schools that served low-income
students and did not already use any of the four curricula identified for the study (or other similar comprehension curricula). By August 2006, participating districts and schools had been identified and participation agreements with districts obtained. A total of 10 districts and 89 schools agreed to participate. As expected—given the types of districts and schools being recruited—the participating districts and schools were statistically significantly different from schools and districts nationwide in several respects. They had higher poverty levels (63 percent of students in study districts were eligible for free or reduced-price lunch, compared to 40 percent of students in districts nationally), were larger (38,026 students per study district, compared to 3,153 students per district nationally), and were more urban than districts and schools nationally (70 percent of study districts were in urban areas, compared to 11 percent of districts nationally).

xxv
Collecting Data
Addressing the study questions required information about the curricula and how they were implemented, study participants, and students’ performance outcomes. Information about teaching and implementation of the curricula was collected to support an examination of the fidelity of implementation to each curriculum design, the ways the curricula affected more general (non-curriculum-specific) teaching practices related to comprehension and vocabulary instruction, and the resources required to implement the curricula. Data on all three “levels” of study participants—schools, teachers, and students—were collected as a basis for describing their characteristics as they entered the study. Student outcomes were measured through assessments administered towards the end of the 2006-2007 school year. More information on the study’s key data sources is provided below (see box for a summary).
Data Source Time Collected Description of Data Classroom Observations (Developed by study team. See Appendix J for a copy of the instrument.)
January-April 2007 Observers documented the number of times they observed instructional practices related to vocabulary and comprehension instruction. In treatment classrooms, observers also documented whether the teachers adhered to the curriculum content and procedures prescribed by the developers.
Teacher Survey (Developed by study team. See Appendix J for a copy of the instrument.)
August-November 2006
This survey gathered data on teacher characteristics, experience, educational credentials, impressions about the culture in their school, and attitudes about student engagement, instructional strategies, and classroom management.
School Information Form (Developed by study team. See Appendix J for a copy of the instrument.)
April-June 2007 This form collected data on school characteristics such as enrollment, the percentage of students classified as English Language Learners, and the percentage of students eligible for free or reduced-price lunch.
Student Records (Developed by study team. See Appendix J for a copy of the instrument.)
May-October 2007 This form gathered data on student characteristics such as gender, date of birth, race, ethnicity, and eligibility for free or reduced-price lunch.
Test of Silent Contextual Reading Fluency (TOSCRF) (Hammill 2006)
August-October 2006
This assessment measured students’ skills in word identification, word meaning, and sentence structure.
Passage Comprehension Subtest of the Group Reading Assessment and Diagnostic Evaluation (GRADE) (Williams 2001)
August-October 2006 (baseline), April-June 2007 (follow up)
This test assessed students’ general reading comprehension skills.
Science and Social Studies Reading Comprehension Assessments (Educational Testing Service 2007a and 2007b)
April-June 2007 (follow up)
These assessments focused on students’ reading comprehension of science and social studies text.

xxvi
Information About Teaching and Implementation of the Curricula. Three data collection activities focused on teachers, teaching, and implementation of the four reading comprehension curricula. Two of these involved classroom observations, conducted in spring 2007 for two purposes. To support interpretation of the impact estimates, intervention-specific “fidelity” observations of classes taught by treatment group teachers were conducted to determine the extent to which the teachers adhered to the curriculum content and procedures prescribed by each developer. To describe more general teacher practices related to comprehension and vocabulary instruction (as opposed to practices linked to a specific intervention) and determine whether these practices were correlated with intervention impacts, “quality of instruction” observations were carried out in both treatment and control group classrooms to record the frequency with which teachers engaged in behaviors that research suggests are effective comprehension and vocabulary teaching practices. The third data collection activity that addressed the implementation of the curricula was a survey of developers on the cost of their curriculum to school districts.
To help summarize the large amount of “quality of instruction” observation data collected
on general (non-intervention-specific) teaching practices related to comprehension and vocabulary instruction, the following three summary scales were created (for details on these scales, see Chapter II and Appendix F):11
• Traditional Interaction. This scale captures interactive teaching practices, primarily
focused on vocabulary instruction and drawing inferences from text, that have been in use for many decades in American schools (Durkin 1978-1979; Brophy and Evertson 1976).
• Reading Strategy Guidance. This scale captures teachers’ use of aspects of strategy instruction (such as using text structure and generating summaries to improve comprehension) to build students’ comprehension ability.
• Classroom Management and Student Engagement. This scale captures teaching practices related to the management of student behavior and students’ engagement.
Data on Teacher Characteristics. The Teacher Survey, conducted in early fall 2006, served three main purposes. First, it allowed the study team to describe the teachers participating in the study. Second, it was used to assess the similarity of treatment and control group teacher characteristics. Third, it made it possible to examine the relationship between teacher characteristics and impacts, including examining the relationship between impacts and school culture and teachers’ ability to benefit from the professional development provided to treatment group teachers as part of the study.
The Teacher Survey data were used to create two scales for this third purpose (see
Appendix F for details):
11These scales were used in two ways: (1) to describe teacher practices in the treatment and control groups and
(2) to examine the nonexperimental relationship between impacts on student reading comprehension outcomes and these scale scores.

xxvii
• School Professional Culture. The School Professional Culture scale is intended to capture conditions in schools that affect the quality of instruction (Consortium on Chicago School Research 1999; Carlisle 2003). The scale’s 35 items were included in the Teacher Survey developed for this study. They reflect teachers’ perceptions of the culture in their school, including relationships with colleagues, access to professional development, experiences with changes being implemented in their school, and leadership support in their school.
• Teacher Efficacy. The Teacher Efficacy scale is intended to capture teachers’ ability to benefit from professional development (Sparks 1988; permission to use scale provided by Hoy and Woolfolk 1993). The scale’s 12 items, included in the Teacher Survey developed for this study, ask about teachers’ attitudes concerning student engagement, instructional strategies, and classroom management.
Data on School and Student Characteristics. The School Information Forms, collected at the end of the 2006-2007 school year, captured data on school characteristics, which were used to describe the study context, contribute school-level variables to the impact analysis, and examine the relationship between impacts and conditions in schools. At the end of the 2006-2007 school year, the study team also asked schools to provide records data on each student, including several stable items that could be used to describe students’ baseline characteristics (such as gender, race, and ethnicity).
Data on Students’ Baseline Achievement Levels. Two student assessments administered at the start of the 2006-2007 school year allowed the study team to characterize the achievement level of study students at baseline:
• Passage Comprehension subtest of the Group Reading Assessment and Diagnostic Evaluation (GRADE). This assessment, published by Pearson Learning Group, measures a student’s ability to comprehend text passages (Williams 2001).
• Test of Silent Contextual Reading Fluency (TOSCRF). This assessment yields a score that reflects skills such as word identification, word meaning, and sentence structure, all of which are important skills for reading comprehension (Hammill et al. 2006).
Data on Student Outcomes. Data on student outcomes were collected from two sources at the end of the fifth-grade year (spring 2007). First, students were retested using the GRADE (Williams 2001). In addition, students were tested for comprehension of social studies and science informational text, using assessments specially developed by the Educational Testing Service (ETS) for the study (Educational Testing Service 2007a and 2007b). To reduce burden, half the students were randomly assigned to take the science test and half to take the social studies test.

xxviii
Summary of Study Findings
The study’s key findings focus on curriculum implementation and impacts on student achievement. The implementation analyses document treatment teachers’ training and feelings of preparedness to implement the curricula, adherence to their assigned curriculum, and teaching practices observed among teachers in the treatment and control group classrooms. The impact analyses examine how student outcomes were affected by the curricula and how the impacts relate to conditions and practices in study schools and classrooms.
Implementation Findings. Five key findings emerged from the implementation analyses:
1. During summer and early fall 2006, over 90 percent (91-100 percent) of
treatment teachers were trained to use the curricula. Ninety-one percent of Read for Real teachers, 96 percent of Reading for Knowledge teachers, and 100 percent of Project CRISS and ReadAbout teachers were trained in the use of the curricula.
2. More than half of the teachers (56 to 80 percent) reported feeling very well prepared by the training to implement the curricula. Fifty-six percent of Reading for Knowledge teachers, 69 percent of Project CRISS teachers, 72 percent of ReadAbout teachers, and 80 percent of Read for Real teachers reported that they felt very well prepared to implement their assigned curricula.
3. At the time of the classroom observations in the spring, over 80 percent (81 to 91 percent) of treatment teachers reported using their assigned curriculum. Eighty-one percent of Read for Real teachers, 83 percent of Reading for Knowledge teachers, 87 percent of ReadAbout teachers, and 91 percent of Project CRISS teachers reported using their assigned curriculum.
4. Classroom observation data showed that teachers implemented 55 to 78 percent of the behaviors deemed important by the developers for implementing each curriculum. ReadAbout and Project CRISS teachers implemented, on average, 71 and 78 percent of such behaviors, respectively. Reading for Knowledge teachers implemented 58 and 65 percent of the behaviors deemed important for the two types of instructional days that are part of the curriculum. Finally, Read for Real teachers implemented 55 and 71 percent of the behaviors deemed important for the two types of instructional days that are part of that curriculum.
5. Two of three teacher practice scales were not statistically significantly different between the treatment and control groups. For the purposes of describing teacher practices, the study team constructed scales summarizing teacher practices in three areas. There were no statistically significant differences in the Reading Strategy Guidance and Classroom Management and Student Engagement scales. Scores on the third scale, Traditional Interaction, were statistically significantly lower for the treatment group than the control group (effect size: -0.52).
Impact Findings. The effectiveness of the study curricula was gauged by experimental comparisons of reading comprehension test scores between students in treatment and control schools. Effects on test scores were estimated using a statistical model that accounts for clustering of students within schools, adjusts tests of statistical significance for the multiple

xxix
comparisons being made in the study, and includes covariates to increase statistical precision. The study’s key impact findings, described below, were robust to a variety of sensitivity tests including variations in model specification, method of estimation, and method of adjusting for multiple comparisons.
In this report, two types of impacts are presented. First, impacts are presented for each
intervention (for example, outcomes of students in ReadAbout schools are compared to outcomes of students in the control group). These impacts provide information on the effectiveness of each intervention, which may be helpful to readers considering implementing one of the interventions included in the study. Second, impacts are presented for the combined treatment group. In this analysis, the outcomes of students in all four intervention groups combined are compared to outcomes of students in the control group. These impacts provide information on the effectiveness of reading comprehension interventions more broadly (not the specific impacts of any one intervention). Impacts for the combined treatment group are presented for two main reasons. First, although the details of each intervention differ, the four interventions share common strategies for improving reading comprehension, so examining the interventions as a group is a reasonable approach to address the question of whether the use of these types of interventions, in general, improves comprehension. Second, examining the combined treatment group gives the study more power than looking at an individual treatment group.
The analysis of impacts was designed to answer two types of questions: (1) confirmatory
(primary) questions about whether the reading comprehension interventions “work” and (2) exploratory (secondary) questions about for whom and under what conditions they might work. Answers to the confirmatory questions, all of which are supported by the experimental design and have a causal interpretation, indicate whether or not the interventions have the intended effect of improving reading comprehension. Answers to the second set of questions can help interpret the answers to confirmatory impact questions and guide future research on reading comprehension interventions. Answers to these exploratory questions do not always allow causal conclusions to be drawn about the impacts of the interventions for subgroups. A subgroup analysis that maintains the properties of random assignment allows causal conclusions about the impacts of the intervention for that subgroup to be drawn because it ensures that there are no systematic differences between subgroup members in the treatment and control groups. In this report, such subgroup analyses are those in which the subgroups are based on teacher, student, or school characteristics that could not have been influenced by the intervention, including teacher experience, students’ prior test scores and English language learner status, and the schools’ concentration of English language learners and students eligible for free or reduced-price lunch. A subgroup analysis that does not maintain the properties of random assignment does not allow causal conclusions about the impact of the intervention for that subgroup to be drawn because subgroup members in the treatment and control groups might differ systematically. In this report, such subgroup analyses are those in which the subgroups are based on teacher characteristics that could have been influenced by the intervention, including teachers’ reported professional development participation, teaching efficacy, and professional culture in the school (all of which could be affected by the product-specific training teachers in the treatment group received during the summer before the intervention year).

xxx
Answers to Confirmatory Questions on Intervention Effectiveness. Figures 1 through 4 show observed score differences on the GRADE, ETS science comprehension assessment, ETS social studies comprehension assessment, and a composite score based on an average of the GRADE and ETS test scores. All differences are shown in effect size units, which (as noted above) allows for a comparison of results for tests scored in different units.
-0.25
-0.2
-0.15
-0.1
-0.05
1E-17
0.05
Project CRISS ReadAbout Read for Real Reading for Knowledge
Combined Treatment Group
Effect Size
Figure 2: Effects of Reading Comprehension Curricula on Social Studies Reading Comprehension Assessment Score
*Statistically different from the control group at the .05 level.
0
-0.25
-0.2
-0.15
-0.1
-0.05
1E-17
0.05
Project CRISS ReadAbout Read for Real Reading for Knowledge
Combined Treatment Group
Effect Size
Figure 1: Effects of Reading Comprehension Curricula on GRADE Score
*
*Statistically different from the control group at the .05 level.
0

xxxi
-0.25
-0.2
-0.15
-0.1
-0.05
1E-17
0.05
Project CRISS ReadAbout Read for Real Reading for Knowledge
Combined Treatment Group
Effect Size
Figure 3: Effects of Reading Comprehension Curricula on Science Reading Comprehension Assessment Score
*
*Statistically different from the control group at the .05 level.
0
-0.25
-0.2
-0.15
-0.1
-0.05
1E-17
0.05
Project CRISS ReadAbout Read for Real Reading for Knowledge
Combined Treatment Group
Effect Size
Figure 4: Effects of Reading Comprehension Curricula on Composite Test Scores
*
*
*Statistically different from the control group at the .05 level.
0

xxxii
Reading comprehension test scores were not statistically significantly higher in schools using the selected reading comprehension curricula than in control schools. In fact, students’ reading comprehension test scores were statistically significantly lower in treatment schools than in control schools. The treatment group as a whole scored lower than the control group on the GRADE assessment (Figure 1, effect size: -0.08), and the Reading for Knowledge group scored lower than the control group on the ETS science comprehension assessment (Figure 3, effect size: -0.21). On the composite test score, the treatment group as a whole scored lower than the control group and the Reading for Knowledge group scored lower than the control group (Figure 4, effect sizes: -0.08 and -0.14, respectively).
Answers to Exploratory Questions on the Effectiveness of the Interventions for
Subgroups of Students. The student subgroups examined were defined based on variables that can be observed by teachers, and thus could be used as a basis for targeting the interventions to specific students (for example, students with below-average fluency levels might respond better to a particular intervention). Similarly, the teacher and school subgroups examined were defined using characteristics that might be used by teachers and principals to target interventions to specific settings (for example, certain interventions might be more effective in schools with above-average concentrations of English language learners or they might be more effective for teachers with below-average years of experience).
Although reading comprehension test scores in treatment schools were statistically significantly lower than scores in control schools for subgroups of students defined by certain baseline characteristics of students, teachers, and schools, no clear pattern to these findings emerged. For the combined treatment group, negative impacts (treatment students scoring lower than control students) were observed for the following subgroups, all of which have a causal interpretation because the subgroups are defined in terms of characteristics that were measured at the beginning of the study’s implementation year, and thus could not have been influenced by the intervention:
• students with above-average baseline fluency levels (effect sizes: -0.23 for the social
studies comprehension test score, where above-average is defined as above the average of 100 for the national norm sample, and -0.14 for the social studies comprehension test score, where above-average is defined as above the sample median of 89),
• students with baseline comprehension levels in the bottom third of the sample (effect sizes: -0.08 and -0.09 for the GRADE and composite test scores, respectively),
• students of teachers with more than five years teaching experience (effect size: -0.09 for the composite test score),
• students in schools with an above-average concentration of students eligible for free or reduced-price lunch (effect size: -0.11 for the composite test score), and
• students in schools with a below-average concentration of English language learners (effect sizes: -0.15 for the composite test score and -0.19 for the difference in impacts [on the composite test score] between students in schools with below-average and above-average concentrations of English language learners).

xxxiii
For the subgroups that did not maintain the properties of random assignment because teachers in the treatment group might have been affected by the product-specific training they received in the summer before the intervention year, the study found:
• for the combined treatment group, negative impacts for students in schools with a below-average School Professional Culture scale score (effect size: -0.14 for the composite test score), and
• no statistically significant impacts for the subgroups based on teachers’ past professional development or teaching efficacy.
For Reading for Knowledge, statistically significant negative impacts were observed for
students whose teachers had 10 or more years of teaching experience (effect size: -0.36 for the science comprehension test score). Other characteristics examined were not statistically significantly related to impacts. These include students’ English language learner status, teachers’ Teacher Efficacy scale scores, and teachers’ past reading professional development. Impacts for subgroups defined by the Teacher Efficacy scale, School Professional Culture scale, and teachers’ professional development cannot be interpreted causally, because treatment group teachers received additional professional development prior to the administration of the Teacher Survey (which could have affected the teachers’ responses to questions on the survey about their professional development, teaching efficacy, and professional culture in their schools).
Answers to Exploratory Questions on the Relationship Between Intervention Effects
and Teacher Practices. The study team also examined the relationship between intervention effects and classroom practices. These relationships must be interpreted cautiously because the interventions may have affected the extent to which teachers engage in specific practices or the types of teachers who choose to engage in those practices. More specifically, because the research design did not randomly assign interventions to teachers with different levels of teacher practices, factors that led teachers to have a certain level of teacher practices could explain the observed correlations. As a result, treatment and control teachers who engage in teaching practices to the same degree may differ in unmeasurable ways.12 Therefore, it is important to note that these estimates of the relationship between intervention effects and teacher practices do not allow causal conclusions to be drawn.
Keeping these caveats in mind, several statistically significant relationships between teacher
practices and intervention effects were observed. Students in Reading for Knowledge classrooms whose teachers had below-average scores on the Reading Strategy Guidance scale had statistically significantly lower composite test scores than students in control group classrooms in which teachers had below-average Reading Strategy Guidance scale scores (effect size: -0.23). Students in Read for Real classrooms of teachers with Classroom Management scale scores below the sample median had statistically significantly lower scores than students in control group classrooms taught by teachers with Classroom Management scale scores below the sample
12If the intervention affected teacher practices, then that impact on teacher practices might explain the overall
impact on student test scores. However, it is not possible to make causal statements about that relationship (causal statements would require a different study design than the one we used on this study, such as one in which teachers or schools were randomly assigned to implement the interventions to different degrees or amounts).

xxxiv
median (effect sizes: -0.23 for the composite test score and -0.35 for the social studies reading comprehension test score).13 In both cases, these differences raise questions for further research, but—as noted above—the estimates do not provide experimental or causal evidence.
A second study report will use a second year of data to examine two further questions: (1)
whether the curricula are more effective after teachers and schools have had more experience using them, and (2) whether the curricula have any lasting impacts on student outcomes. To address the first question, we enrolled a second cohort of fifth-grade students in study schools and will determine whether impacts over one school year for those students are more positive than the impacts reported in the first report for the first cohort. To address the second question, students from the first fifth-grade cohort are being tested again at the end of the 2007-2008 school year to assess whether the impact results observed in the first year persist or change after a second year.
13See Appendix Figures F.1A through F.3 for information on how the frequency of specific teacher practices
corresponds to different scale scores.

1
I. INTRODUCTION
There are increasing cognitive demands on student knowledge in middle elementary grades where students become primarily engaged in reading to learn, rather than learning to read (Chall 1983). Children from disadvantaged backgrounds often lack general vocabulary, as well as vocabulary related to academic concepts that enable them to comprehend what they are reading and acquire content knowledge (Hart and Risley 1995). They also often do not know how to use strategies to organize and acquire knowledge from informational text in content areas such as science and social studies (Snow and Biancarosa 2003). Instructional approaches for improving comprehension are not as well developed as those for decoding and fluency (Snow 2002). Although multiple techniques for direct instruction of comprehension in narrative text have been well-demonstrated in small studies, there is not as much evidence on teaching reading comprehension within content areas (National Institute of Child Health and Human Development 2000).
Improving the ability of disadvantaged children to read and comprehend text is an important
element in federal education policy aimed at closing the achievement gap. Title I of the No Child Left Behind Act (NCLB) of 2002 calls on educators to close the gap between low- and high-achieving students, using approaches found effective in scientifically based research. Such research is limited, however, so it is difficult for educators to decide how best to use Title I funds to improve student outcomes. Finding effective interventions to improve reading comprehension is part of this challenge.
The Institute of Education Sciences (IES) of the Department of Education (ED) has
undertaken a rigorous evaluation of interventions designed to improve reading comprehension as one step toward meeting that research challenge. The Impact Evaluation of Reading Comprehension Interventions, begun in 2004, will contribute to the scientific research base available to practitioners. Carefully selected reading comprehension interventions are being tested using a rigorous experimental design to determine their effects on reading comprehension among fifth-grade students in selected districts across the country.
Concerns over students’ reading achievement14 helped shape IES’s process for defining
research on issues related to Title I and the ultimate decision to focus this evaluation on reading comprehension of informational text. IES contracted with Mathematica Policy Research, Inc. (MPR) and its subcontractors in October 2002 to help identify issues relevant to Title I evaluation and to propose evaluation design options, and later, in October 2004, to conduct an evaluation.15 IES and MPR drew on input from two expert panels in the design of the study: the
14Findings from the 2007 National Assessment of Educational Progress (NAEP) show that one-third of the nation’s fourth graders have difficulty reading (U.S. Department of Education 2007). Other estimates suggest as many as 30 percent of elementary, middle, and high school students have reading problems that curtail educational progress and attainment (Moats 1999).
15These subcontractors were RMC Research Corporation, RG Research Group, the Vaughn Gross Center for Reading and Language Arts at the University of Texas at Austin, the University of Utah, and Evaluation Research Services.

2
Title I Independent Review Panel (IRP) set up by Congress to advise ED on Title I evaluation, and a special Technical Work Group (TWG) of experts on reading comprehension and evaluation design.
With input from these sources, IES decided on an evaluation plan focused on fifth graders,
so that the study complemented other IES initiatives to investigate the effectiveness of Reading First for younger students. This focus also reflected the concern that disadvantaged students may continue to struggle with reading as they reach upper elementary grades. The focus was on testing interventions designed to improve comprehension of expository text. Outcomes were defined as the ability to comprehend such text generally and in two specific content areas, science and social studies.
The resulting evaluation addresses a need for reliable information on the effectiveness of
commercially available curricula designed to improve students’ reading comprehension skills. There is a massive body of research on children’s reading and the individual comprehension strategies (or combinations of strategies) that may improve students’ reading comprehension, but it offers little guidance on whether (and the extent to which) commercially available curricula improve students’ reading comprehension (National Institute of Child Health and Human Development 2000). Moreover, the studies reviewed in the National Reading Panel (NRP) report suffered from a mix of limitations including small sample sizes, a focus on outcome assessments designed by the developers of the interventions being studied, the use of analytic methods that were not aligned with the unit of assignment, and the use of nonexperimental methods.
This study is designed to overcome those limitations. It focuses on curricula designed for
commercial distribution. It is based on a rigorous experimental design and a large sample that includes 10 districts, 89 schools, 268 teachers, and 6,350 students. The student assessments used to examine the interventions’ impacts on reading comprehension were selected by the study team rather than developers.
This report presents the background and design of the evaluation, and impact results from
the 2006-2007 school year—the first year of intervention implementation and data collection. As background for those results, this chapter reviews the existing research on reading comprehension strategies, the study design, selection and recruitment of study sites, and the data collected. The remainder of the report presents findings on the implementation of the reading comprehension interventions and the impacts of those interventions on the first cohort of fifth-grade students, enrolled in the study in the 2006-2007 school year.16
A. PAST READING RESEARCH HAS FUELED USEFUL RECOMMENDATIONS, BUT LEFT QUESTIONS UNANSWERED
A significant amount of research on specific instructional strategies to enhance reading comprehension is available. Although that research has been used to guide the development of
16A second cohort of fifth-grade students was enrolled in the study in the 2007-2008 school year; results for
that cohort will be presented in a later report.

3
many reading comprehension instructional programs, the effectiveness of those programs has not been studied (Liang and Dole 2006). In addition, the research base consists primarily of small-scale studies, many of which suffer from limitations in the rigor of their research design.
The NRP recommendations (National Institute of Child Health and Human Development
2000) and other research syntheses support a variety of techniques and approaches that can be classified into four groups: (1) student comprehension strategies, (2) teaching strategies, (3) instructional delivery, and (4) professional development. These recommendations are summarized below.
Student Comprehension Strategies. The NRP recommendations focus most of all on
teaching students strategies for making meaning out of text. Two recent reviews (National Institute of Child Health and Human Development 2000; Gersten et al. 2001) concluded that research shows the most benefit comes from approaches in which students use multiple strategies flexibly as they read. Two types of strategies have been highlighted (both by the NRP and others, as noted in the citations that follow) as particularly important (Pearson et al. 1992; Pressley 2002; National Institute of Child Health and Human Development 2000; RAND Reading Study Group 2000):
• Summarizing. Summarizing consists of condensing textual information into essential
or main points; it employs multiple strategies, such as determining what is important, categorizing, and organizing information (Brown and Day 1983).
• Question generation. Question generation involves students, not teachers, asking questions as they read (Martin and Pressley 1991; Wood et al. 1990; Rosenshine et al. 1996). The point of this strategy is for students to actively engage in the text by thinking about questions they want to answer as they read.
Teaching Strategies. A second group of recommendations from the NRP for effective comprehension instruction rests on strategies for teaching that appear to influence students’ comprehension of text (National Institute of Child Health and Human Development 2000). These strategies include:
• Use of engaging text. Research has shown that students who read texts that are
interesting or that relate to topics of interest to them demonstrate improved comprehension compared to when they read other types of text (Renninger et al. 1992). Similarly, other research (Guthrie et al. 1998; Guthrie et al. 2000a; Guthrie et al. 2000b) supports the benefits of using texts containing vivid details that are relevant to the task and easily accessible, with colorful photographs and illustrations (Schraw et al. 1995).
• Embedding strategy instruction in texts students use in learning academic disciplines. Research suggests that, when strategy instruction (for example, teaching students about summarizing or question generation) is embedded into the reading of text in different academic content areas, students will be more likely to transfer their use of the strategies to texts they read in other content areas and on their own (Pressley 1998; Pressley 2002). Conversely, when strategies are taught in isolation

4
(for example, on reading instruction workbook pages), students do not transfer skills from workbook pages to reading of expository texts (Pearson and Fielding 1991; Pressley 2000).
• Cooperative learning. Research suggests that cooperative learning—having students work together in groups, interacting with their peers while discussing text—can encourage students to think about and internalize comprehension strategies (National Institute of Child Health and Human Development 2000). Practicing a strategy in a small group has been found to contribute to the success of at least some researcher-developed instructional activities (National Institute of Child Health and Human Development 2000; Gersten et al. 2001).
Instructional Delivery. A third set of NRP recommendations focuses on instructional delivery—how best to implement instruction on student comprehension strategies (National Institute of Child Health and Human Development 2000). These recommendations encourage using direct, or explicit, instruction and explanation, two methods supported by research:
• Direct, or explicit, instruction. Teachers model how the comprehension strategy or
skill is used (often called a “think aloud”), give feedback to students as they begin to use the strategy, and provide opportunities for students to practice using the strategy or skill independently (Rosenshine and Stevens 1986; Adams et al. 1982; Darch and Gersten 1986; Darch and Kame’enui 1987; Lloyd et al. 1980; Patching et al. 1983).
• Direct explanation of strategies. Teachers first name and explain a strategy, describe when and how it might best be used, and tell why it is important for improving reading. They next engage in a significant amount of explanation and cognitive modeling to show how to use the strategy. Students practice the strategy in teacher-mediated activities until they are able to use the strategy independently (Duffy et al. 1987; Duke and Pearson 2002; National Institute of Child Health and Human Development 2000; RAND Reading Study Group 2000).
Professional Development. A fourth focus of NRP recommendations, professional development in the teaching of reading comprehension strategies, has been found to be important in promoting effective teaching of reading comprehension (National Institute of Child Health and Human Development 2000). With sufficient professional development, teaching of comprehension strategies improves (Brown et al. 1996). Ongoing professional development consisting of one-on-one coaching, collaborative sharing, and lesson observation and feedback has helped teachers learn to teach comprehension strategies (Duffy et al. 1987). This body of research suggests that building skill in teaching reading comprehension requires a good deal of professional development and that thorough use of comprehension strategy instruction is difficult for many teachers.
The NRP’s research review and other research summaries referenced above suggest that interventions to improve reading comprehension can have positive effects on student outcomes, but many of the individual studies on comprehension instruction have limitations that highlight the importance of this study. First, many studies have been based on instruction delivered to

5
students by well-trained graduate students or teachers personally trained by the researchers, which indicates little about how useful the interventions would be in “real-world” classrooms with teachers not exposed to such training (Klingner et al. 1998; Shany and Biemiller 1995). Another limitation is that reading materials that researchers used were sometimes different from those students typically encountered in classrooms (Anderson and Roit 1993; Baumann and Bergeron 1993). Although individual and even multiple strategies have been researched, no large-scale, rigorous studies of commercially available supplemental comprehension curricula have been conducted. Developers of most current commercial programs indicate that their programs are “research-based,” but they generally mean that several instructional activities in the programs have been found to be effective. However, the total program usually has not been rigorously researched and found to be effective (Liang and Dole 2006). Finally, many studies used outcome measures that were closely aligned to the specific goal of the intervention and failed to use broader measures of comprehension ability (see, for example, Baumann 1984; Hare and Borchardt 1984; Raphael and Pearson 1985; Taylor and Beach 1984).
B. STUDY DESIGN: FOCUS ON RIGOR AND UNDERSTANDING INTERVENTIONS
To address the limitations of earlier research noted in the prior section, the plan for this evaluation is based on a rigorous experimental design and an emphasis on understanding the thoroughness of teachers’ implementation of interventions under regular school conditions. The experimental design ensures a strong basis for answering the study’s key research questions:
1. What is the impact of the reading comprehension curricula as a whole on reading
comprehension, and how do the impacts of the individual curricula compare to one another?
2. How are student, teacher, and school characteristics related to impacts of the curricula?
3. Which instructional practices are related to impacts of the curricula?
The first research question provides confirmatory answers about intervention effectiveness. It addresses the question faced by school districts interested in investing in a curriculum to improve students’ reading comprehension. The second and third questions are exploratory in nature. They help to understand what lies behind the basic impact results and might suggest directions for future research. In addition, answers to those questions provide school districts with more detailed information on the conditions in which the interventions might be effective.
Schools in districts that agreed to participate were randomly assigned to one of the five study arms (four intervention groups and one control group). Teachers and schools assigned to a treatment or intervention group developed their own strategies for incorporating the assigned reading comprehension curriculum into their daily schedules and their core reading instruction. (As described in more detail in the next section, the curricula being evaluated in this study were designed to supplement—not replace—the core reading curriculum being used by each teacher.) Teachers in control group schools continued to teach reading using the methods they had been using in the absence of the study. Due to the experimental design, differences in outcomes of students in the treatment and control groups are attributable to the interventions being tested.

6
Carrying out the study involved training fifth-grade teachers in treatment schools, and a careful examination of the “fidelity” with which treatment teachers adhered to the implementation guidelines for their assigned intervention. Curriculum developers provided training for teachers in schools assigned to their intervention. Researchers observed classes to collect information needed to assess the extent to which curricular implementation guidelines were followed.
This study tests whether interventions are effective when districts volunteer to participate
and schools and teachers volunteer to implement the interventions. Eligible districts that were invited to participate in the study were under no obligation to participate, and only some of them (10 of 71) agreed to do so.17 When districts agreed to participate, they did so after holding discussions with leaders of schools that they felt best met the selection priorities for the study. Individual teachers could decline to participate in the study, but few did (94 percent of fifth-grade teachers in study schools agreed to participate).
17See Section D of this chapter for more details on the eligibility criteria for school districts.
SUMMARY OF FIRST-YEAR EVALUATION DESIGN Intervention: Four reading comprehension curricula (Project CRISS, ReadAbout, Read for Real, and Reading for Knowledge) were selected as interventions for the study based on public submissions and ratings by an expert review panel. Participants: 10 districts, 89 schools, 268 teachers, and 6,350 fifth-grade students. Districts were recruited from among those with at least 12 Title I schools, and schools were recruited only if they did not already use any of the four selected curricula. Students in those schools were eligible to participate if they were enrolled in fifth-grade classes when the baseline tests were administered in fall 2006, or if they enrolled after the baseline administration but before January 1, 2007. Students in combined fourth-/fifth- or fifth-/sixth-grade classes were excluded, as were those in special education classes, although special education students mainstreamed in regular fifth-grade classes were eligible to participate. Research Design: Within each district, schools were randomly assigned to an intervention group that would use one of the four curricula or a control group that did not have access to any of the curricula being tested. For example, in a district with 10 schools, 2 schools were assigned to each treatment group and 2 schools were assigned to the control group. Control group teachers could, however, use other supplemental reading programs. The study administered tests to students in intervention and control schools near the beginning and end of the 2006-2007 school year. The study also observed classrooms during the school year and collected data from teacher questionnaires, student and school records, and the intervention developers. Outcomes: Impact estimates focused on student reading comprehension test scores.

7
The voluntary nature of the study, and the fact that schools and districts were participating in a study, could have affected impacts. In particular, impacts might differ from what might result if a district mandated a curriculum, or if curricula were used outside the context of a study.18
C. FOUR INTERVENTIONS SELECTED THROUGH A COMPETITIVE PROCESS
The goal of the reading comprehension evaluation was to test “high quality” supplemental interventions that would be available to schools searching for ways to improve students’ comprehension skills. Criteria for selecting interventions were developed with input from the Technical Work Group and were based on existing reading research. An open, competitive process was used to solicit proposals from curriculum developers and to select study interventions. The plan, based upon the evaluation design and available resources, was to select four curricula for the study.
Proposals were formally solicited by the study team. A wide range of reading researchers
and educational publishers were given advance notice and sent a formal Request for Proposal (RFP). The RFP described the type of interventions to be included in the study. The reading comprehension interventions needed to supplement—not displace—the core reading, science, and/or social studies instruction in fifth-grade classrooms. They needed to take an average of 30 to 45 minutes per day to implement and they needed to encompass an entire school year.
In response to the RFP, a total of 13 proposals were submitted. Those that included a
technical discussion of the intervention, teacher training materials, classroom materials, and a budget were considered to have met minimum requirements and were forwarded to the expert panel for review. The expert panel then assessed the extent to which the proposals met substantive criteria for inclusion in a pilot implementation stage. These criteria related to the theoretical and empirical underpinnings of the intervention, evidence of the intervention’s efficacy or effectiveness, the intervention design and the support proposed for teachers, institutional capability, and the appropriateness of the intervention for the study’s target population (Table I.1).
Five programs were selected to participate in a pilot implementation during the 2005-2006
academic year. During the pilot year, each developer recruited three Title I schools, trained an average of three teachers per school, and provided support to teachers during the year. The study team observed training and instruction, reviewed training and instructional materials, and provided formative feedback to the developers so they could refine their interventions.19
After the pilot year, four of the five interventions that were included in the pilot year were
selected for full implementation of the study. To make this decision, the expert panel reviewed curriculum materials and initial proposals as well as data collected during the pilot year (including notes on teacher training and classroom observations, comments to developers, and
18The study design just discussed is also described in James-Burdumy et al. (2006). Early study design proposals are laid out in Glazerman and Myers (2004).
19To eliminate any potential conflict of interest, the subcontractor who interacted with developers during the pilot year to refine the interventions was not involved in the impact study.
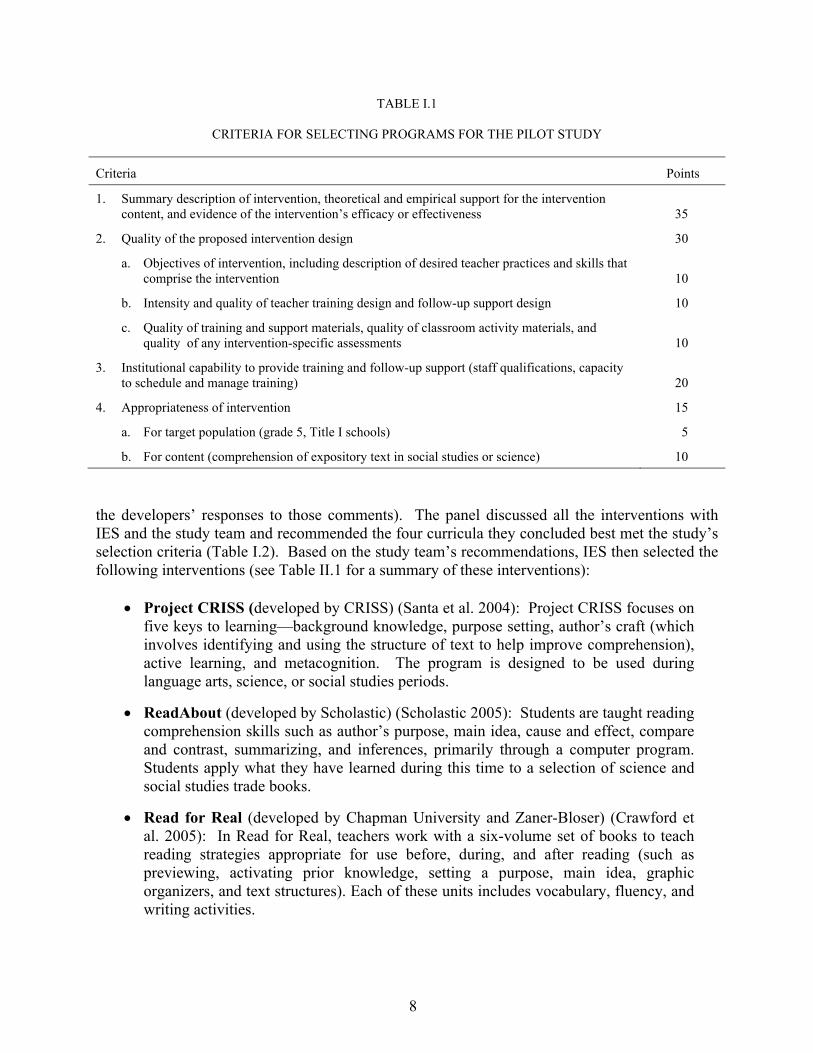
8
TABLE I.1
CRITERIA FOR SELECTING PROGRAMS FOR THE PILOT STUDY
Criteria Points
1. Summary description of intervention, theoretical and empirical support for the intervention content, and evidence of the intervention’s efficacy or effectiveness 35
2. Quality of the proposed intervention design 30
a. Objectives of intervention, including description of desired teacher practices and skills that comprise the intervention 10
b. Intensity and quality of teacher training design and follow-up support design 10
c. Quality of training and support materials, quality of classroom activity materials, and quality of any intervention-specific assessments 10
3. Institutional capability to provide training and follow-up support (staff qualifications, capacity to schedule and manage training) 20
4. Appropriateness of intervention 15
a. For target population (grade 5, Title I schools) 5
b. For content (comprehension of expository text in social studies or science) 10
the developers’ responses to those comments). The panel discussed all the interventions with IES and the study team and recommended the four curricula they concluded best met the study’s selection criteria (Table I.2). Based on the study team’s recommendations, IES then selected the following interventions (see Table II.1 for a summary of these interventions):
• Project CRISS (developed by CRISS) (Santa et al. 2004): Project CRISS focuses on
five keys to learning—background knowledge, purpose setting, author’s craft (which involves identifying and using the structure of text to help improve comprehension), active learning, and metacognition. The program is designed to be used during language arts, science, or social studies periods.
• ReadAbout (developed by Scholastic) (Scholastic 2005): Students are taught reading comprehension skills such as author’s purpose, main idea, cause and effect, compare and contrast, summarizing, and inferences, primarily through a computer program. Students apply what they have learned during this time to a selection of science and social studies trade books.
• Read for Real (developed by Chapman University and Zaner-Bloser) (Crawford et al. 2005): In Read for Real, teachers work with a six-volume set of books to teach reading strategies appropriate for use before, during, and after reading (such as previewing, activating prior knowledge, setting a purpose, main idea, graphic organizers, and text structures). Each of these units includes vocabulary, fluency, and writing activities.

9
TABLE I.2
CRITERIA FOR SELECTING PROGRAMS FOR THE FULL STUDY
1. Meets contractual requirements for pilot test year
2. Ease of use for teacher a. Materials and activities are readily integrated into classroom routines (for example, teacher’s guide
provides lesson plans that are easy to follow; student materials have a wrap-around teacher’s guide; activities, including computer applications, are functional)
b. Teacher friendly materials (for example, lessons follow similar format; use of color or graphics makes lesson plans or scripts appealing and easy to follow)
3. Intensity/duration of teacher professional development a. Duration of initial training and follow-up support are commensurate with (or adequate for) program
complexity b. Initial training and follow-up support are sufficient in motivating teachers to implement program as
intended c. Initial training and follow-up support is well-specified
4. Program is well-specified and robust a. Program activities are clearly outlined and tied to expository reading comprehension objectives b. Program activities can be satisfactorily implemented by teachers with a range of teaching skill or
experience
5. Developer has the capacity to support large-scale implementation a. Developer has sufficient staff to support up to 20 schools b. Training and support model is adequate to ensure fidelity of implementation
6. Theoretical and empirical support for the program’s content and effectiveness a. Effectiveness of program’s strategies based on prior theory or research b. Effectiveness of program based on program-specific empirical research

10
• Reading for Knowledge (developed by the Success for All Foundation) (Madden and Crenson 2006): Reading for Knowledge makes extensive use of cooperative learning strategies and a process called SQRRRL (Survey, Question, Read, Restate, Review, Learn).
D. STUDY DISTRICTS AND SCHOOLS SERVE DISADVANTAGED STUDENTS
The study’s recruiting effort focused on engaging a large number of schools serving low-income students. This focus was guided by two factors: (1) the study’s planned focus on schools serving this population of students and (2) the need to recruit enough schools to ensure we could detect a policy-relevant improvement in student achievement. There was no intention of identifying a sample of schools that would be statistically representative of U.S. schools or low-income schools, and, in fact, it was expected that study schools would be more disadvantaged than the typical U.S. school.
1. The Focus on Low-Income Schools Was Reflected in the Search for Eligible Districts and the Ultimate Sample
Three criteria were used to identify potential districts: (1) geographic diversity, (2) number of Title I schools with high poverty rates and ample numbers of fifth-grade students, and (3) adequate numbers of willing schools. We used the Common Core of Data (CCD) to identify districts that met specific thresholds with respect to poverty and size (National Center for Education Statistics, accessed 2005). To be eligible, districts had to have at least 12 schools that (1) received Title I funds, (2) had high poverty rates (at least 40 percent of students eligible for the federal free or reduced-price lunch program), and (3) had at least 60 fifth-grade students per school. These thresholds were set to increase the likelihood of recruiting a sufficient number of high-poverty Title I schools from each district to participate, and to ensure that the Title I schools identified included enough fifth graders to support the desired minimum detectable effect.
Once the set of potential districts was identified, an intensive recruitment effort was
undertaken. The study team contacted eligible districts to find out whether they were interested in participating in the study. Beginning in January 2006, study staff visited all districts that expressed interest to describe the study and answer questions about participating. Study staff worked with district administrators to identify schools suitable for and interested in participating in the study. During this process, the study team focused on schools that were not using the reading comprehension supplements being tested in the study (or other comprehension supplements similar to those being tested).
This effort yielded a sample very close to the projected sample. The set of participating
districts and schools was identified and agreements with districts to participate in the study were obtained by August 2006. A total of 10 districts and 89 schools agreed to participate (Table I.3). The 10 districts are spread across 8 states. The number of participating schools in each district

11
ranges from 4 to 16.20 Six districts included 10 or more participating schools, and 4 districts included between 4 and 7 participating schools.
TABLE I.3
NUMBER OF DISTRICTS, SCHOOLS, TEACHERS, AND STUDENTS IN STUDY SAMPLE
Intervention Number of Districts
Number of Schools
Number of Teachers
Number of Studentsa
Project CRISS 10 17 52 1,319
ReadAbout 10 17 50 1,246
Read for Real 9b 16 54 1,227
Reading for Knowledge 10 18 53 1,191
Control Group 10 21 59 1,367
Total 10 89 268 6,350
aThis number includes all consenting students in the analysis sample in spring 2007. Over 85 percent of students in the analysis sample were tested at follow up.
bOne district did not have enough participating schools to include all four intervention groups. The interventions that were assigned in that district were selected randomly.
The districts included in the study were statistically significantly more disadvantaged, larger,
and more urban than the average U.S. district (Table I.4). In particular, study districts had a higher percentage of students eligible for free or reduced-price lunch than the average district in the United States (63 percent vs. 40 percent). Study districts included more schools (69 vs. 6) and students (38,026 vs. 3,153) than the average U.S. district. Study districts were also more likely to be in urban areas (70 percent vs. 11 percent) and less likely to be in rural areas (10 percent vs. 52 percent) than the average district.
Similar statistically significant patterns were found for the schools participating in the study
(Table I.5). For example, study schools were more likely to be eligible for Title I funds (99 percent vs. 70 percent) and almost twice as likely to be operating schoolwide Title I programs, as compared to the average U.S. school (86 percent vs. 44 percent).21 Study schools also included a higher percentage of black (37 percent vs. 17 percent) and Hispanic (30 percent vs. 19 percent) students than the average school, reflecting the more urban nature of the study districts and schools.
20In the district with four schools, three schools were randomly assigned to three randomly selected treatment
groups and one school was randomly assigned to the control group.
21Schools in which poor children make up at least 40 percent of enrollment are eligible to use Title I funds for schoolwide programs that serve all children in the school.

12
TABLE I.4
CHARACTERISTICS OF DISTRICTS IN THE STUDY
Characteristics U.S. Districtsa Districts in
Study Difference p-value Number of Schools per Districtb 6.2 69.0 -62.8* 0.00 Number of Title I Schools per District
Title I Eligible 3.3 43.8 -40.5* 0.00 Schoolwide Title I 1.9 36.6 -34.7* 0.00
District Location (Percentage)c
Urban 10.9 70.0 -59.1* 0.00 Urban fringe 25.7 20.0 5.7 0.68 Town 11.4 0.0 11.4 0.26 Rural area 52.0 10.0 42.0* 0.01
Number of Full-Time Teachers per Districtd 157 2,054 -1,897* 0.00 Number of Students per Districtb 3,130 38,026 -34,895* 0.00 Percentage of Students Eligible for Free or Reduced-Price Lunche 39.5 62.7 -23.2* 0.00
Number of Districts 16,038 10 Source: 2004–2005 Common Core of Data.
aData include districts with one or more regular schools. Regular schools are defined as public schools that do not focus primarily on vocational, special, or alternative education.
bData is missing for 2 percent of districts with at least one regular school nationwide.
cData is missing for 3 percent of districts with at least one regular school nationwide.
dData is missing for 11 percent of districts with at least one regular school nationwide and 30 percent of study districts.
eData is missing for 12 percent of districts with at least one regular school nationwide. *Statistically different at the .05 level.

13
TABLE I.5
CHARACTERISTICS OF SCHOOLS IN THE STUDY
Characteristics U.S. Schoolsa Schools in
Study Difference p-value Schools Receiving Title I (Percentage)
Title I Eligible School 70 99 -29* 0.00 Schoolwide Title I 44 86 -42* 0.00 School Location (Percentage)
Urban 31 69 -38* 0.00 Urban fringe 34 19 15* 0.00 Town 7 0 7* 0.00 Rural area 29 11 18* 0.00
Students per Teacher (Average) 16 16 0 0.87 Number of Students per School (Average) 451 552 -101* 0.00 Students Eligible for Free or Reduced-Price Lunch (Percentage) 48 77 -29* 0.00 Student Race/Ethnicity (Percentage)
White 58 31 27* 0.00 Black 17 37 -20* 0.00 Hispanic 19 30 -11* 0.00 Asian 4 2 2* 0.03 Native American 2 1 1 0.35
GRADE Score (Average) 100 100 0 1.00
Number of Schoolsb 45,293 88 Source: 2004–2005 Common Core of Data (CCD). Data from the last row of the table is from two sources: (1) the
study team’s baseline GRADE test administration and (2) national GRADE norm information provided by the GRADE test’s developer.
aData include regular primary schools that reported having fifth-grade classrooms. Regular primary schools are defined as public elementary schools that do not focus primarily on vocational, special, or alternative education.
bCCD data is missing for 1 study school. *Statistically different at the .05 level.
GRADE = Group Reading Assessment and Diagnostic Evaluation.

14
We investigated one student baseline characteristic—the baseline GRADE scores—further, because the levels observed were somewhat higher than what one might expect given the nature of the study sample. As shown in Table I.5, the average scores for study students were roughly 100, which is the average score for the nationally normed GRADE sample. One might expect average scores on the GRADE to be lower than 100 for our study sample, given the concentration of disadvantaged students in the study schools.
There are some reasonable potential explanations for why this pattern emerged, a few of
which are listed here. First, like our study sample, the norming sample used for the GRADE included a larger percentage of disadvantaged students than are found in schools nationwide. In particular, based on data provided by the GRADE test developer, in 21.3 percent of schools in the GRADE norming sample, more than half of students were eligible for free or reduced-price lunch, compared to just 14.6 percent of schools nationwide. Second, students in our study sample took about 40 minutes on average to complete the passage comprehension subtest of the GRADE, while the estimated time to complete this subtest provided by the developers of the GRADE is 25 minutes (the extra time study students took to complete the assessments could have allowed them to achieve higher scores, which could help explain the comparability of their scores to those from the students in the norming sample). Finally, 45 percent of students in our study sample are higher scoring on average than one might expect. Forty-five percent of students in our sample attended schools with average reading proficiency levels above the state average.
The integrity of the study design was maintained as the study progressed. Two treatment
schools did not end up using their assigned intervention, but follow-up student testing was conducted in both of these schools to ensure that the integrity of the study’s treatment and control groups was maintained.22 See Appendix B for diagrams showing the flow of schools and students through the study.
2. The Sample Design Ensured an 80 Percent Probability of Detecting Impacts of at Least 0.17 Standard Deviations
The study design called for a sample that enabled, with 80 percent probability, the detection of impacts whose effect size was as small as 0.25 standard deviations. This calculation was based on assumptions regarding the intraclass correlation, school- and student-level R2 (described below), and an adjustment for multiple comparisons. To attain this target effect size with 80 percent probability, the design called for recruiting 100 schools in 10 districts with 7,800 participating students. After recruitment was completed, the study was able, with 80 percent probability, to detect impacts on student test scores of at least 0.17 standard deviations. The increase in statistical power was due to a greater benefit from covariate adjustment than anticipated. We originally assumed that there would be an intraclass correlation of 0.10, and school- and student-level R2 of 0.50. The major factor contributing to the increased power was
22One school stopped implementing the intervention early in the school year when the only teacher who
attended training discontinued using the program. The other school (in another district) never implemented the program after teachers were trained; the school noted that its schedule could not accommodate the required 45 minutes of instructional time.

15
that the school-level R2 turned out to be 0.89. With respect to teacher practices, which are of interest for the descriptive, implementation analysis, the study had less power due to smaller sample sizes of teachers and larger intraclass correlations (in the range of 0.20 to 0.30). For example, the smallest difference on the Traditional Interaction scale of a single intervention that the study could detect with 80 percent probability was 0.75.23
To put this in perspective, the average gain in GRADE scores among students in the control group between baseline and followup was 0.44 standard deviations over a period of 245 calendar days. The full school year is about 270 calendar days. Assuming a constant rate of achievement gain over time, a 0.17 standard deviation gain would take about one-third of a school year (0.17/(0.44*270/245) = 0.35). The study’s ability to detect impacts as low as 0.17 standard deviations can also be compared with the findings of a meta-analysis by Rosenshine and Meister (1994), which found an average effect size of 0.32 across nine studies of the impact of multiple reading comprehension strategy instruction on standardized test scores. (This meta-analysis focused on reciprocal teaching, which involves the use of guided practice and dialogue between students and teachers to teach students about four comprehension strategies including question generation, summarization, prediction, and clarification.) Another meta-analysis by Rosenshine, Meister, and Chapman (1996) found an average effect size of 0.36 across 13 studies examining the impact of question generation on standardized test scores.
E. DATA COLLECTION ON TEACHERS, SCHOOLS, AND STUDENTS
Addressing the reading comprehension evaluation questions required collecting information about the interventions and how they were implemented, the study participants, and students’ performance outcomes. We used information about implementation of the interventions to examine the fidelity of implementation to curriculum designs, to describe teaching practices related to comprehension and vocabulary instruction, and to examine the resources required to implement the interventions. Data were collected on all three “levels” of participants—schools, teachers, and students—as a basis for describing their characteristics as they entered the study and the preparation teachers had for using the new interventions (Table I.6).24 We measured subsequent student outcomes through reading comprehension test scores. (A second year followup of this first student cohort will provide outcome measures and longer-term impact estimates from the end of sixth grade.)
1. Information on Teaching and Intervention Implementation
Three data collection activities focused on teachers, teaching, and implementation of the four reading comprehension interventions. Two of these activities involved classroom
23The minimum detectable effects reported in this paragraph are the effects that the study could detect with
80 percent probability (the standard level of power for reporting minimum detectable effects). The study could detect smaller effects with lower probability, which is why some of the reported statistically significant impacts are smaller than the effect sizes stated here.
24Appendix J includes copies of all study instruments, with the exception of the proprietary fluency and reading comprehension assessments.

16
observation. “Fidelity observations” of classes taught by treatment group teachers were conducted to determine the extent to which teachers adhered to the curriculum content and procedures prescribed by each developer. “Quality of instruction” observations were carried out, in both treatment and control group teachers’ classrooms, to record the frequency with which teachers engaged in behaviors that experts consider to be good teaching practices for vocabulary and comprehension instruction. The third data collection activity pertaining to implementation of the interventions was a survey of developers on the cost of their curricula.
TABLE I.6
SCHEDULE OF YEAR ONE DATA COLLECTION ACTIVITIES
Data Collection Activity Month
Student Reading Tests—Baseline August-October 2006
Teacher Survey August-November 2006
Classroom Observations January-April 2007
Student Reading Tests—Followup April-June 2007
School Information Form April-June 2007
Developer Survey April-May 2007
Student Records May-October 2007
Fidelity Observation Was Used to Assess Adherence to Each Intervention. To support interpretation of the impact estimates, fidelity observations were conducted to provide a picture of how thoroughly the reading comprehension interventions were delivered. A separate fidelity observation form was developed for each intervention to capture whether treatment group teachers demonstrated behaviors or performed specific instructional activities inherent to the intervention. To create the forms, the evaluation team drew from each intervention’s curriculum content and materials and then had the developer review the form to confirm that it accurately reflected the teaching practices and behaviors the developer expected as part of the curriculum’s implementation. Trained observers used the forms to record, primarily in yes/no format, the occurrence of 7 to 28 teaching practices, depending on the intervention.25, 26
The fidelity observation (one per teacher) was conducted only for teachers who reported
using the curriculum. Treatment teachers were asked to schedule an observation in the spring at a time when they would be using the reading comprehension intervention (the observations were
25For one intervention, these yes/no items were supplemented by questions about the focus of comprehension,
vocabulary, and writing instruction, the length of instructional rotations and the number of students in the rotation, and the type of program materials used.
26The fidelity forms provide data on whether teachers engaged in a behavior or not; they do not provide data on the number of times the teachers engaged in each behavior or the quality of the behaviors. See Appendix J for a copy of the fidelity forms.

17
conducted between January and April 2007). If teachers reported they had never or were no longer using the curriculum, the fidelity observation was not conducted (see Section II.C for information on the relatively minor extent to which this occurred). However, to create a full picture of the extent to which treatment teachers implemented the interventions, our analysis of implementation fidelity (presented in Chapter II) includes all teachers who were expected to implement each intervention (the analysis treats non-implementing teachers as not having engaged in the fidelity form behaviors). In particular, ones and zeros, respectively, were used in the data file to indicate whether a teacher engaged in or did not engage in a behavior listed on each curriculum’s fidelity form. For teachers who reported they had never or were no longer using the curriculum, zeros were entered in the data file for all fidelity form behavior variables.
Observation of the Quality of Instruction Provided a Basis for Assessing Differences in
Teacher Practice. Structured observation across both treatment and control classrooms was done to provide descriptive information on the teaching practices in use in study classrooms. This observation focused on behaviors that reading experts posit as contributing to reading comprehension, rather than on the procedures developed by each curriculum developer. The approach provides a snapshot of the reading instruction fifth-grade students received from teachers using expository texts. A team of experts in reading instruction and classroom observation developed an Expository Reading Comprehension Classroom Observation Instrument (referred to here as “the ERC”) to measure how much teachers used each of the vocabulary and comprehension-related teaching practices this team identified.
The ERC was designed so study team observers could record tallies of the number of times
teachers displayed the instructional behaviors.27 This approach to rating the quality of instruction was favored over the alternative approach of requiring observers to make more global judgments of the extent to which each behavior was observed, because the former approach was more likely to yield an unbiased measure of performed behaviors.
The team of reading experts determined the critical behaviors to be recorded. Based on a
review of prominent reading research, they identified the key behaviors associated with improved reading achievement, developed measures of those behaviors, and then refined the measures using trial observations of classroom teachers. Small experimental studies have suggested that “scaffolded” instruction involving the identified behaviors (in which teachers provide explicit instruction and then gradually withdraw the amount of assistance they offer to students) helps students develop foundational reading comprehension abilities (Palincsar and Brown 1984; see Rosenshine et al. 1996 for a review).
The behaviors identified for the ERC form (and the teacher practice scales based on those
behaviors) were indeed related to student test score outcomes observed in this evaluation. Two of the three scales created (the Reading Strategy Guidance and Classroom Management scales)
27Tallies (or counts) of the number of times teachers engaged in these teaching practices were used to create
scales summarizing teachers’ practices. The process of creating these scales involved three main steps: (1) coding the tallies into ordinal categories, (2) conducting an exploratory factor analysis to determine conceptual groupings of items, and (3) estimating an IRT model using the categorical variables formed in the first step. These steps are explained in detail in Section II.D and Appendix F. Appendix I presents key descriptive statistics (such as means and standard deviations) for the full set of fidelity and ERC observation items.

18
were statistically significantly related to follow-up student test scores (see Appendix F for more information on how criterion validity was assessed).
The behaviors recorded on the ERC form comprised practices related to comprehension and
vocabulary.28 Observers documented occurrences of eight comprehension-related behaviors. Some of these behaviors occur before reading (for example, activating prior knowledge); others before, during, or after reading (for example, explicit instruction on how to use comprehension strategies); and still others during or after reading (for example, asking students to justify their responses). For each behavior, observers recorded the number of times the practice occurred in the form of (1) teacher modeling, (2) teacher explaining, reviewing, providing examples, or elaborating, or (3) student practice. Six behaviors related to vocabulary were tallied. Observers noted, for example, the number of times teachers provided an explanation or definition, or the number of times teachers provided examples, contrasting examples, multiple meanings, or elaborations on student responses.
Analysis of teacher behavior data was based on observations conducted on one day—when
informational texts were used—for each treatment and control teacher. Observations were conducted in January through April 2007, so teachers had time over the first part of the school year to become familiar and practiced with the new curriculum. Study staff observed any class period in which teachers were using informational text, including reading/language arts, science, social studies, and test preparation. In departmentalized schools, all teachers who taught a given classroom of students for reading/language arts, science, or social studies were considered a teaching unit, and all were observed. Observers tallied the targeted behaviors in 10-minute intervals (recording up to 11 tallies within each interval) and observed as many intervals in which informational text was used as occurred (up to 10 intervals within each class period), to capture all instruction involving informational text. We conducted observations of 98 percent of the teachers.29
Observers participated in four days of training, and inter-rater reliability of at least 80
percent was achieved during the training. The training included detailed explanations of behavior items and practice observing videotaped classes. Each observer who achieved at least 80 percent reliability with a master trainer (defined as within one tally for each item in the time interval) was certified to conduct classroom observations for the study.
Assessments of inter-rater reliability continued during data collection to ensure that no
erosion of consistency had occurred. Pairings of a master trainer with each observer at least once during the first two weeks of observation, coupled with randomly assigned pairings of regular observers throughout the field period, provided inter-rater reliability data on 25 percent of the teachers and classrooms observed.30 A variety of measures were used to assess inter-rater reliability, including simple sums of tallies and mean tallies for each teacher across the 10-
28See Appendix J for a copy of the ERC form.
29Response rates for each arm of the study (four treatment groups and one control group) are provided in Appendix E.
30When a behavior was not observed during an interval, observers recorded a tally of zero. Reliability was computed both with and without these zeroes (the latter was done to guard against inflation of inter-rater reliability).

19
minute intervals. Later, we computed scales from the tallies (see Section II.D and Appendix F), and the inter-rater reliability for the three scales ranged from 0.94 to 0.98.
Developer Survey Provided Data on Costs of Implementing The Programs. Since
treatment schools did not have to pay to receive the reading program assigned to them for the study, we asked developers about the costs that nonstudy schools would incur to implement their program in the 2006-2007 school year. Using an ingredients approach (Levin and McEwan 2001), we identified all the items schools would need to purchase to implement and obtain support for the interventions. We then asked developers to specify the unit charge for each item, and we calculated total costs per reading comprehension program based on the quantities needed of each unit. This approach allowed us to compare (1) the implementation and support services that developers provided to study districts, schools, and teachers with what they typically provided to others outside the study purchasing their services in the 2006-2007 school year, and (2) program costs and implementation and support services provided across developers.
2. Data to Describe Teachers, Schools, and Students
An essential part of documenting study results is describing the participants and assessing the similarity of the treatment and control groups. Data collection therefore included a Teacher Survey, School Information Form, student assessments, and Student Records Form.
Teacher Survey Obtained Data on Teacher Characteristics and Attitudes. Information
about teachers was collected to strengthen the impact analysis. These data allow the study team to describe the teachers participating in the study, assess the similarity of treatment and control-group teacher characteristics, and examine the relationship between teacher characteristics and intervention impacts. The Teacher Survey included items about the teacher’s background and experience (years of experience overall and at the current school), grade levels taught, educational credentials, gender, age, and race/ethnicity. The survey also included items from School Professional Culture and Teacher Efficacy scales (see below for details on these scales). For treatment teachers only, the survey contained questions about the training they received on the study curriculum. Treatment teachers were asked to rate the training on various dimensions and to indicate how well prepared to use the curriculum they felt as a result of the training.
The survey was conducted in August through November 2006 in treatment and control
schools, as teachers began the first study year. In nondepartmentalized schools, the questionnaire was given to all fifth-grade teachers. In departmentalized schools, the survey was usually administered to reading/language arts teachers (in a few treatment schools it was given to science or social studies teachers instead because they had received the intervention training and the reading/language arts teachers had not). A response rate of 93 percent was achieved. Item responses were used to create two scales, a Teacher Efficacy scale and a School Professional Culture scale (see Appendix F for details):
• Teacher Efficacy. This scale was included on the Teacher Survey because it is
correlated with teachers’ ability to benefit from professional development (Sparks

20
1988).31 It is based on 12 items from the Teacher Survey developed for this study (items used with permission from Hoy and Woolfolk, 1993). These items ask about teachers’ attitudes about student engagement, instructional strategies, and classroom management. The reliability of the Teacher Efficacy scale was .90.
• School Professional Culture. This scale was designed to capture conditions in schools that affect quality of instruction (Consortium on Chicago School Research 1999; Carlisle 2003). It is based on 35 items from the Teacher Survey developed for this study and reflects teachers’ perceptions of the culture in their school, including relationships with colleagues, access to professional development, experiences with changes being implemented in their school, and leadership support in their school. The reliability of the School Professional Culture scale was .87.
School Information Forms Captured Data on School Characteristics. Schools provided information that could help describe the study context, contribute school-level variables to the impact analysis, and permit the study team to examine the relationship between impacts and conditions in schools. At the end of the first study year (between May and October 2007), schools were asked to complete a form with information on their enrollment and their fifth grade, the percentage of students eligible for free or reduced-price lunches, the percentage classified as ELL, the percentage falling in standard racial/ethnic categories, and whether the school had participated in Reading First the previous year. Schools also provided information on the textbooks, basal reading series, and special programs or supplementary curricula they were using for reading instruction just before the study began. The form collected school-level averages on the most recent standardized test scores in reading and math for grades 4 and 5, the tests that were given, and the test administration dates. Finally, schools provided information about their participation in any magnet programs or comprehensive school reform. Data were collected from 94 percent of the schools.
Baseline Data on Students Were Collected from Tests and Records. Data on student
achievement levels were used to characterize the student sample at baseline. Starting in the third week of school (after enrollment had settled and parental consent had been obtained), the study team administered two standardized tests to fifth graders. Table I.7 describes the norming samples and presents reliability and validity statistics for these two assessments (and a third administered at followup). Descriptions of the two baseline tests are as follows:
• The Passage Comprehension subtest of the Group Reading Assessment and
Diagnostic Evaluation (GRADE). The GRADE (published by Pearson Learning Group) is a multiple-choice, paper-and-pencil, group-administered, untimed test that measures baseline skills and student improvement in critical reading areas (Williams 2001). The Passage Comprehension subtest measures the ability to comprehend extended text as a whole, using short passages in different genres and questions that “incorporate the metacognitive strategies of questioning, predicting, clarifying, and summarizing, as well as inclusion of a variety of sentence structures” (http://www.pearsonlearning.com). A response rate of 95 percent was achieved.
31The items included on the Teacher Survey are an abbreviated version of a teacher efficacy scale (Hoy and
Woolfolk 1993; Gibson and Dembo 1984).

21
TABLE I.7
FEATURES OF TESTS USED IN THE STUDY
Characteristic Group Reading Assessment and Diagnostic Evaluation
(GRADE), Passage Comprehension Subtest Test of Silent Contextual Reading Fluency (TOSCRF) Educational Testing Service (ETS) Social Studies/Science
Reading Comprehension Assessments
General Information
Commercially available norm-referenced, group-administered reading assessment. The Passage Comprehension subtest measures students’ ability to comprehend extended text as a whole. Students read a passage and then answer multiple-choice questions about the passage. Two alternative forms are available.
Commercially available norm-referenced, group-administered assessment of silent reading fluency. The test measures the speed with which students can recognize the individual words in a series of printed passages that are printed in uppercase without punctuation or spaces between words.
Two tests developed specifically for the Evaluation of Reading Comprehension Interventions. The tests measure students’ ability to comprehend expository text; one test emphasizes the reading of science-based passages while the other emphasizes the reading of social studies-based passages. Students read a passage and then answer multiple-choice questions about the passage.
Norm Sample National norms for the full test are based on samples of students in 46 states—16,408 in spring 2000 and 17,024 in fall 2000. Norms for the fifth-grade Passage Comprehension subtest are based on 473 students in spring and 570 students in fall. The average student in the norm sample has a standard score of 100, and the standard deviation of standard scores is 15.
National norms are based on a sample of 1,898 students in 23 states tested in spring and fall of 2004. The average student in the norm sample has a standard score of 100, and the standard deviation of standard scores is 15.
Not nationally normed.
Reliability Split-half reliability coefficients for the fifth-grade Passage Comprehension are .94 for Form A and .92 for Form B. Alternate form reliability for the fifth-grade test is .89. Test-retest reliability for the fifth-grade Form A is .77 (corrected for the effects of restriction of range).
Alternate form reliabilities range from .83 to .87. Test-retest reliabilities range from .85 to .88 (corrected for the effects of restriction of range).
Internal consistency reliability (Cronbach’s Alpha) is .85 for the science test and .84 for the social studies test.
Validity Evidence of content, criterion-related, and construct validity.
Evidence of content, criterion-related, and construct validity. Not provided.
Grade Range PK – 12 2 – 12 5
Age Range Not provided. 7.0 – 18.11 Not provided.
Number of Test Items
Six passages, each with six questions. Twelve printed passages that become progressively more difficult in their content, vocabulary, and grammar.
Five passages, each with six questions.
Average Passage Length
158 words NA Science test – 391 words Social studies test – 454 words
Readability Scores
Flesch-Kincaid grade levels range from 3.9 to 8.5. Mean=6.1. Lexile measures range from 510 to 1130. Mean=803.
NA Science passages: Flesch-Kincaid grade levels range from 3.7 to 6.2. Mean=5.5. Lexile measures range from 590 to 930. Mean=850. Social studies passages: Flesch-Kincaid grade levels range from 4.6 to 5.6. Mean=5.2. Lexile measures range from 680 to 790. Mean=748.
Test Time The subtest is untimed, but the estimated time for completion is 25 minutes.
3 minutes The tests are untimed, but the estimated time for completion is 30 minutes.
Source:Hammill et al. (2006) Test of Silent Contextual Reading Fluency (TOSCRF), Examiner’s Manual, Pro Ed, Austin, TX; Williams, K. T. (2001) Group Reading Assessment and Diagnostic Evaluation (GRADE) Technical Manual, American Guidance Service, Inc., Circle Pines, MN. Information about the science and social studies tests was provided in a technical report provided by ETS. NA = not available.

22
• Test of Silent Contextual Reading Fluency (TOSCRF). This paper-and-pencil, group-administered, timed test measures skills such as word identification, word meaning, and sentence structure, all of which are important for reading comprehension. Commonly known as the “slasher test,” this assessment presents words using uppercase letters without any spaces or punctuation and requires students to insert slashes between letters to distinguish words (http://www.proedinc.com). Since the test allows students only three minutes for completion, it was conducted on the same day as the baseline GRADE test. Ninety-four percent of students completed the TOSCRF test.
The study team also asked schools to provide data on each student. Although these data were collected at the end of fifth grade, some stable items that serve as baseline student characteristics were obtained. The data included date of birth, gender, race/ethnicity, ELL and disability status, and eligibility for free or reduced-price lunch. Districts abstracted most or all of these data from their databases, with some data gathered manually by school staff or local study team staff. Overall, we obtained records for 96 percent of students.
3. Data Used to Measure Student Outcomes
Data on student outcomes were collected from two sources at the end of the fifth-grade year (between April and June 2007). First, students were retested using the GRADE (Williams 2001) and an 88 percent completion rate was achieved. Second, students were tested for comprehension of social studies and science text, using assessments developed specially for the study.
The Educational Testing Service (ETS) developed tests to assess comprehension of
informational text, drawing from its item bank and creating some new items (Educational Testing Service 2007a and 2007b). The multiple-choice, paper-and-pencil, group-administered, untimed assessments included either social studies or science passages. The questions asked about the passages’ main idea, significant details, vocabulary, and author’s purpose, and asked students to draw inferences. To reduce burden, half the students were randomly assigned to take the science test and half to take the social studies test. Generally, the tests were conducted within the same week (but not on the same day) in which the GRADE was administered. Eighty-seven percent of students completed the science or social studies test.
4. Year 2 Data Collection
A second-year extension of the study, with two main components, is also being conducted. The first component follows students from the study’s first year for one more year, using the same follow-up outcome measures, to examine the extent to which impacts of the interventions are sustained over time. The second component essentially repeats the first year of the study for three of the four interventions with a new cohort of fifth graders to assess whether the interventions are more effective after schools and teachers have had one year of experience using them. Results from Year 2 of the study will be presented in a later report.

23
II. IMPLEMENTATION FINDINGS
Assessing program implementation is an important ingredient in impact studies of educational interventions. Early evaluations of federal educational programs often demonstrated minimal or null effects, but in some instances it was found that the programs being tested had not really been implemented (Charters and Jones 1973). This observation led to ambitious studies of the implementation of educational programs, such as Follow Through (Stallings 1975) and Title I (Cooley and Leinhardt 1980). In impact studies, understanding the extent and quality of implementation can help researchers interpret statistically significant impact results (or the absence of impacts), form hypotheses about whether and how subsequent implementation experiences might yield different impact results, and understand whether schools are able to implement the interventions in a way that is consistent with developer recommendations.
In this study, implementation refers to teacher practices and behaviors, which can be
measured from two perspectives. The most common perspective focuses on assessing the extent to which teachers demonstrate adherence to procedures or practices deemed critical for implementing a particular curriculum or intervention design. Checklists of practices essential to proper implementation are specified by the curriculum developer or by others, based on the features of the particular curriculum. This approach is appealing because it corresponds to the common understanding of “program implementation,” and the rating scales and checklists can be easy for observers to complete.
However, this method also has several drawbacks (Gersten et al. 2000). Developers often
find it difficult to identify the critical elements of their intervention. There can be variation in the level of detail they specify, and corresponding variation in the specificity and detail of the guidance that curricula give teachers. Some developers’ materials are detailed and exacting, while others allow teachers great latitude. These differences correspond to variation in the level of detail that observers can be asked to look for in the classroom. As a result, 80 percent implementation of Intervention A may not be equivalent to, or as difficult to achieve as, 80 percent implementation of Intervention B. Quality differences may also go unnoted; two teachers may achieve identical scores, one following procedures in rote fashion and the other in a dynamic, interactive, engaging fashion.
The alternative perspective involves a common observational system to assess teaching
practices, regardless of the details of the curricula or interventions observed. For example, the Project Follow Through study of seven instructional models (Stallings 1975) used a common observational procedure to describe reading and mathematics instruction in classrooms operating under the seven intervention models as well as control group classrooms.
A common observational system has advantages related to the “common lens” trained on the classroom, whatever the name or stated philosophical underpinnings associated with the intervention being studied. Researchers have used this approach to examine the instructional practices associated with enhanced academic outcomes, using the same definition of practices, regardless of the intervention (for example, Cooley and Leinhardt 1980; Rosenshine and Stevens 1986; Dynarski et al. 2007; Glazerman et al. 2008). In a multi-treatment impact study, consistent

24
definitions of practices make it possible to use the measures of implementation to describe how the various treatments differ and how they differ from the control condition, and to use them as mediating variables in the impact analysis.
Both approaches were used in this evaluation. We developed and used a procedural fidelity
form for each of the four interventions to gauge whether teachers did in the classroom what the curriculum developers prescribed. We also developed a common observational system for use in all intervention and control classrooms when students and teachers were working with informational text, to record the frequency of behaviors that earlier research suggested were associated with enhanced comprehension outcomes. In Sections A and B below, we summarize the features of the four interventions and the extent of preparation and training the teachers in the intervention classrooms received. Section C focuses on the results of the intervention-specific fidelity analysis, and Section D presents descriptive information on teacher practices, including comparisons of educational practices across treatment and control groups using three scales derived from the observational data.
A. INTERVENTION FEATURES
All four study interventions share a set of common comprehension strategies, instructional strategies, and student activities, but there are some differences in emphasis (Table II.1) and cost. All of the interventions focus on teaching students four core reading comprehension strategies (although they are not always labeled in the same way):
• Elements of text structure. This strategy involves identifying and using the structure
and organization of text to help improve comprehension. Elements of text structure include headings, subheadings, visuals, and graphics; organizational elements include cause and effect, compare and contrast, problem and solution, and sequencing. Project CRISS calls this strategy “author’s craft.” ReadAbout refers to “reading skills,” while Read for Real calls this practice “interacting with text” and Reading for Knowledge considers these elements to be part of the “predicting strategy.”
• Self-questioning. This strategy involves asking oneself questions about the text before, during, and after reading as a way to improve comprehension. Project CRISS and Read for Real call this “setting a purpose,” while ReadAbout and Reading for Knowledge call this “questioning.”
• Clarifying understanding. This strategy involves methods for clarifying the meaning of words, sentences, or passages that a student does not understand. These behaviors are called “fix-up strategies” by Project CRISS, “monitoring, rereading, or repairing” by ReadAbout, “clarifying understanding” by Read for Real, and simply “clarifying” by Reading for Knowledge.
• Summarizing. The summarizing strategy involves identifying the main ideas and important details in a passage and listing them orally or in writing. ReadAbout and Reading for Knowledge call this summarizing, Project CRISS calls it “organizing strategies,” and Read for Real labels it “recalling.”

25
TABLE II.1
SUMMARY OF READING COMPREHENSION PROGRAMS
Program/ Developer Program Focus Teacher Training Instructional Componentsa Student Materials Project CRISS/ CRISS
Focuses on five metacognitive Keys to Learning to help students become strategic learners: (1) background knowledge, (2) purpose setting, (3) author’s craft (text structure), (4) active involvement (writing, discussion), and (5) organization (transforming information using writing and graphic organizers).
18 hours of initial training, 6 hours of follow-up training. Monthly trainer visits to each school to observe teachers and provide feedback. CRISS Cornerstones manual and DVD provide follow-up lessons for teacher learning community teams. Includes administrator and parent training components.
• Teacher’s edition of Learning How to Learn provides detailed lesson plans for each chapter. Recommended use for 30-45 minutes per day.
• Strategies are learned and practiced using Tough Terminators, a science trade book.
• Uses variety of graphic organizers and note-taking, discussion, vocabulary, and writing strategies.
• Students apply strategies to regular science and social studies texts.
Student book, Learning How to Learn, includes 19 chapters in a four-step format: (1) prepare, (2) be involved, (3) organize, and (4) apply. Each chapter focuses on two to four learning strategies.
ReadAbout/ Scholastic
Students are taught 10 comprehension skills: identifying author’s purpose, identifying cause & effect, comparing & contrasting, drawing conclusions, distinguishing fact & opinion, locating main idea & details, making inferences, identifying problem & solution, sequencing events, and summarizing. Students also learn seven reading strategies: visualizing, setting a purpose, monitoring, rereading, summarizing, questioning, and repairing.
Six hours of initial training (plus access to the online course, Improving Reading Comprehension), six hours of follow-up training in the fall, six hours of follow-up training in the spring.
• Adaptive computer software used three times per week for 20 minutes. Software teaches comprehension skills, vocabulary, and content knowledge.
• Students use offline materials once per week for 20 minutes. Offline materials include whole-class or small-group lessons on comprehension skills, vocabulary strategies, text types, or writing skills. Students rotate among computer, teacher-led, and independent reading groups.
• Teacher materials include suggestions for English Language Learners and differentiated instruction.
Three core components are (1) a software program, (2) SmartFile topic cards (supplemental print articles), and (3) a content library of science and social studies trade books. Reading passages are classified by three topics (science, social studies, and life), and five reading bands with Lexile ranges. Includes an assessment and writing topic at the end of each reading topic.

26
Program/ Developer Program Focus Teacher Training Instructional Componentsa Student Materials Read for Real/ Zaner-Bloser
Each unit focuses on (1) a Before Reading strategy (previewing, activating prior knowledge, or setting a purpose), (2) a During Reading strategy (making connections, interacting with text, or clarifying understanding), and (3) an After Reading strategy (recalling, evaluating, or responding).
12 hours of initial training, which includes an overview of research-based reading strategies as well as training on using the curriculum. Follow-up includes six hours of on-site training, plus telephone support and an online teacher support forum.
• Each unit has three reading selections for students to learn, practice, and apply a comprehension strategy.
• Lessons take 30-45 minutes per day.
• Teacher Guide includes a script for guiding reading and discussion of each story, activities for English Language Learners, writing activities, and comprehension tests.
Read for Real literacy series has six leveled books for Grades 3-8. Each book has six units, and each unit has three reading selections. New vocabulary words are defined in sidebars and a student “reading partner” in the text models thinking about each strategy. Vocabulary, writing, and fluency activities follow each reading selection. Includes unit tests and answer keys.
Reading for Knowledge/ Success for All (SFA)
Program focuses on four key comprehension strategies: (1) clarifying, (2) predicting, (3) summarizing, and (4) questioning. Includes vocabulary building strategies in each lesson.
12 hours of initial training, six hours of follow-up training, and quarterly teacher meetings with SFA trainer. Four professional development videos guide teacher learning community meetings.
• Detailed daily lesson plans for 17 units (eight days each) covering 136 lessons. Lessons take 45 minutes per day.
• Lessons follow same process: Set the stage, Active instruction, Teamwork (paired reading, team talk), and Reflection (teams share with class).
• The four key strategies are introduced to students using video-based lessons.
• Major cooperative learning component in the program.
Reading comprehension strategies are taught using a Student Edition for each strategy, a Video Viewing Guide, a set of science and social studies trade books, Strategy Practice sheets, and Strategy Cue cards to encourage transfer of skills to other content reading. Includes unit tests and answer keys.
aThe amount of time reported for lessons is based on programs’ recommended usage, not on actual usage by teachers in the study.
Table II.1 (continued)

27
Two of the curricula, however, go beyond these core strategies and provide students with additional comprehension tools (see box below for a summary of the intervention features discussed in this section). Project CRISS and Read for Real also teach students to think (before they start reading or while they are reading) about what they already know concerning the topic. They call this strategy variously “background knowledge,” “activating prior knowledge,” or “making connections.”
All of these interventions also have certain instructional methods or student activities in
common. For example, all of the curricula include teacher-directed instruction; such instruction can include explaining, modeling, and guided practice. Delivering the four interventions also involves student practice activities, such as having students read aloud or complete worksheets or graphic organizers.
Other instructional methods figure in three of the four curricula. Three of the programs
(Project CRISS, ReadAbout, and Reading for Knowledge) have students practice their reading skills and strategies as they read selected science and social studies trade books. All of the programs except Project CRISS provide assessments at the end of each unit. Two programs use technology as a teaching tool and for student practice—ReadAbout includes adaptive computer software and Reading for Knowledge includes four videotapes that introduce and model the program’s four reading strategies. Reading for Knowledge also includes a cooperative learning component in which teachers track individual and team participation “points” to provide incentives for both individual and group effort.
Although the four curricula tested in the evaluation have much in common substantively,
they are offered to educators under different pricing structures (Table II.2). One developer includes all curriculum components in one price, while the others list separate prices for various
SUMMARY OF INTERVENTION FEATURES
Project CRISS ReadAbout
Read for Real
Reading for Knowledge
Comprehension Strategies Identification of text structure √ √ √ √ Self-questioning √ √ √ √ Clarifying understanding √ √ √ √ Summarizing √ √ √ √ Activating prior knowledge √ √
Instructional Methods and Student Activities Teacher-directed instruction √ √ √ √ Student practice √ √ √ √ End-of-unit assessments √ √ √ Practice skills using content-area trade book(s) √ √ √ Technology used as teaching tool √ √ Cooperative learning component √

28
TABLE II.2
PROGRAM COSTS
Costs Project CRISS ReadAbout Read for Real Reading for Knowledge
Base Cost Program components are purchased separately
Licenses:a $6,000/60 students and two classroom kits; $9,500 for 100 students and three kits; $19,500/360 students and 12 kits. Kits include teacher materials (Topic Planners [cards that preview the ReadAbout software passages and vocabulary]; Know About ReadAbout Guide; assessments, reports, and the Differentiated Instruction Guide; the ReadAbout Software Manual; the SAM software manual; and the SAM Reference Guide) and classroom materials for students (SmartFiles [cards that extend the software], a poster, and Bonus Card Stickers). Each school receives Professional Papers, ReadAbout Installation Kits, and an SRI Installation Kit. Licenses also cover initial teacher training.
Program is purchased by buying the program materials: $475.75/ classroom (25 students); $18.99/extra copy
Program cost not yet known (the curriculum was adapted from Success for All for the study during the pilot year)
Costs Not Included in Base Cost
Initial Training
$45/person if district provides trainer; $55/person with national trainer, plus $800/day per trainer (for two to four days of training), plus travel expensesb
No additional cost for the one day of initial training No additional cost if entire district is participating; otherwise, $1,000/day (two days) per trainer, plus travel expenses
No additional cost for the two days of initial training
Follow-up Training
$800/day trainer honorarium (for one to two days of training), plus the trainer’s travel expensesb
$2,500/one-day training for up to about 20 teachers ($2,000/ 1/2-day seminar x two seminars = $4,000 x 37 percent discount for multiple seminars = $2,500; for 2 or more trainings, there is a 44 percent discount)
No follow-up training No additional cost for the one day of follow-up training
Additional Services and Support
Parent workshop: Cost per booklet, $4 for 1-50 parents, $3 for 51-200 parents, and $2 for 201+ parents Email and telephone consultation were added for schools in the study
$2,500/school for technology installationc $2,800/school for premium technical support (web, telephone, emails)d
A website with an electronic bulletin board, a helpdesk, and email or telephone consultation were added for schools in the study
No additional cost for quarterly visits in which a trainer observes and then meets with each teacher to discuss goal setting, planning, and other feedback; or email and group teleconferencing
Materials Optional: Classroom set, $550: one teacher’s manual with Critterman DVD, 31 Tough Terminators (student book), and 30 student workbooks; extra student book, $10; extra student workbook, $8; video, $445 each; posters, $125/set of 30 posters; administrator materials, $55/each; Cornerstones (follow-up booklet and CD-ROM for teachers’ independent use), $35/each
No additional materials No additional materials No additional materials
Source: Developer Interviews: Reading Program Costs and Services. aLicenses are valid in perpetuity. bTypically districts use their own trainers after the first year, but if insufficient capacity was built during the first year, districts can continue to pay for national trainers. cInstallation costs are a one-time fee. dThere is a premium technical support discount of 15 percent for 11 to 20 schools, 25 percent for 21 to 30 schools, 30 percent for 31 to 50 schools, 35 percent for 51 to 80 schools, and 40 percent for 81 or more schools.

29
curriculum components. For example, to implement Read for Real, districts would pay one price for all program materials (based on the number of participating classrooms), with teacher training and support included in that amount. To implement ReadAbout, districts would pay a per-classroom price that would encompass licenses, classroom kits, and initial training. For Project CRISS, on the other hand, districts would pay separate prices for training and for optional materials. The Reading for Knowledge developer was unable to provide a purchase price because the program was adapted from Success for All for the study and its pricing structure had not yet been determined.
Despite these differences in pricing arrangements, it is possible to discern how prices vary
across curricula and for districts of different sizes. Costs for the intervention programs range from roughly $3,000 up to $187,000, depending on the size of the school district and certain standardizing assumptions (Table II.3). Costs that would have been incurred by non-study districts to purchase these programs in the 2006-2007 school year range from about $3,000 to almost $14,000 for a sample small district to about $34,000 to $187,000 for a sample large district, after various discounts for districts with many schools have been considered. The costs for all the programs would drop after the first year, when materials have been purchased, software has been installed, and experienced teachers within the district may be able to provide some or all of the training. Costs would fall most dramatically for ReadAbout, since its licenses (the most expensive component of the program) are valid in perpetuity.
B. TEACHER TRAINING AND SUPPORT
The training that prepares teachers to implement a new curriculum can be an important determinant of how well they deliver it, and thus whether and how it affects student outcomes. In this evaluation, developers trained teachers in the treatment group schools. Understanding this training and the extent to which teachers participated in it can inform our interpretation of the interventions’ estimated impacts on student outcomes. This information also can contribute to our understanding of the observed differences in teacher practices between the treatment and control groups, since differences in practice could be expected to emerge only if a large percentage of teachers participated in the training (see Section D of this chapter for information on the comparison of treatment and control group teaching behaviors).
Implementing the interventions involved training and support for teachers (see Table II.4).
On average, the developers’ training plans called for providing treatment group teachers with two days or 12 hours of initial training on using the intervention curricula. The initial training prescribed for the interventions ranged from 6 hours for ReadAbout to 18 hours for Project CRISS. Two-thirds of initial intervention training sessions were held in the summer before the school year started.32
All of the curriculum developers’ training plans called for providing follow-up training and
support to maintain and continue building teacher skills in using the interventions. An average of 7.5 hours of follow-up training were prescribed by the developers of the interventions, ranging from 6 hours (Project CRISS, Read for Real, Reading for Knowledge) to 12 hours (ReadAbout).
32The timeline for the initial training is shown in Appendix D.

30
TABLE II.3
ESTIMATED PROGRAM COSTS FOR TYPICAL SMALL, MEDIUM, AND LARGE DISTRICTS
District Size Project CRISS (in Dollars)a ReadAbout (in Dollars)b Read for Real (in Dollars)c Reading for Knowledge
Small (districts with < 2,500 students); assumptions: • One elementary school • Two fifth-grade teachers • 50 students and parents
0 Base cost 2,510 Initial training 800 Follow-up training 200 Additional support 1,100 Materials 4,610 Total
6,000 Base cost 0 Initial training 2,500 Follow-up training 5,300 Additional support 0 Materials 13,800 Total
952 Base cost 2,000 Initial training 0 Follow-up training 0 Additional support 0 Materials 2,952 Total
Program cost not yet known (the curriculum was adapted from Success for All for the study during the pilot year).
Medium (districts with 2,500-9,999 students); assumptions: • Four elementary schools • 12 fifth-grade teachers • 300 students and parents
0 Base cost 3,060 Initial training 800 Follow-up training 600 Additional support 6,600 Materials 11,060 Total
19,500 Base cost 0 Initial training 2,500 Follow-up training 21,200 Additional support 0 Materials 43,200 Total
5,709 Base cost 2,000 Initial training 0 Follow-up training 0 Additional support 0 Materials 7,709 Total
Program cost not yet known (the curriculum was adapted from Success for All for the study during the pilot year).
Large (districts with >10,000 students); assumptions: • 17 elementary schools • 68 fifth-grade teachers • 1,700 students and parents
0 Base cost 8,540 Initial training 1,600 Follow-up training 3,400 Additional support 37,400 Materials 50,940 Total
97,500 Base cost 0 Initial training 6,720 Follow-up training 82,960 Additional support 0 Materials 187,180 Total
32,351 Base cost 2,000 Initial training 0 Follow-up training 0 Additional support 0 Materials 34,351 Total
Program cost not yet known (the curriculum was adapted from Success for All for the study during the pilot year).
aAssumptions: A national trainer is provided for three days of initial training and one day of follow-up training; one trainer would be used for the small and medium district; two trainers would be used for the large district; the trainers’ travel expenses would be in addition to the amounts shown. The optional classroom set is purchased.
bAssumptions: Licenses come in packets at $6,000 for 60 students, $9,500 for 100 students, and $19,500 for 360 students. The small district requires a set of 60 licenses, the medium district a set of 360 licenses, and the large district five sets of 360 licenses. The small and medium districts receive a 37 percent discount on the follow-up training, and the large district (which requires three follow-up trainings to train the 68 teachers) receives a 44 percent discount. The large district also qualifies for a 15 percent discount on premium technical support since it has 17 schools.
cAssumptions: One trainer would be used for the small and medium district; two trainers would be used for the large district; the trainers’ travel expenses would be in addition to the amounts shown.

31
TABLE II.4
SUMMARY OF TEACHER TRAINING
Initial Training Follow-Up Training and Ongoing Support
Project CRISS
18 hours of initial training, which includes 12 hours on using the strategies in the teacher’s guide and 6 hours on using the student text and workbook. Teachers receive a training manual, teacher’s guide, student text, and a wrap-around edition of the student workbook.
Six hours of follow-up training. Monthly trainer visits to each school to observe teachers and provide feedback. Developer encourages teachers to use bi-weekly study teams in which teachers review and discuss their use of CRISS strategies.
ReadAbout
Six hours of initial training covering program components (computer software, SmartFiles, Topic Planners), reading strategies, and test data interpretation.
12 hours of follow-up training (6 hours in the fall and 6 hours in the spring) to provide more in-depth understanding of program components and strategies and to provide instruction in using student data to make instructional decisions.
Read for Real
12 hours of initial training on connecting to prior knowledge, active reading strategies, vocabulary, text analysis, graphic organizers, Know-Want to Know-Learned (KWL), and using writing to assess comprehension.
Six hours of follow-up training. Telephone support and online teacher support forum.
Reading for Knowledge 12 hours of initial training, which includes an overview of the 4 critical comprehension strategies as well as instruction in cooperative learning and monitoring strategy use.
Six hours of follow-up training. Developer encourages teachers to meet once per month to discuss program implementation. Each quarter SFA trainer attends teacher meetings, provides support and feedback (on-site and by phone), and observes reading and content area classes.

32
In addition to the formal follow-up training, the plan for providing ongoing support to teachers using Project CRISS called for monthly visits to each school to observe teachers and offer feedback. The plan for providing ongoing support to teachers using Reading for Knowledge called for quarterly onsite visits. All developers’ plans for providing ongoing support to teachers called for the provision of telephone support to answer teachers’ questions during the implementation year.
Over 90 percent (91 to 100 percent) of the teachers in treatment group schools participated
in the initial training sessions provided by the developers (see Table II.5). Teacher participation ranged from 91 percent (Read for Real) to 100 percent (Project CRISS and ReadAbout). Less than 6 percent (0 to 5 percent) of these teachers were trained by developers in makeup sessions after the initial training, because they were hired after the initial group training or had schedule conflicts at the time of the initial training. Statistical tests comparing the percentage of teachers trained in the four intervention groups showed no statistically significant differences between the groups (Table II.6).
TABLE II.5
TEACHER TRAINING PARTICIPATION AND PREPARATION (Percentage)
Project CRISS ReadAbout Read for Real
Reading for Knowledge
Percentage of Teachers Traineda
100
100
91
96
Percentage of Teachers Reporting that the Initial Training Prepared Them to Implement the Curriculum
Not at all 0 0 0 0 Somewhat 31 28 20 44 Very well 69 72 80 56
Number of Teachers 52 50 54 53 Source: Teacher training stipend claim forms, Teacher Survey. aThree developers (Project CRISS, ReadAbout, and Reading for Knowledge) provided nonstandard training for teachers who missed the original training sessions. The nonstandard training involved working with teachers individually to cover content they missed.
After training, all teachers reported feeling “somewhat” or “very well” prepared to use their assigned intervention. Approximately 70 to 80 percent of the Project CRISS, ReadAbout, and Read for Real teachers reported feeling “very well” prepared by the initial training to implement the intervention, while 56 percent of the Reading for Knowledge teachers reported feeling very well prepared (Table II.5).33 None of the teachers reported feeling “not at all” prepared.
33Teacher Survey comments about the Reading for Knowledge training suggest a variety of reasons why 44 percent of the Reading for Knowledge teachers may have reported feeling only “somewhat prepared” after training. These comments include too much material being covered in two days of training, more practice time being needed during training, and too much time elapsing between the training and intervention implementation.

33
Statistical tests comparing the distribution of teachers’ feelings of preparedness in the four intervention groups showed one statistically significant difference between the groups (Table II.6). Read for Real teachers were statistically significantly more likely than Reading for Knowledge teachers to report feeling very well prepared by the training to implement the curriculum (80 percent vs. 56 percent).
TABLE II.6
DIFFERENCES IN TRAINING PARTICIPATION AND PREPARATION BETWEEN TREATMENT TEACHERS
(Percentage)
Differences in Means Between
Project CRISS and
ReadAbout and
Read for Real and
ReadAboutRead for
Real
Reading for
Knowledge
Read for
Real
Reading for
Knowledge
Reading for
Knowledge Percentage of Teachers Traineda 0 9 4 9 4 -5 (.) (.) (.) (.) (.) (0.29)
Percentage of Teachers Reporting that the Initial Training Prepared Them to Implement the Curriculum
Not at all 0 0 0 0 0 0* (0.80) (0.20) (0.28) (0.38) (0.22) (0.01)
Somewhat 3 12 -12 9 -15 -24* (0.80) (0.20) (0.28) (0.38) (0.22) (0.01)
Very well -3 -12 12 -9 15 24* (0.80) (0.20) (0.28) (0.38) (0.22) (0.01) Source: Teacher training stipend claim forms, Teacher Survey. Note: The p-values from tests of differences in treatment-group means are presented in parentheses. These tests
account for clustering of teachers within schools. P-values could not be obtained when most of the teachers in a treatment group were trained. This is indicated by a (.).
aThree developers (Project CRISS, ReadAbout, and Reading for Knowledge) provided non-standard training for teachers who missed the original training sessions. The non-standard training involved working with teachers individually to cover content they missed.
*Statistically different at the .05 level.

34
In addition to examining the extent to which treatment group teachers reported participating in the specific training sessions on using the study interventions, the study also collected information on participation of all teachers (both treatment and control) in more broadly defined professional development activities in the 12 months prior to data collection. Because the Teacher Survey in which this data was collected was conducted in fall 2006, the 12 months prior to the survey included the period during which the initial training on the use of the study interventions was conducted. Because the professional development reported by teachers could include any training, including the study intervention training received by treatment group teachers, one might hypothesize that the study would observe higher rates of professional development in reading instruction for treatment group teachers than for control group teachers. Comparisons of the treatment and control group teachers confirm this hypothesis, showing a difference in teachers’ participation in professional development in reading instruction across the treatment and control groups. Statistical tests were used to compare treatment and control group teachers’ participation in professional development in reading instruction. This comparison showed that treatment group teachers reported participating in reading instruction professional development in the past 12 months at a statistically significantly higher rate than control group teachers (Table II.7). Across all treatment groups, 92 percent of teachers reported having participated in professional development in reading instruction during the previous 12 months, compared to 78 percent of control group teachers. ReadAbout teachers were also statistically significantly more likely to report participating in reading instruction professional development than control group teachers (94 percent vs. 78 percent).
Statistical tests showed statistically significantly more reported hours of reading instruction
professional development for combined treatment group teachers than control group teachers. (The categories for number of hours of professional development shown in Table II.7 correspond to the categories teachers used to record their responses on the study’s Teacher Survey.) For example, 26 percent of the combined treatment group teachers reported 17 to 32 hours of reading instruction professional development, compared with 14 percent of control group teachers. Reported hours were also statistically significantly higher for ReadAbout and Reading for Knowledge teachers than control group teachers. For example, 27 percent of ReadAbout teachers and 25 percent of Reading for Knowledge teachers reported 17 to 32 hours of reading instruction professional development, compared with 14 percent of control group teachers.
No statistically significant differences between three of the four individual treatment groups
(Project CRISS, Read for Real, or Reading for Knowledge) and the control group were observed in teachers’ reported participation in reading instruction professional development, but observed differences are all in the expected direction (Table II.7). Statistical comparisons of teachers’ reported participation in (and hours of) reading instruction professional development between the treatment groups were also statistically insignificant (Table II.8), reflecting the roughly comparable extent of training offered by the developers (see Table II.4).
C. OBSERVED FIDELITY OF IMPLEMENTATION
Interpreting impacts requires knowing the extent to which the interventions were implemented as intended. Fidelity observations were conducted in spring of the 2006-2007 school year (see Chapter I) to assess whether treatment group teachers were implementing the procedures of the intervention assigned to their school. Fidelity observations were conducted in

35
TABLE II.7
PARTICIPATION OF TREATMENT AND CONTROL TEACHERS IN READING INSTRUCTION PROFESSIONAL DEVELOPMENT
Control Group
Project CRISS ReadAbout
Read for Real
Reading for Knowledge
Combined Treatment
Group Percentage of Teachers Who Participated in Reading Instruction Professional Development in the Last 12 Monthsa 78 90 94* 92 90 92* (0.07) (0.02) (0.09) (0.16) (0.01) Percentage of Teachers Who Reported the Following Hours of Reading Instruction Professional Development
0 22 10 6* 8 10* 8* (0.14) (0.03) (0.34) (0.04) (0.01)
1 to 8 32 31 37* 29 16* 28* (0.14) (0.03) (0.34) (0.04) (0.01)
9 to 16 16 16 24* 24 37* 25* (0.14) (0.03) (0.34) (0.04) (0.01)
17 to 32 14 29 27* 24 25* 26* (0.14) (0.03) (0.34) (0.04) (0.01)
33 or More 16 14 6* 16 12* 12* (0.14) (0.03) (0.34) (0.04) (0.01)
Number of Teachersb 59 52 50 54 53 209 Source: Teacher Survey. Note: The p-values from statistical tests of differences in treatment and control group means are presented in
parentheses. These tests account for clustering of teachers within schools.
aThe Teacher Survey was conducted in the fall. Professional development could include any training, including study intervention training for treatment groups.
bThe number of teachers presented in this row is the number of teachers participating in the study. Response rates for the calculations presented in the table vary from 94 percent to 95 percent, and the median response rate is 94 percent.
*Statistically different from the control group at the .05 level.

36
TABLE II.8
DIFFERENCES IN PARTICIPATION IN READING INSTRUCTION PROFESSIONAL DEVELOPMENT ACROSS TREATMENT GROUPS
Differences in Means Between
Project CRISS and ReadAbout and
Read for Real and
ReadAbout
Read for Real
Reading for Knowledge
Read for Real
Reading for Knowledge
Reading for Knowledge
Percentage of Teachers Who Participated in Reading Instruction Professional Development in the Last 12 Monthsa –4 –2 0 2 4 2 (0.47) (0.73) (1.00) (0.77) (0.54) (0.76) Percentage of Teachers Who Reported the Following Hours of Reading Instruction Professional Development
0 4 2 0 –2 –4 –2 (0.52) (0.84) (0.14) (0.45) (0.21) (0.45)
1 to 8 –5 2 16 7 21 14 (0.52) (0.84) (0.14) (0.45) (0.21) (0.45)
9 to 16 –9 –8 –22 1 –13 –14 (0.52) (0.84) (0.14) (0.45) (0.21) (0.45)
17 to 32 3 6 4 3 1 –2 (0.52) (0.84) (0.14) (0.45) (0.21) (0.45)
33 or More 8 –2 2 –10 –6 4 (0.52) (0.84) (0.14) (0.45) (0.21) (0.45)
Source: Teacher Survey. Note: The p-values from statistical tests of differences in means are presented in parentheses. These tests account
for clustering of teachers within schools.
aThe Teacher Survey was conducted in the fall. Professional development could include any training, including study interventions for treatment groups.

37
all treatment classrooms in which the teachers reported using the interventions. We did not observe the handful of teachers in each intervention group (5 to 11 teachers per group) who reported not using the interventions.34 Fidelity observations were not conducted for these teachers because the goal of the fidelity analysis was to measure teachers’ adherence to the specific set of procedures deemed important by developers for implementing each intervention model. Therefore, teachers who reported not implementing the interventions would not be adhering to the curriculum model if they happened to implement practices suggested by the curriculum model. (Data are not available to assess whether these teachers unintentionally implemented practices suggested by the curricula models.) When analyzing the fidelity observation data, we assumed that these teachers did not implement any of the procedures listed on their assigned treatment group’s fidelity form. This procedure was followed to ensure that the fidelity data reflect the full sample of teachers assigned to each intervention.
Over 80 percent (81 to 90 percent) of teachers reported using the intervention assigned to
their school. The percentage of teachers reporting use of the interventions ranged from 81 percent (Read for Real) to 91 percent (Project CRISS) (Tables II.9 through II.13).
Below, we present information on the extent to which treatment group teachers were
observed to be implementing the procedures of the intervention assigned to their school. We present this information separately for each intervention because each intervention had a set of intervention-specific practices that the developer deemed important for implementation.
Project CRISS. On average, Project CRISS teachers were observed engaging in 78 percent
of the teaching practices considered important to implementation of the intervention (Table II.9). Project CRISS teachers were assessed based on eight items. Project CRISS teachers engaged most frequently in asking students to read a written text (81 percent), leading students in transforming informational activities (80 percent), including informal or formal writing in transforming informational activities (74 percent), and using transforming activities to teach the content of the lesson (74 percent). Sixty-one to 65 percent of teachers engaged in the warm up/background knowledge activities, and 44 percent of teachers engaged in metacognitive awareness activities.
Read for Real. The Read for Real intervention involved two types of instructional days,
both of which were observed for the study. On Read for Real “Learn” days (days on which teachers modeled the comprehension strategies for students), Read for Real teachers were assessed based on 25 items. On Read for Real “Practice” days (days on which the teachers worked with students as they practiced the comprehension strategies), Read for Real teachers were assessed based on a similar protocol with 17 items.
On average, on the “Learn” days, Read for Real teachers were observed engaging in 71
percent of the teaching practices deemed important by developers for implementing Read for Real (Table II.10). Read for Real teachers observed on the “Learn” days had the highest rates of implementation on “During Reading” activities (55 to 64 percent). For example, the highest level of implementation was for the item related to reading the selected passage (64 percent), and
34The more general observations of teaching practices relating to vocabulary and comprehension instruction were conducted for these teachers.

38
TABLE II.9
FIDELITY OF IMPLEMENTATION FOR THE PROJECT CRISS CURRICULUM (Percentage)
Percentage of Teachers Who Reported Using Project CRISS
90.74
Percentage of Teachers Who Were Observed to Have Done the Following During the Time When Their Classes Were Observed:a
Provide instruction or lead activities to generate background knowledge about a topic or concept before students read about it 64.81
Help students set goals and determine a purpose before beginning to read 61.11 Have students read a written text 81.48 Lead students during and/or after reading in transforming information activities (for example,
graphic organizer, guided discussion) 79.63 Include informal or formal writing in the transforming activities (including note-taking) 74.07 Use the transforming activities to teach the content of the lesson 74.07 Discuss or reflect on students’ metacognitive processes during the transforming activities 44.44 Lead the whole class in a reflection discussion at the end of the lesson using questions such as: —b
(A) Metacognition: How did you evaluate your comprehension? (B) Background knowledge: Did I assist you in thinking about what you already knew? (C) Purpose setting: Did you have clear purposes? (D) Active involvement: How were you actively engaged? (E) Discussion: How did discussion clarify your thinking? (F) Writing: How did you use writing to help you learn? (G) Transformation: What were the different ways you transformed information? How did this help you? (H) Teacher modeling: Did I do enough modeling?
Percentage of Teachers Who Were Observed Implementing:a
80 to 100 percent of the fidelity form behaviors listed above 59.26 40 to 79 percent of the fidelity form behaviors listed above 29.63 0 to 39 percent of the fidelity form behaviors listed above 11.11
Mean Percentage of the Fidelity Form Behaviors Listed Above that Teachers Were Observed Implementing 77.76
Sample Size 54
Source: Classroom observations.
aFidelity observations were conducted only for teachers implementing the assigned curricula; however, all teachers are included in these calculations. We assumed that teachers who were not implementing the curricula did not engage in the activities listed in this table.
bValue suppressed to protect teacher confidentiality.

39
TABLE II.10
FIDELITY OF IMPLEMENTATION FOR THE READ FOR REAL CURRICULUM (Percentage)
Learn Observation Days
Practice Observation Days
Percentage of Teachers Who Reported Using Read for Real 80.70 80.70 Percentage of Teachers Who Were Observed to Have Done the Following During the Time When Their Classes Were Observed:a
Before Reading Reads or asks a student to read the explanation of the Before Reading focus strategy 50.00 51.42 Discusses the strategy with students 40.91 51.42 Reads or asks a student to read the information in the My Thinking box 50.00 n.a. Asks students to apply the strategy 40.91 54.29 Discusses students’ comments n.a. 45.71
During Reading
Reads or asks a student to read the explanation of the During Reading focus strategy 54.55 45.71 Discusses the strategy with the students 59.09 n.a. Reads or asks a student to read the information in the My Thinking box (notes from the
reading partner) 54.55 40.00 Asks students to share their thinking about the strategy 54.55 n.a. Reminds students to write notes about the strategy n.a. 34.29 Stops and addresses the My Thinking notes at the “red strategy buttons” 59.09 65.71 Reads and/or asks students to read the selection 63.64 65.71
After Readingb
Reads or asks a student to read the After Reading focus strategy 31.82 22.86 Discusses or asks questions about the strategy 22.73 20.00 Reads or asks a student to read the information in the My Thinking box 18.18 n.a. Gives a written assignment highlighting the After Reading focus strategy n.a. 14.29 Calls on students to implement the After Reading focus strategy 13.64 n.a.
Comprehension
Administers the open book comprehension test —c —c Corrects tests with the class —c —c Discusses responses —c —c
Organizing Information
Reads or asks a student to read the information from the reading partner 18.18 n.a. Discusses the graphic organizer 27.27 n.a. Asks students to complete graphic organizer n.a. 11.43
Writing for Comprehension
Reads or asks a student to read the information from the reading partner 13.64 n.a. Reads or asks a student to read the summary 18.18 n.a. Asks students to write a summary based on their completed graphic organizer n.a. —c Identifies how the paragraphs and sentences in the summary correspond to the information
on the graphic organizer 13.64 n.a. Discusses the three parts of a summary
Introduction 18.18 n.a. Body 18.18 n.a. Conclusion 18.18 n.a.
Percentage of Teachers Who Were Observed Implementing:a
80 to 100 percent of the fidelity form behaviors listed above 63.64 40.00 40 to 79 percent of the fidelity form behaviors listed above 18.18 22.86 0 to 39 percent of the fidelity form behaviors listed above 18.18 37.14
Mean Percentage of the Fidelity Form Behaviors Listed Above that Teachers Were Observed Implementing 71.45 54.90
Sample Size 22 35
Source: Classroom observations. aFidelity observations were conducted only for teachers implementing the assigned curricula; however, all teachers are included in these calculations. We assumed that teachers who were not implementing the curricula did not engage in the activities listed in this table.
bThe vocabulary and fluency items have been left out of the table because developers noted they were not essential for implementation of the Read for Real intervention.
cValue suppressed to protect teacher confidentiality.
n.a. = not applicable.

40
55 to 59 percent of teachers were observed reading about and discussing the comprehension strategy for that day, reading the My Thinking boxes and notes,35 and asking students to share their thoughts on the strategy. Fourteen to 50 percent of teachers implemented “Before Reading” (41 to 50 percent) and “After Reading” activities (14 to 32 percent).
On average, on the Read for Real “Practice” days, teachers were observed engaging in
55 percent of the practices deemed important by developers for implementing the intervention (Table II.10). The highest rates of implementation on the Read for Real “Practice” days were for items related to “During Reading” activities, such as reading the selected text and addressing the My Thinking notes while reading (66 percent for each). Forty-six to 54 percent of teachers were observed implementing the “Before Reading” preparatory activities, and 14 to 23 percent of teachers were observed implementing “After Reading” activities.
ReadAbout. On average, ReadAbout teachers were observed engaging in 71 percent of the
teaching practices considered important to the implementation of ReadAbout (Table II.11). The highest rates of implementation were observed for teachers using the ReadAbout materials and implementing the computer workstation activities (79 percent), providing direct instruction on comprehension or vocabulary skills (74 percent), and providing students with opportunities to apply comprehension or vocabulary skills (77 percent). Fifty-one percent of teachers were observed using Independent Workstations; however, the developer did not consider using them essential for implementing the ReadAbout curriculum with fidelity. The two 6+1 Writing Trait activities were never observed, because teachers were not trained to use them until the last day of the follow-up training (which is typically not conducted until April, after the classroom observations were conducted).36
Reading for Knowledge. Like Read for Real, the Reading for Knowledge intervention
involved two types of instructional days, both observed for the study. Fidelity on days 1 and 3, which involved teacher-directed instruction, was assessed based on 9 items. Fidelity on days 2 and 4, which involved students working in cooperative groups, was based on 13 items.37
35My Thinking boxes are found in the “Learn” sections of the student textbook. They contain “think alouds,”
which provide a model of the thinking process the reading partner used to implement the strategy. Either the teacher or the student reads the think aloud in the My Thinking box as they progress through the “Learn” lesson. “Practice” day lessons include Interact with Text boxes, which prompt students to write notes on how they used the focus strategy.
36Like Read for Real, ReadAbout instruction involved both “Learn” and “Practice” selections. In ReadAbout’s Learn selections (which focus primarily on teaching students the strategies), the 6+1 Writing Trait activities involve providing students with an outline or graphic organizer containing information addressed in the text. Students are also provided with a model of a summary based on the outline/graphic organizer. In ReadAbout’s Practice selections (which focus primarily on students practicing the strategies), the 6+1 Writing Trait activities involve the teacher guiding students in finishing a partially completed outline or graphic organizer, which students use to write a summary of the selection.
37On days 1 and 3, teachers were observed to assess whether they built background knowledge, explained a strategy, read text aloud, and helped students think of or apply a strategy. On days 2 and 4, teachers were observed to assess whether they used whole group and partner activities, provided feedback and prompts to partner pairs, charted student progress, reviewed routines, read questions aloud, circulated around the classroom, and asked teams to share with the class.

41
TABLE II.11
FIDELITY OF IMPLEMENTATION FOR THE READABOUT CURRICULUM (Percentage)
Percentage of Teachers Who Reported Using ReadAbout 86.79 Percentage of Teachers Who Were Observed to Have Done the Following During the Time When Their Classes Were Observed:a
Used the ReadAbout materials 79.25 Computer workstation used 79.25 Independent workstation used 50.94 Provided direction instruction (explain and/or model) on the comprehension or vocabulary
strategy or skill 73.58 Provided opportunities for students to apply the comprehension or vocabulary skill (guided
practice) 77.36 Provided students instruction on the selected 6+1 Writing Trait 0.00 Provided opportunities to apply the 6+1 Writing Trait Model 0.00
Percentage of Teachers Who Were Observed Implementing:a
80 to 100 percent of the fidelity form behaviors listed above 62.26 40 to 79 percent of the fidelity form behaviors listed above 18.87 0 to 39 percent of the fidelity form behaviors listed above 18.87
Mean Percentage of the Fidelity Form Behaviors Listed Above that Teachers Were Observed Implementing 71.42
Sample Size 53
Source: Classroom observations.
aFidelity observations were conducted only for teachers implementing the assigned curricula; however, all teachers are included in these calculations. We assumed that teachers who were not implementing the curricula did not engage in the activities listed in this table.
On average, on teacher-directed instruction days, Reading for Knowledge teachers were observed implementing 58 percent of the teaching practices deemed important by developers for Reading for Knowledge implementation (Tables II.12). On the teacher-directed instruction days, Reading for Knowledge teachers had the highest rates of implementation (67 to 71 percent) on activities related to building background knowledge about the topic of the text or about a skill or strategy and explaining or reviewing the skill/strategy. Fifty-two to 57 percent of teachers were observed presenting the reading goal, awarding cooperation/improvement points, and following the recommended pacing.
On days 2 and 4, when students were working in cooperative groups, Reading for
Knowledge teachers were observed implementing, on average, 65 percent of the teaching practices that developers considered important to the implementation of the intervention (Table II.13). On days 2 and 4, Reading for Knowledge teachers had the highest rates of implementation on activities related to presenting the reading goal, discussing key points about the day’s skill/strategy, providing feedback and prompts to student pairs during partner reading, circulating in the classroom and monitoring team discussions, and asking team members to share with the class (76 to 88 percent). The lowest rates of implementation for Reading for Knowledge

42
TABLE II.12
FIDELITY OF IMPLEMENTATION FOR THE READING FOR KNOWLEDGE CURRICULUM, DIRECT INSTRUCTION OBSERVATION DAYS
(Percentage)
Percentage of Teachers Who Reported Using Reading for Knowledge 83.33 Percentage of Teachers Who Were Observed to Have Done the Following During the Time When Their Classes Were Observed:a
Post the reading goal 38.09 Present the reading goal 57.14 Present the cooperative learning goal 38.09 Ask students to review vocabulary or provide practice and instruction (Exception: This is
not done on the first day of a new unit.) —b Build background knowledge about the topic of text or about a skill/strategy 66.67 Explain a skill/strategy or remind students of a skills/strategy recently learned 71.42 Read the text aloud and (1) think aloud or model a skill/strategy or (2) ask the students to
apply a skill/strategy 52.38 Follow the recommended pacing for the lesson 57.14 Award cooperation and/or improvement points during lesson 52.38
Percentage of Teachers Who Were Observed Implementing:a
80 to 100 percent of the fidelity form behaviors listed above 38.10 40 to 79 percent of the fidelity form behaviors listed above 38.10 0 to 39 percent of the fidelity form behaviors listed above 23.81
Mean Percentage of the Fidelity Form Behaviors Listed Above that Teachers Were Observed Implementing 57.90
Sample Size 21
Source: Classroom observations.
aFidelity observations were conducted only for teachers implementing the assigned curricula; however, all teachers are included in these calculations. We assumed that teachers who were not implementing the curricula did not engage in the activities listed in this table.
bValue suppressed to protect teacher confidentiality.

43
TABLE II.13
FIDELITY OF IMPLEMENTATION FOR THE READING FOR KNOWLEDGE CURRICULUM, COOPERATIVE GROUPS OBSERVATION DAYS
(Percentage)
Percentage of Teachers Who Reported Using Reading for Knowledge 83.33 Percentage of Teachers Who Were Observed to Have Done the Following During the Time When Their Classes Were Observed:a
Post the reading goal 60.61 Present the reading goal 87.88 Present the cooperative learning goal 66.67 Ask students to review vocabulary or provide practice and instruction (Exception: This is
not done on the first day of a new unit.) 54.55 Use a whole group or partner activity to discuss key points about the day’s skill/strategy 81.82 Provide feedback and prompts to partner pairs during partner reading 81.82 Chart individual students’ progress on the setting goals and charting progress forms during
partner reading 27.27 Review routines for Team Talk discussion 51.52 Read aloud Team Talk questions 60.61 Circulate through the classroom and monitor team discussions and provide prompts 78.79 Ask team members to share with the class their responses and reasoning to Team Talk
questions 75.76 Follow the recommended pacing for the lesson 54.55 Award cooperation and/or improvement points during lesson 60.61
Percentage of Teachers Who Were Observed Implementing:a
80 to 100 percent of the fidelity form behaviors listed above 33.33 40 to 79 percent of the fidelity form behaviors listed above 45.45 0 to 39 percent of the fidelity form behaviors listed above 21.21
Mean Percentage of the Fidelity Form Behaviors Listed Above that Teachers Were Observed Implementing 65.24
Sample Size 33
Source: Classroom observations.
aFidelity observations were conducted only for teachers implementing the assigned curricula; however, all teachers are included in these calculations. We assumed that teachers who were not implementing the curricula did not engage in the activities listed in this table.

44
teachers on days 2 and 4 were found on practices related to charting individual students’ progress on the goal-setting and progress-charting forms during partner reading (27 percent).
D. READING COMPREHENSION INSTRUCTIONAL PRACTICES
In this section, we turn to an examination of data from the ERC observation form, which (as described in Chapter I) was designed to gather information on the number of times treatment and control group teachers engaged in a set of general (non-intervention-specific) teaching practices related to reading comprehension and vocabulary instruction. This is in contrast to the fidelity observation forms just discussed, which focused on teaching practices specific to each intervention. The ERC form instead focused on a set of more general teaching practices that teachers might use when instructing students on reading comprehension and vocabulary.
Constructing Teacher Practice Scales. Consistent data from both treatment and control
group classrooms make it possible to describe and compare teachers’ instructional practices. The ERC observation form allowed the study team to tally the number of times treatment and control group teachers engaged in specific teaching behaviors. There were up to 294 opportunities to record observed teaching practices (28 practices assessed in each of up to 10 intervals, plus a set of 14 items assessed once during an observation). The study team thus needed to condense this data into a manageable number of variables for analysis in order to obtain a coherent, summary picture of teachers’ behavior. To condense the data on teachers’ instructional practices, we developed summary scales using the following three steps:
1. Coding tallies for each item into ordinal categories. To support subsequent
psychometric analyses—particularly the implementation of Item Response Theory (IRT) scaling discussed in step 3 below—ordinal categories were created for the distributions of both sums and averages of tallies (or number of times teachers engaged in a specific teaching practice) across the 10-minute intervals for each item. These categories were based on an investigation of the distributions of the sums and averages of tallies for each item. These ordered categories represented the extent to which each teacher practice was observed, where higher categories represented teachers engaging in the particular practice more frequently. For example, if the average number of tallies for all teachers across intervals ranged from 0 to 10 for a particular item, the average tally for a particular teacher might have been assigned to one of three categories (0-3, 4-6, and 7-10) depending on the average number of times across intervals the teacher was observed engaging in that behavior.38
2. Conducting an exploratory factor analysis. Exploratory factor analysis (EFA) was conducted to identify the underlying variables that best explain the ERC data. Factor extraction was conducted using unweighted least squares estimation; oblique rotation was used because it was expected that the underlying variables would be correlated
38The ordered categories were then assigned numerical values. For each item, a value of zero was assigned to
the lowest category. Values for subsequent categories were assigned by increasing the number of the previous category by one until the highest category was reached. In the example provided in the text, teachers in the 0-3 category were assigned a value of 0, teachers in the 4-6 category were assigned a value of 1, and teachers in the 7-10 category were assigned a value of 2.

45
(our analysis ultimately confirmed this expectation). This analysis enabled us to develop conceptual groupings of items that appeared related to the same underlying concept or theme. Items that contributed little to the coherence of these groupings were discarded.39
3. Estimating an Item Response Theory (IRT) model using the categorical variables formed in step 1. IRT scaling was performed to obtain an estimated score for each teacher. The Multidimensional Random Coefficients Multinomial Logit Model (Adams et al. 1997) was used because: (1) it allowed us to properly model the cross-loadings of items as indicated by the EFA (six items cross-loaded on two of the scales) using a within-item multidimensionality modeling approach,40 which permitted us to properly address the ways in which the ERC items were interrelated; (2) it maximized the amount of data we were able to use to construct the scales compared to using a unidimensional IRT model; and (3) it enabled us to properly account for the fact that some of our items have shared question stems. The IRT scaling also permitted a rigorous assessment of the psychometric properties of the items of the ERC form, as well as the unbiased estimation of scores and level of reliability for each teacher’s score and for the distribution of scores overall. Scale scores ranged from 405 to 562 (see Table F.3 for the range for each scale).41
This process resulted in three scales that were used in the study’s analyses.42 The ERC items were distributed across these scales, and, as noted above, some items contribute to more than one scale. The results from the factor analysis show that items contribute to the scales with different degrees of weight, depending on the degree to which the items are related to the underlying concepts measured by the scales. (See Table II.14 for a listing of the ERC items contained in each scale.) Names were assigned to these scales based on the items they include and the weight that specific items take on in each scale based on the results from the factor analysis. The distinct items in each scale and the overlap between them were as follows:
39The EFA methods just described were used for items on Part I of the ERC. For Part II ERC items, EFA was
not necessary because there were clear groupings of items that shared similar content themes.
40Adams et al. (1997) explain that the Multidimensional Random Coefficients Multinomial Logit Model can address two kinds of multidimensionality of assessment data: between-item multidimensionality and within-item multidimensionality. Between-item multidimensionality occurs when particular items load only on a single scale, but there are multiple scales due to the presence of multiple underlying dimensions. Within-item multidimensionality occurs when particular items load on more than one scale due to cross-loadings. The ERC data on this study exhibit both between-item and within-item multidimensionality.
41A description of the IRT approach used to develop instructional practices summary scales is also provided in Appendix F.
42Two additional scales that were created in this process were not used in the study’s analyses due to concerns
over their reliability or inter-rater reliability. For one of these scales, reliability was the concern (with values of .43 for the version of the scale based on averages of teacher practice tallies and .58 for the version of the scale based on sums of tallies). For the other scale, inter-rater reliability was the concern (with values of .69 for the version of the scale based on averages of tallies and .73 for the version based on sums of tallies).

46
TABLE II.14
ERC ITEMS CONTAINED IN STUDY SCALES
Scales
Item Traditional Interaction
Reading Strategy Guidance
Classroom Management and Student Engagement
Comprehension Items Teacher Explains Text Structure √ Students Practice Use of Text Structure √ Teacher Models Comprehension Strategies √ Teacher Explains Comprehension Strategies √ Students Practice Comprehension Strategies √ Teacher Explains How to Generate Questions √ √ Students Practice Generating Questions √ √ Teacher Explains Text Features √ √ Students Practice Using Text Features √ √ Teacher Asks Students to Justify Responses √ √ Teacher Asks Questions Based on Material in Text
Beyond a Literal Level √
Teacher Elaborates Concepts During and After Reading √
Vocabulary Items Teacher Provides Definition or Explanation √ Teacher Provides Examples / Multiple Meanings √ Teacher Uses Visuals / Pictures √ Teacher Teaches Word-Learning Strategies √ √ Students Asked to Do Something Requiring Word
Knowledge √
Student Given Chance to Apply Word-Learning Strategies √
Other Items Teacher Maximized Instruction Time √ Teacher Managed Student Behavior √ Student Engagement – First Half of Observation √ Student Engagement – Second Half of Observation √

47
• Traditional Interaction. This scale, which captures interactive teaching practices that have been in use for many decades in American schools (Durkin 1978-1979; Brophy and Evertson 1976), is based on 13 teaching behaviors and the interactions with students that they involve (6 practices related to vocabulary and 7 to comprehension instruction). The unique items on this scale include practices related to teachers asking questions based on material in text beyond a literal level; elaborating concepts during and after reading; providing definitions, examples, and examples of multiple meanings; using visuals and pictures; asking students to work on tasks requiring word knowledge; and giving students the opportunity to apply word learning strategies.
• Reading Strategy Guidance. This scale, which reflects more heavily practices involving explicit comprehension strategies, includes 11 items. The unique items on this scale include practices related to teachers explaining and modeling (and students practicing) comprehension strategies and text structure (for example, cause-effect or compare-contrast) to improve comprehension.
• Classroom Management and Student Engagement. This scale includes one item related to how teachers manage student behavior, one item related to maximizing instructional time, and two items related to students’ engagement during class.
• Overlapping Items. Six items are contained in both the Traditional Interaction scale and the Reading Strategy Guidance scale because the results from the exploratory factor analysis (conducted to identify groupings of items related to the same underlying concept) showed that the items loaded on both scales. These items include practices related to teachers (1) explaining (and having students practice) the use of question generation and text features (for example, captions or subheadings) to improve comprehension, (2) asking students to justify their responses, and (3) teaching word-learning strategies.
The reliability of each of the three scales was assessed. The reliability of the Traditional Interaction scale was .70, the reliability of the Reading Strategy Guidance scale was .72, and the reliability of the Classroom Management scale was .83.43
Findings. For two of the three scales (Classroom Management and Reading Strategy Guidance), there were no statistically significant differences in teaching practices between the treatment and control groups (Table II.15). However, we did find a statistically significant difference on the Traditional Interaction scale, with teachers in the combined treatment group
43See Appendix F for additional information on the reliability, inter-rater reliability, and validity of the
observation scales. Appendix F also provides figures showing how the scale score values can be interpreted and linked back to the items contained in the scales.

48
TABLE II.15
DIFFERENCES IN SPRING CLASSROOM PRACTICES BETWEEN TREATMENT AND CONTROL GROUP TEACHERS
Difference Between Each of the Following and the Control Group:
Control Group Mean
Project CRISS ReadAbout
Read for Real
Reading for
Knowledge
Combined Treatment
Group
Traditional Interaction Scale Difference 502.83 –4.34* –4.04 –3.27 –3.08 –3.68* Effect Size –0.61 –0.57 –0.46 –0.44 –0.52 p-value 0.04 0.26 0.23 0.32 0.02
Reading Strategy Guidance Scale Difference 498.24 1.98 2.46 1.45 1.86 1.97 Effect Size 0.26 0.33 0.19 0.25 0.26 p-value 0.88 0.88 0.98 0.91 0.44
Classroom Management Scale Difference 502.54 –1.24 –14.92 –2.89 –5.83 –6.85 Effect Size –0.04 –0.42 –0.08 –0.17 –0.19 p-value 1.00 0.07 1.00 0.95 0.38
Number of Teachersa 59 52 50 54 53 209
Source: Classroom observations. Note: The scales presented in this table were constructed to capture the frequency of the behaviors in each
instructional practice domain shown above. For each scale, the number reported in the column labeled “Control Group Mean” is the actual average value of the scale for the control group, not a regression-adjusted mean. The numbers reported in the remaining columns are, by row, (1) the difference in means between treatment and control group, (2) the effect size, and (3) the p-value of the difference. Regression-adjusted differences were calculated taking into account the clustering of teachers within schools. Variables in this model include baseline GRADE and TOSCRF scores, student ethnicity and race, student English language learner status, school location, teacher race, and district indicators. Smaller scale values represent lower levels of behaviors in the instructional practice domain, while larger values represent higher values of the behaviors. See Appendix F for more information on interpreting the scale score values.
aThe number of teachers presented in this row is the number participating in the study. Some teachers taught more than one class. The calculations presented in the table are based on the number of classrooms observations for which scale scores were calculated. The response rates for these calculations vary from 91 percent for CRISS classrooms to 100 percent for Read for Real classrooms.
*Statistically different from the control group at the .05 level. GRADE = Group Reading Assessment and Diagnostic Evaluation. TOSCRF = Test of Silent Contextual Reading Fluency.
49
having lower levels than control group teachers on the scale (effect size: -0.52).44 The pattern of treatment-control differences on this scale was consistent for the four individual treatment groups, but the difference was statistically significant only for teachers in one of the interventions, Project CRISS (effect size: -0.61). No statistically significant differences in teaching practices were observed across the treatment groups (see Table II.16).
Sensitivity Tests to Assess the Robustness of the Findings. Similar results were found
with a different approach to summarizing the behavior tallies. The results presented above in this section are based on teacher instructional practices scales constructed using averages of tallies across classroom observation intervals for each teacher and item. To test the robustness of these findings, we conducted a sensitivity analysis in which scales were constructed using sums of tallies across intervals. The analysis based on sums was conducted in all other respects using the same method as the analysis based on averages. Differences between treatment and control group teachers on these scales were similar to those presented above (see Appendix Table H.6). In particular, we found two statistically significant differences on the Traditional Interaction scale: (1) teachers in the combined treatment group had lower levels than control group teachers (effect size: -0.51) and (2) Project CRISS teachers had lower levels than control group teachers (effect size: -0.70).
As an additional sensitivity analysis, we considered a different set of teacher instructional
practices scales. These scales were constructed by grouping all items pertaining to teaching comprehension to create a Teaching Comprehension scale, and all items regarding teaching vocabulary to create a Teaching Vocabulary scale. (The reliability of these scales was .56 and .68, respectively.) These scales were also created in two ways: using sums and using averages of tallies from the classroom observations. On the Teaching Comprehension scale, treatment group teachers’ scores were lower than those of control group teachers, but differences were not statistically significant (Appendix Table H.7). Differences on the Teaching Vocabulary scale were in the same direction and statistically significant, suggesting that teachers in the treatment group were less likely than teachers in the control group to engage in vocabulary-related teaching practices. In particular, teachers in the combined treatment group had statistically significantly lower Teaching Vocabulary scale scores compared with control group teachers (effect sizes of -0.50 and -0.55 for scales based on averages and sums, respectively). In addition, Project CRISS teachers had statistically significantly lower Teaching Vocabulary scale scores compared with control group teachers (effect sizes of -0.72 and -0.89 for scales based on averages and sums, respectively).
To further examine the statistically significant differences observed on the Traditional
Interaction scale, we examined treatment/control differences on the 13 ERC items on which this
44To help interpret the treatment-control difference observed on the Traditional Interaction scale, it is useful to link the difference in scale scores to the corresponding differences in the frequency categories used to characterize teachers’ engagement in the individual behaviors underlying each scale. Figures F.1.A and F.1.B in Appendix F relate this difference based on the scales to the underlying frequencies of the specific behaviors making up the scale. For both the treatment and control groups, the mean scale scores resulted from behaviors whose mean frequency fell within the lowest category for each of the items underlying the scale. The appendix figures show that teachers in both groups, on average, were engaging in these behaviors fewer than once during each 10-minute interval they were observed, which means that the difference between the treatment and control groups amounted to less than one time during the typical 10-minute interval.

50
TABLE II.16
DIFFERENCES IN SPRING CLASSROOM PRACTICES ACROSS TREATMENT GROUP TEACHERS
Difference Between
Project CRISS and
ReadAbout and Read for
Real and
ReadAbout Read for
Real Reading for Knowledge
Read for Real
Reading for Knowledge
Reading for Knowledge
Traditional Interaction Scale Difference –0.30 –1.07 –1.26 –0.77 –0.96 –0.19 Effect Size –0.04 –0.15 –0.18 –0.11 –0.14 –0.03 p–value 1.00 1.00 0.99 1.00 1.00 1.00
Reading Strategy Guidance Scale Difference –0.48 0.52 0.12 1.01 0.60 –0.40 Effect Size –0.06 0.07 0.02 0.13 0.08 –0.05 p–value 1.00 1.00 1.00 1.00 1.00 1.00
Classroom Management Scale Difference 13.68 1.65 4.59 –12.03 –9.08 2.94 Effect Size 0.39 0.05 0.13 –0.34 –0.26 0.08 p–value 0.18 1.00 0.99 0.31 0.57 1.00 Source: Classroom observations. Note: The scales presented in this table were constructed to capture the frequency of the behaviors in each
instructional practice domain shown above. For each scale, the numbers reported are, by row, (1) the difference in means of the two relevant curricula, (2) the effect size, and (3) the p-value of the difference. Variables in this model include baseline GRADE and TOSCRF scores, student ethnicity and race, student English language learner status, school location, teacher race, and district indicators. Smaller scale values represent lower levels of behaviors in the instructional practice domain, while larger values represent higher values of the behaviors. See Appendix F for more information on interpreting the scale score values.
*Statistically different at the .05 level. GRADE = Group Reading Assessment and Diagnostic Evaluation. TOSCRF = Test of Silent Contextual Reading Fluency.

51
scale is based, both for each treatment group separately and for the combined treatment group. Examining these individual items can provide a better understanding of the differences in specific teaching practices. To ensure that the p-values from this analysis are comparable to the p-values reported for the Traditional Interaction scale in Table II.15 (where p-values were adjusted for three outcomes), each p-value from this sensitivity test was computed taking into account three outcomes. Comparability in the approach to adjusting p-values is important because the purpose of this analysis is to better understand which specific components of the Traditional Interaction scale are driving the overall differences between the treatment and control groups, and using a different standard of significance in this analysis would make that comparison more difficult.45 In addition to adjusting the p-values for the number of outcomes, it is necessary to adjust the p-values to account for the number of comparisons between groups that are being conducted. In particular, for the comparisons of each treatment group and the control group, the results are adjusted for 12 comparisons because models are being estimated for each of the four intervention groups for each of the three outcomes. For the combined treatment group, the results are adjusted for three comparisons (because there is a single group being compared to the control group for each of the three outcomes).
These analyses show that the differences observed on the Traditional Interaction scale were
driven mainly by differences in teaching practices related to vocabulary instruction. In particular, 30 percent (9 of 30) of the differences estimated on teaching practices related to vocabulary instruction were statistically significant (with lower levels for the treatment group than the control group), compared to just 11 percent (4 of 35) of the differences estimated on teaching practices related to comprehension instruction (Table II.17). Statistically significant differences were found for the following vocabulary-related teaching practices (in all cases, treatment group teachers engaged in these practices less than did control group teachers):
• Teachers providing definitions or explanations, which was statistically significant for
Project CRISS, Reading for Knowledge, and the combined treatment group (effect sizes: -0.70, -0.52, and -0.45, respectively)
• Teachers providing examples, contrasting examples, multiple meanings, and elaborations on student responses, which was statistically significant for the combined treatment group (effect size: -0.46)
• Teachers using visuals, pictures, gestures related to word meaning, facial expressions, or demonstrations to discuss word meaning, which was statistically significant for Project CRISS (effect size: -0.37)
• Teachers teaching word learning strategies, which was statistically significant for Project CRISS, Read for Real, and the combined treatment group (effect sizes: -0.58, -0.56, and -0.32, respectively)
45The three outcomes are: (1) the Reading Strategy Guidance scale (see table II.15), (2) the Classroom
Management scale (see table II.15), and (3) one of the specific items contained in the Traditional Interaction scale. For example, for the first row in Table II.17, p-values are adjusted for (1) the Reading Strategy Guidance scale, (2) the Classroom Management scale, and (3) the classroom observation item listed in that row (the extent to which teachers explain how to generate questions).

52
TABLE II.17
DIFFERENCES IN SPRING CLASSROOM PRACTICES BETWEEN TREATMENT AND CONTROL GROUP TEACHERS FOR ITEMS CONTAINED IN THE TRADITIONAL INTERACTION SCALE
Difference Between Each of the Following and the Control Group:
Control Group Mean
Project CRISS ReadAbout
Read for Real
Reading for
Knowledge
Combined Treatment
Group
Comprehension Items
Teacher Explains How to Generate Questions (Item 4b) Difference 0.29 0.03 –0.07 –0.16 –0.08 –0.07 Effect Size 0.06 –0.18 –0.42 –0.19 –0.18 p-value 1.00 0.97 0.18 0.96 0.43
Students Practice Generating Questions (Item 4c) Difference 0.49 0.06 –0.08 –0.22 –0.08 –0.08 Effect Size 0.10 –0.13 –0.35 –0.13 –0.13 p-value 1.00 1.00 0.68 1.00 0.83
Teacher Explains Text Features (Item 5b) Difference 0.18 –0.08 0.03 0.06 0.01 0.01 Effect Size –0.32 0.11 0.21 0.06 0.02 p-value 0.69 1.00 0.97 1.00 1.00
Students Practice Using Text Features (Item 5c) Difference 0.20 –0.13 0.07 0.10 0.15 0.06 Effect Size –0.32 0.17 0.24 0.37 0.14 p-value 0.27 0.91 0.68 0.61 0.62
Teacher Asks Students to Justify Responses (Item 6c) Difference 0.22 0.02 –0.03 –0.05 0.06 –0.00 Effect Size 0.05 –0.09 –0.15 0.18 –0.00 p-value 1.00 1.00 0.99 0.98 1.00
Teacher Asks Questions Based on Material in Text Beyond a Literal Level (Item 7c) Difference 1.40 –0.69 –0.68 –0.51 –0.62 –0.63* Effect Size –0.45 –0.44 –0.33 –0.40 –0.41 p-value 0.06 0.21 0.30 0.10 0.02
Teacher Elaborates Concepts During and After Reading (Item 8) Difference 1.71 –0.70* –0.72 –0.37 –0.77* –0.65* Effect Size –0.45 –0.46 –0.24 –0.49 –0.42 p-value 0.03 0.09 0.85 0.02 0.01
Vocabulary Items
Teacher Provides Definition or Explanation (Item 1) Difference 0.95 –0.55* –0.24 –0.23 –0.40* –0.35* Effect Size –0.70 –0.31 –0.29 –0.52 –0.45 p-value 0.00 0.54 0.46 0.02 0.01
Teacher Provides Examples / Multiple Meanings (Item 2) Difference 1.44 –0.75 –0.73 –0.71 –0.73 –0.73* Effect Size –0.47 –0.46 –0.45 –0.46 –0.46 p-value 0.08 0.33 0.10 0.18 0.05

53
Difference Between Each of the Following and the Control Group:
Control Group Mean
Project CRISS ReadAbout
Read for Real
Reading for
Knowledge
Combined Treatment
Group
Teacher Uses Visuals / Pictures (Item 3) Difference 0.55 –0.37* –0.38 –0.35 –0.33 –0.36 Effect Size –0.37 –0.38 –0.35 –0.33 –0.36 p-value 0.04 0.29 0.08 0.35 0.06
Teacher Teaches Word-Learning Strategies (Item 4) Difference 0.13 –0.13* –0.04 –0.13* –0.02 –0.07* Effect Size –0.58 –0.19 –0.56 –0.07 –0.32 p-value 0.00 0.85 0.00 1.00 0.03
Students Asked to Do Something Requiring Word Knowledge (Item 5) Difference 2.15 –1.09 –1.10 –0.89 –0.86 –0.99* Effect Size –0.49 –0.49 –0.40 –0.38 –0.44 p-value 0.05 0.21 0.21 0.30 0.05
Student Given Chance to Apply Word-Learning Strategies (Item 6) Difference 0.12 –0.08 0.12 –0.05 0.09 0.03 Effect Size –0.22 0.34 –0.15 0.26 0.09 p-value 0.90 0.99 1.00 0.90 0.93
Number of Teachersa 59 52 50 54 53 209
Source: Classroom Observations.
Note: Each item presented in this table captures the average number of times within a 10-minute interval that the behavior listed was observed throughout the observations conducted in a classroom. For each item, the number reported in the column labeled “Control Group Mean” is the actual average value of the item for the control group, not a regression-adjusted mean. The numbers reported in the remaining columns are, by row, (1) the difference in means between treatment and control group, (2) the effect size, and (3) the p-value of the difference. Regression adjusted differences were calculated taking into account the clustering of teachers within schools. To ensure that the p-values from this table are comparable to the p-values reported for the difference on the Traditional Interaction scale in Table II.15 (where p-values were adjusted for three outcomes), each p-value from this table was computed taking into account differences on three outcomes. (Comparability in the approach to adjusting p-values is desired because the purpose of the analysis shown in this table is to better understand which specific components of the Traditional Interaction scale are driving the overall difference, and using a different standard of significance in this table would make that comparison more difficult.) The three outcomes are: (1) the Reading Strategy Guidance scale (see table II.15), (2) the Classroom Management scale (see table II.15), and one of the specific items contained in the Traditional Interaction scale. For example, for the first row in this table, p-values are adjusted for (1) the Reading Strategy Guidance scale, (2) the Classroom Management scale, and (3) the classroom observation item listed in that row (the extent to which teachers explain how to generate questions). In addition to adjusting the p-values for the number of outcomes, it is necessary to adjust the p-values to account for the number of comparisons between groups that are being conducted. In particular, for the comparisons of each treatment group and the control group, the results are adjusted for 12 comparisons because differences are estimated for each of the 4 intervention groups for each of the 3 outcomes. For the combined treatment group, the results are adjusted for 3 comparisons (since there is a single group being compared to the control group for each of the 3 outcomes).Variables in this model include Baseline GRADE Score, Baseline TOSCRF Score, student ethnicity and race, student Limited English Proficiency (LEP) status, school location, teacher ethnicity and race, and district indicators.
aThe number of teachers presented in this row is the number participating in the study. Some teachers taught more than one class. The calculations presented in the table are based on the number of classrooms observations for which scale scores were calculated. The response rates for these calculations vary from 91 percent for CRISS classrooms to 100 percent for Read for Real classrooms.
Table II.17 (continued)

54
• Students being asked to do something requiring word knowledge, which was statistically significant for the combined treatment group (effect size: -0.44)
Statistically significant differences were also found for the following comprehension-related teaching practices (in all cases, treatment group teachers engaged in these practices less than did control group teachers):
• Teachers elaborating on concepts during and after reading, which was statistically
significant for Project CRISS, Reading for Knowledge, and the combined treatment group (effect sizes: -0.45, -0.49, and -0.42, respectively)
• Teachers asking questions based on material in text that go beyond a literal level, which was statistically significant for the combined treatment group (effect size: -0.41)

55
III. IMPACT FINDINGS
The analysis of impacts was designed to answer confirmatory (primary) questions about whether the reading comprehension interventions “work,” and exploratory (secondary) questions about for whom and under what conditions they might work. Answers to the confirmatory questions are expected to be of greatest interest to policymakers, since they indicate whether the interventions have the intended effect of improving reading comprehension. Addressing exploratory questions can help interpret answers to the basic questions and guide future research on reading comprehension interventions. Selecting a set of core confirmatory questions on intervention effectiveness from the many questions of interest in this study is a way to limit proliferation of impact tests that could, if all were treated as core evaluation issues, just by chance yield some impacts that meet statistical standards for significance (see Schochet 2008 for a detailed discussion of multiple testing). Focusing on these core questions reduces the number of confirmatory impact tests, and maintains statistical precision even when we apply corrections for the multiple comparisons that are being made in this study.
This chapter first examines the comparability of the treatment and control groups (Section
A). Sections B and C then focus on confirmatory questions of intervention effectiveness and Sections D and E focus on the exploratory questions referenced above. In particular, Section B presents impacts on student test scores, focusing on results for two questions: (1) What is the overall intervention impact, as measured by differences between the combined treatment groups and the control group? and (2) What is the impact of each intervention relative to a control group? Section C presents results on the question of whether there were any differences between the impacts of the interventions. Section D presents exploratory impacts for subgroups of students, defined based on characteristics of the students and their teachers, and conditions in their schools. In Section E, we examine the exploratory question of whether (and, if so, how) impacts are related to differences in teachers’ classroom practices.
The impacts presented in this chapter are based on our “benchmark” approach. This
benchmark approach reflects decisions the study team made regarding the methodological approaches that were determined to be most appropriate for this study. In particular, the study team decided on an approach that involved accounting for clustering of students within schools (to account for the correlation between students in the same schools) and adjusting the results from statistical tests (p-values) for multiple comparisons (because there are multiple outcomes and multiple treatment groups being compared to a single control group).
Our benchmark approach adjusts p-values within several domains of multiple tests (but not
across domains). The first domain consists of 12 tests—the impact of each of four interventions (CRISS, ReadAbout, Read for Real, and Reading for Knowledge) on each of three outcome scores (GRADE, science comprehension, and social studies comprehension). The second domain consists of four tests—the effect of each intervention on a composite outcome. The third domain consists of three tests—the effect of the combined treatment group on each of three outcome measures. The last domain consists of a single test—the effect of the combined treatment group on the composite outcome. All of these domains are included in each impact table. Adjustments for multiple tests are made for each domain for students overall and within

56
each subgroup that we analyze. The adjustment for students overall does not take into account the multiple subgroup tests and adjustments made within each subgroup analysis do not take into account the multiple tests conducted for other subgroups. Stated differently, the p-values shown in any given table are adjusted for comparisons made within that table, but not for additional comparisons made in other tables.
To increase the statistical precision of the study’s impact estimates, the benchmark approach
included estimating impact models that controlled for student, teacher, and school characteristics. These included students’ baseline GRADE and TOSCRF scores, ELL status, race, and ethnicity; teachers’ race; and school location. Our benchmark approach also included district fixed effects to further increase statistical precision and weights that account for nonresponse and the probability of random assignment (Appendix G also contains information on the benchmark approach just described).
Two types of impacts are presented. First, impacts are presented for each intervention (for example, outcomes of students in ReadAbout schools are compared with outcomes of students in the control group). These impacts provide information on the effectiveness of each intervention, which may be helpful to readers considering implementing one of the interventions included in the study. The impact of an individual intervention on student outcomes is given by the regression-adjusted difference in outcomes between students in that intervention group and students in the control group. Second, impacts are presented for the combined treatment group, based on outcomes of students in all four intervention groups and outcomes of students in the control group. These impacts provide information on the effectiveness of reading comprehension interventions more broadly (not the specific impacts of any one intervention). Impacts for the combined treatment group are presented for two main reasons. First, although the details of each intervention differ, the four interventions share a set of common strategies for improving reading comprehension. As a result, examining the interventions as a group is a reasonable approach to address the question of whether the use of these types of interventions, in general, improves comprehension. Second, examining the combined treatment group gives the study more power than looking at an individual treatment group. The impact of the curricula as a whole on student outcomes is given by the regression-adjusted difference in outcomes between students in the combined treatment group and students in the control group.
Our findings are generally robust to variations in how the benchmark approach is implemented. For sensitivity analysis purposes, we conducted the impact analysis in other ways, including by: (1) dropping covariate adjustment, (2) using different weighting strategies, (3) examining the variation of impacts by district, and (4) using different approaches to multiple comparisons adjustment. Results from these sensitivity tests are presented in Appendix H.
A. TREATMENT AND CONTROL GROUPS WERE SIMILAR AT BASELINE
Random assignment of schools yielded treatment and control groups that were similar at baseline. We compared treatment and control group schools, teachers, and students on 27 baseline characteristics (including the core and supplemental reading curricula being used in

57
study schools just prior to the start of the study).46 We found one difference: teachers in the treatment group were on average four years younger than teachers in the control group (see Tables III.1, III.2, III.3, and III.4).47
While we would expect some chance differences between the treatment and control groups
given the large number of variables examined, we investigated the difference in teacher age to address the potential concern that it might indicate some systematic difference between the treatment and control groups. Specifically, we wanted to explore whether this difference might have arisen because older teachers refused to remain in the study after discovering that they were assigned to the treatment group. To address this concern, we examined the percentage of teachers who agreed to participate in the study and whether the difference in that percentage across the arms of the study was statistically significant. We found that 94 percent of the fifth-grade teachers in study schools agreed to participate and the difference in this percentage across the four treatment groups and the control group was not statistically significant.
B. NO STATISTICALLY SIGNIFICANT POSITIVE IMPACTS ON STUDENT TEST SCORES
Table III.5 presents impact estimates for each intervention group separately as well as for the combined treatment group. For example, in the “Project CRISS” column, the estimates shown represent the regression-adjusted difference between scores of students in schools assigned to Project CRISS and scores of students assigned to the control group, while the “Combined Treatment Group” column shows the regression-adjusted difference between scores of students in schools assigned to any of the four intervention groups and scores of students assigned to the control group. When control group means are shown in report tables, they are the actual control group means (they are not regression-adjusted means).
All of the analyses presented in this report focus on the levels of the outcome variables at followup. The study team did not focus on gains in the outcome variables from baseline to followup because baseline versions of the assessments were not administered for two of the study’s three follow-up assessments.
Findings. Overall, we did not find any statistically significant, positive impact of the interventions on any of the three student test score outcomes (Table III.5). There were no positive effects on the GRADE, the science reading comprehension assessment, or the social studies reading comprehension assessment. This lack of statistically significant, positive effects was found in comparisons of students in each intervention group with the control group and comparisons of the combined treatment group with the control group for the full sample of students.
46To be conservative in this analysis, we did not adjust p-values for multiple comparisons. Not adjusting for
multiple comparisons is conservative in this case because an adjustment for multiple comparisons would reduce the probability of finding differences between the treatment and control groups.
47In addition to testing differences in school, teacher, and student characteristics, we tested whether the mean number of days between the baseline and follow-up tests differed between treatment and control groups. We did not find any statistically significant difference between the groups.

58
TABLE III.1
READING CURRICULA IN USE JUST PRIOR TO 2006-2007 SCHOOL YEAR
Control Group
Project CRISS ReadAbout
Read for
Real
Reading for
Knowledge
Combined Treatment
Group
Percentage of Schools That Report Using the Following Core Curriculum:a
Textbook Most Commonly Reported Curriculab 43 53 41 44 65 51
Fantastic Voyagec, Houghton Mifflin Readingd, Scott Foresman Reading 2000e, and Harcourt Trophiesf
(0.54) (0.92) (0.96) (0.19) (0.53)
Other and None Reportedb 57 47 59 56 35 49 (0.54) (0.92) (0.96) (0.19) (0.53)
Basal Reader Series Most Commonly Reported Curriculab 38 71 47 50 59 57
Fantastic Voyagec, Houghton Mifflin Readingd, Scott Foresman Reading 2000e, and Harcourt Trophiesf
(0.05) (0.58) (0.48) (0.21) -0.14
Other and None Reportedb 62 29 53 50 41 43 (0.05) (0.58) (0.48) (0.21) (0.14)
Special Program Most Commonly Reported Curriculab 24 24 24 31 41 30
Accelerated Readerg and Reading Masteryh
(0.98) (0.98) (0.62) (0.26) (0.60)
Other 19 24 24 38 24 27
(0.74) (0.74) (0.22) (0.74) (0.48)
None Reported 57 53 53 31 35 43
(0.80) (0.80) (0.13) (0.19) (0.27)
Percentage of Schools That Report Using Supplemental Curricula in the Following Topic Areas:i
Comprehension and Fluencyb — j 35 35 31 24 31
(0.07) (0.07) (0.12) (0.26) (0.06)
Vocabulary 14 29 24 25 29 27
(0.27) (0.47) (0.42) (0.27) (0.25)
Other and None Reportedb 86 65 65 63 65 64
(0.15) (0.15) (0.12) (0.15) (0.07)
Number of Schoolsk 21 17 17 16 18 68 Source: Preliminary School Information Form. Note: The p-values from statistical tests of differences in treatment and control group means are presented in
parentheses. This data was collected during May-July 2006. The survey question that is the basis for this table asked principals to report what resources their school uses for its 5th-grade reading curriculum.

Table III.1 (continued)
59
aColumns may not sum to 100 percent due to rounding.
bCategories collapsed to protect school confidentiality.
cSchools reported using this curriculum on the study’s Preliminary School Information Form. For those interested in additional information on this curriculum, please see the developer’s website: http://www.pearsonschool.com/index.cfm?locator=PSZ1B7.
dSchools reported using this curriculum on the study’s Preliminary School Information Form. For those interested in additional information on this curriculum, please see the developer’s website: http://www.schooldirect.com.
eSchools reported using this curriculum on the study’s Preliminary School Information Form. For those interested in additional information on this curriculum, please see the developer’s website: <http://www.pearsonschool.com.
fSchools reported using this curriculum on the study’s Preliminary School Information Form. For those interested in additional information on this curriculum, please see the developer’s website: <https://jstore.harcourtschool.com.
gSchools reported using this curriculum on the study’s Preliminary School Information Form. For those interested in additional information on this curriculum, please see the developer’s website: <http://www.renlearn.com/ar/>.
hSchools reported using this curriculum on the study’s Preliminary School Information Form. For those interested in additional information on this curriculum, please see the developer’s website: <http://www.mcgraw-hill.co.uk/sra/readingmastery.htm>.
iColumns may not sum to 100 percent because schools could report using more than one supplemental curriculum.
jValue suppressed to protect school confidentiality. kThe number of schools presented in this row is the number participating in the study. One of the study schools did not fill out a Preliminary School Information Form.

60
TABLE III.2
BASELINE SCHOOL CHARACTERISTICS, BY TREATMENT AND CONTROL STATUS
Baseline Characteristics Control Group
Project CRISS ReadAbout
Read for Real
Reading for Knowledge
Combined Treatment
Group
Number of Students Enrolled in School 555.6 574.2 575.7 518.3 562.2 557.8 (0.82) (0.75) (0.53) (0.92) (0.97) Number of Students Enrolled in Fifth Grade 75.3 88.0 76.3 71.3 80.5 78.8 (0.34) (0.91) (0.65) (0.62) (0.70) Ethnicity/Race (Percentage)
Hispanic 34 29 34 21 29 28 (0.78) (0.91) (0.63) (0.82) (0.59)
White 26 31 28 33 35 32 (0.78) (0.91) (0.63) (0.82) (0.59)
Black 37 37 35 43 34 37 (0.78) (0.91) (0.63) (0.82) (0.59)
Asian —a —a —a —a —a —a
Native American —a —a —a —a —a —a Percentage of Students in School Eligible for Free or Reduced-Price Lunch
69
75 (0.37)
66 (0.77)
73 (0.62)
63 (0.48)
69 (0.91)
Percentage of Students in School Classified as English Language Learners
14
15 (0.82)
15 (0.85)
11 (0.53)
9 (0.35)
13 (0.80)
Percentage of Schools that Participated in Reading First in the 2005-2006 School Year
24
47 (0.13)
29 (0.70)
31 (0.61)
29 (0.70)
34 (0.36)
Percentage of Schools in the Following Locations:
Urban 62 71 76 73 67 72 (0.57) (0.33) (0.47) (0.76) (0.40)
Urban fringe and rural areab 38 29 24 25 33 28 (0.57) (0.33) (0.47) (0.76) (0.40)
Percentage of Schools Eligible for 95 100 100 94 89 96 Title I (.) (.) (0.84) (0.46) (0.95)
Number of Schoolsc 21 17 17 16 18 68 Source: Preliminary School Information Form, 2004-2005 Common Core of Data, School Information Form.
Note: The p-values from statistical tests of differences in treatment and control group means are presented in parentheses. P-values could not be obtained when all of the schools in one of the groups exhibited a given characteristic. This is indicated by a (.).
aValue suppressed to protect respondent confidentiality. bThe rural and urban fringe categories have been combined to protect respondent confidentiality. cThe number of schools presented in this row is the number participating in the study. The response rates for the calculations presented in the table vary from 67 percent to 100 percent, and the median response rate is 98 percent. The response rates vary in the calculations because some schools did not report information on some of the items of the Preliminary School Information Form and the School Information Form, and one of the study schools was not included in the 2004-2005 Common Core of Data.

61
TABLE III.3
BASELINE TEACHER CHARACTERISTICS, BY TREATMENT AND CONTROL STATUS
Baseline Characteristics Control Group
Project CRISS ReadAbout
Read for Real
Reading for Knowledge
Combined Treatment
Group Female (Percentage) 90 88 73 89 84 84 (0.75) (0.06) (0.80) (0.38) (0.30)
Age (Average) 45.4 41.1 39.7* 40.3 41.5 40.7* (0.07) (0.02) (0.06) (0.13) (0.01)
Hispanic (Percentage) 19 16 15 17 14 16 (0.71) (0.62) (0.83) (0.61) (0.60) Race (Percentage)
White 82 65 84 69 76 74 (0.28) (0.79) (0.26) (0.56) (0.37)
Black 18 33 16 24 22 24 (0.28) (0.79) (0.26) (0.56) (0.37)
Asian —a —a —a —a —a —a
Native American/Pacific Islander —a —a —a —a —a —a
Teachers with a Master’s Degree 48 43 47 36 47 43 or Higher Degree (Percentage) (0.65) (0.92) (0.28) (0.92) (0.58) Years Teaching Experience 14.3 12.9 11.0 11.6 12.2 11.9 (Average) (0.52) (0.10) (0.28) (0.29) (0.12)
Number of Teachersb 59 52 50 54 53 209 Source: Teacher Survey. Note: The p-values from statistical tests of differences in treatment and control group means are presented in
parentheses. These tests account for clustering of teachers within schools. aValue suppressed to protect teacher confidentiality. bThe number of teachers presented in this row is the number participating in the study. The response rates for the calculations presented in the table vary from 83 percent to 97 percent, and the median response rate is 91 percent. The response rates vary because some teachers did not report information on some items from the Teacher Survey.
*Statistically different from the control group at the .05 level.

62
TABLE III.4
BASELINE STUDENT CHARACTERISTICS, BY TREATMENT AND CONTROL STATUS
Control Group
Project CRISS ReadAbout
Read for Real
Reading for
Knowledge
Combined Treatment
Group Female (Percentage) 48 52 51 49 48 50 (0.05) (0.19) (0.70) (0.97) (0.23)
Age (Average) 10.7 10.7 10.7 10.8 10.7 10.7 (0.39) (0.71) (0.26) (0.54) (0.35)
Overagea (Percentage) 21 23 23 25 23 23 (0.54) (0.64) (0.34) (0.60) (0.39)
Number of Days Absent in 12.9 9.9 11.0 14.4 10.8 11.5 Prior School Year (Average) (0.49) (0.65) (0.80) (0.63) (0.67)
Eligible for Free or Reduced- 58 60 63 58 57 60 Price Lunch (Percentage) (0.80) (0.58) (0.98) (0.87) (0.84)
Classified as English Language 29 24 31 32 23 28 Learner (Percentage) (0.73) (0.86) (0.87) (0.68) (0.92)
Identified as Having a 10 9 11 12 12 11 Disabilityb (Percentage) (0.84) (0.61) (0.40) (0.44) (0.53)
GRADE Score (Average) 99.8 100.8 99.6 99.2 101.2 100.2 (0.55) (0.88) (0.67) (0.45) (0.73)
TOSCRF Score (Average) 88.3 89.1 87.8 87.8 89.8 88.6 (0.49) (0.65) (0.63) (0.23) (0.66)
Number of Studentsc 1,367 1,319 1,246 1,227 1,191 4,983 Source: Student Records Form. Baseline GRADE and TOSCRF tests administered by study team. Note: The p-values from statistical tests of differences in treatment and control group means are presented in
parentheses. These tests account for clustering of students within schools.
aWe considered a fifth grader to be overage for grade if he or she is 11 or older as of September 1, 2006.
bA student was identified as having a disability if any of the following categories were indicated on the student records form: autism, deaf-blindness developmental delay, emotional disturbance, hearing impairment, learning disability, mental retardation, orthopedic impairment, other health impairment, speech or language impairment, traumatic brain injury, visual impairment, and other disability not included in this list.
cThe number of students presented in this row is the number participating in the study. The overall response rates for data items presented in the table vary from 74 percent to 95 percent, and the median response rate is 89 percent. GRADE = Group Reading Assessment and Diagnostic Evaluation. TOSCRF = Test of Silent Contextual Reading Fluency.

63
TABLE III.5
DIFFERENCES IN SPRING TEST SCORES BETWEEN TREATMENT AND CONTROL GROUPS
Difference Between Each of the Following and the Control Group:
Control Group Mean
Project CRISS ReadAbout
Read for Real
Reading for Knowledge
Combined Treatment
Group
Composite Test Scorea Impact 0.02 –0.02 –0.05 –0.07 –0.12* –0.07* Effect Size –0.02 –0.06 –0.08 –0.14 –0.08 p-value 0.98 0.69 0.45 0.02 0.01
GRADE Score Impact 100.81 –0.57 –0.98 –0.89 –1.56 –1.12* Effect Size –0.04 –0.07 –0.06 –0.11 –0.08 p-value 0.99 0.85 0.80 0.12 0.02
Social Studies Reading Comprehension Assessment Score Impact 501.67 –0.89 –0.51 –1.86 –2.24 –1.44 Effect Size –0.03 –0.02 –0.06 –0.08 –0.05 p-value 1.00 1.00 0.96 0.79 0.49
Science Reading Comprehension Assessment Score Impact 501.51 0.66 –0.96 –1.38 –5.78* –2.32 Effect Size 0.02 –0.03 –0.05 –0.21 –0.08 p-value 1.00 1.00 1.00 0.02 0.20
Number of Studentsb 1,367 1,319 1,246 1,227 1,191 4,983
Source: Reading comprehension tests administered by study team. Note: For each outcome, the number reported in the column labeled “Control Group Mean” is the actual average
outcome for the control group, not a regression-adjusted mean. The numbers reported in the remaining columns are, by row, (1) the impact, (2) the effect size, and (3) the p-value of the impact. The social studies and science reading comprehension assessments were developed by ETS. Regression-adjusted impacts were calculated taking into account the clustering of students within schools. Variables in this model include baseline GRADE and TOSCRF scores, student ethnicity and race, student English language learner status, school location, teacher race, and district indicators.
aThe composite is based on the three tests presented in this table. Each test score is converted into a z-score by subtracting the mean and dividing by the standard deviation of the variable for students in the sample. The composite is the simple average of the three z-scores.
bThe number of students presented in this row is the number participating in the study. The proportion of students in each experimental condition with follow-up test scores is reported in Appendix Table G.2.
*Statistically different from the control group at the .05 level. ETS = Educational Testing Service. GRADE = Group Reading Assessment and Diagnostic Evaluation. TOSCRF = Test of Silent Contextual Reading Fluency.

64
In addition, some measures of student test scores were actually negatively affected by the interventions for the full sample of students. (Impacts are reported as “effect sizes” to facilitate comparisons of impacts on different outcomes. The effect size is the impact divided by the standard deviation of the outcome for students in the control group. For example, an impact of 4 units on an outcome with a standard deviation of 20 would be reported as an effect size of 0.20.) Students in the combined treatment group across all interventions scored statistically significantly lower than control group students on the composite test (effect size: -0.08) and GRADE assessments (effect size: -0.08).48 Students in the Reading for Knowledge group scored statistically significantly lower than control group students on the composite test (effect size: -0.14) and science reading comprehension assessments (effect size: -0.21).49
Sensitivity Tests to Assess the Robustness of the Impact Findings. To confirm that the
lack of positive impacts is not due to unusually large gains in the control group, we examined how the gains of students in the control group from fall to spring compare to the gains of students nationally. In this analysis, we focus on the GRADE test because it is the only test for which it is possible to compare the control group gains to the gains of the national norm sample. (Because the ETS assessments were not administered at baseline, and do not have a national norming sample, it is not possible to conduct this analysis for the two ETS assessments.)
Statistical tests suggest that the control group is experiencing gains that are comparable to
the fifth grade national norm sample. The gain for the control group (effect size: 0.40) and the gain for the fifth grade national norm sample (effect size: 0.36) were not statistically significantly different from one another (p-value: 0.56). While this analysis is purely descriptive, it provides important information for interpreting impact estimates, as it rules out unusual test score gains in the control group as a possible explanation for the lack of positive impact findings.
The lack of positive findings on these core impact analyses is robust to an array of
sensitivity tests including the following (see Appendix G for more information on the following sensitivity tests):
• Different types of multiple comparisons adjustments. The findings did not change
when different adjustment methods, such as Benjamini-Hochberg and Bonferroni, were applied (Hsu 1996; Benjamini and Hochberg 1995).
48The impact of 0.08 effect size units is smaller than the MDE of 0.17 effect size units reported earlier, for two
reasons. First, the MDE of 0.17 included a multiple comparison adjustment. The impact of the combined treatment group on the composite outcome does not require a multiple comparison adjustment. Without the multiple comparison adjustment, the MDE is 0.11. The second reason that this effect is smaller than the MDE is that the MDE is the smallest effect that can be detected with high probability (specifically, 80 percent). The likelihood of detecting an effect of 0.08 standard deviations is 55 percent.
49These results are robust to a sensitivity test in which we imputed to the minimum score in the sample the spring (follow-up) test scores of 32 students with scores missing due to language barriers. Robustness of this test indicates that excluding students who could not take the tests because of language barriers does not bias the results from the impact analysis.

65
• Exclusion of covariates. The results did not change when impacts were estimated with a model that does not include covariates.50
• Various weighting approaches. The results did not change when we applied alternative weighting strategies, such as estimating models with weights that control only for probability of random assignment.
The negative impacts observed for Reading for Knowledge are robust. They are unchanged by sensitivity tests, including applying the Bonferroni multiple comparisons correction and using different weighting approaches such as weights that only control for probability of random assignment. The negative impacts observed for Reading for Knowledge are also robust to the inclusion of covariates, although findings lose statistical significance when we do not regression adjust for baseline test scores. Baseline covariates are included in our benchmark impact models because they dramatically increase statistical precision. The most important of these covariates are the baseline GRADE and TOSCRF scores. Despite the reduction in precision associated with removing these covariates, the sign of the impacts on the composite test score and the science reading comprehension assessment scores remains negative.51 Details of sensitivity analyses are presented in Appendix H.
The negative impact of Reading for Knowledge is also robust to dropping individual
districts from the impact regression, although statistical significance is lost when we drop the largest district in the study (but not when any other district is dropped). The loss of statistical significance is not surprising, given that the study loses power when large numbers of students are dropped from the analysis sample. Since we did not have enough schools per treatment condition in each district to estimate district-specific impacts, we estimated impacts by excluding one district at a time. In all cases except for the one noted above, the impacts estimated were negative and statistically significant.
C. ONE OF 24 DIFFERENCES IN TREATMENT GROUP IMPACTS IS STATISTICALLY SIGNIFICANT
Consistent with the findings presented in Section A on the similarity of the treatment and control groups at the start of the study, the experimental design yielded treatment groups that were similar to each other at baseline. To assess the similarity of the treatment groups to each other, we compared the four treatment groups to each other on a large number of baseline school, teacher, and student characteristics. In these comparisons, we found no statistically significant differences between the groups (see Tables III.6 through III.9).
50We also estimated a model that included additional covariates to those included in the “benchmark” model.
Including teacher age and years of experience as covariates did not change the statistical significance of the estimated impacts.
51We also examined whether covariates other than baseline test score are necessary to achieve statistical significance. No other covariate contributes as much to the explanatory power of the regression model.

66
TABLE III.6
DIFFERENCES IN READING CURRICULA IN USE JUST PRIOR TO 2006-2007 SCHOOL YEAR
Differences in Means Between
Project CRISS and
ReadAbout and
Read for Real and
ReadAbout
Read for
Real
Reading for
Knowledge
Read for
Real
Reading for
Knowledge
Reading for
Knowledge
Percentage of Schools That Report Using the Following Core Curriculum:
Textbook Most Commonly Reported Curriculaa 12 9 -12 -3 -24 -21
Fantastic Voyageb, Houghton Mifflin Readingc, Scott Foresman Reading 2000d, and Harcourt Trophiese
(0.50) (0.60) (0.49) (0.88) (0.18) (0.24)
Other and None Reporteda -12 -9 12 3 24 21 (0.50) (0.60) (0.49) (0.88) (0.18) (0.24)
Basal Reader Series Most Commonly Reported Curriculaa 0.24 0.21 0.12 -0.03 -0.12 -0.09
Fantastic Voyageb, Houghton Mifflin Readingc, Scott Foresman Reading 2000d, and Harcourt Trophiese
(0.17) (0.24) (0.48) (0.87) (0.50) (0.62)
Other and None Reporteda -0.24 -0.21 -0.12 0.03 0.12 0.09 (0.17) (0.24) (0.48) (0.87) (0.50) (0.62)
Special Program Most Commonly Reported Curriculaa 0 -0.08 -0.18 -0.08 -0.18 -0.10
Accelerated Readerf and Reading Masteryg
(1.00) (0.62) (0.28) (0.62) (0.28) (0.56)
Other 0 -0.14 0 -0.14 0 0.14
(1.00) (0.39) (1.00) (0.39) (1.00) (0.39)
None Reported 0 0.22 0.18 0.22 0.18 -0.04
(1.00) (0.22) (0.31) (0.22) (0.31) (0.81)
Percentage of Schools That Report Using Supplemental Curricula in the Following Topic Areas:
Comprehension and Fluencya 0 0.04 0.12 0.04 0.12 0.08
(1.00) (0.81) (0.46) (0.81) (0.46) (0.62)
Vocabulary 0.06 0.04 0 -0.01 -0.06 -0.04
(0.70) (0.78) (1.00) (0.92) (0.70) (0.78)
Other and None Reporteda 0 0.02 0 0.02 0 -0.02
(1.00) (0.90) (1.00) (0.90) (1.00) (0.90)
Source: Preliminary School Information Form.
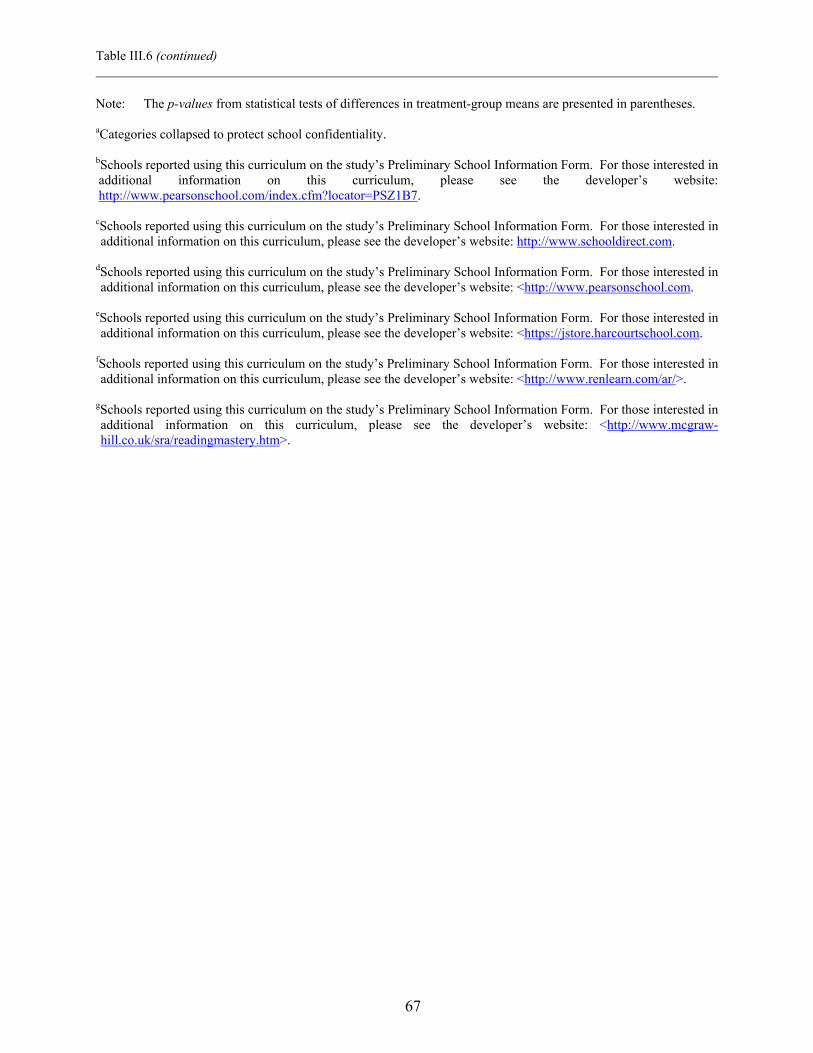
Table III.6 (continued)
67
Note: The p-values from statistical tests of differences in treatment-group means are presented in parentheses.
aCategories collapsed to protect school confidentiality. bSchools reported using this curriculum on the study’s Preliminary School Information Form. For those interested in additional information on this curriculum, please see the developer’s website: http://www.pearsonschool.com/index.cfm?locator=PSZ1B7.
cSchools reported using this curriculum on the study’s Preliminary School Information Form. For those interested in additional information on this curriculum, please see the developer’s website: http://www.schooldirect.com.
dSchools reported using this curriculum on the study’s Preliminary School Information Form. For those interested in additional information on this curriculum, please see the developer’s website: <http://www.pearsonschool.com.
eSchools reported using this curriculum on the study’s Preliminary School Information Form. For those interested in additional information on this curriculum, please see the developer’s website: <https://jstore.harcourtschool.com.
fSchools reported using this curriculum on the study’s Preliminary School Information Form. For those interested in additional information on this curriculum, please see the developer’s website: <http://www.renlearn.com/ar/>.
gSchools reported using this curriculum on the study’s Preliminary School Information Form. For those interested in additional information on this curriculum, please see the developer’s website: <http://www.mcgraw-hill.co.uk/sra/readingmastery.htm>.

68
TABLE III.7
DIFFERENCES IN BASELINE CHARACTERISTICS BETWEEN TREATMENT SCHOOLS
Differences in Means Between
Project CRISS and
ReadAbout and
Read for Real and
ReadAbout
Read for Real
Reading for Knowledge
Read for Real
Reading for Knowledge
Reading for Knowledge
Number of Students Enrolled in School –1.5 55.9 12.0 57.4 13.5 –44.0 (0.99) (0.48) (0.89) (0.29) (0.83) (0.46)
Number of Students Enrolled in Fifth Grade 11.7 16.7 7.6 5.0 –4.1 –9.1 (0.43) (0.25) (0.64) (0.62) (0.73) (0.43) Ethnicity/Race (Percentage)
Hispanic –4 8 1 13 5 –8 (0.95) (0.96) (0.78) (0.76) (0.87) (0.73)
White 4 –2 –4
–6 –7
–2 (0.95) (0.96) (0.78) (0.76) (0.87) (0.73)
Black 1 –7 3
–8 2
10 (0.95) (0.96) (0.78) (0.76) (0.87) (0.73)
Asian —a —a —a
—a —a
—a
Native American —a —a —a
—a —a
—a
Percentage of Students in School Eligible for 8 2 11 6 3 9 Free or Reduced-Price Lunch (0.25) (0.76) (0.11) (0.46) (0.70) (0.26)
Percentage of Students in School Classified 0 4 6 4 6 2 as English Language Learners (0.96) (0.49) (0.35) (0.46) (0.31) (0.72)
Percentage of Schools that Participated in 18 16 18 –2 0 2 Reading First in the 2005-2006 School Year (0.29) (0.35) (0.29) (0.91) (1.00) (0.91)
Percentage of Schools in the Following Locations:
Urban –6 –3 4 3 10 7 (0.70) (0.86) (0.80) (0.84) (0.52) (0.68)
Urban fringe and rural areab 6 4 –4 –1 –10 –8 (0.70) (0.86) (0.80) (0.84) (0.52) (0.68)
Percentage of Schools Eligible for Title I 0 6 11 6 11 5 (.) (.) (.) (.) (.) (0.61) Source: Preliminary School Information Form, 2004-2005 Common Core of Data, School Information Form. Note: The p-values from statistical tests of differences in treatment-group means are presented in parentheses. P-values could
not be obtained when most (or none) of the schools exhibited a given characteristic. This is indicated by a (.). aValue suppressed to protect respondent confidentiality. bThe rural and urban fringe categories have been combined to protect respondent confidentiality.

69
TABLE III.8
DIFFERENCES IN BASELINE CHARACTERISTICS BETWEEN TREATMENT TEACHERS
Differences in Means Between
Project CRISS and
ReadAbout and
Read for Real and
ReadAboutRead for
Real
Reading for
Knowledge
Read for
Real
Reading for
Knowledge
Reading for
Knowledge Female (Percentage) 15 0 4 –15 –11 4 (0.07) (0.95) (0.53) (0.07) (0.14) (0.50)
Age (Average) 1.4 0.8 –0.4 –0.6 –1.8 –1.2 (0.52) (0.73) (0.86) (0.80) (0.46) (0.64)
Hispanic (Percentage) 1 –1 2 –2 1 4 (0.88) (0.87) (0.81) (0.76) (0.90) (0.72)
Race (Percentage)
White –19 –4 –10 16 9 –7 (0.16) (0.88) (0.45) (0.30) (0.48) (0.83)
Black 17 8 10 –9 –7 2 (0.16) (0.88) (0.45) (0.30) (0.48) (0.83)
Asian —a —a —a —a —a —a
Native American/Pacific Islander —a —a —a —a —a —a Teachers with a Master’s Degree or –4 7 –4 11 0 –11 Higher Degree (Percentage) (0.76) (0.50) (0.71) (0.38) (0.99) (0.31)
Years Teaching Experience (Average) 1.9 1.3 0.7 –0.7 –1.2 –0.6 (0.36) (0.61) (0.75) (0.76) (0.53) (0.81) Source: Teacher Survey. Note: The p-values from statistical tests of differences in treatment-group means are presented in parentheses.
These tests account for clustering of teachers within schools. aValue suppressed to protect teacher confidentiality.

70
TABLE III.9
DIFFERENCES IN BASELINE CHARACTERISTICS BETWEEN TREATMENT STUDENTS
Differences in Means Between
Project CRISS and
ReadAbout and
Read for Real and
ReadAbout
Read for Real
Reading for Knowledge
Read for Real
Reading for Knowledge
Reading for Knowledge
Female (Percentage) 2 3 4 2 3 1 (0.48) (0.18) (0.08) (0.45) (0.23) (0.70)
Age (Years) 0.03 –0.03 0.02 –0.05 –0.01 0.04 (0.65) (0.71) (0.79) (0.45) (0.84) (0.55)
Overagea (Percentage) 0 –2 0 –2 0 2 (0.94) (0.64) (0.96) (0.63) (0.98) (0.63)
Number of Days Absent in Prior School Year (Average) –1.0 –4.4 –0.9 –3.4 0.1 3.6 (0.79) (0.43) (0.81) (0.55) (0.97) (0.53)
Eligible for Free or Reduced-Price –3 2 3 5 6 1 Lunch (Percentage) (0.71) (0.80) (0.66) (0.60) (0.47) (0.90)
Classified as English Language Learner (Percentage) –7 –7 1 0 8 9 (0.62) (0.68) (0.91) (0.98) (0.58) (0.64)
Identified as Having a Disabilityb –2 –3 –3 –1 –1 0 (Percentage) (0.53) (0.35) (0.39) (0.80) (0.83) (0.97)
GRADE Score (Average) 1.3 1.6 –0.3 0.4 –1.6 –1.9 (0.50) (0.36) (0.87) (0.82) (0.42) (0.30)
TOSCRF Score (Average) 1.2 1.3 –0.7 0.1 –1.9 –2.0 (0.27) (0.27) (0.62) (0.96) (0.11) (0.11) Source: Student Records Form. Baseline GRADE and TOSCRF tests administered by study team. Note: The p-values from statistical tests of differences in treatment-group means are presented in parentheses.
These tests account for clustering of students within schools.
aWe consider a fifth grader to be overage for grade if he or she is 11 or older as of September 1, 2006.
bA student was identified as having a disability if any of the following categories were indicated on the student records form: autism, deaf-blindness developmental delay, emotional disturbance, hearing impairment, learning disability, mental retardation, orthopedic impairment, other health impairment, speech or language impairment, traumatic brain injury, visual impairment, and other disability not included in this list.
GRADE = Group Reading Assessment and Diagnostic Evaluation. TOSCRF = Test of Silent Contextual Reading Fluency.

71
Overall, the impacts of the interventions were not statistically different from each other, with the exception of one difference. As shown in Table III.10, the impact of Project CRISS on the science reading comprehension assessment test scores is statistically significantly different from the impact of Reading for Knowledge on the science reading comprehension assessment test scores (effect size: 0.23).
D. FIFTEEN OF 1,080 SUBGROUP IMPACTS ARE STATISTICALLY SIGNIFICANT
The study team also conducted a series of exploratory subgroup analyses to investigate whether effects of the interventions might vary for students with different characteristics. Most of these subgroups are formed using characteristics observed at the beginning of the study’s implementation year, so the analyses preserve the properties of random assignment because the intervention could not have influenced these characteristics and thus there should be no systematic differences in unobserved characteristics of students in these subgroups between the treatment and control groups. Consequently, most of these findings allow for causal conclusions to be drawn about the impact of the interventions for these subgroups. The three exceptions are the subgroups defined by teachers’ self-reported past professional development, teaching efficacy, and school professional culture (all of which are based on data collected through the Teacher Survey, which was administered by the study team in August through November 2006, at the start of the study’s first year of data collection). Both the number and composition of teachers in the treatment group who reported receiving past professional development and who reported a given level of teacher efficacy or school professional culture could have been affected by the product-specific training received in the summer before the implementation year (in particular, teachers may have reported the training as professional development, and the training may have affected teachers’ responses to survey questions on their teaching efficacy and the professional culture in their schools). Because this potential shift in the size and composition of these subgroups affected only the treatment group but not the control group, analyses of these subgroups do not maintain the properties of random assignment and, therefore, do not allow for causal conclusions to be drawn about the impact of the interventions for these subgroups.
We believe these subgroup findings could help contribute to an understanding of the results
from the main impact analyses, including the negative impact of Reading for Knowledge. Our main approach to creating subgroups was to split the student sample into two groups of roughly equal size at the median level of each relevant characteristic for the study sample. For the subgroups based on baseline student test scores, we used a different approach, in which the two subgroups were created in five different ways (1) by splitting the sample at the average score on the GRADE and TOSCRF tests for the norm sample, (2) by splitting the sample at the median score on the GRADE and TOSCRF tests for the study sample, (3) by comparing students in the top and bottom thirds of the GRADE and TOSCRF distributions, (4) by comparing students in the middle and bottom thirds of the GRADE and TOSCRF distributions, and (5) by comparing students in the top and middle thirds of the GRADE and TOSCRF distributions.52 For the subgroups based on teacher experience, we used an approach in which the two subgroups were
52For both the GRADE and TOSCRF, the average score for the norm sample was 100. The median values for
our study sample were 100.5 for the GRADE and 89 for the TOSCRF.

72
TABLE III.10
DIFFERENCES IN SPRING TEST SCORES BETWEEN TREATMENT GROUPS
Difference Between
Project CRISS and
ReadAbout and Read for
Real and
ReadAbout Read for
Real Reading for Knowledge
Read for
Real
Reading for
Knowledge
Reading for Knowledge
Composite Test Scorea Impact 0.03 0.05 0.10 0.02 0.07 0.05 Effect Size 0.03 0.05 0.11 0.02 0.08 0.06 p-value 0.94 0.82 0.19 0.98 0.43 0.75
GRADE Score Impact 0.41 0.31 0.99 –0.09 0.58 0.67 Effect Size 0.03 0.02 0.07 –0.01 0.04 0.05 p-value 1.00 1.00 0.88 1.00 1.00 0.99
Social Studies Reading Comprehension Assessment Score Impact –0.39 0.97 1.35 1.35 1.73 0.38 Effect Size –0.01 0.03 0.05 0.05 0.06 0.01 p-value 1.00 1.00 1.00 1.00 0.98 1.00
Science Reading Comprehension Assessment Score Impact 1.62 2.04 6.44* 0.42 4.82 4.40 Effect Size 0.06 0.07 0.23 0.02 0.17 0.16 p-value 0.96 0.99 0.00 1.00 0.07 0.61 Source: Reading comprehension tests administered by study team. Note: For each outcome, the numbers reported are, by row, (1) the impact, (2) the effect size, and (3) the
p-value of the impact. The social studies and science reading comprehension assessments were developed by ETS. Regression-adjusted impacts were calculated taking into account the clustering of students within schools. Variables in this model include baseline GRADE and TOSCRF scores, student ethnicity and race, student English language learner status, school location, teacher race, and district indicators.
aThe composite is based on the three tests presented in this table. Each test score is converted into a z-score by subtracting the mean and dividing by the standard deviation of the variable for students in the sample. The composite is the simple average of the three z-scores.
*Statistically different at the .05 level. ETS = Educational Testing Service. GRADE = Group Reading Assessment and Diagnostic Evaluation. TOSCRF = Test of Silent Contextual Reading Fluency.

73
created in two ways: (1) by splitting the sample at the sample median (10 years) and (2) by splitting the sample at 5 years.53 Three types of student subgroups were created, as follows:
1. Subgroups of students based on characteristics of the students themselves: fluency (baseline TOSCRF), comprehension (baseline GRADE), and English language learner (ELL) status. These subgroups were selected because they may be observed by teachers and could be used as the basis for targeting the interventions to specific students (for example, if it is found that students with below-average fluency levels respond better to a particular intervention).
2. Subgroups of students based on characteristics of their teachers: teachers’ years of experience, hours of professional development in past 12 months, and self-reported efficacy. These subgroups were selected because they are characteristics that might be used by teachers and principals to target interventions to specific circumstances (for example, certain interventions might be more effective for teachers with below-average years of experience).
3. Subgroups of students based on conditions of the schools they attend: professional culture in the school, concentration of students eligible for free or reduced-price lunch, and concentration of ELL students in the school. These subgroups were selected because they are conditions that might be used by principals to target interventions to specific settings (for example, certain interventions might be more effective in schools with above-average concentrations of English language learners).
Tables III.11 through III.28 present the study’s subgroup findings. Each table presents impact estimates for one set of subgroups. For example, Table III.11 shows the impact estimates for students with above-average and below-average TOSCRF scores, and Table III.17 shows impact estimates for students with above-average and below-average baseline GRADE scores. In these tables, impacts are shown for each intervention group separately as well as for the combined treatment group for the two subgroups. In addition to showing the impact for each subgroup, the table also shows whether the impacts for the two subgroups are statistically significantly different from one another. For example, in the “Combined Treatment Group” column of Table III.11, the estimates indicate that students in the combined treatment group with above-average TOSCRF scores have statistically significantly lower social studies comprehension assessment scores than students in the control group with above-average TOSCRF scores. No statistically significant impacts were observed for students with below-average TOSCRF scores, and these two impacts were not statistically significantly different from one another.
53We examined a five-year teacher experience cut-point (in addition to using the sample median as a cut-point),
because Ingersoll (2002) found that as many as 39 percent of teachers leave teaching altogether in the first five years of their careers.

74
TABLE III.11
DIFFERENCES IN SPRING TEST SCORES BETWEEN EACH INTERVENTION GROUP AND THE CONTROL GROUP, COMPARING STUDENTS WITH BASELINE FLUENCY LEVELS ABOVE AND
BELOW THE NATIONAL NORM SAMPLE AVERAGE
Project CRISS ReadAbout
Read for Real
Reading for
Knowledge
Combined Treatment
Group
Composite Test Scorea (1) Students with baseline TOSCRF standard score lower than 100 (average for the national norm sample)
Impact –0.01 –0.05 –0.07 –0.09 –0.07 Effect Size –0.01 –0.05 –0.07 –0.11 –0.07 p-value 1.00 0.97 0.85 0.38 0.09
(2) Students with baseline TOSCRF standard score equal to or higher than 100 (average for the national norm sample)
Impact –0.07 –0.09 –0.00 –0.07 –0.07 Effect Size –0.08 –0.10 –0.00 –0.08 –0.08 p-value 0.85 0.60 1.00 0.97 0.30
Difference between (1) and (2) Difference in Impact 0.07 0.05 –0.06 –0.03 0.00 Difference in Effect Size 0.08 0.05 –0.07 –0.03 0.00 p-value for the Difference 0.87 0.99 0.86 1.00 1.00
GRADE Score (1) Students with baseline TOSCRF standard score lower than 100 (average for the national norm sample)
Impact –0.35 –1.02 –0.66 –1.54 –1.05 Effect Size –0.03 –0.07 –0.05 –0.11 –0.08 p-value 1.00 0.99 1.00 0.36 0.10
(2) Students with baseline TOSCRF standard score equal to or higher than 100 (average for the national norm sample)
Impact –0.81 –0.67 –0.09 0.29 –0.41 Effect Size –0.06 –0.05 –0.01 0.02 –0.03 p-value 1.00 1.00 1.00 1.00 0.99
Difference between (1) and (2) Difference in Impact 0.46 –0.35 –0.57 –1.84 –0.64 Difference in Effect Size 0.03 –0.03 –0.04 –0.13 –0.05 p-value for the Difference 1.00 1.00 1.00 0.91 0.96
Social Studies Reading Comprehension Assessment Score (1) Students with baseline TOSCRF standard score lower than 100 (average for the national norm sample)
Impact –0.22 0.28 –1.03 –1.07 –0.56 Effect Size –0.01 0.01 –0.03 –0.04 –0.02 p-value 1.00 1.00 1.00 1.00 1.00
(2) Students with baseline TOSCRF standard score equal to or higher than 100 (average for the national norm sample)
Impact –8.09 –6.18 –2.09 –8.53 –6.74* Effect Size –0.27 –0.21 –0.07 –0.29 –0.23 p-value 0.10 0.45 1.00 0.39 0.03
Difference between (1) and (2) Difference in Impact 7.87 6.46 1.06 7.47 6.18 Difference in Effect Size 0.27 0.22 0.04 0.25 0.21 p-value for the Difference 0.13 0.54 1.00 0.77 0.10

Table III.11 (continued)
75
Project CRISS ReadAbout
Read for Real
Reading for
Knowledge
Combined Treatment
Group
Science Reading Comprehension Assessment Score (1) Students with baseline TOSCRF standard score lower than 100 (average for the national norm sample)
Impact 0.54 –1.02 –1.79 –5.26 –2.29 Effect Size 0.02 –0.04 –0.06 –0.19 –0.08 p-value 1.00 1.00 1.00 0.32 0.51
(2) Students with baseline TOSCRF standard score equal to or higher than 100 (average for the national norm sample)
Impact 1.61 –2.61 3.48 –2.93 –0.82 Effect Size 0.06 –0.09 0.13 –0.11 –0.03 p-value 1.00 1.00 1.00 1.00 1.00
Difference between (1) and (2) Difference in Impact –1.07 1.59 –5.28 –2.33 –1.47 Difference in Effect Size –0.04 0.06 –0.19 –0.08 –0.05 p-value for the Difference 1.00 1.00 0.99 1.00 1.00
Number of Students with Baseline TOSCRF Standard Score Lower than 100b 1,034 1,044 1,011 944 4,033
Number of Students with Baseline TOSCRF Standard Score Higher than 100 189 143 136 193 661
Source: Reading comprehension tests administered by study team. Note: For each outcome and for each subgroup, the numbers reported are, by row, (1) the impact, (2) the effect
size, and (3) the p-value of the impact. For each outcome, the differences between subgroup impacts are also reported. All p-values were calculated taking into account the clustering of students within schools and adjusting for all comparisons shown in this table. The social studies and science reading comprehension assessments were developed by ETS. Variables in the regression model include baseline GRADE score, baseline TOSCRF score, student ethnicity and race, student English language learner status, school location, teacher race, and district indicators.
aThe composite is based on the three tests presented in this table. Each test score is converted into a z-score by subtracting the mean and dividing by the standard deviation of the variable for students in the sample. The composite is the simple average of the three z-scores.
bCounts reflect the number of students with a valid baseline TOSCRF score. *Statistically different at the .05 level. ETS = Educational Testing Service. GRADE = Group Reading Assessment and Diagnostic Evaluation. TOSCRF = Test of Silent Contextual Reading Fluency.

76
TABLE III.12
DIFFERENCES IN SPRING TEST SCORES BETWEEN EACH INTERVENTION GROUP AND THE CONTROL GROUP, COMPARING STUDENTS WITH BASELINE FLUENCY LEVELS ABOVE
AND BELOW THE SAMPLE MEDIAN
Project CRISS ReadAbout
Read for Real
Reading for
Knowledge
Combined Treatment
Group
Composite Test Scorea
(1) Students with baseline TOSCRF standard score lower than 89 (sample median) Impact 0.00 –0.02 –0.06 –0.07 –0.06 Effect Size 0.01 –0.03 –0.06 –0.08 –0.06 p-value 1.00 1.00 0.93 0.86 0.25
(2) Students with baseline TOSCRF standard score equal to or higher than 89 (sample median) Impact –0.04 –0.08 –0.06 –0.11 –0.08 Effect Size –0.04 –0.09 –0.06 –0.13 –0.08 p-value 1.00 0.56 0.95 0.23 0.05
Difference between (1) and (2) Difference in Impact 0.04 0.06 0.00 0.05 0.02 Difference in Effect Size 0.05 0.07 0.00 0.05 0.02 p-value for the Difference 1.00 0.85 1.00 0.99 0.87
GRADE Score
(1) Students with baseline TOSCRF standard score lower than 89 (sample median)
Impact –0.13 –0.71 –0.81 –1.43 –1.03 Effect Size –0.01 –0.05 –0.06 –0.10 –0.08 p-value 1.00 1.00 1.00 0.79 0.31
(2) Students with baseline TOSCRF standard score equal to or higher than 89 (sample median) Impact –0.76 –1.25 –0.40 –1.16 –0.95 Effect Size –0.06 –0.09 –0.03 –0.08 –0.07 p-value 1.00 0.96 1.00 0.95 0.41
Difference between (1) and (2) Difference in Impact 0.63 0.55 –0.40 –0.27 –0.08 Difference in Effect Size 0.05 0.04 –0.03 –0.02 –0.01 p-value for the Difference 1.00 1.00 1.00 1.00 1.00
Social Studies Reading Comprehension Assessment Score
(1) Students with baseline TOSCRF standard score lower than 89 (sample median)
Impact 1.50 3.31 1.36 0.81 1.60 Effect Size 0.05 0.11 0.05 0.03 0.05 p-value 1.00 0.95 1.00 1.00 0.90
(2) Students with baseline TOSCRF standard score equal to or higher than 89 (sample median) Impact –4.15 –4.20 –3.67 –4.87 –4.19* Effect Size –0.14 –0.14 –0.12 –0.16 –0.14 p-value 0.85 0.61 0.90 0.30 0.01
Difference between (1) and (2) Difference in Impact 5.65 7.51 5.04 5.69 5.80* Difference in Effect Size 0.19 0.25 0.17 0.19 0.20 p-value for the Difference 0.73 0.22 0.63 0.79 0.03

Table III.12 (continued)
77
Project CRISS ReadAbout
Read for Real
Reading for
Knowledge
Combined Treatment
Group
Science Reading Comprehension Assessment Score
(1) Students with baseline TOSCRF standard score lower than 89 (sample median)
Impact –0.31 –1.98 –2.37 –4.80 –2.77 Effect Size –0.01 –0.07 –0.09 –0.17 –0.10 p-value 1.00 1.00 1.00 0.92 0.70
(2) Students with baseline TOSCRF standard score equal to or higher than 89 (sample median) Impact 1.52 –0.22 0.15 –4.98 –1.46 Effect Size 0.06 –0.01 0.01 –0.18 –0.05 p-value 1.00 1.00 1.00 0.30 0.92
Difference between (1) and (2) Difference in Impact –1.83 –1.76 –2.52 0.18 –1.31 Difference in Effect Size –0.07 –0.06 –0.09 0.01 –0.05 p-value for the Difference 1.00 1.00 1.00 1.00 1.00
Number of Students with Baseline TOSCRF Standard Score Lower than 89b 571 598 577 513 2,259
Number of Students with Baseline TOSCRF Standard Score Equal to or Higher than 89 652 589 570 624 2,435
Source: Reading comprehension tests administered by study team. Note: For each outcome and for each subgroup, the numbers reported are, by row, (1) the impact, (2) the effect
size, (3) the p-value of the impact. For each outcome, the differences between subgroup impacts are also reported. All p-values were calculated taking into account the clustering of students within schools and adjusting for all comparisons shown in this table. The social studies and science reading comprehension assessments were developed by ETS. Variables in the regression model include Baseline GRADE Score, Baseline TOSCRF Score, student ethnicity and race, student Limited English Proficiency (LEP) status, school location, teacher ethnicity and race, and district indicators.
aThe composite is based on the three tests presented in this table. Each test score is converted into a z-score by subtracting the mean and dividing by the standard deviation of the variable for students in the sample. The composite is the simple average of the three z-scores.
bCounts reflect the number of students with a valid baseline TOSCRF score. *Statistically different at the .05 level. ETS = Educational Testing Service. GRADE = Group Reading Assessment and Diagnostic Evaluation.
TOSCRF = Test of Silent Contextual Reading Fluency.

78
TABLE III.13
DIFFERENCES IN SPRING TEST SCORES BETWEEN EACH INTERVENTION GROUP AND THE CONTROL GROUP, COMPARING STUDENTS IN THE TOP AND BOTTOM THIRDS OF THE
BASELINE FLUENCY DISTRIBUTION
Project CRISS ReadAbout
Read for Real
Reading for
Knowledge
Combined Treatment
Group
Composite Test Scorea
(1) Students with baseline TOSCRF standard score equal to or lower than 84 (bottom third of students)
Impact 0.02 –0.03 –0.05 –0.07 –0.05 Effect Size 0.02 –0.03 –0.05 –0.08 –0.06 p-value 1.00 1.00 0.97 0.93 0.36
(2) Students with baseline TOSCRF standard score higher than 92 (top third of students) Impact –0.03 –0.07 –0.06 –0.11 –0.08 Effect Size –0.04 –0.08 –0.07 –0.12 –0.08 p-value 1.00 0.66 0.95 0.22 0.07
Difference between (1) and (2) Difference in Impact 0.06 0.05 0.01 0.04 0.02 Difference in Effect Size 0.06 0.05 0.01 0.04 0.02 p-value for the Difference 0.99 0.98 1.00 1.00 0.90
GRADE Score
(1) Students with baseline TOSCRF standard score equal to or lower than 84 (bottom third of students)
Impact 0.32 –0.23 –0.19 –1.09 –0.63 Effect Size 0.02 –0.02 –0.01 –0.08 –0.05 p-value 1.00 1.00 1.00 1.00 0.87
(2) Students with baseline TOSCRF standard score higher than 92 (top third of students) Impact –0.86 –1.45 –0.86 –1.42 –1.21 Effect Size –0.06 –0.11 –0.06 –0.10 –0.09 p-value 1.00 0.87 1.00 0.62 0.13
Difference between (1) and (2) Difference in Impact 1.18 1.22 0.68 0.34 0.59 Difference in Effect Size 0.09 0.09 0.05 0.02 0.04 p-value for the Difference 1.00 0.99 1.00 1.00 0.97
Social Studies Reading Comprehension Assessment Score
(1) Students with baseline TOSCRF standard score equal to or lower than 84 (bottom third of students)
Impact 1.17 2.92 –0.19 1.07 0.82 Effect Size 0.04 0.10 –0.01 0.04 0.03 p-value 1.00 1.00 1.00 1.00 1.00
(2) Students with baseline TOSCRF standard score higher than 92 (top third of students) Impact –2.68 –2.26 –1.57 –3.59 –2.50 Effect Size –0.09 –0.08 –0.05 –0.12 –0.08 p-value 0.99 0.99 1.00 0.83 0.33
Difference between (1) and (2) Difference in Impact 3.85 5.19 1.38 4.67 3.32 Difference in Effect Size 0.13 0.17 0.05 0.16 0.11 p-value for the Difference 0.99 0.86 1.00 0.99 0.65

Table III.13 (continued)
79
Project CRISS ReadAbout
Read for Real
Reading for
Knowledge
Combined Treatment
Group
Science Reading Comprehension Assessment Score
(1) Students with baseline TOSCRF standard score equal to or lower than 84 (bottom third of students)
Impact 1.11 –2.88 –2.55 –5.91 –2.87 Effect Size 0.04 –0.10 –0.09 –0.21 –0.10 p-value 1.00 1.00 1.00 0.82 0.77
(2) Students with baseline TOSCRF standard score higher than 92 (top third of students) Impact 0.56 –0.62 –0.61 –4.59 –1.85 Effect Size 0.02 –0.02 –0.02 –0.17 –0.07 p-value 1.00 1.00 1.00 0.26 0.71
Difference between (1) and (2) Difference in Impact 0.55 –2.26 –1.94 –1.32 –1.01 Difference in Effect Size 0.02 –0.08 –0.07 –0.05 –0.04 p-value for the Difference 1.00 1.00 1.00 1.00 1.00
Number of Students with Baseline TOSCRF Standard Score Equal to or Lower than 84b 395 409 403 340 1,547
Number of Students with Baseline TOSCRF Standard Score Higher than 92 483 401 390 443 1,717
Source: Reading comprehension tests administered by study team. Note: For each outcome and for each subgroup, the numbers reported are, by row, (1) the impact, (2) the effect
size, (3) the p-value of the impact. For each outcome, the differences between subgroup impacts are also reported. All p-values were calculated taking into account the clustering of students within schools and adjusting for all comparisons shown in this table. The social studies and science reading comprehension assessments were developed by ETS. Variables in the regression model include Baseline GRADE Score, Baseline TOSCRF Score, student ethnicity and race, student Limited English Proficiency (LEP) status, school location, teacher ethnicity and race, and district indicators.
aThe composite is based on the three tests presented in this table. Each test score is converted into a z-score by subtracting the mean and dividing by the standard deviation of the variable for students in the sample. The composite is the simple average of the three z-scores.
bCounts reflect the number of students with a valid baseline TOSCRF score. ETS = Educational Testing Service. GRADE = Group Reading Assessment and Diagnostic Evaluation.
TOSCRF = Test of Silent Contextual Reading Fluency.

80
TABLE III.14
DIFFERENCES IN SPRING TEST SCORES BETWEEN EACH INTERVENTION GROUP AND THE CONTROL GROUP, COMPARING STUDENTS IN THE MIDDLE AND BOTTOM THIRDS OF
THE BASELINE FLUENCY DISTRIBUTION
Project CRISS ReadAbout
Read for Real
Reading for
Knowledge
Combined Treatment
Group
Composite Test Scorea (1) Students with baseline TOSCRF standard score higher than 84 and equal to or lower than 92
(middle third of students)
Impact –0.02 –0.10 –0.06 –0.14 –0.09 Effect Size –0.02 –0.11 –0.07 –0.16 –0.10 p-value 1.00 0.62 0.96 0.15 0.09
(2) Students with baseline TOSCRF standard score equal to or lower than 84 (bottom third of students) Impact –0.01 –0.04 –0.05 –0.06 –0.05 Effect Size –0.01 –0.04 –0.06 –0.07 –0.06 p-value 1.00 0.99 0.91 0.85 0.19
Difference between (1) and (2) Difference in Impact –0.01 –0.06 –0.01 –0.08 –0.04 Difference in Effect Size –0.01 –0.07 –0.01 –0.09 –0.05 p-value for the Difference 1.00 0.79 1.00 0.80 0.57
GRADE Score (1) Students with baseline TOSCRF standard score higher than 84 and equal to or lower than 92
(middle third of students)
Impact –0.45 –2.07 –1.22 –2.30 –1.60 Effect Size –0.03 –0.15 –0.09 –0.17 –0.12 p-value 1.00 0.65 1.00 0.08 0.09
(2) Students with baseline TOSCRF standard score equal to or lower than 84 (bottom third of students) Impact –0.44 –0.52 –0.36 –0.85 –0.74 Effect Size –0.03 –0.04 –0.03 –0.06 –0.05 p-value 1.00 1.00 1.00 1.00 0.42
Difference between (1) and (2) Difference in Impact –0.01 –1.56 –0.86 –1.44 –0.86 Difference in Effect Size –0.00 –0.11 –0.06 –0.11 –0.06 p-value for the Difference 1.00 0.58 1.00 0.84 0.69
Social Studies Reading Comprehension Assessment Score (1) Students with baseline TOSCRF standard score higher than 84 and equal to or lower than 92
(middle third of students)
Impact 0.97 –1.03 1.01 –1.57 –0.04 Effect Size 0.03 –0.03 0.03 –0.05 –0.00 p-value 1.00 1.00 1.00 1.00 1.00
(2) Students with baseline TOSCRF standard score equal to or lower than 84 (bottom third of students) Impact –2.14 –0.17 –1.99 –2.28 –1.97 Effect Size –0.07 –0.01 –0.07 –0.08 –0.07 p-value 1.00 1.00 1.00 0.98 0.50
Difference between (1) and (2) Difference in Impact 3.11 –0.85 3.00 0.71 1.93 Difference in Effect Size 0.10 –0.03 0.10 0.02 0.07 p-value for the Difference 1.00 1.00 1.00 1.00 0.96

Table III.14 (continued)
81
Project CRISS ReadAbout
Read for Real
Reading for
Knowledge
Combined Treatment
Group
Science Reading Comprehension Assessment Score
(1) Students with baseline TOSCRF standard score higher than 84 and equal to or lower than 92 (middle third of students)
Impact –2.96 –2.74 –3.07 –7.41 –4.51 Effect Size –0.11 –0.10 –0.11 –0.27 –0.16 p-value 0.99 1.00 1.00 0.09 0.12
(2) Students with baseline TOSCRF standard score equal to or lower than 84 (bottom third of students) Impact 2.05 –0.74 –0.38 –4.05 –1.20 Effect Size 0.07 –0.03 –0.01 –0.15 –0.04 p-value 0.99 1.00 1.00 0.66 0.94
Difference between (1) and (2) Difference in Impact –5.00 –2.00 –2.69 –3.36 –3.32 Difference in Effect Size –0.18 –0.07 –0.10 –0.12 –0.12 p-value for the Difference 0.63 1.00 1.00 0.94 0.32
Number of Students with Baseline TOSCRF Standard Score Higher than 84 and Equal to or Lower than 92b 345 377 354 354 1,430
Number of Students with Baseline TOSCRF Standard Score Equal to or Lower than 84 395 409 403 340 1,547
Source: Reading comprehension tests administered by study team. Note: For each outcome and for each subgroup, the numbers reported are, by row, (1) the impact, (2) the effect
size, (3) the p-value of the impact. For each outcome, the differences between subgroup impacts are also reported. All p-values were calculated taking into account the clustering of students within schools and adjusting for all comparisons shown in this table. The social studies and science reading comprehension assessments were developed by ETS. Variables in the regression model include Baseline GRADE Score, Baseline TOSCRF Score, student ethnicity and race, student Limited English Proficiency (LEP) status, school location, teacher ethnicity and race, and district indicators.
aThe composite is based on the three tests presented in this table. Each test score is converted into a z-score by subtracting the mean and dividing by the standard deviation of the variable for students in the sample. The composite is the simple average of the three z-scores.
bCounts reflect the number of students with a valid baseline TOSCRF score. ETS = Educational Testing Service. GRADE = Group Reading Assessment and Diagnostic Evaluation.
TOSCRF = Test of Silent Contextual Reading Fluency.

82
TABLE III.15
DIFFERENCES IN SPRING TEST SCORES BETWEEN EACH INTERVENTION GROUP AND THE CONTROL GROUP, COMPARING STUDENTS IN THE MIDDLE AND TOP THIRDS OF THE
BASELINE FLUENCY DISTRIBUTION
Project CRISS ReadAbout
Read for Real
Reading for
Knowledge
Combined Treatment
Group
Composite Test Scorea (1) Students with baseline TOSCRF standard score higher than 92 (top third of students)
Impact –0.05 –0.04 –0.05 –0.08 –0.06 Effect Size –0.06 –0.05 –0.06 –0.09 –0.06 p-value 0.97 0.96 0.97 0.81 0.25
(2) Students with baseline TOSCRF standard score higher than 84 and equal to or lower than 92 (middle third of students)
Impact 0.01 –0.05 –0.06 –0.09 –0.07 Effect Size 0.01 –0.06 –0.06 –0.11 –0.08 p-value 1.00 0.96 0.92 0.43 0.11
Difference between (1) and (2) Difference in Impact –0.06 0.01 0.00 0.02 0.01 Difference in Effect Size –0.07 0.01 0.00 0.02 0.01 p-value for the Difference 0.94 1.00 1.00 1.00 0.96
GRADE Score (1) Students with baseline TOSCRF standard score higher than 92 (top third of students)
Impact –1.13 –0.80 –0.55 –0.69 –0.87 Effect Size –0.08 –0.06 –0.04 –0.05 –0.06 p-value 0.99 1.00 1.00 1.00 0.68
(2) Students with baseline TOSCRF standard score higher than 84 and equal to or lower than 92 (middle third of students)
Impact –0.00 –1.08 –0.65 –1.65 –1.06 Effect Size –0.00 –0.08 –0.05 –0.12 –0.08 p-value 1.00 0.98 1.00 0.34 0.16
Difference between (1) and (2) Difference in Impact –1.13 0.28 0.10 0.95 0.20 Difference in Effect Size –0.08 0.02 0.01 0.07 0.01 p-value for the Difference 0.99 1.00 1.00 1.00 1.00
Social Studies Reading Comprehension Assessment Score (1) Students with baseline TOSCRF standard score higher than 92 (top third of students)
Impact –5.52 –3.28 –3.63 –5.38 –4.50* Effect Size –0.19 –0.11 –0.12 –0.18 –0.15 p-value 0.49 0.90 0.94 0.29 0.02
(2) Students with baseline TOSCRF standard score higher than 84 and equal to or lower than 92 (middle third of students)
Impact 1.25 0.95 0.17 –0.28 0.36 Effect Size 0.04 0.03 0.01 –0.01 0.01 p-value 1.00 1.00 1.00 1.00 1.00
Difference between (1) and (2) Difference in Impact –6.77 –4.23 –3.81 –5.10 –4.86 Difference in Effect Size –0.23 –0.14 –0.13 –0.17 –0.16 p-value for the Difference 0.18 0.88 0.97 0.88 0.09
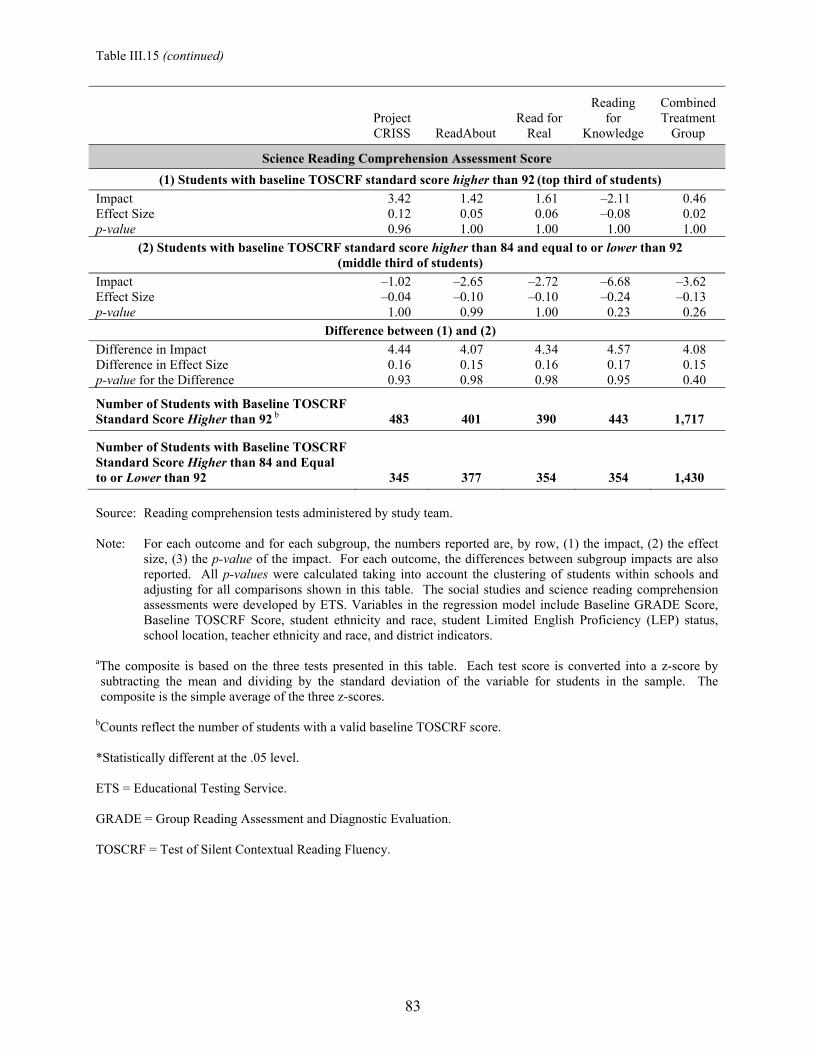
Table III.15 (continued)
83
Project CRISS ReadAbout
Read for Real
Reading for
Knowledge
Combined Treatment
Group
Science Reading Comprehension Assessment Score (1) Students with baseline TOSCRF standard score higher than 92 (top third of students)
Impact 3.42 1.42 1.61 –2.11 0.46 Effect Size 0.12 0.05 0.06 –0.08 0.02 p-value 0.96 1.00 1.00 1.00 1.00
(2) Students with baseline TOSCRF standard score higher than 84 and equal to or lower than 92 (middle third of students)
Impact –1.02 –2.65 –2.72 –6.68 –3.62 Effect Size –0.04 –0.10 –0.10 –0.24 –0.13 p-value 1.00 0.99 1.00 0.23 0.26
Difference between (1) and (2) Difference in Impact 4.44 4.07 4.34 4.57 4.08 Difference in Effect Size 0.16 0.15 0.16 0.17 0.15 p-value for the Difference 0.93 0.98 0.98 0.95 0.40
Number of Students with Baseline TOSCRF Standard Score Higher than 92 b 483 401 390 443 1,717
Number of Students with Baseline TOSCRF Standard Score Higher than 84 and Equal to or Lower than 92 345 377 354 354 1,430
Source: Reading comprehension tests administered by study team. Note: For each outcome and for each subgroup, the numbers reported are, by row, (1) the impact, (2) the effect
size, (3) the p-value of the impact. For each outcome, the differences between subgroup impacts are also reported. All p-values were calculated taking into account the clustering of students within schools and adjusting for all comparisons shown in this table. The social studies and science reading comprehension assessments were developed by ETS. Variables in the regression model include Baseline GRADE Score, Baseline TOSCRF Score, student ethnicity and race, student Limited English Proficiency (LEP) status, school location, teacher ethnicity and race, and district indicators.
aThe composite is based on the three tests presented in this table. Each test score is converted into a z-score by subtracting the mean and dividing by the standard deviation of the variable for students in the sample. The composite is the simple average of the three z-scores.
bCounts reflect the number of students with a valid baseline TOSCRF score. *Statistically different at the .05 level. ETS = Educational Testing Service. GRADE = Group Reading Assessment and Diagnostic Evaluation.
TOSCRF = Test of Silent Contextual Reading Fluency.

84
TABLE III.16
DIFFERENCES IN SPRING TEST SCORES BETWEEN EACH INTERVENTION GROUP AND THE CONTROL GROUP, COMPARING STUDENTS WITH BASELINE COMPREHENSION LEVELS ABOVE
AND BELOW THE NATIONAL NORM SAMPLE AVERAGE
Project CRISS ReadAbout
Read for Real
Reading for
Knowledge
Combined Treatment
Group
Composite Test Scorea (1) Students with baseline GRADE standard score lower than 100 (average for the national norm sample)
Impact –0.02 –0.03 –0.08 –0.08 –0.07 Effect Size –0.02 –0.04 –0.10 –0.09 –0.08 p-value 1.00 1.00 0.79 0.67 0.13
(2) Students with baseline GRADE standard score equal to or higher than 100 (average for the national norm sample)
Impact –0.03 –0.07 –0.01 –0.12 –0.07 Effect Size –0.04 –0.08 –0.02 –0.13 –0.08 p-value 1.00 0.70 1.00 0.23 0.10
Difference between (1) and (2) Difference in Impact 0.01 0.04 –0.07 0.04 0.00 Difference in Effect Size 0.02 0.04 –0.08 0.04 0.00 p-value for the Difference 1.00 0.99 0.79 1.00 1.00
GRADE Score (1) Students with baseline GRADE standard score lower than 100 (average for the national norm sample)
Impact –0.73 –0.96 –1.11 –1.40 –1.24 Effect Size –0.05 –0.07 –0.08 –0.10 –0.09 p-value 1.00 1.00 0.99 0.80 0.15
(2) Students with baseline GRADE standard score equal to or higher than 100 (average for the national norm sample)
Impact –0.39 –1.06 –0.13 –1.09 –0.83 Effect Size –0.03 –0.08 –0.01 –0.08 –0.06 p-value 1.00 0.98 1.00 0.92 0.48
Difference between (1) and (2) Difference in Impact –0.35 0.10 –0.98 –0.32 –0.41 Difference in Effect Size –0.03 0.01 –0.07 –0.02 –0.03 p-value for the Difference 1.00 1.00 1.00 1.00 0.99
Social Studies Reading Comprehension Assessment Score (1) Students with baseline GRADE standard score lower than 100 (average for the national norm sample)
Impact –1.09 0.89 –1.94 –1.63 –1.20 Effect Size –0.04 0.03 –0.07 –0.06 –0.04 p-value 1.00 1.00 1.00 1.00 0.97
(2) Students with baseline GRADE standard score equal to or higher than 100 (average for the national norm sample)
Impact –1.83 –1.85 –0.51 –2.47 –1.67 Effect Size –0.06 –0.06 –0.02 –0.08 –0.06 p-value 1.00 1.00 1.00 1.00 0.71
Difference between (1) and (2) Difference in Impact 0.73 2.74 –1.42 0.83 0.48 Difference in Effect Size 0.02 0.09 –0.05 0.03 0.02 p-value for the Difference 1.00 1.00 1.00 1.00 1.00

Table III.16 (continued)
85
Project CRISS ReadAbout
Read for Real
Reading for
Knowledge
Combined Treatment
Group
Science Reading Comprehension Assessment Score (1) Students with baseline GRADE standard score lower than 100 (average for the national norm sample)
Impact 1.57 –1.21 –1.92 –2.97 –1.82 Effect Size 0.06 –0.04 –0.07 –0.11 –0.07 p-value 1.00 1.00 1.00 1.00 0.93
(2) Students with baseline GRADE standard score equal to or higher than 100 (average for the national norm sample)
Impact –0.51 –0.97 –0.02 –6.73 –2.54 Effect Size –0.02 –0.04 –0.00 –0.24 –0.09 p-value 1.00 1.00 1.00 0.11 0.55
Difference between (1) and (2) Difference in Impact 2.08 –0.24 –1.90 3.75 0.72 Difference in Effect Size 0.08 –0.01 –0.07 0.14 0.03 p-value for the Difference 1.00 1.00 1.00 1.00 1.00
Number of Students with Baseline GRADE Standard Score Lower than 100b 564 604 606 524 2,298
Number of Students with Baseline GRADE Standard Score Higher than 100 667 586 545 615 2,413
Source: Reading comprehension tests administered by study team. Note: For each outcome and for each subgroup, the numbers reported are, by row, (1) the impact, (2) the effect
size, and (3) the p-value of the impact. For each outcome, the differences between subgroup impacts are also reported. All p-values were calculated taking into account the clustering of students within schools and adjusting for all comparisons shown in this table. The social studies and science reading comprehension assessments were developed by ETS. Variables in the regression model include baseline GRADE score, baseline TOSCRF score, student ethnicity and race, student English language learner status, school location, teacher race, and district indicators.
aThe composite is based on the three tests presented in this table. Each test score is converted into a z-score by subtracting the mean and dividing by the standard deviation of the variable for students in the sample. The composite is the simple average of the three z-scores.
bCounts reflect the number of students with a valid baseline GRADE score. ETS = Educational Testing Service. GRADE = Group Reading Assessment and Diagnostic Evaluation. TOSCRF = Test of Silent Contextual Reading Fluency.

86
TABLE III.17
DIFFERENCES IN SPRING TEST SCORES BETWEEN EACH INTERVENTION GROUP AND THE CONTROL GROUP, COMPARING STUDENTS WITH BASELINE COMPREHENSION LEVELS
ABOVE AND BELOW THE SAMPLE MEDIAN
Project CRISS ReadAbout
Read for Real
Reading for
Knowledge
Combined Treatment
Group
Composite Test Scorea
(1) Students with baseline GRADE standard score lower than 100.5 (sample median)
Impact –0.02 –0.03 –0.08 –0.08 –0.07 Effect Size –0.02 –0.04 –0.10 –0.09 –0.08 p-value 1.00 1.00 0.79 0.67 0.13
(2) Students with baseline GRADE standard score equal to or higher than 100.5 (sample median) Impact –0.03 –0.07 –0.01 –0.12 –0.07 Effect Size –0.04 –0.08 –0.02 –0.13 –0.08 p-value 1.00 0.70 1.00 0.23 0.10
Difference between (1) and (2) Difference in Impact 0.01 0.04 –0.07 0.04 0.00 Difference in Effect Size 0.02 0.04 –0.08 0.04 0.00 p-value for the Difference 1.00 0.99 0.79 1.00 1.00
GRADE Score
(1) Students with baseline GRADE standard score lower than 100.5 (sample median)
Impact –0.73 –0.96 –1.11 –1.40 –1.24 Effect Size –0.05 –0.07 –0.08 –0.10 –0.09 p-value 1.00 1.00 0.99 0.80 0.15
(2) Students with baseline GRADE standard score equal to or higher than 100.5 (sample median) Impact –0.39 –1.06 –0.13 –1.09 –0.83 Effect Size –0.03 –0.08 –0.01 –0.08 –0.06 p-value 1.00 0.98 1.00 0.92 0.48
Difference between (1) and (2) Difference in Impact –0.35 0.10 –0.98 –0.32 –0.41 Difference in Effect Size –0.03 0.01 –0.07 –0.02 –0.03 p-value for the Difference 1.00 1.00 1.00 1.00 0.99
Social Studies Reading Comprehension Assessment Score
(1) Students with baseline GRADE standard score lower than 100.5 (sample median)
Impact –1.09 0.89 –1.94 –1.63 –1.20 Effect Size –0.04 0.03 –0.07 –0.06 –0.04 p-value 1.00 1.00 1.00 1.00 0.97
(2) Students with baseline GRADE standard score equal to or higher than 100.5 (sample median) Impact –1.83 –1.85 –0.51 –2.47 –1.67 Effect Size –0.06 –0.06 –0.02 –0.08 –0.06 p-value 1.00 1.00 1.00 1.00 0.71
Difference between (1) and (2) Difference in Impact 0.73 2.74 –1.42 0.83 0.48 Difference in Effect Size 0.02 0.09 –0.05 0.03 0.02 p-value for the Difference 1.00 1.00 1.00 1.00 1.00

Table III.17 (continued)
87
Project CRISS ReadAbout
Read for Real
Reading for
Knowledge
Combined Treatment
Group
Science Reading Comprehension Assessment Score
(1) Students with baseline GRADE standard score lower than 100.5 (sample median)
Impact 1.57 –1.21 –1.92 –2.97 –1.82 Effect Size 0.06 –0.04 –0.07 –0.11 –0.07 p-value 1.00 1.00 1.00 1.00 0.93
(2) Students with baseline GRADE standard score equal to or higher than 100.5 (sample median) Impact –0.51 –0.97 –0.02 –6.73 –2.54 Effect Size –0.02 –0.04 –0.00 –0.24 –0.09 p-value 1.00 1.00 1.00 0.11 0.55
Difference between (1) and (2) Difference in Impact 2.08 –0.24 –1.90 3.75 0.72 Difference in Effect Size 0.08 –0.01 –0.07 0.14 0.03 p-value for the Difference 1.00 1.00 1.00 1.00 1.00
Number of Students with Baseline GRADE Standard Score Lower than 100.5b 564 604 606 524 2,298
Number of Students with Baseline GRADE Standard Score Equal to or Higher than 100.5 667 586 545 615 2,413
Source: Reading comprehension tests administered by study team. Note: For each outcome and for each subgroup, the numbers reported are, by row, (1) the impact, (2) the effect
size, (3) the p-value of the impact. For each outcome, the differences between subgroup impacts are also reported. All p-values were calculated taking into account the clustering of students within schools and adjusting for all comparisons shown in this table. The social studies and science reading comprehension assessments were developed by ETS. Variables in the regression model include Baseline GRADE Score, Baseline TOSCRF Score, student ethnicity and race, student Limited English Proficiency (LEP) status, school location, teacher ethnicity and race, and district indicators.
aThe composite is based on the three tests presented in this table. Each test score is converted into a z-score by subtracting the mean and dividing by the standard deviation of the variable for students in the sample. The composite is the simple average of the three z-scores.
bCounts reflect the number of students with a valid baseline GRADE score. ETS = Educational Testing Service. GRADE = Group Reading Assessment and Diagnostic Evaluation. TOSCRF = Test of Silent Contextual Reading Fluency.

88
TABLE III.18
DIFFERENCES IN SPRING TEST SCORES BETWEEN EACH INTERVENTION GROUP AND THE CONTROL GROUP, COMPARING STUDENTS IN THE TOP AND BOTTOM THIRDS OF THE
BASELINE COMPREHENSION DISTRIBUTION
Project CRISS ReadAbout
Read for Real
Reading for
Knowledge
Combined Treatment
Group
Composite Test Scorea
(1) Students with baseline GRADE standard score equal to or lower than 93 (bottom third of students)
Impact –0.07 –0.07 –0.13 –0.12 –0.12* Effect Size –0.08 –0.08 –0.14 –0.14 –0.14 p-value 0.95 0.83 0.37 0.30 0.01
(2) Students with baseline GRADE standard score higher than 103 (top third of students) Impact –0.00 –0.04 –0.02 –0.09 –0.04 Effect Size –0.00 –0.05 –0.02 –0.10 –0.05 p-value 1.00 0.99 1.00 0.52 0.35
Difference between (1) and (2) Difference in Impact –0.07 –0.03 –0.11 –0.03 –0.08 Difference in Effect Size –0.07 –0.04 –0.13 –0.04 –0.09 p-value for the Difference 0.99 1.00 0.37 1.00 0.26
GRADE Score
(1) Students with baseline GRADE standard score equal to or lower than 93 (bottom third of students)
Impact –1.80 –1.69 –1.44 –2.34 –2.06* Effect Size –0.13 –0.12 –0.10 –0.17 –0.15 p-value 0.93 0.72 0.84 0.05 0.00
(2) Students with baseline GRADE standard score higher than 103 (top third of students) Impact 0.04 –0.66 –0.32 –0.74 –0.53 Effect Size 0.00 –0.05 –0.02 –0.05 –0.04 p-value 1.00 1.00 1.00 1.00 0.87
Difference between (1) and (2) Difference in Impact –1.84 –1.03 –1.11 –1.59 –1.53 Difference in Effect Size –0.13 –0.08 –0.08 –0.12 –0.11 p-value for the Difference 0.98 1.00 0.97 0.52 0.14
Social Studies Reading Comprehension Assessment Score
(1) Students with baseline GRADE standard score equal to or lower than 93 (bottom third of students)
Impact 0.62 2.28 –0.68 –0.32 0.07 Effect Size 0.02 0.08 –0.02 –0.01 0.00 p-value 1.00 1.00 1.00 1.00 1.00
(2) Students with baseline GRADE standard score higher than 103 (top third of students) Impact –2.32 –1.76 –1.51 –2.82 –2.11 Effect Size –0.08 –0.06 –0.05 –0.10 –0.07 p-value 1.00 1.00 1.00 0.96 0.39
Difference between (1) and (2) Difference in Impact 2.94 4.04 0.82 2.50 2.19 Difference in Effect Size 0.10 0.14 0.03 0.08 0.07 p-value for the Difference 1.00 0.96 1.00 1.00 0.92

Table III.18 (continued)
89
Project CRISS ReadAbout
Read for Real
Reading for
Knowledge
Combined Treatment
Group
Science Reading Comprehension Assessment Score
(1) Students with baseline GRADE standard score equal to or lower than 93 (bottom third of students)
Impact –1.12 –4.43 –6.01 –5.45 –5.25 Effect Size –0.04 –0.16 –0.22 –0.20 –0.19 p-value 1.00 0.87 0.84 0.95 0.16
(2) Students with baseline GRADE standard score higher than 103 (top third of students) Impact 1.32 0.51 1.33 –4.59 –0.74 Effect Size 0.05 0.02 0.05 –0.17 –0.03 p-value 1.00 1.00 1.00 0.41 1.00
Difference between (1) and (2) Difference in Impact –2.44 –4.94 –7.34 –0.85 –4.50 Difference in Effect Size –0.09 –0.18 –0.27 –0.03 –0.16 p-value for the Difference 1.00 0.91 0.70 1.00 0.46
Number of Students with Baseline GRADE Standard Score Equal to or Lower than 93b 378 384 405 323 1,490
Number of Students with Baseline GRADE Standard Score Higher than 103 525 441 434 484 1,884
Source: Reading comprehension tests administered by study team. Note: For each outcome and for each subgroup, the numbers reported are, by row, (1) the impact, (2) the effect
size, (3) the p-value of the impact. For each outcome, the differences between subgroup impacts are also reported. All p-values were calculated taking into account the clustering of students within schools and adjusting for all comparisons shown in this table. The social studies and science reading comprehension assessments were developed by ETS. Variables in the regression model include Baseline GRADE Score, Baseline TOSCRF Score, student ethnicity and race, student Limited English Proficiency (LEP) status, school location, teacher ethnicity and race, and district indicators.
aThe composite is based on the three tests presented in this table. Each test score is converted into a z-score by subtracting the mean and dividing by the standard deviation of the variable for students in the sample. The composite is the simple average of the three z-scores.
bCounts reflect the number of students with a valid baseline GRADE score. *Statistically different at the .05 level. ETS = Educational Testing Service. GRADE = Group Reading Assessment and Diagnostic Evaluation. TOSCRF = Test of Silent Contextual Reading Fluency.

90
TABLE III.19
DIFFERENCES IN SPRING TEST SCORES BETWEEN EACH INTERVENTION GROUP AND THE CONTROL GROUP, COMPARING STUDENTS IN THE MIDDLE AND BOTTOM THIRDS OF
THE BASELINE COMPREHENSION DISTRIBUTION
Project CRISS ReadAbout
Read for Real
Reading for
Knowledge
Combined Treatment
Group
Composite Test Scorea (1) Students with baseline GRADE standard score higher than 93 and equal to or lower than 103
(middle third of students)
Impact 0.01 –0.03 –0.02 –0.05 –0.03 Effect Size 0.01 –0.04 –0.03 –0.06 –0.03 p-value 1.00 1.00 1.00 0.97 0.80
(2) Students with baseline GRADE standard score equal to or lower than 93 (bottom third of students) Impact –0.02 –0.06 –0.07 –0.10 –0.08* Effect Size –0.03 –0.07 –0.08 –0.11 –0.09 p-value 1.00 0.68 0.68 0.28 0.02
Difference between (1) and (2) Difference in Impact 0.03 0.03 0.05 0.04 0.05 Difference in Effect Size 0.04 0.03 0.05 0.05 0.06 p-value for the Difference 1.00 1.00 0.92 0.99 0.48
GRADE Score (1) Students with baseline GRADE standard score higher than 93 and equal to or lower than 103
(middle third of students)
Impact 0.18 –0.89 –0.80 –1.03 –0.67 Effect Size 0.01 –0.07 –0.06 –0.08 –0.05 p-value 1.00 1.00 1.00 1.00 0.94
(2) Students with baseline GRADE standard score equal to or lower than 93 (bottom third of students) Impact –0.76 –1.06 –0.63 –1.33 –1.16* Effect Size –0.06 –0.08 –0.05 –0.10 –0.08 p-value 0.99 0.84 1.00 0.40 0.02
Difference between (1) and (2) Difference in Impact 0.95 0.16 –0.17 0.30 0.49 Difference in Effect Size 0.07 0.01 –0.01 0.02 0.04 p-value for the Difference 1.00 1.00 1.00 1.00 0.98
Social Studies Reading Comprehension Assessment Score (1) Students with baseline GRADE standard score higher than 93 and equal to or lower than 103
(middle third of students)
Impact –3.84 –2.17 –2.21 –2.82 –2.77 Effect Size –0.13 –0.07 –0.07 –0.10 –0.09 p-value 0.98 1.00 1.00 1.00 0.54
(2) Students with baseline GRADE standard score equal to or lower than 93 (bottom third of students) Impact –0.48 0.26 –0.86 –1.72 –0.90 Effect Size –0.02 0.01 –0.03 –0.06 –0.03 p-value 1.00 1.00 1.00 1.00 0.99
Difference between (1) and (2) Difference in Impact –3.37 –2.44 –1.35 –1.10 –1.87 Difference in Effect Size –0.11 –0.08 –0.05 –0.04 –0.06 p-value for the Difference 0.99 1.00 1.00 1.00 0.95
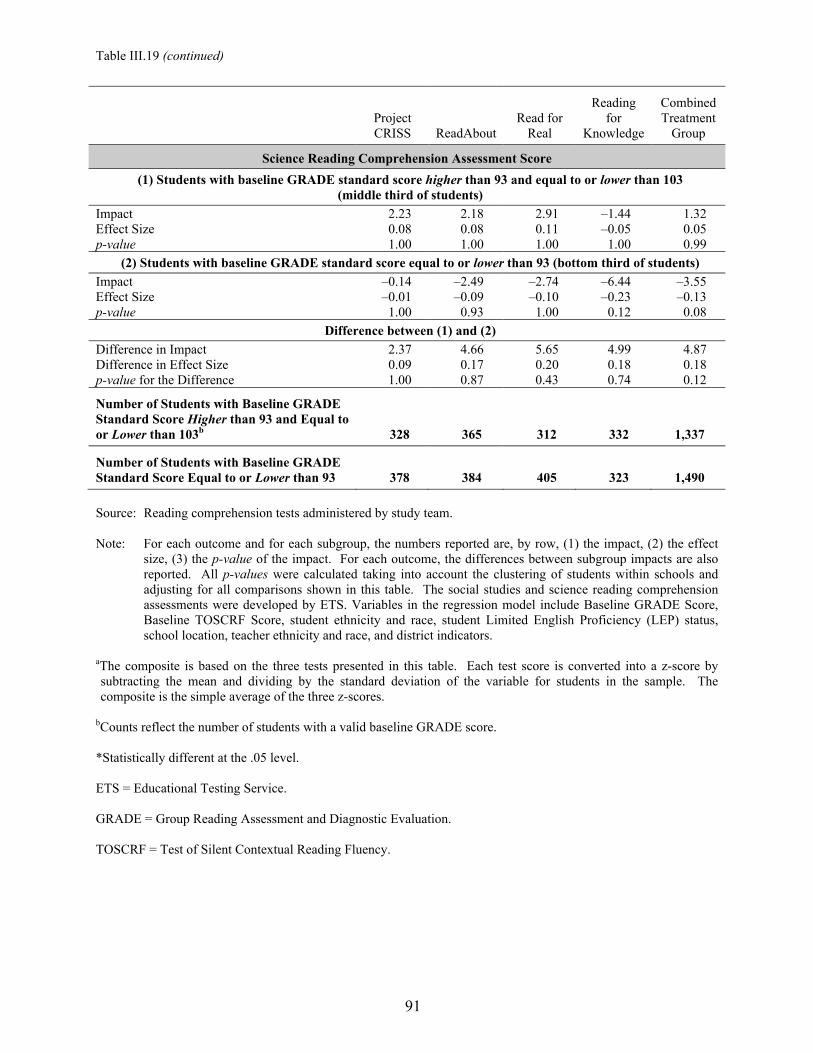
Table III.19 (continued)
91
Project CRISS ReadAbout
Read for Real
Reading for
Knowledge
Combined Treatment
Group
Science Reading Comprehension Assessment Score (1) Students with baseline GRADE standard score higher than 93 and equal to or lower than 103
(middle third of students)
Impact 2.23 2.18 2.91 –1.44 1.32 Effect Size 0.08 0.08 0.11 –0.05 0.05 p-value 1.00 1.00 1.00 1.00 0.99
(2) Students with baseline GRADE standard score equal to or lower than 93 (bottom third of students) Impact –0.14 –2.49 –2.74 –6.44 –3.55 Effect Size –0.01 –0.09 –0.10 –0.23 –0.13 p-value 1.00 0.93 1.00 0.12 0.08
Difference between (1) and (2) Difference in Impact 2.37 4.66 5.65 4.99 4.87 Difference in Effect Size 0.09 0.17 0.20 0.18 0.18 p-value for the Difference 1.00 0.87 0.43 0.74 0.12
Number of Students with Baseline GRADE Standard Score Higher than 93 and Equal to or Lower than 103b 328 365 312 332 1,337
Number of Students with Baseline GRADE Standard Score Equal to or Lower than 93 378 384 405 323 1,490
Source: Reading comprehension tests administered by study team. Note: For each outcome and for each subgroup, the numbers reported are, by row, (1) the impact, (2) the effect
size, (3) the p-value of the impact. For each outcome, the differences between subgroup impacts are also reported. All p-values were calculated taking into account the clustering of students within schools and adjusting for all comparisons shown in this table. The social studies and science reading comprehension assessments were developed by ETS. Variables in the regression model include Baseline GRADE Score, Baseline TOSCRF Score, student ethnicity and race, student Limited English Proficiency (LEP) status, school location, teacher ethnicity and race, and district indicators.
aThe composite is based on the three tests presented in this table. Each test score is converted into a z-score by subtracting the mean and dividing by the standard deviation of the variable for students in the sample. The composite is the simple average of the three z-scores.
bCounts reflect the number of students with a valid baseline GRADE score. *Statistically different at the .05 level. ETS = Educational Testing Service. GRADE = Group Reading Assessment and Diagnostic Evaluation. TOSCRF = Test of Silent Contextual Reading Fluency.

92
TABLE III.20
DIFFERENCES IN SPRING TEST SCORES BETWEEN EACH INTERVENTION GROUP AND THE CONTROL GROUP, COMPARING STUDENTS IN THE MIDDLE AND TOP THIRDS OF THE
BASELINE COMPREHENSION DISTRIBUTION
Project CRISS ReadAbout
Read for Real
Reading for
Knowledge
Combined Treatment
Group
Composite Test Scorea (1) Students with baseline GRADE standard score higher than 103 (top third of students)
Impact 0.00 –0.04 0.00 –0.08 –0.04 Effect Size 0.00 –0.04 0.00 –0.09 –0.05 p-value 1.00 0.99 1.00 0.76 0.55
(2) Students with baseline GRADE standard score higher than 93 and equal to or lower than 103 (middle third of students)
Impact –0.03 –0.07 –0.10 –0.09 –0.08 Effect Size –0.03 –0.07 –0.11 –0.10 –0.09 p-value 1.00 0.90 0.60 0.60 0.08
Difference between (1) and (2) Difference in Impact 0.03 0.03 0.10 0.01 0.04 Difference in Effect Size 0.03 0.03 0.11 0.01 0.05 p-value for the Difference 1.00 1.00 0.56 1.00 0.70
GRADE Score (1) Students with baseline GRADE standard score higher than 103 (top third of students)
Impact –0.04 –0.49 0.07 –0.53 –0.43 Effect Size –0.00 –0.04 0.01 –0.04 –0.03 p-value 1.00 1.00 1.00 1.00 0.98
(2) Students with baseline GRADE standard score higher than 93 and equal to or lower than 103 (middle third of students)
Impact –0.87 –1.32 –1.19 –1.73 –1.42 Effect Size –0.06 –0.10 –0.09 –0.13 –0.10 p-value 1.00 0.98 0.98 0.57 0.09
Difference between (1) and (2) Difference in Impact 0.83 0.82 1.27 1.21 0.99 Difference in Effect Size 0.06 0.06 0.09 0.09 0.07 p-value for the Difference 1.00 1.00 0.99 0.99 0.80
Social Studies Reading Comprehension Assessment Score (1) Students with baseline GRADE standard score higher than 103 (top third of students)
Impact –1.07 –0.98 –0.38 –2.44 –1.41 Effect Size –0.04 –0.03 –0.01 –0.08 –0.05 p-value 1.00 1.00 1.00 1.00 0.91
(2) Students with baseline GRADE standard score higher than 93 and equal to or lower than 103 (middle third of students)
Impact –1.79 –0.16 –2.00 –1.80 –1.48 Effect Size –0.06 –0.01 –0.07 –0.06 –0.05 p-value 1.00 1.00 1.00 1.00 0.86
Difference between (1) and (2) Difference in Impact 0.72 –0.82 1.62 –0.64 0.06 Difference in Effect Size 0.02 –0.03 0.05 –0.02 0.00 p-value for the Difference 1.00 1.00 1.00 1.00 1.00

Table III.20 (continued)
93
Project CRISS ReadAbout
Read for Real
Reading for
Knowledge
Combined Treatment
Group
Science Reading Comprehension Assessment Score (1) Students with baseline GRADE standard score higher than 103 (top third of students)
Impact –0.08 –1.18 –0.20 –7.43 –2.70 Effect Size –0.00 –0.04 –0.01 –0.27 –0.10 p-value 1.00 1.00 1.00 0.13 0.57
(2) Students with baseline GRADE standard score higher than 93 and equal to or lower than 103 (middle third of students)
Impact 0.80 –1.13 –1.68 –3.28 –1.78 Effect Size 0.03 –0.04 –0.06 –0.12 –0.06 p-value 1.00 1.00 1.00 0.98 0.89
Difference between (1) and (2) Difference in Impact –0.88 –0.05 1.48 –4.15 –0.92 Difference in Effect Size –0.03 –0.00 0.05 –0.15 –0.03 p-value for the Difference 1.00 1.00 1.00 0.99 1.00
Number of Students with Baseline GRADE Standard Score Higher than 93 and Equal to or Lower than 103b 328 365 312 332 1,337
Number of Students with Baseline GRADE Standard Score Higher than 103 525 441 434 484 1,884
Source: Reading comprehension tests administered by study team. Note: For each outcome and for each subgroup, the numbers reported are, by row, (1) the impact, (2) the effect
size, (3) the p-value of the impact. For each outcome, the differences between subgroup impacts are also reported. All p-values were calculated taking into account the clustering of students within schools and adjusting for all comparisons shown in this table. The social studies and science reading comprehension assessments were developed by ETS. Variables in the regression model include Baseline GRADE Score, Baseline TOSCRF Score, student ethnicity and race, student Limited English Proficiency (LEP) status, school location, teacher ethnicity and race, and district indicators.
aThe composite is based on the three tests presented in this table. Each test score is converted into a z-score by subtracting the mean and dividing by the standard deviation of the variable for students in the sample. The composite is the simple average of the three z-scores.
bCounts reflect the number of students with a valid baseline GRADE score. ETS = Educational Testing Service. GRADE = Group Reading Assessment and Diagnostic Evaluation. TOSCRF = Test of Silent Contextual Reading Fluency.

94
TABLE III.21
DIFFERENCES IN SPRING TEST SCORES BETWEEN EACH INTERVENTION GROUP AND THE CONTROL GROUP, BY ENGLISH LANGUAGE LEARNER STATUS
Project CRISS ReadAbout
Read for Real
Reading for
Knowledge
Combined Treatment
Group
Composite Test Scorea
(1) Students classified as English language learners
Impact –0.06 0.08 0.15 0.08 0.07 Effect Size –0.07 0.09 0.16 0.09 0.08 p-value 1.00 0.82 0.84 0.84 0.42
(2) Students not classified as English language learners Impact 0.03 –0.04 –0.06 –0.06 –0.05 Effect Size 0.03 –0.04 –0.07 –0.07 –0.05 p-value 0.99 0.99 0.97 0.84 0.33
Difference between (1) and (2) Difference in Impact –0.09 0.12 0.20 0.14 0.12 Difference in Effect Size –0.10 0.14 0.23 0.16 0.13 p-value for the Difference 1.00 0.52 0.60 0.45 0.15
GRADE Score
(1) Students classified as English language learners
Impact –0.83 1.16 1.26 0.38 0.85 Effect Size –0.06 0.08 0.09 0.03 0.06 p-value 1.00 1.00 1.00 1.00 0.95
(2) Students not classified as English language learners Impact 0.43 –0.97 –0.64 –0.86 –0.65 Effect Size 0.03 –0.07 –0.05 –0.06 –0.05 p-value 1.00 1.00 1.00 1.00 0.64
Difference between (1) and (2) Difference in Impact –1.26 2.13 1.89 1.25 1.50 Difference in Effect Size –0.09 0.16 0.14 0.09 0.11 p-value for the Difference 1.00 0.70 1.00 1.00 0.62
Social Studies Reading Comprehension Assessment Score
(1) Students classified as English language learners
Impact –2.02 3.38 4.96 6.83 3.32 Effect Size –0.07 0.11 0.17 0.23 0.11 p-value 1.00 1.00 1.00 0.22 0.89
(2) Students not classified as English language learners Impact 0.66 –1.00 –2.31 –1.39 –1.33 Effect Size 0.02 –0.03 –0.08 –0.05 –0.04 p-value 1.00 1.00 1.00 1.00 0.94
Difference between (1) and (2) Difference in Impact –2.68 4.38 7.27 8.21 4.65 Difference in Effect Size –0.09 0.15 0.24 0.28 0.16 p-value for the Difference 1.00 1.00 1.00 0.39 0.68

Table III.21 (continued)
95
Project CRISS ReadAbout
Read for Real
Reading for
Knowledge
Combined Treatment
Group
Science Reading Comprehension Assessment Score
(1) Students classified as English language learners
Impact –1.37 0.46 4.43 1.12 0.87 Effect Size –0.05 0.02 0.16 0.04 0.03 p-value 1.00 1.00 1.00 1.00 1.00
(2) Students not classified as English language learners Impact 1.25 0.41 –0.75 –3.25 –0.39 Effect Size 0.05 0.02 –0.03 –0.12 –0.01 p-value 1.00 1.00 1.00 0.98 1.00
Difference between (1) and (2) Difference in Impact –2.62 0.05 5.18 4.37 1.26 Difference in Effect Size –0.09 0.00 0.19 0.16 0.05 p-value for the Difference 1.00 1.00 1.00 1.00 1.00
Number of Students Classified as English Language Learnersb 222 298 292 188 1,000
Number of Students Not Classified as English Language Learners 690 662 634 634 2,620
Source: Reading comprehension tests administered by study team.
Note: For each outcome and for each subgroup, the numbers reported are, by row, (1) the impact, (2) the effect
size, and (3) the p-value of the impact. For each outcome, the differences between subgroup impacts are also reported. All p-values were calculated taking into account the clustering of students within schools and adjusting for all comparisons shown in this table. The social studies and science reading comprehension assessments were developed by ETS. Variables in the regression model include baseline GRADE and TOSCRF scores, student ethnicity and race, school location, teacher race, and district indicators.
aThe composite is based on the three tests presented in this table. Each test score is converted into a z-score by subtracting the mean and dividing by the standard deviation of the variable for students in the sample. The composite is the simple average of the three z-scores.
bCounts reflect the number of students with a nonmissing English language learner classification. ETS = Educational Testing Service. GRADE = Group Reading Assessment and Diagnostic Evaluation. TOSCRF = Test of Silent Contextual Reading Fluency.

96
TABLE III.22
DIFFERENCES IN SPRING TEST SCORES BETWEEN EACH INTERVENTION GROUP AND THE CONTROL GROUP, COMPARING STUDENTS WITH TEACHERS ABOVE AND BELOW THE MEDIAN
TEACHER EXPERIENCE IN THE STUDY SAMPLE
Project CRISS ReadAbout
Read for Real
Reading for
Knowledge
Combined Treatment
Group
Composite Test Scorea
(1) Students of teachers with less than 10 years of teaching experience (median for study sample)
Impact 0.02 –0.04 –0.07 –0.07 –0.07 Effect Size 0.03 –0.04 –0.08 –0.08 –0.08 p-value 1.00 1.00 0.99 0.98 0.41
(2) Students of teachers with 10 or more years of teaching experience (median for study sample) Impact –0.04 –0.03 –0.06 –0.12 –0.06 Effect Size –0.04 –0.04 –0.07 –0.14 –0.07 p-value 1.00 1.00 0.96 0.59 0.30
Difference between (1) and (2) Difference in Impact 0.06 –0.01 –0.01 0.05 –0.01 Difference in Effect Size 0.07 –0.01 –0.01 0.06 –0.01 p-value for the Difference 1.00 1.00 1.00 1.00 0.99
GRADE Score
(1) Students of teachers with less than 10 years of teaching experience (median for study sample)
Impact 0.26 –0.79 –0.79 –2.23 –1.08 Effect Size 0.02 –0.06 –0.06 –0.16 –0.08 p-value 1.00 1.00 1.00 0.88 0.68
(2) Students of teachers with 10 or more years of teaching experience (median for study sample) Impact –0.77 –0.50 –0.53 –0.32 –0.76 Effect Size –0.06 –0.04 –0.04 –0.02 –0.06 p-value 1.00 1.00 1.00 1.00 0.64
Difference between (1) and (2) Difference in Impact 1.03 –0.29 –0.26 –1.91 –0.32 Difference in Effect Size 0.07 –0.02 –0.02 –0.14 –0.02 p-value for the Difference 1.00 1.00 1.00 1.00 1.00
Social Studies Reading Comprehension Assessment Score
(1) Students of teachers with less than 10 years of teaching experience (median for study sample)
Impact 3.23 –1.22 –1.77 1.43 –0.08 Effect Size 0.11 –0.04 –0.06 0.05 –0.00 p-value 1.00 1.00 1.00 1.00 1.00
(2) Students of teachers with 10 or more years of teaching experience (median for study sample) Impact –3.87 1.25 –1.97 –3.03 –2.09 Effect Size –0.13 0.04 –0.07 –0.10 –0.07 p-value 1.00 1.00 1.00 1.00 0.88
Difference between (1) and (2) Difference in Impact 7.10 –2.47 0.20 4.46 2.01 Difference in Effect Size 0.24 –0.08 0.01 0.15 0.07 p-value for the Difference 1.00 1.00 1.00 1.00 1.00

Table III.22 (continued)
97
Project CRISS ReadAbout
Read for Real
Reading for
Knowledge
Combined Treatment
Group
Science Reading Comprehension Assessment Score
(1) Students of teachers with less than 10 years of teaching experience (median for study sample)
Impact 0.08 0.34 0.93 –0.94 –0.60 Effect Size 0.00 0.01 0.03 –0.03 –0.02 p-value 1.00 1.00 1.00 1.00 1.00
(2) Students of teachers with 10 or more years of teaching experience (median for study sample) Impact 0.99 –2.39 –3.73 –10.00* –3.85 Effect Size 0.04 –0.09 –0.14 –0.36 –0.14 p-value 1.00 1.00 1.00 0.04 0.41
Difference between (1) and (2) Difference in Impact –0.91 2.74 4.66 9.06 3.25 Difference in Effect Size –0.03 0.10 0.17 0.33 0.12 p-value for the Difference 1.00 1.00 1.00 0.96 0.94
Number of Students in Classes with Teachers with Less than 10 Years of Teaching Experienceb 663 555 542 517 2,277
Number of Students in Classes with Teachers with 10 or More Years of Teaching Experience 625 595 518 565 2,303
Source: Reading comprehension tests administered by study team.
Note: For each outcome and for each subgroup, the numbers reported are, by row, (1) the impact, (2) the effect
size, and (3) the p-value of the impact. For each outcome, the differences between subgroup impacts are also reported. All p-values were calculated taking into account the clustering of students within schools and adjusting for all comparisons shown in this table. The social studies and science reading comprehension assessments were developed by ETS. Variables in the regression model include baseline GRADE and TOSCRF scores, student ethnicity and race, student English language learner status, school location, teacher race, and district indicators.
aThe composite is based on the three tests presented in this table. Each test score is converted into a z-score by subtracting the mean and dividing by the standard deviation of the variable for students in the sample. The composite is the simple average of the three z-scores.
bCounts reflect the number of students that have teachers with nonmissing experience data. *Statistically different at the .05 level. ETS = Educational Testing Service. GRADE = Group Reading Assessment and Diagnostic Evaluation. TOSCRF = Test of Silent Contextual Reading Fluency.

98
TABLE III.23
DIFFERENCES IN SPRING TEST SCORES BETWEEN EACH INTERVENTION GROUP AND THE CONTROL GROUP, COMPARING STUDENTS WITH TEACHERS WITH LESS THAN OR
MORE THAN 5 YEARS TEACHING EXPERIENCE
Project CRISS ReadAbout
Read for Real
Reading for
Knowledge
Combined Treatment
Group
Composite Test Scorea
(1) Students of teachers with less than 5 years of teaching experience
Impact 0.06 –0.06 0.14 –0.16 –0.04 Effect Size 0.07 –0.07 0.16 –0.18 –0.05 p-value 1.00 1.00 1.00 0.97 0.88
(2) Students of teachers with 5 or more years of teaching experience Impact –0.04 –0.03 –0.12 –0.09 –0.08* Effect Size –0.05 –0.04 –0.14 –0.10 –0.09 p-value 0.99 1.00 0.34 0.67 0.05
Difference between (1) and (2) Difference in Impact 0.11 –0.03 0.26 –0.07 0.04 Difference in Effect Size 0.12 –0.03 0.30 –0.08 0.04 p-value for the Difference 1.00 1.00 0.94 1.00 0.93
GRADE Score
(1) Students of teachers with less than 5 years of teaching experience
Impact 0.96 –1.62 –1.07 –2.64 –0.17 Effect Size 0.07 –0.12 –0.08 –0.19 –0.01 p-value 1.00 1.00 1.00 0.88 1.00
(2) Students of teachers with 5 or more years of teaching experience Impact –1.10 –0.68 –0.88 –1.16 –1.25 Effect Size –0.08 –0.05 –0.06 –0.08 –0.09 p-value 0.99 1.00 0.99 0.96 0.09
Difference between (1) and (2) Difference in Impact 2.06 –0.94 –0.19 –1.47 1.08 Difference in Effect Size 0.15 –0.07 –0.01 –0.11 0.08 p-value for the Difference 1.00 1.00 1.00 1.00 0.98
Social Studies Reading Comprehension Assessment Score
(1) Students of teachers with less than 5 years of teaching experience
Impact 2.16 0.59 2.24 –1.27 3.42 Effect Size 0.07 0.02 0.08 –0.04 0.12 p-value 1.00 1.00 1.00 1.00 0.96
(2) Students of teachers with 5 or more years of teaching experience Impact –1.30 0.01 –2.92 –2.07 –2.11 Effect Size –0.04 0.00 –0.10 –0.07 –0.07 p-value 1.00 1.00 0.89 1.00 0.63
Difference between (1) and (2) Difference in Impact 3.47 0.58 5.15 0.80 5.54 Difference in Effect Size 0.12 0.02 0.17 0.03 0.19 p-value for the Difference 1.00 1.00 1.00 1.00 0.84

Table III.23 (continued)
99
Project CRISS ReadAbout
Read for Real
Reading for
Knowledge
Combined Treatment
Group
Science Reading Comprehension Assessment Score
(1) Students of teachers with less than 5 years of teaching experience
Impact –1.73 1.00 4.83 –3.78 –4.78 Effect Size –0.06 0.04 0.17 –0.14 –0.17 p-value 1.00 1.00 1.00 1.00 0.78
(2) Students of teachers with 5 or more years of teaching experience Impact 2.04 –1.21 –3.27 –6.10 –2.31 Effect Size 0.07 –0.04 –0.12 –0.22 –0.08 p-value 0.99 1.00 0.98 0.07 0.66
Difference between (1) and (2) Difference in Impact –3.78 2.21 8.09 2.33 –2.48 Difference in Effect Size –0.14 0.08 0.29 0.08 –0.09 p-value for the Difference 1.00 1.00 0.91 1.00 0.99
Number of Students in Classes Taught by Teachers with Less than 5 Years of Teaching Experienceb 337 386 261 248 1,232
Number of Students in Classes Taught by Teachers with 5 or More Years of Teaching Experience 951 764 799 834 3,348
Source: Reading comprehension tests administered by study team. Note: For each outcome and for each subgroup, the numbers reported are, by row, (1) the impact, (2) the effect
size, (3) the p-value of the impact. For each outcome, the differences between subgroup impacts are also reported. All p-values were calculated taking into account the clustering of students within schools and adjusting for all comparisons shown in this table. The social studies and science reading comprehension assessments were developed by ETS. Variables in the regression model include Baseline GRADE Score, Baseline TOSCRF Score, student ethnicity and race, student Limited English Proficiency (LEP) status, school location, teacher ethnicity and race, and district indicators.
aThe composite is based on the three tests presented in this table. Each test score is converted into a z-score by subtracting the mean and dividing by the standard deviation of the variable for students in the sample. The composite is the simple average of the three z-scores.
bCounts reflect the number of students with non-missing teacher experience data. *Statistically different at the .05 level. ETS = Educational Testing Service. GRADE = Group Reading Assessment and Diagnostic Evaluation. TOSCRF = Test of Silent Contextual Reading Fluency.

100
TABLE III.24
DIFFERENCES IN SPRING TEST SCORES BETWEEN EACH INTERVENTION GROUP AND THE CONTROL GROUP, BY TEACHER PAST PROFESSIONAL DEVELOPMENT
Project CRISS ReadAbout
Read for Real
Reading for
Knowledge
Combined Treatment
Group
Composite Test Scorea
(1) Students of teachers with less than 1.5 hours reading instruction professional development in past 12 monthsb
Impact 0.24 0.03 –0.02 0.03 –0.02 Effect Size 0.26 0.03 –0.02 0.03 –0.02 p-value 0.10 1.00 1.00 1.00 0.96 (2) Students of teachers with 1.5 or more hours reading instruction professional development in past 12 monthsImpact –0.15 –0.10 –0.11 –0.16 –0.09 Effect Size –0.17 –0.11 –0.13 –0.18 –0.11 p-value 0.35 0.90 0.61 0.17 0.15
Difference between (1) and (2) Difference in Impact 0.38 0.12 0.09 0.19 0.08 Difference in Effect Size 0.43 0.14 0.10 0.22 0.09 p-value for the Difference 0.09 0.98 0.99 0.69 0.71
GRADE Score
(1) Students of teachers with less than 1.5 hours reading instruction professional development in past 12 monthsb
Impact 2.38 0.10 0.55 0.83 –0.04 Effect Size 0.17 0.01 0.04 0.06 –0.00 p-value 0.76 1.00 1.00 1.00 1.00 (2) Students of teachers with 1.5 or more hours reading instruction professional development in past 12 monthsImpact –1.68 –1.13 –1.52 –2.09 –1.21 Effect Size –0.12 –0.08 –0.11 –0.15 –0.09 p-value 0.91 1.00 0.91 0.56 0.44
Difference between (1) and (2) Difference in Impact 4.06 1.22 2.07 2.91 1.17 Difference in Effect Size 0.30 0.09 0.15 0.21 0.09 p-value for the Difference 0.62 1.00 0.99 0.90 0.94
Social Studies Reading Comprehension Assessment Score
(1) Students of teachers with less than 1.5 hours reading instruction professional development in past 12 monthsb
Impact 8.60 1.24 –1.21 2.17 0.77 Effect Size 0.29 0.04 –0.04 0.07 0.03 p-value 0.53 1.00 1.00 1.00 1.00 (2) Students of teachers with 1.5 or more hours reading instruction professional development in past 12 monthsImpact –5.33 –1.35 –2.74 –2.22 –1.72 Effect Size –0.18 –0.05 –0.09 –0.07 –0.06 p-value 0.96 1.00 1.00 1.00 0.98
Difference between (1) and (2) Difference in Impact 13.93 2.59 1.52 4.39 2.48 Difference in Effect Size 0.47 0.09 0.05 0.15 0.08 p-value for the Difference 0.53 1.00 1.00 1.00 0.99

Table III.24 (continued)
101
Project CRISS ReadAbout
Read for Real
Reading for
Knowledge
Combined Treatment
Group
Science Reading Comprehension Assessment Score
(1) Students of teachers with less than 1.5 hours reading instruction professional development in past 12 monthsb
Impact 7.28 0.43 –2.46 –3.31 –1.91 Effect Size 0.26 0.02 –0.09 –0.12 –0.07 p-value 0.35 1.00 1.00 1.00 0.99 (2) Students of teachers with 1.5 or more hours reading instruction professional development in past 12 monthsImpact –3.78 –3.30 –2.73 –7.67 –4.27 Effect Size –0.14 –0.12 –0.10 –0.28 –0.15 p-value 0.93 0.98 1.00 0.17 0.13
Difference between (1) and (2) Difference in Impact 11.07 3.72 0.27 4.36 2.36 Difference in Effect Size 0.40 0.13 0.01 0.16 0.09 p-value for the Difference 0.41 1.00 1.00 1.00 0.99
Number of Students in Classes with Teachers with Less than 1.5 hours Reading Instruction Professional Development in Past 12 Monthsc 470 468 416 282 1,636
Number of Students in Classes with Teachers with 1.5 or More Hours Reading Instruction Professional Development in Past 12 Months 818 682 620 800 2,920
Source: Reading comprehension tests administered by study team.
Note: For each outcome and for each subgroup, the numbers reported are, by row, (1) the impact, (2) the effect
size, and (3) the p-value of the impact. For each outcome, the differences between subgroup impacts are also reported. All p-values were calculated taking into account the clustering of students within schools and adjusting for all comparisons shown in this table. The social studies and science reading comprehension assessments were developed by ETS. Variables in the regression model include baseline GRADE and TOSCRF scores, student ethnicity and race, student English language learner status, school location, teacher race, and district indicators.
aThe composite is based on the three tests presented in this table. Each test score is converted into a z-score by subtracting the mean and dividing by the standard deviation of the variable for students in the sample. The composite is the simple average of the three z-scores.
bThis data is from the Teacher Survey, which was conducted in the fall. Professional development could include any training, including training on the study interventions for treatment group teachers. This cutoff point is the median.
cCounts reflect the number of students that have teachers with nonmissing data on reading instruction professional development.
ETS = Educational Testing Service. GRADE = Group Reading Assessment and Diagnostic Evaluation. TOSCRF = Test of Silent Contextual Reading Fluency.

102
TABLE III.25
DIFFERENCES IN SPRING TEST SCORES BETWEEN EACH INTERVENTION GROUP AND THE CONTROL GROUP, BY TEACHER EFFICACY
Project CRISS ReadAbout
Read for Real
Reading for
Knowledge
Combined Treatment
Group
Composite Test Scorea
(1) Students of teachers with an overall teacher efficacy scale score lower than 4.16b
Impact –0.19 0.03 –0.19 –0.09 –0.11 Effect Size –0.21 0.03 –0.21 –0.10 –0.13 p-value 0.17 1.00 0.26 0.85 0.09
(2) Students of teachers with an overall teacher efficacy scale score equal to or higher than 4.16 Impact 0.13 –0.13 0.05 –0.14 –0.03 Effect Size 0.14 –0.14 0.06 –0.15 –0.03 p-value 0.17 0.41 1.00 0.43 0.80
Difference between (1) and (2) Difference in Impact –0.32 0.16 –0.24 0.04 –0.08 Difference in Effect Size –0.36 0.18 –0.27 0.05 –0.09 p-value for the Difference 0.05 0.78 0.62 1.00 0.57
GRADE Score
(1) Students of teachers with an overall teacher efficacy scale score lower than 4.16b
Impact –2.46 0.02 –2.05 –0.41 –1.34 Effect Size –0.18 0.00 –0.15 –0.03 –0.10 p-value 0.52 1.00 0.80 1.00 0.40
(2) Students of teachers with an overall teacher efficacy scale score equal to or higher than 4.16 Impact 1.37 –1.49 0.79 –2.71 –0.50 Effect Size 0.10 –0.11 0.06 –0.20 –0.04 p-value 0.96 0.95 1.00 0.41 0.98
Difference between (1) and (2) Difference in Impact –3.84 1.52 –2.85 2.31 –0.83 Difference in Effect Size –0.28 0.11 –0.21 0.17 –0.06 p-value for the Difference 0.50 1.00 0.93 0.99 0.98
Social Studies Reading Comprehension Assessment Score
(1) Students of teachers with an overall teacher efficacy scale score lower than 4.16b
Impact –9.26 3.86 –4.52 –3.24 –2.81 Effect Size –0.31 0.13 –0.15 –0.11 –0.09 p-value 0.45 0.95 0.94 0.94 0.69
(2) Students of teachers with an overall teacher efficacy scale score equal to or higher than 4.16 Impact 6.20 –5.10 –0.46 1.09 0.22 Effect Size 0.21 –0.17 –0.02 0.04 0.01 p-value 0.43 0.36 1.00 1.00 1.00
Difference between (1) and (2) Difference in Impact –15.46 8.96 –4.07 –4.33 –3.04 Difference in Effect Size –0.52 0.30 –0.14 –0.15 –0.10 p-value for the Difference 0.16 0.43 1.00 1.00 0.93

Table III.25 (continued)
103
Project CRISS ReadAbout
Read for Real
Reading for
Knowledge
Combined Treatment
Group
Science Reading Comprehension Assessment Score
(1) Students of teachers with an overall teacher efficacy scale score lower than 4.16b
Impact –2.80 1.34 –6.04 –7.51 –4.66 Effect Size –0.10 0.05 –0.22 –0.27 –0.17 p-value 1.00 1.00 0.87 0.77 0.38
(2) Students of teachers with an overall teacher efficacy scale score equal to or higher than 4.16 Impact 3.04 –4.74 2.20 –4.09 –0.99 Effect Size 0.11 –0.17 0.08 –0.15 –0.04 p-value 0.98 0.83 1.00 0.99 1.00
Difference between (1) and (2) Difference in Impact –5.84 6.07 –8.23 –3.42 –3.67 Difference in Effect Size –0.21 0.22 –0.30 –0.12 –0.13 p-value for the Difference 0.98 0.99 0.97 1.00 0.92
Number of Students in Classes with Teachers with an Overall Teacher Efficacy Scale Score Lower than 4.16c 587 598 473 588 2,246
Number of Students in Classes with Teachers with an Overall Teacher Efficacy Scale Score Equal to or Higher than 4.16 701 552 587 494 2,334
Source: Reading comprehension tests administered by study team.
Note: For each outcome and for each subgroup, the numbers reported are, by row, (1) the impact, (2) the effect
size, and (3) the p-value of the impact. For each outcome, the differences between subgroup impacts are also reported. All p-values were calculated taking into account the clustering of students within schools and adjusting for all comparisons shown in this table. The social studies and science reading comprehension assessments were developed by ETS. Variables in the regression model include baseline GRADE and TOSCRF scores, student ethnicity and race, student English language learner status, school location, teacher race, and district indicators.
aThe composite is based on the three tests presented in this table. Each test score is converted into a z-score by subtracting the mean and dividing by the standard deviation of the variable for students in the sample. The composite is the simple average of the three z-scores.
bThis cutoff point is the median.
cCounts reflect the number of students that have teachers with nonmissing teacher efficacy data. ETS = Educational Testing Service. GRADE = Group Reading Assessment and Diagnostic Evaluation. TOSCRF = Test of Silent Contextual Reading Fluency.

104
TABLE III.26
DIFFERENCES IN SPRING TEST SCORES BETWEEN EACH INTERVENTION GROUP AND THE CONTROL GROUP, BY PROFESSIONAL CULTURE IN SCHOOL
Project CRISS ReadAbout
Read for Real
Reading for
Knowledge
Combined Treatment
Group
Composite Test Scorea
(1) Students in schools with a professional culture scale score lower than 5.67b
Impact –0.10 –0.12 –0.14 –0.16 –0.12* Effect Size –0.12 –0.13 –0.16 –0.18 –0.14 p-value 0.80 0.61 0.65 0.17 0.04
(2) Students in schools with a professional culture scale score equal to or higher than 5.67 Impact 0.07 0.04 0.06 –0.03 0.01 Effect Size 0.08 0.04 0.07 –0.03 0.01 p-value 0.94 1.00 0.99 1.00 0.99
Difference between (1) and (2) Difference in Impact –0.17 –0.15 –0.20 –0.13 –0.13 Difference in Effect Size –0.19 –0.17 –0.23 –0.15 –0.14 p-value for the Difference 0.73 0.82 0.79 0.97 0.24
GRADE Score
(1) Students in schools with a professional culture scale score lower than 5.67b
Impact –1.90 –1.96 –1.01 –2.25 –1.72 Effect Size –0.14 –0.14 –0.07 –0.16 –0.13 p-value 0.86 0.86 1.00 0.58 0.11
(2) Students in schools with a professional culture scale score equal to or higher than 5.67 Impact 0.91 0.48 0.01 –0.23 0.14 Effect Size 0.07 0.04 0.00 –0.02 0.01 p-value 1.00 1.00 1.00 1.00 1.00
Difference between (1) and (2) Difference in Impact –2.81 –2.44 –1.02 –2.01 –1.86 Difference in Effect Size –0.20 –0.18 –0.07 –0.15 –0.14 p-value for the Difference 0.92 0.98 1.00 1.00 0.52
Social Studies Reading Comprehension Assessment Score
(1) Students in schools with a professional culture scale score lower than 5.67b
Impact –2.00 2.87 0.65 1.06 0.84 Effect Size –0.07 0.10 0.02 0.04 0.03 p-value 1.00 1.00 1.00 1.00 1.00
(2) Students in schools with a professional culture scale score equal to or higher than 5.67 Impact 0.84 –2.51 –3.00 –2.14 –1.99 Effect Size 0.03 –0.08 –0.10 –0.07 –0.07 p-value 1.00 1.00 1.00 1.00 0.83
Difference between (1) and (2) Difference in Impact –2.84 5.39 3.65 3.20 2.83 Difference in Effect Size –0.10 0.18 0.12 0.11 0.10 p-value for the Difference 1.00 0.99 1.00 1.00 0.87

Table III.26 (continued)
105
Project CRISS ReadAbout
Read for Real
Reading for
Knowledge
Combined Treatment
Group
Science Reading Comprehension Assessment Score
(1) Students in schools with a professional culture scale score lower than 5.67b
Impact –2.36 –7.19 –7.88 –9.00 –6.66 Effect Size –0.09 –0.26 –0.29 –0.33 –0.24 p-value 1.00 0.44 0.62 0.17 0.08
(2) Students in schools with a professional culture scale score equal to or higher than 5.67 Impact 2.79 4.04 6.24 –3.11 1.34 Effect Size 0.10 0.15 0.23 –0.11 0.05 p-value 0.99 0.92 0.86 1.00 0.99
Difference between (1) and (2) Difference in Impact –5.15 –11.23 –14.12 –5.89 –8.01 Difference in Effect Size –0.19 –0.41 –0.51 –0.21 –0.29 p-value for the Difference 1.00 0.42 0.46 1.00 0.29
Number of Students in Schools with a Professional Culture Scale Score Lower than 5.67c 564 596 643 607 2,410
Number of Students in Schools with a Professional Culture Scale Score Equal to or Higher than 5.67 724 554 441 475 2,194
Source: Reading comprehension tests administered by study team.
Note: For each outcome and for each subgroup, the numbers reported are, by row, (1) the impact, (2) the effect
size, and (3) the p-value of the impact. For each outcome, the differences between subgroup impacts are also reported. All p-values were calculated taking into account the clustering of students within schools and adjusting for all comparisons shown in this table. The social studies and science reading comprehension assessments were developed by ETS. Variables in the regression model include baseline GRADE and TOSCRF scores, student ethnicity and race, student English language learner status, school location, teacher race, and district indicators.
aThe composite is based on the three tests presented in this table. Each test score is converted into a z-score by subtracting the mean and dividing by the standard deviation of the variable for students in the sample. The composite is the simple average of the three z-scores.
bThis cutoff point is the median.
cCounts reflect the number of students with nonmissing values for the school-level professional culture scale. *Statistically different at the .05 level. ETS = Educational Testing Service. GRADE = Group Reading Assessment and Diagnostic Evaluation. TOSCRF = Test of Silent Contextual Reading Fluency.

106
TABLE III.27
DIFFERENCES IN SPRING TEST SCORES BETWEEN EACH INTERVENTION GROUP AND THE CONTROL GROUP, BY PERCENTAGE OF STUDENTS IN THE SCHOOL ELIGIBLE FOR FREE OR
REDUCED-PRICE LUNCH
Project CRISS ReadAbout
Read for Real
Reading for
Knowledge
Combined Treatment
Group
Composite Test Scorea
(1) Students in schools with less than 79.2 percent of students eligible for free or reduced-price lunchb
Impact –0.03 –0.03 –0.05 –0.16 –0.07 Effect Size –0.03 –0.03 –0.05 –0.18 –0.07 p-value 1.00 1.00 0.99 0.10 0.29
(2) Students in schools with 79.2 percent or more of students eligible for free or reduced-price lunch Impact –0.04 –0.08 –0.11 –0.09 –0.10* Effect Size –0.04 –0.09 –0.12 –0.10 –0.11 p-value 1.00 0.91 0.70 0.76 0.05
Difference between (1) and (2) Difference in Impact 0.01 0.05 0.06 –0.07 0.03 Difference in Effect Size 0.01 0.06 0.07 –0.08 0.04 p-value for the Difference 1.00 1.00 1.00 0.99 0.83
GRADE Score
(1) Students in schools with less than 79.2 percent of students eligible for free or reduced-price lunchb
Impact –0.79 –0.41 –0.52 –1.92 –0.98 Effect Size –0.06 –0.03 –0.04 –0.14 –0.07 p-value 1.00 1.00 1.00 0.37 0.44
(2) Students in schools with 79.2 percent or more of students eligible for free or reduced-price lunch Impact –0.23 –1.37 –1.11 –1.14 –1.20 Effect Size –0.02 –0.10 –0.08 –0.08 –0.09 p-value 1.00 0.99 1.00 1.00 0.26
Difference between (1) and (2) Difference in Impact –0.56 0.96 0.60 –0.78 0.23 Difference in Effect Size –0.04 0.07 0.04 –0.06 0.02 p-value for the Difference 1.00 1.00 1.00 1.00 1.00
Social Studies Reading Comprehension Assessment Score
(1) Students in schools with less than 79.2 percent of students eligible for free or reduced-price lunchb
Impact –2.01 –1.92 –1.36 –4.30 –2.30 Effect Size –0.07 –0.06 –0.05 –0.14 –0.08 p-value 1.00 1.00 1.00 0.60 0.62
(2) Students in schools with 79.2 percent or more of students eligible for free or reduced-price lunch Impact –0.07 0.88 –2.39 0.65 –0.49 Effect Size –0.00 0.03 –0.08 0.02 –0.02 p-value 1.00 1.00 1.00 1.00 1.00
Difference between (1) and (2) Difference in Impact –1.94 –2.80 1.03 –4.95 –1.81 Difference in Effect Size –0.07 –0.09 0.03 –0.17 –0.06 p-value for the Difference 1.00 1.00 1.00 0.97 0.98

Table III.27 (continued)
107
Project CRISS ReadAbout
Read for Real
Reading for
Knowledge
Combined Treatment
Group
Science Reading Comprehension Assessment Score
(1) Students in schools with less than 79.2 percent of students eligible for free or reduced-price lunchb
Impact 1.51 0.82 0.09 –5.74 –1.18 Effect Size 0.05 0.03 0.00 –0.21 –0.04 p-value 1.00 1.00 1.00 0.35 0.98
(2) Students in schools with 79.2 percent or more of students eligible for free or reduced-price lunch Impact –0.75 –2.77 –3.50 –5.60 –3.87 Effect Size –0.03 –0.10 –0.13 –0.20 –0.14 p-value 1.00 1.00 1.00 0.72 0.27
Difference between (1) and (2) Difference in Impact 2.26 3.58 3.59 –0.14 2.69 Difference in Effect Size 0.08 0.13 0.13 –0.01 0.10 p-value for the Difference 1.00 1.00 1.00 1.00 0.90
Number of Students in Schools with Low Concentration of Disadvantaged Studentsc 637 523 551 718 2,429
Number of Students in Schools with High Concentration of Disadvantaged Students 679 725 455 473 2,332
Source: Reading comprehension tests administered by study team.
Note: For each outcome and for each subgroup, the numbers reported are, by row, (1) the impact, (2) the effect
size, and (3) the p-value of the impact. For each outcome, the differences between subgroup impacts are also reported. All p-values were calculated taking into account the clustering of students within schools and adjusting for all comparisons shown in this table. The social studies and science reading comprehension assessments were developed by ETS. Variables in the regression model include baseline GRADE and TOSCRF scores, student ethnicity and race, student English language learner status, school location, teacher race, and district indicators.
aThe composite is based on the three tests presented in this table. Each test score is converted into a z-score by subtracting the mean and dividing by the standard deviation of the variable for students in the sample. The composite is the simple average of the three z-scores.
bThis cutoff point is the median.
cCounts reflect the number of students with nonmissing values for the school-level disadvantaged student subgroup indicator.
*Statistically different at the .05 level. ETS = Educational Testing Service. GRADE = Group Reading Assessment and Diagnostic Evaluation. TOSCRF = Test of Silent Contextual Reading Fluency.

108
TABLE III.28
DIFFERENCES IN SPRING TEST SCORES BETWEEN EACH INTERVENTION GROUP AND THE CONTROL GROUP, BY PERCENTAGE OF STUDENTS IN THE SCHOOL CLASSIFIED AS ENGLISH
LANGUAGE LEARNERS
Project CRISS ReadAbout
Read for Real
Reading for
Knowledge
Combined Treatment
Group
Composite Test Scorea
(1) Students in schools with less than 6.8 percent of students classified as English Language Learnersb
Impact –0.03 –0.16 –0.16 –0.12 –0.14* Effect Size –0.03 –0.18 –0.18 –0.14 –0.15 p-value 1.00 0.24 0.28 0.67 0.00
(2) Students in schools with 6.8 percent or more of students classified as English Language Learners Impact 0.07 0.06 0.05 –0.02 0.03 Effect Size 0.08 0.07 0.06 –0.02 0.03 p-value 0.85 0.96 0.98 1.00 0.75
Difference between (1) and (2) Difference in Impact –0.09 –0.22 –0.21 –0.10 –0.17* Difference in Effect Size –0.11 –0.25 –0.23 –0.11 –0.19 p-value for the Difference 0.97 0.25 0.24 0.91 0.02
GRADE Score
(1) Students in schools with less than 6.8 percent of students classified as English Language Learnersb
Impact –0.56 –2.55 –2.03 –1.32 –2.02* Effect Size –0.04 –0.19 –0.15 –0.10 –0.15 p-value 1.00 0.52 0.45 1.00 0.01
(2) Students in schools with 6.8 percent or more of students classified as English Language Learners Impact 1.02 0.30 0.69 –0.67 0.27 Effect Size 0.07 0.02 0.05 –0.05 0.02 p-value 1.00 1.00 1.00 1.00 1.00
Difference between (1) and (2) Difference in Impact –1.58 –2.85 –2.71 –0.66 –2.29 Difference in Effect Size –0.12 –0.21 –0.20 –0.05 –0.17 p-value for the Difference 1.00 0.86 0.38 1.00 0.10
Social Studies Reading Comprehension Assessment Score
(1) Students in schools with less than 6.8 percent of students classified as English Language Learnersb
Impact –0.88 –1.90 –3.80 –2.45 –2.46 Effect Size –0.03 –0.06 –0.13 –0.08 –0.08 p-value 1.00 1.00 0.96 1.00 0.58
(2) Students in schools with 6.8 percent or more of students classified as English Language Learners Impact 0.88 1.32 0.86 1.19 0.77 Effect Size 0.03 0.04 0.03 0.04 0.03 p-value 1.00 1.00 1.00 1.00 1.00
Difference between (1) and (2) Difference in Impact –1.76 –3.22 –4.66 –3.64 –3.23 Difference in Effect Size –0.06 –0.11 –0.16 –0.12 –0.11 p-value for the Difference 1.00 1.00 1.00 1.00 0.76

Table III.28 (continued)
109
Project CRISS ReadAbout
Read for Real
Reading for
Knowledge
Combined Treatment
Group
Science Reading Comprehension Assessment Score
(1) Students in schools with less than 6.8 percent of students classified as English Language Learnersb
Impact 1.22 –5.70 –3.87 –6.90 –4.21 Effect Size 0.04 –0.21 –0.14 –0.25 –0.15 p-value 1.00 0.67 1.00 0.69 0.44
(2) Students in schools with 6.8 percent or more of students classified as English Language Learners Impact 2.02 4.38 0.04 –0.12 1.82 Effect Size 0.07 0.16 0.00 –0.00 0.07 p-value 1.00 0.06 1.00 1.00 0.76
Difference between (1) and (2) Difference in Impact –0.81 –10.08 –3.92 –6.79 –6.04 Difference in Effect Size –0.03 –0.36 –0.14 –0.25 –0.22 p-value for the Difference 1.00 0.10 1.00 0.90 0.26
Number of Students in Schools with Low Concentration of English language learnersc 340 497 456 385 1,678
Number of Students in Schools with High Concentration of English language learners 691 575 552 539 2,357
Source: Reading comprehension tests administered by study team.
Note: For each outcome and for each subgroup, the numbers reported are, by row, (1) the impact, (2) the effect
size, and (3) the p-value of the impact. For each outcome, the differences between subgroup impacts are also reported. All p-values were calculated taking into account the clustering of students within schools and adjusting for all comparisons shown in this table. The social studies and science reading comprehension assessments were developed by ETS. Variables in the regression model include baseline GRADE and TOSCRF scores, student ethnicity and race, student English language learner status, school location, teacher race, and district indicators.
aThe composite is based on the three tests presented in this table. Each test score is converted into a z-score by subtracting the mean and dividing by the standard deviation of the variable for students in the sample. The composite is the simple average of the three z-scores.
bThis cutoff point is the median.
cCounts reflect the number of students with nonmissing values for the school-level English language learner subgroup indicator.
*Statistically different at the .05 level. ETS = Educational Testing Service. GRADE = Group Reading Assessment and Diagnostic Evaluation. TOSCRF = Test of Silent Contextual Reading Fluency.

110
As mentioned above, we adjust for multiple comparisons within each subgroup analyzed. For example, within Table III.11, we adjust for all of the comparisons in that table. We do not adjust for multiple comparisons across all of the subgroups examined on the study.
Findings. Although reading comprehension test scores in schools using the selected reading
comprehension curricula were statistically significantly lower than scores in control schools for subgroups of students defined by certain characteristics of the students, their teachers, and their schools, no clear pattern to these findings emerged. In addition, one percent of all of the subgroup impacts estimated (15 of 1,080) were statistically significant (which is less than the 5 percent of differences that one might expect to occur by chance alone).
In particular, for subgroups based on student characteristics, we did not find any positive,
statistically significant impacts, and we found statistically significant negative impacts for subgroups defined by students’ baseline fluency and comprehension levels (Tables III.11 through III.21). Overall, the findings show that comprehension assessment scores were lower in the treatment group than the control group for students with comprehension skills at baseline in the bottom third of the sample, and for students with above-average fluency skills at baseline. We observed these negative impacts for the combined treatment group on the following:
• Social studies reading comprehension assessment scores of students with baseline
fluency levels above the norm sample average (Table III.11, effect size: -0.23), above the study sample median (Table III.12, effect size: -0.14), or in the top third of the TOSCRF distribution (Table III.15, effect size: -0.15)54
• GRADE and composite test scores of students with baseline comprehension levels in the bottom third of the GRADE distribution (Tables III.18 and III.19, effect sizes: -0.14, -0.15, -0.09, and -0.08)55
Using the teacher and school characteristics listed above, we examined whether impacts vary across subgroups of students defined by teacher characteristics and school conditions. We used the same analytic approach as the one used to analyze subgroups of students defined by student characteristics. We did not find any statistically significant, positive effect of the interventions, and we found statistically significant, negative impacts for four of the six subgroups (7 of the 420 impacts estimated for subgroups defined by teacher and school characteristics) (see Tables III.22 through III.28). In particular:
• We found statistically significant impacts for one of the subgroups of students defined by teacher characteristics—teacher experience. In particular, we observed a negative
54These findings were observed when comparing students in the middle and top thirds of the TOSCRF
distribution. A similar pattern was found when comparing the bottom and top thirds of the TOSCRF distribution, although those findings were not statistically significant (Table III.13, p-value: 0.33).
55These findings were observed when comparing students in the top and bottom thirds of the GRADE distribution and when comparing students in the middle and bottom thirds of the GRADE distribution. A similar pattern was found in the models split at the sample median and national norm sample average, although those findings were not statistically significant (Tables III.16 and III.17, p-values: 0.13, 0.15, 0.13, and 0.15).

111
impact of Reading for Knowledge on the science comprehension assessment scores of students taught by teachers with more than 10 years of experience (Table III.22, effect size: -0.36). We also observed—for the combined treatment group—a negative impact on the composite scores of students taught by teachers with more than five years of experience (Table III.23, effect size: -0.09).
• All three of the school condition subgroups were statistically significantly related to impacts. The analyses presented in Tables III.26, III.27, and III.28, respectively, show a negative effect of the combined treatment on the composite test scores of students in schools with a School Professional Culture scale score56 below the sample median (effect size: -0.14), with a concentration of students eligible for free or reduced-price lunch above the median at baseline (effect size: -0.11), and with a concentration of ELL students below the median at baseline (effect size: -0.15). We also observed a negative impact of the combined treatment group (see Table III.28) on the GRADE and composite scores of students in schools with a concentration of ELL students below the median at baseline (effect sizes: -0.15 for each).57
E. COEFFICIENTS ON 3 OF 120 INTERACTIONS BETWEEN TREATMENT STATUS AND TEACHER PRACTICES ARE STATISTICALLY SIGNIFICANT
As an exploratory analysis, we also investigated the relationship between intervention effects and classroom practices. We did this by conducting analyses of test scores for students in classrooms with different levels of observed teaching practices (as described above, we split the sample at the median levels of teacher practices observed). These relationships must be interpreted cautiously because the interventions may have affected the extent to which teachers engage in specific practices or the types of teachers who choose to engage in those practices. More specifically, because the research design did not randomly assign interventions to teachers with different levels of teacher practices, factors that led teachers to have a certain level of teacher practices could explain the observed correlations. As a result, treatment and control teachers who engage in teaching practices to the same degree may differ in unmeasurable ways.58 In other words, analyses based on subgroups defined by teaching practices do not maintain the properties of random assignment. Therefore, it is important to note that these
56As described in Chapter I, the School Professional Culture scale reflects teachers’ perceptions of the culture in their school, including relationships with colleagues, access to professional development, experiences with changes being implemented in their school, and leadership support in their school. See Appendix F for details.
57After finding a negative impact of the interventions in schools with a concentration of students eligible for free or reduced price lunch above the median and a concentration of ELL students below the median, we investigated the correlation between these two variables (as one might expect them to be positively correlated and to show a different pattern of impacts than what was observed). We found that the correlation (accounting for clustering of students within schools) between concentration of ELL students and concentration of students eligible for free or reduced-price lunch in schools in our sample is actually quite low (0.06) and not statistically significant (p-value: 0.75).
58If the intervention affected teacher practices, then that impact on teacher practices might explain the overall impact on student test scores. However, it is not possible to make causal statements about that relationship (causal statements would require a different study design than the one we used on this study, such as one in which teachers or schools were randomly assigned to implement the interventions to different degrees or amounts).

112
estimates of the relationship between intervention effects and teacher practices cannot be interpreted as providing rigorous impact estimates59 and do not allow causal conclusions to be drawn about the impact of the interventions for those subgroups (see Tables III.29 through III.31).
Keeping these caveats in mind, we found no positive, statistically significant relationships
between teacher practices and intervention effects in these analyses, but we did find three statistically significant, negative relationships. In particular, we found that students in Reading for Knowledge classrooms whose teachers had below-average scores on the Reading Strategy Guidance scale had statistically significantly lower composite test scores than students in control group classrooms in which teachers had below-average Reading Strategy Guidance scale (effect size: -0.23, Table III.30). In addition, we found that Students in Read for Real classrooms of teachers with Classroom Management scale scores below the sample median had statistically significantly lower scores than students in control group classrooms taught by teachers with Classroom Management scale scores below the sample median (effect sizes: -0.23 for the composite test score and -0.35 for the social studies reading comprehension test score (Table III.31). In both cases, these findings raise questions for further research, but—as noted above—the estimates do not provide experimental or causal evidence.
59See Appendix Figures F.1A through F.3 for information on how the frequency of specific teacher practices
corresponds to different scale scores.

113
TABLE III.29
DIFFERENCES IN SPRING TEST SCORES BETWEEN EACH INTERVENTION GROUP AND THE CONTROL GROUP, BY TRADITIONAL INTERACTION SCALE SCORE
Project CRISS ReadAbout
Read for Real
Reading for
Knowledge
Combined Treatment
Group
Composite Test Scorea
(1) Students in classrooms with a traditional interaction scale score lower than 499.5b
Difference –0.09 –0.14 –0.06 –0.12 –0.08 Effect Size –0.10 –0.16 –0.07 –0.13 –0.09 p-value 0.93 0.39 0.98 0.78 0.30
(2) Students in classrooms with a traditional interaction scale score equal to or higher than 499.5 Difference 0.10 0.07 –0.07 –0.13 –0.07 Effect Size 0.12 0.08 –0.08 –0.15 –0.08 p-value 0.89 0.95 0.90 0.70 0.36
Difference between (1) and (2) Difference in Difference –0.19 –0.22 0.01 0.01 –0.01 Difference in Effect Sizes –0.22 –0.24 0.01 0.02 –0.01 p-value for the Difference in Difference 0.85 0.56 1.00 1.00 0.99
GRADE Score
(1) Students in classrooms with a traditional interaction scale score lower than 499.5b
Difference –1.67 –1.72 –1.16 –1.53 –1.19 Effect Size –0.12 –0.13 –0.08 –0.11 –0.09 p-value 0.97 0.94 1.00 0.99 0.50
(2) Students in classrooms with a traditional interaction scale score equal to or higher than 499.5 Difference 1.69 0.42 –0.36 –1.58 –0.70 Effect Size 0.12 0.03 –0.03 –0.12 –0.05 p-value 0.95 1.00 1.00 0.99 0.90
Difference between (1) and (2) Difference in Difference –3.36 –2.14 –0.81 0.04 –0.49 Difference in Effect Sizes –0.25 –0.16 –0.06 0.00 –0.04 p-value for the Difference in Difference 0.90 1.00 1.00 1.00 1.00
Social Studies Reading Comprehension Assessment Score
(1) Students in classrooms with a traditional interaction scale score lower than 499.5b
Difference –5.30 –6.63 –2.76 –1.91 –2.89 Effect Size –0.18 –0.22 –0.09 –0.06 –0.10 p-value 0.99 0.48 1.00 1.00 0.77
(2) Students in classrooms with a traditional interaction scale score equal to or higher than 499.5 Difference 4.67 6.23 –1.54 –3.35 –0.40 Effect Size 0.16 0.21 –0.05 –0.11 –0.01 p-value 1.00 0.63 1.00 1.00 1.00
Difference between (1) and (2) Difference in Difference –9.97 –12.85 –1.22 1.44 –2.49 Difference in Effect Sizes –0.34 –0.43 –0.04 0.05 –0.08 p-value for the Difference in Difference 0.99 0.33 1.00 1.00 0.99

Table III.29 (continued)
114
Project CRISS ReadAbout
Read for Real
Reading for
Knowledge
Combined Treatment
Group
Science Reading Comprehension Assessment Score
(1) Students in classrooms with a traditional interaction scale score lower than 499.5b
Difference 1.63 –4.93 1.48 –5.12 –3.08 Effect Size 0.06 –0.18 0.05 –0.19 –0.11 p-value 1.00 0.98 1.00 1.00 0.95
(2) Students in classrooms with a traditional interaction score equal to or higher than 499.5 Difference –0.61 3.47 –4.89 –6.63 –3.35 Effect Size –0.02 0.13 –0.18 –0.24 –0.12 p-value 1.00 0.99 0.95 0.77 0.70
Difference between (1) and (2) Difference in Difference 2.23 –8.40 6.38 1.50 0.27 Difference in Effect Sizes 0.08 –0.30 0.23 0.05 0.01 p-value for the Difference in Difference 1.00 0.94 1.00 1.00 1.00
Number of Students in Classrooms with a Traditional Interaction Scale Score Lower than 499.5c 732 669 599 552 2,552
Number of Students in Classrooms with a Traditional Interaction Scale Score Equal to or Higher than 499.5 486 507 584 589 2,166
Source: Reading comprehension tests administered by study team.
Note: For each outcome and for students in each type of classroom, the numbers reported are, by row, (1) the
difference between each intervention group and the control group, (2) the effect size for the difference, and (3) the p-value of the difference. For each outcome, the differences between differences for students in the two types of classrooms are also reported. All p-values were calculated taking into account the clustering of students within schools and adjusting for all comparisons shown in this table. The social studies and science reading comprehension assessments were developed by ETS. Variables in the regression model include baseline GRADE and TOSCRF scores, student ethnicity and race, student English language learner status, school location, teacher race, and district indicators.
aThe composite is based on the three tests presented in this table. Each test score is converted into a z-score by subtracting the mean and dividing by the standard deviation of the variable for students in the sample. The composite is the simple average of the three z-scores.
bThis cutoff point is the median.
cCounts reflect the number of students that have a teacher with a nonmissing traditional instruction scale score. ETS = Educational Testing Service. GRADE = Group Reading Assessment and Diagnostic Evaluation. TOSCRF = Test of Silent Contextual Reading Fluency.

115
TABLE III.30
DIFFERENCES IN SPRING TEST SCORES BETWEEN EACH INTERVENTION GROUP AND THE CONTROL GROUP, BY READING STRATEGY GUIDANCE SCALE SCORE
Project CRISS ReadAbout
Read for Real
Reading for
Knowledge
Combined Treatment
Group
Composite Test Scorea
(1) Students in classrooms with a reading strategy guidance scale score lower than 499.8b
Difference 0.08 –0.01 –0.10 –0.20* –0.07 Effect Size 0.09 –0.01 –0.11 –0.23 –0.08 p-value 0.90 1.00 0.84 0.02 0.26
(2) Students in classrooms with a reading strategy guidance scale score equal to or higher than 499.8 Difference –0.05 –0.04 –0.01 –0.03 –0.06 Effect Size –0.05 –0.05 –0.01 –0.04 –0.07 p-value 0.99 0.99 1.00 1.00 0.33
Difference between (1) and (2) Difference in Difference 0.13 0.03 –0.09 –0.17 –0.01 Difference in Effect Sizes 0.14 0.04 –0.11 –0.19 –0.01 p-value for the Difference in Difference 0.88 1.00 0.98 0.52 0.99
GRADE Score
(1) Students in classrooms with a reading strategy guidance scale score lower than 499.8b
Difference 0.65 –0.11 –1.40 –2.28 –0.98 Effect Size 0.05 –0.01 –0.10 –0.17 –0.07 p-value 1.00 1.00 0.96 0.24 0.51
(2) Students in classrooms with a reading strategy guidance scale score equal to or higher than 499.8 Difference –0.86 –1.16 –0.03 –0.85 –1.05 Effect Size –0.06 –0.08 –0.00 –0.06 –0.08 p-value 1.00 1.00 1.00 1.00 0.66
Difference between (1) and (2) Difference in Difference 1.51 1.05 –1.37 –1.43 0.07 Difference in Effect Sizes 0.11 0.08 –0.10 –0.10 0.00 p-value for the Difference in Difference 1.00 1.00 1.00 1.00 1.00
Social Studies Reading Comprehension Assessment Score
(1) Students in classrooms with a reading strategy guidance scale score lower than 499.8b
Difference 2.79 2.02 –1.50 –4.40 –0.55 Effect Size 0.09 0.07 –0.05 –0.15 –0.02 p-value 1.00 1.00 1.00 0.86 1.00
(2) Students in classrooms with a reading strategy guidance scale score equal to or higher than 499.8 Difference –2.18 –1.52 –0.79 0.32 –1.72 Effect Size –0.07 –0.05 –0.03 0.01 –0.06 p-value 1.00 1.00 1.00 1.00 0.96
Difference between (1) and (2) Difference in Difference 4.97 3.55 –0.70 –4.72 1.17 Difference in Effect Sizes 0.17 0.12 –0.02 –0.16 0.04 p-value for the Difference in Difference 1.00 1.00 1.00 1.00 1.00

Table III.30 (continued)
116
Project CRISS ReadAbout
Read for Real
Reading for
Knowledge
Combined Treatment
Group
Science Reading Comprehension Assessment Score
(1) Students in classrooms with a reading strategy guidance scale score lower than 499.8b
Difference 3.61 –0.50 –1.57 –9.59 –3.72 Effect Size 0.13 –0.02 –0.06 –0.35 –0.13 p-value 0.98 1.00 1.00 0.07 0.51
(2) Students in classrooms with a reading strategy guidance scale score equal to or higher than 499.8 Difference –0.48 –1.17 –0.86 –2.15 –0.71 Effect Size –0.02 –0.04 –0.03 –0.08 –0.03 p-value 1.00 1.00 1.00 1.00 1.00
Difference between (1) and (2) Difference in Difference 4.09 0.67 –0.71 –7.43 –3.01 Difference in Effect Sizes 0.15 0.02 –0.03 –0.27 –0.11 p-value for the Difference in Difference 1.00 1.00 1.00 0.90 0.93
Number of Students in Classrooms with a Reading Strategy Guidance Scale Score Lower than 499.8c 541 499 623 517 2,180
Number of Students in Classrooms with a Reading Strategy Guidance Scale Score Equal to or Higher than 499.8 677 677 560 624 2,538
Source: Reading comprehension tests administered by study team.
Note: For each outcome and for students in each type of classroom, the numbers reported are, by row, (1) the
difference between each intervention group and the control group, (2) the effect size for the difference, and (3) the p-value of the difference. For each outcome, the differences between differences for students in the two types of classrooms are also reported. All p-values were calculated taking into account the clustering of students within schools and adjusting for all comparisons shown in this table. The social studies and science reading comprehension assessments were developed by ETS. Variables in the regression model include baseline GRADE and TOSCRF scores, student ethnicity and race, student English language learner status, school location, teacher race, and district indicators.
aThe composite is based on the three tests presented in this table. Each test score is converted into a z-score by subtracting the mean and dividing by the standard deviation of the variable for students in the sample. The composite is the simple average of the three z-scores.
bThis cutoff point is the median.
cCounts reflect the number of students that have a teacher with a nonmissing reading strategy guidance scale score. *Statistically different at the .05 level. ETS = Educational Testing Service. GRADE = Group Reading Assessment and Diagnostic Evaluation. TOSCRF = Test of Silent Contextual Reading Fluency.

117
TABLE III.31
DIFFERENCES IN SPRING TEST SCORES BETWEEN EACH INTERVENTION GROUP AND THE CONTROL GROUP, BY CLASSROOM MANAGEMENT SCALE SCORE
Project CRISS ReadAbout
Read for Real
Reading for
Knowledge
Combined Treatment
Group
Composite Test Scorea
(1) Students in classrooms with a classroom management scale score lower than 499.8b
Difference –0.01 –0.03 –0.20* –0.11 –0.08 Effect Size –0.01 –0.04 –0.23 –0.13 –0.09 p-value 1.00 1.00 0.04 0.58 0.23
(2) Students in classrooms with a classroom management scale score equal to or higher than 499.8 Difference 0.01 –0.04 0.08 –0.12 –0.05 Effect Size 0.01 –0.05 0.09 –0.14 –0.06 p-value 1.00 1.00 0.76 0.60 0.49
Difference between (1) and (2) Difference in Difference –0.02 0.01 –0.28 0.01 –0.03 Difference in Effect Sizes –0.02 0.01 –0.32 0.01 –0.03 p-value for the Difference in Difference 1.00 1.00 0.08 1.00 0.93
GRADE Score
(1) Students in classrooms with a classroom management scale score lower than 499.8b
Difference 0.19 0.01 –1.57 –1.49 –0.66 Effect Size 0.01 0.00 –0.11 –0.11 –0.05 p-value 1.00 1.00 0.83 0.98 0.93
(2) Students in classrooms with a classroom management scale score equal to or higher than 499.8 Difference –0.48 –1.22 0.25 –1.27 –1.06 Effect Size –0.04 –0.09 0.02 –0.09 –0.08 p-value 1.00 1.00 1.00 1.00 0.50
Difference between (1) and (2) Difference in Difference 0.67 1.23 –1.82 –0.23 0.40 Difference in Effect Sizes 0.05 0.09 –0.13 –0.02 0.03 p-value for the Difference in Difference 1.00 1.00 0.98 1.00 1.00
Social Studies Reading Comprehension Assessment Score
(1) Students in classrooms with a classroom management scale score lower than 499.8b
Difference –2.18 –2.87 –10.34* –2.87 –4.76 Effect Size –0.07 –0.10 –0.35 –0.10 –0.16 p-value 1.00 1.00 0.00 0.96 0.09
(2) Students in classrooms with a classroom management scale score equal to or higher than 499.8 Difference 0.84 1.36 6.58 –2.47 1.75 Effect Size 0.03 0.05 0.22 –0.08 0.06 p-value 1.00 1.00 0.21 1.00 0.94
Difference between (1) and (2) Difference in Difference –3.02 –4.23 –16.92* –0.40 –6.51 Difference in Effect Sizes –0.10 –0.14 –0.57 –0.01 –0.22 p-value for the Difference in Difference 1.00 1.00 0.00 1.00 0.31

Table III.31 (continued)
118
Project CRISS ReadAbout
Read for Real
Reading for
Knowledge
Combined Treatment
Group
Science Reading Comprehension Assessment Score
(1) Students in classrooms with a classroom management scale score lower than 499.8b
Difference –0.17 –2.68 –6.46 –3.69 –2.91 Effect Size –0.01 –0.10 –0.23 –0.13 –0.11 p-value 1.00 1.00 0.93 1.00 0.86
(2) Students in classrooms with a classroom management scale score equal to or higher than 499.8 Difference 1.67 –0.01 2.85 –8.29 –2.34 Effect Size 0.06 –0.00 0.10 –0.30 –0.08 p-value 1.00 1.00 1.00 0.32 0.86
Difference between (1) and (2) Difference in Difference –1.84 –2.67 –9.31 4.60 –0.56 Difference in Effect Sizes –0.07 –0.10 –0.34 0.17 –0.02 p-value for the Difference in Difference 1.00 1.00 0.89 1.00 1.00
Number of Students in Classrooms with a Classroom Management Scale Score Lower than 499.8c 605 659 527 556 2,347
Number of Students in Classrooms with a Classroom Management Scale Score Equal to or Higher than 499.8 613 517 656 585 2,371
Source: Reading comprehension tests administered by study team.
Note: For each outcome and for students in each type of classroom, the numbers reported are, by row, (1) the
difference between each intervention group and the control group, (2) the effect size for the difference, and (3) the p-value of the difference. For each outcome, the differences between differences for students in the two types of classrooms are also reported. All p-values were calculated taking into account the clustering of students within schools and adjusting for all comparisons shown in this table. The social studies and science reading comprehension assessments were developed by ETS. Variables in the regression model include baseline GRADE and TOSCRF scores, student ethnicity and race, student English language learner status, school location, teacher race, and district indicators.
aThe composite is based on the three tests presented in this table. Each test score is converted into a z-score by subtracting the mean and dividing by the standard deviation of the variable for students in the sample. The composite is the simple average of the three z-scores.
bThis cutoff point is the median.
cCounts reflect the number of students that have a teacher with a nonmissing classroom management scale score. *Statistically different at the .05 level. ETS = Educational Testing Service. GRADE = Group Reading Assessment and Diagnostic Evaluation. TOSCRF = Test of Silent Contextual Reading Fluency.

119
IV. SUMMARY
This study used a rigorous experimental design to assess the effects of four reading comprehension curricula on reading comprehension among fifth-grade students in selected districts across the country. Consistent with the study’s focus on schools serving low-income students, the districts and schools that the study team targeted—and that agreed to participate in the study—had above-average poverty levels, and were larger and more urban, on average, than districts and schools in the United States.
The key findings from the first year of the study are as follows: Implementation Findings
• Over 90 percent (91-100 percent) of treatment teachers were trained to use the assigned curriculum, and more than half (56 to 80 percent) reported that they were very well prepared by the training to implement it. The percentage of teachers reporting that they felt very well prepared to implement the curricula ranged from 56 percent for Reading for Knowledge to 80 percent for Read for Real.
• Over 80 percent (81 to 91 percent) of teachers reported using their assigned curriculum. Eighty-one percent of Read for Real teachers, 83 percent of Reading for Knowledge teachers, 87 percent of ReadAbout teachers, and 91 percent of Project CRISS teachers reported using their assigned curriculum.
• Classroom observation data showed that teachers implemented 55 to 78 percent of the behaviors deemed important by the developers for implementing each curriculum. ReadAbout and Project CRISS teachers implemented, on average, 71 and 78 percent of such behaviors, respectively. Reading for Knowledge teachers implemented 58 and 65 percent of the behaviors deemed important for the two types of instructional days that are part of the curriculum. Similarly, Read for Real teachers implemented 55 and 71 percent of the behaviors deemed important for the two types of instructional days that are part of that curriculum.
Basic Questions on Intervention Effectiveness
• Scores on the three reading comprehension assessments were not statistically significantly higher in schools using the selected reading comprehension curricula. Scores on these assessments in treatment schools were not statistically significantly higher than scores in control schools, and there was evidence that test scores were statistically significantly lower in treatment schools than in control schools (effect sizes: -0.08 to -0.21).

120
Exploratory Questions on the Effectiveness of the Interventions for Subgroups of Students
• Impacts were correlated with some subgroups defined by student, teacher, and school characteristics. For the combined treatment group, statistically significant, negative impacts were observed for students with above-average baseline fluency levels, students with baseline comprehension levels in the bottom third of the sample, students of teachers with more than five years of teaching experience, students attending schools with below-average School Professional Culture scores, students attending schools with an above-average concentration of students eligible for free or reduced-price lunch, and students attending schools with a below-average concentration of English language learners. All of these findings have a causal interpretation—with the exception of the School Professional Culture subgroup findings—because these subgroups were formed using characteristics observed at the beginning of the study’s implementation year. For Reading for Knowledge, negative impacts were observed for students with teachers who had more than 10 years of teaching experience.

121
REFERENCES
Adams, A., D. Carnine, and R. Gersten. “Instructional Strategies for Studying Content Area Texts in the Intermediate Grades.” Reading Research Quarterly, vol. 18, 1982, pp. 27–55.
Adams, R.J., M. Wilson, and W.C. Wang. “The Multidimensional Random Coefficients Multinomial Logit Model.” Applied Psychological Measurement, vol. 21, no. 1, 1997, pp. 1–23.
Anderson, V. and M. Roit. “Planning and Implementing Collaborative Strategy Instruction for Delayed Readers in Grades 6-10.” The Elementary School Journal, vol. 94, no. 2 (Special Issue: Strategies Instruction), November 1993, pp. 121-137.
Baumann, J.F. “The Effectiveness of a Direct Instruction Paradigm for Teaching Main Idea Comprehension.” Reading Research Quarterly, vol. 20, no. 1, 1984, pp. 93-115.
Baumann, J.F., and B.S. Bergeron. “Story Map Instruction using Children’s Literature: Effects on First Graders’ Comprehension of Central Narrative Elements.” Journal of Reading Behavior, vol. 25, no. 4, 1993, pp. 407-437.
Benjamini, Y. and Y. Hochberg. "Controlling the False Discovery Rate: A Practical and Powerful Approach to Multiple Testing." Journal of the Royal Statistical Society. Series B (Methodological), vol. 57, no. 1, pp. 289-300.
Brophy, J., and C. Evertson. Learning from Teaching: A Developmental Perspective. Boston, MA: Allyn and Bacon, 1976.
Brown, A.L., and J.D. Day. “Macrorules for Summarizing Text: The Development of Expertise.” Journal of Verbal Learning and Verbal Behavior, vol. 22, 1983, pp. 1–14.
Brown, R., M. Pressley, P. Van Meter, and T. Schuder. “A Quasi-Experimental Validation of Transactional Strategies Instruction with Low-Achieving Second-Graders.” Journal of Educational Psychology, vol. 88, 1996, pp. 18–37.
Carlisle, J. “Teacher’s QUEST: Self-Administered Questionnaire.” Ann Arbor, MI: Regents of the University of Michigan, 2003.
Carlisle, J., and M. Rice. Improving Reading Comprehension: Research-Based Principles and Practices. Baltimore, MD: York Press, 2002.
Chall, J. Stages of Reading Development. Fort Worth, TX: Harcourt-Brace, 1983.
Charters, W.W., Jr., and J.E. Jones. “On the Risk of Appraising News Events in Program Evaluation.” Educational Research, vol. 2, 1973, pp. 5–7.
Chromy, J.R. “Sequential Sample Selection Methods. Proceedings of the American Statistical Association, Survey Research Methods Section, 1979, pp. 401–406.

122
Consortium on Chicago School Research. “Improving Chicago’s Schools: The Teachers’ Turn, 1999; Elementary School Teacher Survey, 1999.” Chicago: CCSR, 1999. http://www.consortium-chicago.org.
Cooley, W.W., and G. Leinhardt. “The Instructional Dimensions Study.” Educational Evaluation and Policy Analysis, vol. 2, 1980, pp. 7–25.
Crawford, L.W., C.E. Martin, and M.M. Philbin. Read for Real: Nonfiction Strategies for Reading Results. Columbus, OH: Zaner-Bloser, 2005.
Darch, C., and R. Gersten. “Direction Setting Activities in Reading Comprehension: A Comparison of Two Approaches.” Learning Disabilities Quarterly, vol. 9, no. 3, 1986, pp. 235–243.
Darch, C., and E. Kame’enui. “Teaching LD Students Critical Reading Skills: A Systematic Replication.” Learning Disability Quarterly, vol. 10, 1987, pp. 82–91.
Dole, J.A., J.D. Nokes, and D. Drits. “Cognitive Strategy Instruction.” In Handbook of Research on Reading Comprehension, edited by G.G. Duffy and S.E. Israel. Erlbaum, in press.
Duffy, G.G., L.R. Roehler, E. Sivan, G. Rackliffe, C. Book, M.S. Meloth, L.G. Vavrus, R. Wesselman, J. Putnam and D. Bassiri. “Effects of Explaining the Reasoning Associated with Using Reading Strategies.” Reading Research Quarterly, vol. 23, 1987, pp. 347–386.
Duke, N.K., and P.D. Pearson. “Effective Practices for Developing Reading Comprehension.” In What Research Has to Say About Reading Instruction (Third Edition), edited by A.E. Farstrup and S.J. Samuels. Newark, DE: International Reading Association, 2002, pp. 205–242.
Dunnett, C.W. “A Multiple Comparison Procedure for Comparing Several Treatments with a Control.” Journal of the American Statistical Association, vol. 50, 1955, pp. 1096–1121.
Durkin, D. “What Classroom Observations Reveal About Reading Comprehension Instruction.” Reading Research Quarterly, vol. 14, no. 4, 1978-1979, pp. 481–533.
Dynarski, M., R. Agodini, S. Heaviside, T. Novak, N. Carey, L. Campuzano, B. Means, R. Murphy, W. Penuel, H. Javitz, D. Emery, and W. Sussex. “Effectiveness of Reading and Mathematics Software Products: Findings from the First Student Cohort.” Washington, D.C.: U.S. Department of Education, Institute of Education Sciences, March 2007.
Educational Testing Service. Science Reading Comprehension Assessment (unpublished). Princeton, NJ: ETS, 2007a.
Educational Testing Service. Social Studies Reading Comprehension Assessment (unpublished). Princeton, NJ: ETS, 2007b.
Fuchs, D., L. S. Fuchs, P. H. Mathes, and D. C. Simmons. “Peer-assisted Learning Strategies: Making Classrooms more Responsive to Diversity.” American Educational Research Journal, vol. 34, no. 1, 1997, pp. 174-206.

123
Gersten, R., S. Baker, and J.W. Lloyd. “Designing High Quality Research in Special Education: Group Experimental Design.” Journal of Special Education, vol. 34, 2000, pp. 2–18.
Gersten, R., L. Fuchs, J. Williams, and S. Baker. “Teaching Reading Comprehension Strategies to Students with Learning Disabilities.” Review of Educational Research, vol. 71, 2001, pp. 279–320.
Gibson, S., and M.H. Dembo. “Teacher Efficacy: A Construct Validation.” Journal of Educational Psychology, vol. 76, 1984, pp. 569–582.
Glazerman, S., and D. Myers. “Assessing the Effectiveness of Education Interventions: Issues and Recommendations for the Title I Evaluation.” Washington, DC: Mathematica Policy Research, Inc., May 17, 2004.
Glazerman, S., S. Dolfin, M. Bleeker, A. Johnson, E. Isenberg, J. Lugo-Gil, M. Grider, E. Britton, and M. Ali. “Impacts of Comprehensive Teacher Induction: Results From the First Year of a Randomized Controlled Study.” Washington, D.C.: National Center for Education Evaluation and Regional Assistance, Institute of Education Sciences, U.S. Department of Education, October 2008.
Guthrie, J.T., K.E. Cox, E. Anderson, K. Harris, S. Mazzoni, and L. Rach. “Principles of Integrated Instruction for Engagement in Reading.” Educational Psychology Review, vol. 10, no. 2, 1998, pp. 177–199.
Guthrie, J.T., W.D. Shafer, C. Von Secker, and T. Alban. “Contributions of Integrated Reading Instruction and Text Resources to Achievement and Engagement in a Statewide School Improvement Program.” Journal of Educational Research, vol. 93, 2000a, pp. 211–226.
Guthrie, J.T., A. Wigfield, and C. Von Secker. “Effects of Integrated Instruction on Motivation and Strategy Use in Reading.” Journal of Educational Psychology, vol. 92, no. 2, 2000b, pp. 331–341.
Hammill, D., J. Wiederholt, and E. Allen. Test of Silent Contextual Reading Fluency (TOSCRF), Examiner’s Manual. Austin, TX: PRO-ED, Inc., 2006.
Hare, V.C., and K.M. Borchardt. “Direct Instruction in Summarization Skills.” Reading Research Quarterly, vol. 20, no. 1, 1984, pp. 62-78.
Hart, B., and T.R. Risley. Meaningful Differences in the Everyday Experience of Young American Children. Baltimore, MD: Brooks, 1995.
Hothorn, T., F. Bretz, and P. Westfall. “Simultaneous Inference in General Parametric Models.” Biometrical Journal, vol. 50, no. 3, 2008, pp. 346-363.
Hoy, W.K., and A.E. Woolfolk. “Teachers’ Sense of Efficacy and the Organizational Health of Schools.” Elementary School Journal, vol. 93, 1993, pp. 355–372.
Hsu, J.. Multiple Comparisons: Theory and Methods. London: Chapman and Hall, 1996.

124
Ingersoll, R.. “Holes in the Teacher Supply Bucket.” The School Administrator, March 2002.
James-Burdumy, S., D. Myers, J. Deke, W. Mansfield, R. Gersten, J. Dimino, J. Dole, L. Liang, S. Vaughn, and M. Edmonds. “The National Evaluation of Reading Comprehension Interventions: Design Report.” Final report submitted to the U.S. Department of Education. Princeton, NJ: Mathematica Policy Research, Inc., May 2006.
Klinger, J.K, S. Vaughn, and J. Shay Schumm. “Collaborative Strategic Reading During Social Studies in Heterogeneous Fourth-Grade Classrooms.” Elementary School Journal, vol. 99, no. 1, September 1998, pp. 3-22.
Levin, H.M., and P.J. McEwan. Cost-Effectiveness Analysis: Methods and Applications. Second edition. Thousand Oaks, CA: Sage, 2001.
Liang, L.A., and J.A. Dole. “Help with Reading Comprehension: Comprehension Instructional Frameworks.” The Reading Teacher, vol. 58, 2006, pp. 2–13.
Linacre, J.M. Winsteps (Version 3.61.2). Computer software. Chicago: Winsteps.com, 2006.
Linacre, J.M. “What Do Infit and Outfit, Mean-Square and Standardized Mean?” Rasch Measurement Transactions, vol. 16, no. 2, 2002, p. 878.
Lloyd, J., D. Cullinan, E. Heins, and M. Epstein. “Direct Instruction: Effects on Oral and Written Language Comprehension.” Learning Disabilities Quarterly, vol. 3, 1980, pp. 70–76.
Lord, F.M. Applications of Item Response Theory to Practical Testing Problems. Hillsdale, NJ: Erlbaum, 1980.
Lord, F.M., and M.R. Novick. Statistical Theories of Mental Test Scores. Reading, MA: Addison-Wesley, 1968.
Lysynchuk, L.M., M. Pressley, H. D’Ailly, M. Smith, and H. Cake. “A Methodological Analysis of Experimental Studies of Comprehension Strategy Instruction.” Reading Research Quarterly, vol. 24, no. 4, 1989, pp. 458–470.
Madden, N.A., and V. Crenson. Reading for Knowledge. Baltimore, MD: Success for All Foundation, 2006.
Martin, V.L., and M. Pressley. “Elaborative-Interrogation Effects Depend on the Nature of the Question.” Journal of Educational Psychology, vol. 83, 1991, pp. 113–119.
Masters, G.N. “A Rasch Model for Partial Credit Scoring.” Psychometrika, vol. 47, 1982, pp. 149–174.
Masters, G.N., and B.D. Wright. “The Partial Credit Model.” In Handbook of Modern Item Response Theory, edited by W.J. van der Linden and R.K. Hambleton. New York: Springer-Verlag, 1997, pp. 101–121.

125
Mebane, W.R., and J. Sekhon. “Genetic Optimization Using Derivatives: The rgenoud Package for R.” Journal of Statistical Software, forthcoming 2008.
Moats, L. Teaching Reading Is Rocket Science. Washington, DC: American Federation of Teachers, 1999.
National Center for Education Statistics. Common Core of Data, Local Education Agency Universe Survey, 2003-04. Accessed November 9, 2005. http://nces.ed.gov/ccd/.
National Institute of Child Health and Human Development. Report of the National Reading Panel, Teaching Children to Read: An Evidence-Based Assessment of the Scientific Research Literature on Reading and Its Implications for Reading Instruction. (NIH publication no. 00-4769.) Washington, DC: U.S. Government Printing Office, 2000.
Nunnally, J.C., and I.H. Bernstein. Psychometric Theory. Third Edition. New York: McGraw-Hill, Inc., 1994.
Palincsar, A.S., and A.L. Brown. “Reciprocal Teaching of Comprehension-Fostering and Comprehension-Monitoring Activities.” Cognition and Instruction, vol. 2, 1984, pp. 117–175.
Patching, W., E. Kame’enui, D. Carnine, R. Gersten, and G. Colvin. “Direct Instruction in Critical Reading.” Reading Research Quarterly, vol. 18, 1983, pp. 406–418.
Pearson, P.D., and L. Fielding. “Comprehension Instruction.” In Handbook of Reading Research, Volume II, edited by R. Barr, M.L. Kamil, P. Mosenthal, and P. Mosenthal. Mahwah, NJ: Lawrence Erlbaum, 1991, pp. 815–860.
Pearson, P.D., L.R. Roehler, J.A. Dole, and G.G. Duffy. “Developing Expertise in Reading Comprehension.” In What Research Has to Say About Reading Instruction (Second Edition), edited by S.J. Samuels and A.E. Farstrup. Newark, DE: International Reading Association, 1992, pp. 145–199.
Pressley, M. “Comprehension Strategies Instruction: A Twentieth Century Report.” In Comprehension Instruction: Research-Based Best Practices, edited by C.C. Block and M. Pressley. New York: Guilford Press, 2002, pp. 11–27.
Pressley, M. “What Should Comprehension Instruction Be the Instruction of?” In Handbook of Reading Research, Volume III, edited by M. Kamil, P. Mosenthal, P.D. Pearson, and R. Barr. Mahwah, NJ: Erlbaum, 2000, pp. 545–562.
Pressley, M. Reading Instruction That Works: The Case for Balanced Teaching. New York: Guilford, 1998.
Pressley, M., C.J. Johnson, S. Symons, J.A. McGoldrick, and J.A. Kurita. “Strategies That Improve Children’s Memory and Comprehension of Text.” Elementary School Journal, vol. 90, 1989, pp. 3–32.

126
RAND Reading Study Group. Reading for Understanding: Toward an R&D Program in Reading Comprehension. Washington, DC: Office of Educational Research and Improvement, 2000.
Raphael, T.E., and P.D. Pearson. “Increasing Students’ Awareness of Sources of Information for Answering Questions.” American Educational Research Journal, vol. 22, 1985, pp. 217-235.
Renninger, K.A., S. Hidi, and A. Krapp (eds.). The Role of Interest in Learning and Development. Hillsdale, NJ: Erlbaum, 1992.
Rosenshine, B., and C. Meister. “Reciprocal Teaching: A Review of the Research.” Review of Educational Research, vol. 64, no. 4, 1994, pp. 479–530.
Rosenshine, B., and R. Stevens. “Teaching Functions.” In Handbook of Research on Teaching, Third Edition, edited by M. Wittrock. New York: Macmillan, 1986, pp. 376–391.
Rosenshine, B., C. Meister, and S. Chapman. “Teaching Students to Generate Questions: A Review of the Intervention Studies.” Review of Educational Research, vol. 66, no. 2, 1996, pp. 181–221.
Santa, C.M., L.T. Havens, and B.J. Valdes. Project CRISS: Creating Independence through Student-Owned Strategies (3rd ed.). Dubuque, IA: Kendall/Hunt Publishing, 2004.
Schochet, P.Z. “Guidelines for Multiple Testing in Impact Evaluations of Educational Interventions.” Final report submitted to the U.S. Department of Education. Princeton, NJ: Mathematica Policy Research, Inc., May 2008.
Scholastic. ReadAbout: The Personal Reading Coach for Every Student. New York, NY: Scholastic, 2005.
Schraw, G., R. Bruning, and C. Zosvoboa. “Source of Situational Interest.” Journal of Reading Behavior, vol. 27, 1995, pp. 1–17.
Shany, M.T. and A. Biemiller. “Assisted Reading Practice: Effects on Performance for Poor Readers in Grades 3 and 4.” Reading Research Quarterly, vol. 30, no. 3, 1995, pp. 382-395.
Snow, C.E. Reading for Understanding: Toward a Research and Development Program in Reading Comprehension. Santa Monica, CA: RAND, 2002.
Snow, C.E., and G. Biancarosa. Adolescent Literacy and the Achievement Gap: What Do We Know and Where Do We Go From Here? New York: Carnegie Corporation of New York, 2003.
Sparks, G.M. “Teachers’ Attitudes Toward Change and Subsequent Improvements in Classroom Teaching.” Journal of Educational Psychology, vol. 80, 1988, pp. 111–117.

127
Stallings, J. “Implementation and Child Effects of Teaching Practices in Follow Through Classrooms.” Monographs of the Society for Research in Child Development, vol. 40, serial no. 163, 1975, pp. 7–8.
Taylor, B.M., and R.W. Beach. “The Effects of Text Structure Instruction on Middle-Grade Students’ Comprehension and Production of Expository Prose.” Reading Research Quarterly, vol. 19, 1984, pp. 134-136.
U.S. Department of Education, Institute of Education Sciences, National Center for Education Statistics. National Assessment of Educational Progress (NAEP), 2007 Reading Assessments. http://nationsreportcard.gov/reading_2007/r0003.asp.
Vaughn, S., J. K. Klingner, and D. P. Bryant. “Collaborative Strategic Reading as a Means to Enhance Peer-mediated Instruction for Reading Comprehension and Content Area Learning.” Remedial and Special Education, vol. 22, no. 2, 2001, pp. 66-74.
Williams, K.T. Group Reading Assessment and Diagnostic Evaluation (GRADE) Technical Manual. Circle Pines, MN: American Guidance Service, Inc., 2001.
Wood, E., M. Pressley, and P.H. Winne. “Elaborative Interrogation Effects on Children’s Learning of Factual Content.” Journal of Educational Psychology, vol. 82, 1990, pp. 741–748.
Wright, B.D., and J. M. Linacre. “Reasonable Mean-square Fit Values.” Rasch Measurement Transactions, vol. 8, no. 3, 1994, p. 370.
Wright, B.D., and M.H. Stone. Best Test Design. Chicago: MESA, 1979.
Wu, M.L., R.J. Adams, M.R. Wilson, and S.A. Haldane. ACER ConQuest, version 2.0. Computer software. Victoria, Australia: ACER Press, 2007.

APPENDIX A
RANDOM ASSIGNMENT


A.3
Random assignment was conducted to ensure that the estimated impacts of the interventions could be attributed to the interventions and not other factors. The random assignment method used was designed to ensure an even distribution of the interventions overall and within each school district. Schools, not teachers, were randomly assigned due to concerns about the potential for contamination of control group teachers that could arise if teachers randomly assigned to treatment and control status were working within the same schools.
Random assignment of schools was carried out within school districts, and, whenever possible, within blocks of schools formed in each district based on baseline reading scores in participating schools.60 Random assignment within districts helped to ensure that each treatment group was represented in each district. Doing random assignment within blocks of schools in each district avoided the possibility of a “bad draw”—a situation in which all the schools with high (or low) baseline reading scores might be assigned to one of the study’s five arms (four treatment and one control).61
Two different methods were used to form blocks of schools. The first method—explicit
blocking—was generally used when the number of schools within a district was a multiple of five. The second method—implicit blocking—was generally used when the number of schools was not a multiple of five.
In explicit blocking, the study team formed two groups or blocks of schools, and then
conducted random assignment within those blocks. For example, in a district with 10 schools, two blocks of 5 schools were formed where the schools in each block had similar baseline reading achievement levels. Random assignment was then conducted separately within those two blocks. This resulted in one school from each block being assigned to each of the five arms of the study (and, overall, two schools assigned to each of the five study arms).
When the blocked experimental design was not possible, implicit ordering through a
modified Chromy selection procedure was implemented (Chromy 1979). This modified procedure ordered schools within districts based on baseline reading scores, and then the curricula were randomly assigned to the ordered list of schools to achieve an approximate balance in both baseline scores in each study arm and the number of times each intervention appeared overall.
60In one district, blocks were formed based on magnet school status, as that district had five participating
schools that were regular schools and five participating schools that were magnet schools.
61Another factor we considered when conducting the random assignment was the desire to have at least two control schools in each district so that impacts for that district could still be estimated even if one of the control schools dropped out of the study.

APPENDIX B
FLOW OF SCHOOLS AND STUDENTS THROUGH THE STUDY


B.3
TABLE B.1
FLOW OF SCHOOLS THROUGH STUDY
Districts Participating in Study(N=10)
Schools Enrolled in Study
(N=89)District 1: N=16District 2: N=7District 3: N=10District 4: N=5District 5: N=10District 6: N=10District 7: N=4District 8: N=10District 9: N=10District 10: N=7
Allocated to Project CRISS Intervention
(N=17)
Allocated to ReadAbout Intervention
(N=17)
Allocated to Reading for Knowledge
Intervention(N=18)
Allocated to Read for Real Intervention
(N=16)
Allocated to Control Group
(N=21)
Schools Not Implementing Interventiona
(N=2)
aOne school in District 5 stopped implementing the intervention early in the school year when the only teacher whoattended training discontinued using the program. One school in District 7 never implemented the program afterteachers were trained; the school said its schedule could not accommodate the required 45 minutes of instructionaltime. Follow-up data collection was conducted in both of these schools.

B.4
All eligible students (N=6,446)
Consenting students (N=6,085)
Non-consenting students (N=97)
Eligible for baseline testing (N=6,037)
Number of students assessed at baseline (N=6,018)GRADE, Fall (N=6,010)TOSCRF (N=5,994)Took both baseline tests (N=5,986)
Ineligible for baseline testing (N=48)Special education (N=1)Language barrier (N=47)
Consenting students (N=265)
Transferred in after baseline and before January 1, 2007
(N=265)
Non-consenting students (N=0)
Final sample at followup (N=6,350)
Eligible for follow-up testing (N=6,253)
Number of students assessed at followup (N=5,597)GRADE (N=5,572)ETS test (N=5,505)Took both follow-up tests (N=5,488)Took baseline and follow-up GRADE (N=5,342)Took baseline GRADE and ETS test (N=5,287)
Ineligible for follow-up testing (N= 97)Transferred out (N=22)Special education (N=41)Language barrier (N=34)
TABLE B.2
FLOW OF STUDENTS THROUGH STUDY

APPENDIX C
OBTAINING PARENT CONSENT


C.3
At the beginning of the 2006-2007 school year, the study team began the process of obtaining consent from parents of fifth-grade students attending study schools. We collected lists of all fifth-grade students in each study school (by classroom) and then sent letters to these students’ parents requesting consent for their children to participate in the study. At the start of the spring semester, we again collected lists of fifth-grade students and sent letters to parents of students who had entered study classrooms after the baseline tests were administered but before January 1, 2007.
Letters describing the study (which were translated into Spanish and Louisiana Creole for
schools that requested it) were sent home with students. The letters explained the purpose of the study and all data collection activities involving students. A brochure with answers to frequently asked questions was also included in the mailing.
In most districts and with most students, passive consent procedures were implemented. Of
the 6,446 students on teachers’ fall or spring semester classroom lists, 937 attended schools in one district requiring active consent and 5,509 attended schools in the nine remaining districts requiring passive consent (Table C.1).
Parent consent was obtained for nearly all students (98 percent). Consent in the active
consent district was 93 percent, and consent in the passive consent districts was 99 percent. There was no difference in consent rates by treatment or control status. Consent was
obtained for 98 to 99 percent of students in each treatment and control condition (Table C.2).

C.4
TABLE C.1
CONSENT RATES, BY TYPE OF CONSENT
All Eligible Students
Eligible Students in Passive Consent Districts
(N=9)
Eligible Students in Active Consent District
(N=1)
With Consent With Consent With Consent
Total Number Percentage Total Number Percentage Total Number Percentage
6,446 6,350 98 5,509 5,478 99 937 872 93
TABLE C.2
CONSENT RATES, BY INTERVENTION
All Eligible Students
With Consent
Intervention All Number Percentage Total 6,446 6,350 98 Combined Treatment Group 5,055 4,983 99
Project CRISS 1,324 1,319 99 ReadAbout 1,256 1,246 99 Reading for Knowledge 1,220 1,191 98 Read for Real 1,255 1,227 98
Control Group 1,391 1,367 98

APPENDIX D
IMPLEMENTATION TIMELINE


D.3
TABLE D.1
IMPLEMENTATION SCHEDULE FOR INTERVENTIONS: NUMBER OF SCHOOL DAYS FROM START OF SCHOOL, BY DISTRICT
District Number 1 2 3 4 5 6a 7 8 9 10
School Calendar Type—Traditional (T) or Year-round (Y) T T T T T T Y Y T T T
Days to Initial Scheduled Training
Read for Real –12 –9 –15 10 –7 10 –4 n.a. –15 –10 –8
Project CRISS –11 10 –13 23 22 2 n.a. 57 –15 –19 20
ReadAbout –9 –12 –17 4 –8 11 40 –3; 6 –8 –9 –10
Reading for Knowledge –11 –8 –15 33 –9 5 n.a. –8 –7 –8 –11
Days Until Technologyb Was:
Ordered 19 –12 16 3 0 0 30 –10 4 –5 –3
Received 23 11 19 17 13 5 35 4 15 7 11
Ready for Use—First Set 38 16 32 33 21 18 48 8 24 9 14
Ready for Use—Second Set n.a. 26 n.a. n.a. n.a. n.a. n.a. n.a. 31 n.a. n.a.
Note: A negative number in this table indicates that the training took place prior to the start of the school year. For example, the -12 days shown for district 1 for Read for Real indicates that the Read for Real training in district 1 took place 12 days prior to the start of the school year. Similarly, a positive number indicates that the training took place after the start of the school year.
aOne participating district included schools following both year-round and traditional calendars.
bTechnology installation applies only to the ReadAbout program. Technology refers to the computers, software, and other equipment needed to implement the program. The developer reported to MPR when the technology was ready for use.
MPR = Mathematica Policy Research, Inc. n.a. = not applicable.

APPENDIX E
SAMPLE SIZES AND RESPONSE RATES


E.3
All fifth-grade teachers in study schools were considered eligible for the study, but individual teachers could decline to participate (6 percent of teachers declined). Teachers who taught combined fourth-/fifth- or fifth-/sixth-grade classes were ineligible, as were teachers who taught self-contained special education classes. Table E.1 shows the final teacher sample, by treatment group, and the percentage of teachers who responded to the teacher survey.
Students enrolled in fifth-grade classes at the start of school in fall of 2006, or who
transferred in to such classes within a study school before January 1, 2007, were eligible for the study. Students in combined fourth-/fifth- or fifth-/sixth-grade classes were excluded, as were those in self-contained special education classes. Eligible students were considered in the study sample if parent consent was obtained (Table E.2).
Baseline tests were administered to in-sample students at the start of the school year during
regular class periods. The only in-sample students who were not eligible for testing were those whose limited English language skills precluded them from taking a test written in English. Most students who were absent on the initial test day were tested at subsequent make-up test sessions. Ninety-five percent of students completed the baseline GRADE test, and 94 percent completed the baseline TOSCRF test; over 99 percent of students who took the baseline GRADE also took the baseline TOSCRF, and vice versa (Table E.3A).
Follow-up tests were administered to in-sample students who had not transferred out of the
school district at the time of testing. As was done at baseline, students whose limited English language skills at followup precluded them from taking a test written in English were not included in follow-up testing. The tests were administered at the end of the school year, on two consecutive days, with make-up sessions scheduled for absent students. Of the total sample of students (including those who could not be tested because they were not geographically accessible), 88 percent completed the follow-up GRADE test and 87 percent completed the follow-up ETS test (Table E.3B). In addition, more than 98 percent of students who took the follow-up GRADE also took the follow-up ETS test, and more than 99 percent of those who took the follow-up ETS test also took the follow-up GRADE.
Further, 96 percent of the students completed both the follow-up GRADE test and the
baseline GRADE test, and 95 percent completed both the follow-up ETS test and the baseline GRADE (Table E.3B).
All students who completed follow-up tests were included in the impact analysis. The
proportion of students in each experimental condition with follow-up test scores is reported in Table G.2.
Table E.4 shows the classroom observation sample and response rates, and Table E.5 shows
the treatment classrooms in the fidelity observation sample and response rates.

E.4
TABLE E.1
TEACHER SURVEY SAMPLE AND RESPONSE RATES
Teachers
Total
Number Completing
Survey Response Rate (Percentage)
Total 268 249 93
Combined Treatment Group 209 193 92 Project CRISS 52 50 96 ReadAbout 50 46 92 Reading for Knowledge 53 48 91 Read for Real 54 49 91
Control Group 59 56 95
TABLE E.2
STUDENT SAMPLE
Baseline Sample
Transferred in before January 1,
2007 Total Samplea
Total 6,085 265 6,350 Combined Treatment Group 4,761 222 4,983
Project CRISS 1,241 78 1,319 ReadAbout 1,205 41 1,246 Reading for Knowledge 1,157 34 1,191 Read for Real 1,158 69 1,227
Control Group 1,324 43 1,367
aThe total number of students in the study sample includes (1) students in study schools at the time of the baseline testing for whom parental consent was obtained, and (2) students who entered participating schools after baseline testing was completed but before January 1, 2007, and for whom parental consent was obtained. About 450 of those students transferred out of their school district before the follow-up test, but they remained part of the sample.

E.5
TABLE E.3A
STUDENT TEST SAMPLE AND RESPONSE RATES, FALL 2006
Total Number Tested Response Ratea
(Percentage)
Percentage Who Took the Listed Test Who Also Took the Other Baseline Testb
GRADE
Total 6,350 6,010 95 99.6 Combined Treatment Group 4,983 4,708 94 99.6
Project CRISS 1,319 1,233 93 99.4 ReadAbout 1,246 1,186 95 99.7 Reading for Knowledge 1,191 1,138 96 99.7 Read for Real 1,227 1,151 94 99.6
Control Group 1,367 1,302 95
99.7
TOSCRF
Total 6,350 5,994 94 99.9 Combined Treatment Group 4,983 4,696 94 99.8
Project CRISS 1,319 1,226 93 99.9 ReadAbout 1,246 1,186 95 99.7 Reading for Knowledge 1,191 1,137 95 99.8 Read for Real 1,227 1,147 93 99.9
Control Group 1,367 1,298 95
100.0
aThe percentage of students tested at baseline is based on the total sample, although about 265 students included in the sample transferred into participating schools after the baseline test was completed. Of the students in the sample at the baseline testing, 99 percent completed the GRADE and the TOSCRF.
bThe GRADE and the TOSCRF were administered on the same day, so nearly all students who completed one baseline test also completed the other baseline test. However, a small number of students completed only one test: of those who completed the baseline GRADE, 99.6 percent also completed the TOSCRF; of those who completed the TOSCRF, 99.9 percent also completed the baseline GRADE.
GRADE = Group Reading Assessment and Diagnostic Evaluation. TOSCRF = Test of Silent Contextual Reading Fluency.

E.6
TABLE E.3B
STUDENT TEST SAMPLE AND RESPONSE RATES, SPRING 2007
Total Number Tested
Response Ratea
(Percentage)
Percentage Who Took the Listed Test Who Also Took the Other
Follow-Up Testb
Percentage Who Took the Listed Test Who Also
Took the Baseline GRADEc
GRADE
Total 6,350 5,573 88 98.5 84 Combined Treatment Group 4,983 4,394 88 98.4 84
Project CRISS 1,319 1,154 87 98.4 83 ReadAbout 1,246 1,095 88 99.1 85 Reading for Knowledge 1,191 1,067 90 98.0 87 Read for Real 1,227 1,078 88 98.0 84
Control Group 1,367 1,179 86 98.8 83
ETS
Total 6,350 5,512 87 99.6 83 Combined Treatment Group 4,983 4,344 87 99.5 83
Project CRISS 1,319 1,139 86 99.7 82 ReadAbout 1,246 1,089 87 99.6 84 Reading for Knowledge 1,191 1,051 88 99.5 85 Read for Real 1,227 1,065 87 99.2 82
Control Group 1,367 1,168 85 99.7 83
aThe percentage of students tested at follow-up is based on the total sample, although about 450 of those students had transferred out of their school district before the follow-up tests. Of the students who had not transferred out of their district, about 94 percent completed the follow-up tests.
bThe follow-up GRADE and ETS tests were administered on consecutive days to students. Nearly all students who completed one test also completed the other test. However, a small number of students completed only one test: of those who completed the follow-up GRADE, 98.5 percent also completed the ETS test; of those who completed the ETS test, 99.6 percent also completed the follow-up GRADE.
cSome students transferred into study schools after the baseline test was completed, and some in-sample students transferred out of study schools before the follow-up test was administered. Eighty-four percent of the students completed both the baseline and follow-up GRADE, and 83 percent completed both the baseline GRADE and the ETS test.
ETS = Educational Testing Service. GRADE = Group Reading Assessment and Diagnostic Evaluation.

E.7
TABLE E.4
CLASSROOM OBSERVATION SAMPLE AND RESPONSE RATES Classrooms
Total Number Observed Response Rate (Percentage)
Totala 270 264 98
Combined Treatment Group 213 207 97 Project CRISS 56 52 93 ReadAbout 50 49 98 Reading for Knowledge 53 52 98 Read for Real 54 54 100
Control Group 57 57 100
aThe number of classrooms shown in this table differs from the number of teachers shown in Table E.1 because some teachers taught more than one class.
TABLE E.5
FIDELITY OBSERVATION SAMPLE AND RESPONSE RATES Teachers
Total Number Observed Response Rate (Percentage)
Combined Treatment Groupa 218 209 96
Project CRISS 54 54 100 ReadAbout 53 53 100 Reading for Knowledge 54 45 83 Read for Real 57 57 100
aOne fidelity observation was conducted for each study teacher. The number of teachers shown in this table differs from the number shown in Table E.1 because the teacher survey was conducted at the start of the 2006-2007 school year while the fidelity observations were conducted later in the year (after some teacher changes had occurred). The number of teachers shown in this table differs from the number shown in Table E.4 because this table is focused on number of teachers while Table E.4 is focused on number of classrooms.

APPENDIX F
CREATION AND RELIABILITY OF CLASSROOM OBSERVATION AND TEACHER SURVEY MEASURES


F.3
A. ASSESSING INTER-RATER RELIABILITY
An important part of the analysis of data collected from classroom observations is an assessment of the reliability of the observation data across the staff conducting the observations. Data from 25 percent of classrooms are available for these calculations. Twenty percent of observations were randomly chosen to be reliability observations, which means that a second observer was randomly chosen to observe simultaneously with the observer assigned to that observation. The remaining 5 percent of the observations come from pairings of a master trainer with each observer at least once during the first two weeks of observation. This allows for a comparison of the data collected by the two observers during these observations.
In total, the study team had data from 97 pairs of observations that could be used to assess
reliability of the observation data. Of these, 63 were pairs of regular field observation staff. An additional 34 were pairs in which a regular field observer did one observation and an expert observer acting in a quality control role did the second.
The inter-rater reliability of all of the study scales was over 0.94 (0.94 to 0.98). Pearson
correlations of the scale scores based on the two observers’ tallies were calculated for the three study scales. The inter-rater reliability of the scales based on sums of tallies across items for the Traditional Interaction scale was 0.98, and when the scale was based on the average of tallies across intervals the reliability was 0.97. The reliability of the Reading Strategy Guidance scale, based on both the sums and averages across intervals, was 0.97. The reliability of the Classroom Management scale was 0.94, whether based on sums or averages.
Inter-rater reliability for individual items from the classroom observation form was also
analyzed. We calculated reliability by item by measuring the exact match percent agreement between observers in both types of pairs (reliability and quality control, during each interval). This method involves calculating agreements and disagreements tally by tally, to determine the exact match. That is, if observer one had six tallies and observer two had four tallies in the same cell, then we counted four agreements and two disagreements. This measure of agreement thus takes into account the degree of variation between observers’ tallies.
The calculation of inter-rater reliability was conducted in a way designed to avoid inflating
reliability scores simply because the target behaviors were unobserved. Because there were many zeros, representing the “absence” of the indicated instructional behaviors, there was a possibility that reliability could be exaggerated by inclusion of zeros in reliability calculations, because reliability would be 100 percent if neither observer recorded a tally. To address this issue, we removed those intervals that had no tallies from the reliability calculations.
The inter-rater reliability (as measured by percent agreement between observers) for
individual items from the classroom observation form ranged from 78 to 100 percent (see Table F.1). The total percent agreement across all items was 89 percent. (Appendix I shows key descriptive statistics [including means and standard deviations] for the full set of items from the classroom observation and fidelity instruments.)

F.4
TABLE F.1
PERCENT AGREEMENT RELIABILITY FOR ACTIVE INTERVALS, BY ITEM
Item Agreements of Observed Items
Agreements of Unobserved Items Disagreements Percent Agreementa
Comprehension Items Modeling and Thinking Aloud
1A Background knowledge 3 408 1 99.76 2A Text structure 1 411 0 100.00 3A Various comprehension strategies 0 408 4 99.03 4A Generating questions 1 410 1 99.76 5A Text features 1 410 1 99.76
Total 6 2,047 7 99.66 Explaining/Reviewing
1B Background knowledge 160 354 47 91.62 2B Text structure 111 355 44 91.37 3B Various comprehension strategies 443 321 126 85.84 4B Generating questions 96 326 45 90.36 5B Text features 78 344 34 92.54
Total 888 1,700 296 89.74 Comprehension Student Practice
1C Background knowledge 301 348 38 94.47 2C Text structure 169 356 49 91.46 3C Various comprehension strategies 614 246 134 86.52 4C Generating questions 161 287 78 85.17 5C Text features 90 349 39 91.84
Total 1,335 1,586 338 89.63 Interactive Teaching
6 Justifying responses 76 336 60 87.29 7 Higher order questioning 388 228 171 78.27 8 Elaborating/clarifying the text 533 188 190 79.14
Total 997 752 421 80.60

Table F.1 (continued)
F.5
Item Agreements of Observed Items
Agreements of Unobserved Items Disagreements Percent Agreementa
Vocabulary Items Teaching Vocabulary
V1 Providing definitions 288 227 122 80.85 V2 Providing examples/elaborations 488 213 131 84.25 V3 Providing visuals 136 324 64 87.79 V4 Teaching context clues 38 376 18 95.83
Total 950 1,140 335 86.19 Vocabulary Student Practice
V5 Using knowledge of words 757 190 190 83.29 V6 Using context clues 30 390 16 96.33
Total 787 580 206 86.90
Items in Each Area Comprehension 3,226 6,085 1,062 89.76 Vocabulary 1,737 1,720 541 86.47
Total 4,963 7,805 1,603 88.85
Items Contained in the Classroom Observation Scales Traditional Interaction 3,159 3,778 1,158 85.69 Reading Strategy Guidance 1,876 3,704 631 89.84 Source: Classroom observations. Note: Inter-rater reliability calculations were based only on active intervals, which are those intervals during which the teacher and students were working
on informational text and at least one teaching practice on the ERC form was observed by either member of the observer pair. If a teacher taught a lesson on informational text but was not observed to be using any of the teaching practices on the observation measure, that interval was not included.
aReliability by item was calculated by measuring the exact match percent agreement between reliability (and quality control) observation pairs during each interval. This method involves calculating agreements and disagreements tally by tally, to determine the exact match. That is, if Observer 1 had six tallies and Observer 2 had four tallies in the same cell, then we will count four agreements and two disagreements.

F.6
B. ASSESSING CRITERION VALIDITY
Another important part of the analysis of classroom observation data is an examination of the criterion validity of the study’s classroom observation scales. Criterion validity was measured by the extent to which these scales, measuring the incidence of teacher behaviors, are correlated with students’ scores on reading comprehension tests. Achieving a high degree of validity for a scale suggests that affecting that scale has the potential to improve student achievement.
To examine this issue, we measured the extent to which the classroom observation scales are related to the study’s key student test score outcomes. We conducted this analysis using classroom observation scales constructed in two different ways: based on sums of activities across observation intervals and based on averages of activities across the observation intervals. We accounted for clustering of students within schools in calculating p-values, but we did not account for multiple comparisons because this is purely an exploratory analysis.
We found that two of the three scales are positively and statistically significantly related to student test scores. The Reading Strategy Guidance scale is statistically significantly related to the composite test scores (correlation: 0.083, p-value: 0.03); the GRADE scores (correlation: 0.072, p-value: 0.05); the social studies reading comprehension assessment (correlation: 0.087, p-value: 0.01); and the science reading comprehension assessment (correlation: 0.075, p-value: 0.03). There was also a statistically significant relationship between the Classroom Management scale and the composite test scores (correlation: 0.115, p-value: 0.002); the GRADE scores (correlation: 0.106, p-value: 0.002); the social studies reading comprehension assessment (correlation: 0.086, p-value: 0.03); and the science reading comprehension assessment (correlation: 0.129, p-value: 0.001). We found no relationship between the Traditional Interaction scale and any of the study’s test scores.
C. CREATION AND RELIABILITY OF CLASSROOM OBSERVATION MEASURES Consistent data from both treatment and control group classrooms make it possible to
compare teachers’ instructional practices and determine whether the reading comprehension curricula affected instruction. The Expository Reading Comprehension (ERC) observation form enabled the study team to tally the number of times treatment and control group teachers engaged in specific teaching practices. These detailed observation data were then reduced to a manageable number of variables for analysis to obtain a summary picture of teacher behavior and whether (and how) it diverged in the two groups of teachers. This appendix describes the process the study team used to obtain this more manageable number of variables.
We developed summary scales for groupings of specific items for Parts I and II of the ERC
instrument. Part I of the instrument focused on interactive teaching practices, vocabulary instruction, and comprehension strategy instruction; Part II focused on classroom management and student engagement. The development of scales was done by implementing preliminary exploratory factor analysis, conducting a review of item content, and implementing Item Response Theory (IRT) scaling (Nunnally and Bernstein 1994; Lord 1980; Wright and Stone 1979; and Lord and Novick 1968).

F.7
The goal of the factor analysis was to identify preliminary groupings of items for Part I of the ERC instrument that appeared to represent key underlying dimensions. Any of the Part I items that were weakly related to the identified underlying dimensions were dropped from further psychometric analyses. This process ultimately resulted in three groupings of items for Part I.
A review of item content was used to identify groupings of items for Part II of the ERC
instrument, due to the smaller number of items and more distinct content groupings of items. Two groupings of items for Part II were specified based on the thematic similarities of content shared between the items for each of the two groups. In total, across Parts I and II of the ERC, five groupings of items were identified.62
The goal of the IRT scaling was to estimate reliable and valid scores for teachers on scales
that represent the underlying dimensions for the respective item groupings in Parts I and II of the ERC instrument. The data preparation, IRT scaling process, evaluation of IRT model fit, evaluation of reliability and validity for scores, and information on how to interpret the scores are described in detail below.
Data Preparation. To support the most-valid IRT item calibration and score estimation, we
conducted additional data processing for the items of each of the five groupings. The tallies for items of Part I for each interval were averaged across the 10-minute intervals for each classroom within a single day. We then evaluated the frequency distributions of each item and created meaningful categories representing the extent to which behaviors were observed (such as low, medium, and high).63 The category boundaries were determined based on investigation of the frequency distributions for each item.
Because the items of Part II of the ERC instrument have their own specified rating scales,
there was no need to create categories for those items. Therefore, data for the items of Part II were analyzed according to these existing rating scales.
IRT Scaling Process. For each of these five groups of items, IRT scaling was used to
develop variables measuring the underlying latent dimensions. The IRT model features a multivariate logistic regression of the probability for the demonstration (or level of response) on each item in a grouping (such as, low, medium, or high) on the latent dimension as an underlying continuous variable, which was estimated by way of an iterative numerical process. The joint probabilities for the levels of demonstrations across the full set of items within a grouping, conditional on the underlying continuous variable used to represent the latent dimension, are used to estimate scores as proficiency estimates on the scale for the respective latent dimension.
62During the IRT scaling process, another dimension was specified in order to account for two items within
Part II of the ERC that shared a common question stem. The additional dimension was specified to avoid estimation bias (it was not specified for use in the study’s examination of the relationship between impacts and teacher practices).
63To permit sensitivity testing of the scales used in the analysis, we also created these categories based on sums of observed tallies across the 10-minute intervals for the day’s observations. IRT scaling was done for data based on sums of tallies for items across the intervals, as well as averages of tallies for items across the intervals.

F.8
These scores quantify the levels of estimated proficiency for demonstrating the underlying skill for each latent dimension.
Scores for the five scales (that is, one scale for each of the five groupings of items) were
estimated for all classrooms using a specific IRT technique. IRT item calibration and score estimation was done using the Multidimensional Random Coefficients Multinomial Logit Model (Adams et al. 1997).64 This model was used to specify a multidimensional generalization of the Partial Credit Model (Masters and Wright 1997; Masters 1982), and is the core model of the software ACER ConQuest (Wu et al. 2007).
Items in the scales had two to four categories for the levels of demonstration, which affected
how they were treated during IRT scaling. Items with only two categories (low and high) were treated as dichotomous items for IRT item calibration, while items with more than two categories (low, medium, and high, for example) were treated as polychotomous items. Data for dichotomous and polychotomous items for scales were analyzed together during the IRT analysis; this was possible because the IRT software used permits analysis for scales that have mixtures of item types, even when the numbers of categories for items differ.
Evaluation of IRT Model Fit. Overall, the IRT model fit the data well. Based on the
guideline of 0.5 to 1.7 for reasonable infit and outfit mean square values for items of a clinical observation instrument (Wright and Linacre 1994), the scaling process resulted in acceptable overall model fit for each item contained in the three reliable scales (Table F.2).65 The two remaining scales that were created in this process were not used in the study’s analyses due to concerns over their reliability or inter-rater reliability. For one of these scales, reliability was the concern (with values of 0.43 for the version of the scale based on averages of teacher practice tallies and 0.58 for the version of the scale based on sums of tallies). For the other scale, inter-rater reliability was the concern (with values of 0.69 for the version of the scale based on averages of tallies and 0.73 for the version based on sums of tallies).
Additional statistical tests provide support for the use of the three reliable scales in the
analysis. The separation reliability estimate for item parameter estimation is 0.99, indicating a high level of reliability for the estimation of item parameters, with a value of 1.0 being the theoretically maximum possible value. As one would hope, the Chi-square test of item parameter equality is statistically significant (χ2 = 5233.70, df = 34, p < .05). Taken together, these statistics indicate that items are distributed sufficiently well, for this sample of classrooms, across the continuums of proficiency for each scale; the statistics also indicate that items function well enough to ensure acceptable levels of measurement precision at various points along the scales.
64Using the Multidimensional Random Coefficients Multinomial Logit Model permitted (1) explicit modeling of the multidimensionality of the item data during analysis, facilitating proper estimation for the statistical characteristics of items, even as they contribute to multiple domains; (2) proper model specification when different items share common stems, necessitating additional dimensions to control for residual correlations between such items in order to avoid estimation bias; and (3) Bayesian estimators for both item and score parameter estimates, and an IRT-based reliability estimate for each scale overall and for the score of each classroom.
65Fit at the level of each category for all items for the three scales was also examined. In general, results from this examination showed acceptable IRT model fit for the categories of all the items.

F.9
TABLE F.2
ITEM RESPONSE MODEL DIFFICULTY PARAMETERS, STANDARD ERRORS, OUTFIT AND INFIT STATISTICS, AND CORRECTED ITEM-TOTAL CORRELATIONS FOR ITEMS OF EACH SCALE
Item Item
Difficultya Standard
Errorb Outfit Mean
Squarec Infit Mean
Squared
Corrected Item-Total
Correlatione
Traditional Interaction
Comprehension Item 4B 505.34 0.49 1.01 1.03 0.31 Comprehension Item 4C 502.05 0.42 1.14 1.13 0.24 Comprehension Item 5B 506.64 0.53 0.90 0.97 0.30 Comprehension Item 5C 506.16 0.52 0.98 1.03 0.22 Comprehension Item 6C 503.79 0.43 1.29 1.18 0.14 Comprehension Item 7C 503.70 0.48 1.06 1.09 0.41 Comprehension Item 8 506.79 0.89 1.06 1.05 0.37 Vocabulary Item 1 503.53 0.85 1.26 1.17 0.25 Vocabulary Item 2 512.29 1.03 0.86 0.87 0.38 Vocabulary Item 3 511.31 1.03 0.89 0.87 0.43 Vocabulary Item 4 511.56 0.67 1.02 1.05 0.25 Vocabulary Item 5 507.40 0.93 0.86 0.89 0.31 Vocabulary Item 6 519.29 1.29 1.24 1.15 0.17
Reading Strategy Guidance
Comprehension Item 2B 516.85 1.18 0.92 1.01 0.32 Comprehension Item 2C 514.19 1.09 1.10 1.14 0.24 Comprehension Item 3A 529.36 2.51 1.22 1.07 0.14 Comprehension Item 3B 510.62 0.99 0.82 0.91 0.44 Comprehension Item 3C 505.89 0.91 0.97 1.00 0.37 Comprehension Item 4B 505.34 0.49 1.01 1.03 0.35 Comprehension Item 4C 502.05 0.42 1.14 1.13 0.26 Comprehension Item 5B 506.64 0.53 0.90 0.97 0.43 Comprehension Item 5C 506.16 0.52 0.98 1.03 0.38 Comprehension Item 6C 503.79 0.43 1.29 1.18 0.23 Vocabulary Item 4 511.56 0.67 1.02 1.05 0.14
Classroom Management
Part 2 Item 10 471.92 1.36 0.97 1.00 0.76 Part 2 Item 11 465.29 1.44 0.90 1.11 0.76 Part 2 Item 13 473.41 1.05 0.93 1.16 0.74 Part 2 Item 14 477.85 1.00 0.71 0.98 0.78 Source: Classroom observations. aItem Difficulty provides a sense of the extent to which different behaviors will be observed in classrooms. Classroom scores and item difficulty parameter estimates are expressed together on the same scale, so that teachers (classrooms) that are more likely to exhibit behaviors for particular items will score above the respective difficulty levels for those items, and teachers (classrooms) that are less likely to exhibit behaviors for the items will score below the difficulty levels for the items.

Table F.2 (continued)
F.10
bThe standard error is the estimation error of the item difficulty parameter. cOutfit Mean Square is the average of the standardized residual variance for the item without any weighting (thus, it is sensitive to outliers). The expected value is 1.0, with values less than .5 and greater than 1.7 considered to indicate problematic items for a clinical observation measure (Wright and Linacre 1994).
dInfit Mean Square is the average of the standardized residual variance after weighting for each individual residual variance, so that unexpected responses close to the item’s difficulty are given greater weight. The expected value is 1.0, with values less than .5 and greater than 1.7 considered to indicate problematic items for a clinical observation measure (Wright and Linacre 1994).
eCorrected Item-Total Correlation is the correlation between responses on an item and the total raw score that is calculated using the remaining set of items for the scale in order to correct for spuriousness.
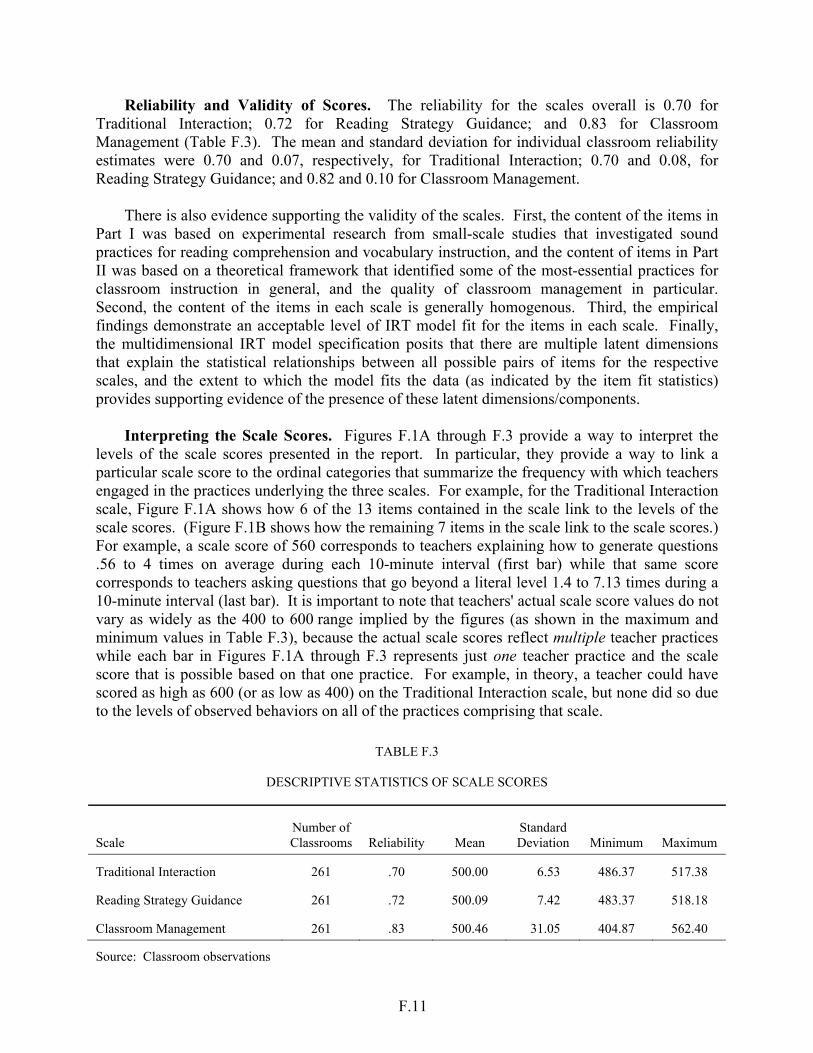
F.11
Reliability and Validity of Scores. The reliability for the scales overall is 0.70 for Traditional Interaction; 0.72 for Reading Strategy Guidance; and 0.83 for Classroom Management (Table F.3). The mean and standard deviation for individual classroom reliability estimates were 0.70 and 0.07, respectively, for Traditional Interaction; 0.70 and 0.08, for Reading Strategy Guidance; and 0.82 and 0.10 for Classroom Management.
There is also evidence supporting the validity of the scales. First, the content of the items in
Part I was based on experimental research from small-scale studies that investigated sound practices for reading comprehension and vocabulary instruction, and the content of items in Part II was based on a theoretical framework that identified some of the most-essential practices for classroom instruction in general, and the quality of classroom management in particular. Second, the content of the items in each scale is generally homogenous. Third, the empirical findings demonstrate an acceptable level of IRT model fit for the items in each scale. Finally, the multidimensional IRT model specification posits that there are multiple latent dimensions that explain the statistical relationships between all possible pairs of items for the respective scales, and the extent to which the model fits the data (as indicated by the item fit statistics) provides supporting evidence of the presence of these latent dimensions/components.
Interpreting the Scale Scores. Figures F.1A through F.3 provide a way to interpret the
levels of the scale scores presented in the report. In particular, they provide a way to link a particular scale score to the ordinal categories that summarize the frequency with which teachers engaged in the practices underlying the three scales. For example, for the Traditional Interaction scale, Figure F.1A shows how 6 of the 13 items contained in the scale link to the levels of the scale scores. (Figure F.1B shows how the remaining 7 items in the scale link to the scale scores.) For example, a scale score of 560 corresponds to teachers explaining how to generate questions .56 to 4 times on average during each 10-minute interval (first bar) while that same score corresponds to teachers asking questions that go beyond a literal level 1.4 to 7.13 times during a 10-minute interval (last bar). It is important to note that teachers' actual scale score values do not vary as widely as the 400 to 600 range implied by the figures (as shown in the maximum and minimum values in Table F.3), because the actual scale scores reflect multiple teacher practices while each bar in Figures F.1A through F.3 represents just one teacher practice and the scale score that is possible based on that one practice. For example, in theory, a teacher could have scored as high as 600 (or as low as 400) on the Traditional Interaction scale, but none did so due to the levels of observed behaviors on all of the practices comprising that scale.
TABLE F.3
DESCRIPTIVE STATISTICS OF SCALE SCORES
Scale Number of Classrooms Reliability Mean
Standard Deviation Minimum Maximum
Traditional Interaction 261 .70 500.00 6.53 486.37 517.38
Reading Strategy Guidance 261 .72 500.09 7.42 483.37 518.18
Classroom Management 261 .83 500.46 31.05 404.87 562.40
Source: Classroom observations

F.12
FIGURE F.1A
LINK BETWEEN AVERAGE NUMBER OF TIMES BEHAVIORS WEREOBSERVED AND TRADITIONAL INTERACTION SCALE SCORES
0 - .71 0 - .18 0 - .18 0 - .19 0 - .19 0 - .18
.71 - 1.40 .18 - .40.18 - .67 .19 - .56 .19 - .57
.18 - .69
1.40-7.13 .40-3.16 .67-4.50 .69-4.50 .56-4.0 .57-4.22
400
420
440
460
480
500
520
540
560
580
600
Teacher Explains How toGenerate Questions
Students Practice GeneratingQuestions
Teacher Explains TextFeatures
Students Practice Using TextFeatures
Teacher Asks Students toJustify Responses
Teacher Asks QuestionsBased on Material in Text
Beyond Literal LevelControl MeanTreatment Mean
Scal
e Sc
ores

F.13
FIGURE F.1B
LINK BETWEEN AVERAGE NUMBER OF TIMES BEHAVIORS WERE OBSERVED AND TRADITIONAL INTERACTION SCALE SCORES
0 - .10 0 - 1.0 0 - .15 0 - .10 0 - .94 0 - .46 0 - 1.0
.10 - .671.0 - 2.44
. 15 - .69 .10 - .70
.94 - 2.0 .46 - .92 1.0 - 2.0
.67-7.33 2.44-9.25 .69-5.33 .70-4.67 2.0-5.86 .92-3.66 2.0-7.0
400
420
440
460
480
500
520
540
560
580
600
Teacher ElaboratesConcepts During and
After Reading
Teacher ProvidesDefinition orExplanation
Teacher ProvidesExamples/Multiple
Meanings
Teacher UsesVisuals/Pictures
Teacher Teaches WordLearning Strategies
Students Asked to DoSomething Requiring
Word Knowledge
Students Given Chanceto Apply Word Learning
Strategies
Control MeanTreatment Mean
Scal
e Sc
ores

F.14
FIGURE F.2
LINK BETWEEN AVERAGE NUMBER OF TIMES BEHAVIORS WERE OBSERVED AND READING STRATEGY SCALE SCORES
0 - .18
0 - 1.0
0 - .17 0 - .18 0 - .90 0 - 1.0 0 - .19 0 - .19 0 - .18 0 - .18 0 - .10
.18 - .40 1.0-1.2 .17 - 1.0 .18 - 1.0 .90 - 2.90
1.0-11.0
.19 - .56 .19 - .57 .18 - .69 .18 - .67 .10 - .67
.40-3.17 1.0-3.85 1.0-8.75 2.90-7.67 .56-4.0 .57-4.22 .69-4.50 .67-4.50 .67-5.33
400
420
440
460
480
500
520
540
560
580
600
TeacherModels Use of
Strategies
TeacherExplains Text
Structure
StudentsPractice Use ofText Structure
TeacherExplainsComp.
Strategies
StudentsPracticeComp.
Strategies
TeacherExplains Howto GenerateQuestions
StudentsPractice
GeneratingQuestions
TeacherExplains Text
Features
StudentsPractice UsingText Features
StudentsJustify
Responses
TeacherExplains
VocabularyStrategies
Control/Treatment Meana
Scal
e Sc
ores
aThe treatment and control means were so close it was not possible to distinguish between them in this figure. The values are 498.24 for the control group and 500.21 for the treatment group.

F.15
FIGURE F.3
LINK BETWEEN AVERAGE LIKERT-SCALE ITEM RATINGS AND SCALE SCORES FOR CLASSROOM MANAGEMENT
400
420
440
460
480
500
520
540
560
580
600
Teacher Maximized InstructionTime
Teacher Managed Student Behavior
Scal
e Sc
ores
minimal/poor fair good excellent
400
420
440
460
480
500
520
540
560
580
600
Student Engagement, First Half ofObservation Session
Student Engagement, Remainder ofObservation
few engaged many engaged most engaged
Control Mean Treatment Mean

F.16
D. CREATION OF TEACHER EFFICACY AND SCHOOL PROFESSIONAL CULTURE SCALES We used data from the Teacher Survey to construct a Teacher Efficacy scale and a School
Professional Culture scale.
Teacher Efficacy Scale Twelve items from the Teacher Survey were used to construct this scale (items borrowed
with permission from Hoy and Woolfolk, 1993). These items are on a 0 to 5 Likert scale and correspond to teacher self-reports on attitudes and beliefs on student engagement (4 items), instructional strategies (4 items), and classroom management (4 items). To create the teacher efficacy scale, we averaged the responses to the 12 items for each teacher, so the original scale of 0 to 5 was preserved. A higher score on the scale represents more-positive teacher perceptions of their efficacy.
The reliability of the Teacher Efficacy scales exceeded 0.79 (0.79 to 0.90). The alpha for
the overall Teacher Efficacy scale was 0.90, and the reliability of the Teacher Efficacy subscales was 0.83, 0.79, and 0.85, for efficacy in student engagement, efficacy in instructional strategies, and efficacy in classroom management, respectively (Table F.4).
TABLE F.4
RELIABILITY OF THE TEACHER EFFICACY OVERALL SCALE AND SUBSCALES
Scale Number Of Items
Coefficient Alpha Mean
Standard Deviation Minimum Maximum
Overall Teacher Efficacy 12 0.90 4.19 0.49 2.83 5.0
Efficacy In Student Engagement 4 0.83 4.07 0.62 2.25 5.0
Efficacy In Instructional Strategies 4 0.79 4.14 0.54 2.50 5.0
Efficacy In Classroom Management 4 0.85 4.34 0.56 2.25 5.0
Source: Teacher Survey.

F.17
School Professional Culture Scale Thirty-five items from the Teacher Survey were used to construct this scale. The items
correspond to teacher self-reports on attitudes and beliefs on reflective dialogue, perceptions about relationships among peers, access to new ideas, experience with changes being implemented in school, professional development opportunities, and leadership and support. The range of this scale is 0 to 10, and a higher score on the scale indicates more-positive teacher perceptions of the professional culture in their school.
This scale was constructed using a Rasch rating-scale model in Winsteps (Linacre 2006). In
the Rasch rating-scale model, scale scores were constructed by estimating the probability of a specified response as a function of (1) each teacher’s ability level for the construct being measured and (2) item difficulty. In IRT analyses, ability corresponds to the level of the attitude or belief being measured, and item difficulty corresponds to the prevalence of or likelihood of endorsing the attitude, belief, or behavior represented by each item in a scale. Most-prevalent beliefs, attitudes, or behaviors are least difficult to endorse, while uncommon ones are more difficult to endorse.
In the rating scale model, the scores are usually rescaled to correspond to the original scale
on the items in order to ease interpretation. For the School Professional Culture scale, the scores were rescaled to a 0 to 10 scale. The rescaled scores were used in the statistical analyses presented in this report. Item difficulties were also rescaled with the least difficult items having low values on the scale. The item difficulties and teacher scores are thus placed on a common scale and the items are expected to be ordered hierarchically along the difficulty continuum.
Therefore, the way to interpret these scales is that teachers are more likely to endorse items
below their scale score and less likely to endorse items above their scale score. Given that scores estimated on a limited number of responses are less reliable than scores with more ratings, if 50 percent or more of the items in a scale were missing, the score for that teacher was set to missing.66
Several statistical tests indicate that this scale and its six subscales (corresponding to the six
categories of attitudes and beliefs described above) are reliable and valid measures. Person separation reliability, infit mean square, and item difficulty were produced to evaluate the reliability and validity of the scales. Person separation reliability, which is equivalent to Cronbach’s alpha and measures internal consistency of the scale, ranged from 0.66 to 0.86 for the overall scale and subscales. The infit mean square values for most of the items, which indicate whether the response items are consistent with the hierarchical ordering of the items, were close to 1, which suggests that most response patterns align with the hierarchical ordering of the items in the six subscales. Finally, the items in the six subscales were spread along the difficulty hierarchy, with item difficulty statistics ranging from 2.97 to 6.27 (Tables F.5 and F.6).
66This occurred for only two teachers in the sample.

F.18
TABLE F.5
DESCRIPTIVE STATISTICS AND PERSON SEPARATION RELIABILITIES FOR THE OVERALL SCHOOL CULTURE SCALE AND SUBSCALES
Scale Number of Items
Person Separation Reliability
Sample Size Mean
Standard Deviation Minimum Maximum
Overall School Culture 35 .87 258 5.69 .47 4.53 7.86
Reflective Dialogue 4 .78 253 5.62 2.00 0 10
Perceptions About Relationships Among Peers 6 .82 258 8.17 1.95 2.26 9.99
Access to New Ideas 6 .75 258 5.04 1.30 2.21 10
Experience of Change 3 .66 256 5.97 1.85 1.21 9.99
Professional Development Opportunities 9 .86 257 5.74 1.46 2.55 10
Leadership and Support 7 .84 255 7.39 2.06 0 9.99 Source: Teacher Survey.

F.19
TABLE F.6
PSYCHOMETRIC STATISTICS FOR SCHOOL CULTURE SUBSCALES
Subscale/Item Infit Mean
Squarea Item
Difficultyb
Reflective Dialogue
During the past school year, how often have you had conversations with colleagues about…
5a. The goals of this school? .95 5.55 5b. Development of new curriculum? 1.06 6.02 5c. Managing classroom behavior? 1.25 4.11 5d. What helps students learn best? .74 3.93
Perceptions About Relationships Among Peers
How much do you disagree or agree with each of the following… 6a. Teachers in this grade level trust each other. .93 5.04 6b. It’s OK in this grade level to discuss feelings, worries, and frustrations
with other teachers. .87 4.93 6c. Teachers respect other teachers who take the lead in grade-level
improvement efforts. .79 5.08 6d. Teachers in this grade level respect those colleagues who are expert at
their craft. .76 4.90
6e. To what extent do you feel respected by other teachers in this grade level? 1.42 4.30 6f. How many teachers in this grade level really care about each other? 1.06 4.76
Access to New Ideas
How often have you … 7a. Taken courses at a college or university relative to improving your
school? 1.41 4.91 7b. Participated in a network with other teachers outside your school? .86 4.53 7c. Discussed curriculum and instruction matters with an outside professional
group or organization? .85 4.74 7d. Attended professional development activities organized by your school
(include meetings that focus on improving your teaching)? 1.10 2.97 7e. Attended workshops or courses sponsored by your school district
(exclude required in-services)? .85 3.71 7f. Attended professional development activities sponsored by the teachers’
union? .99 6.27 Experience of Change
How much do you disagree or agree with each of the following… 8a. Most changes introduced at this school involve only a few teachers; rarely
does the whole faculty become involved (reverse-coded). 1.13 4.56 8b We receive adequate professional development support for the changes
we introduce at our school. 1.16 4.94 8c. Most changes introduced at this school gain little support among teachers
(reverse-coded). .68 4.64

Table F.6 (continued)
F.20
Subscale/Item Infit Mean
Squarea Item
Difficultyb
Professional Development Opportunities
Overall, my professional development experiences over the past school year… 9a. Have included opportunities to work productively with teachers from
other schools. 1.24 5.20 9b. Have included enough time to think carefully about, to try, and to
evaluate new ideas. .99 5.64 9c. Have deepened my understanding of subject matter. .77 4.35 9d. Have helped me understand my students better. .81 4.63 9e. Have been sustained and coherently focused, rather than being short term
and unrelated. .85 5.13 9f. Have included opportunities to work productively with colleagues in my
school. 1.16 4.74 9g. Have led me to make changes in my teaching. .71 3.99 9h. Have been closely connected to my school’s improvement plan. 1.22 3.96 9i. Most of what I learn in professional development addresses the needs of
the students in my classroom. 1.10 4.35 Leadership and Support
How much do you disagree or agree with each of the following… 10a. The principal at this school is strongly committed to shared decision
making. 1.46 5.02 10b. The principal at this school works to create a sense of community in the
school. .80 4.46 10c. The principal at this school promotes parent and community involvement
in the school. .94 3.95 10d. The principal at this school supports and encourages teachers to take
risks. .91 5.12 10e. The principal at this school is willing to make changes. .91 4.62 10f. Most changes introduced at this school receive strong support from the
principal. .80 4.99 10g. The principal at this school encourages teachers to try new methods of
instruction. 1.11 4.48 Source: Teacher Survey. aInfit Mean Square is the average of the standardized residual variance weighting for each individual residual variance so that unexpected responses close to the item’s difficulty are given greater weight. The expected value is 1.0, with values less than .5 and greater than 1.7 generally considered poorly fitting items (Wright and Linacre 1994).
bItem difficulty is the relative likelihood that different opinions/perceptions of the professional culture in their schools will be endorsed by teachers. Items that are endorsed more frequently have lower values, and items that are endorsed less frequently have higher values. Teachers and items are placed on the same scale so that teachers who are highly likely to endorse the perceptions are below the item difficulty for their score, and teachers who are less likely to endorse the perceptions have difficulties above their score.
APPENDIX G
ESTIMATING IMPACTS


G.3
This appendix describes our approach to calculating impacts as part of our confirmatory and exploratory analyses. Our confirmatory analyses focus on the central question of whether any of the four interventions individually, or the four as a group, improve students’ scores on reading comprehension assessments, and whether intervention effects differ. Our exploratory analyses were designed to decompose overall impacts and thus improve our understanding of whether the interventions are particularly effective for certain subgroups, and to explore the pathways through which interventions affect student achievement.
A. BENCHMARK APPROACH TO CALCULATING CONFIRMATORY IMPACTS
The benchmark approach to calculating impacts reflects decisions regarding methodological approaches determined most appropriate for this study. The approach also reflects input from the Department of Education (ED) and the study’s Technical Work Group regarding suitable analytic approaches given the study’s design and goals. Five key areas are addressed in our benchmark approach to estimating impacts: (1) regression adjustment, (2) clustering of students, (3) missing data, (4) multiple comparisons, and (5) weights.
1. Regression Adjustment We calculated impacts using regression adjustment in order to increase the statistical precision of our impact estimates, which would enable us to detect smaller treatment effects. Although random assignment ensures no systematic differences between the treatment and control groups in the characteristics of students, teachers, or schools, it is still possible that random differences will exist between the groups. By regression adjusting for these random differences, we can greatly improve the precision of our impact estimates. With regression adjustment the minimum detectable effect size (MDES) of this study is 0.17 standard deviations. Without regression adjustment, the MDES would have been 0.44 standard deviations. We chose covariates for our regression model using a search algorithm designed to select a set of covariates that maximizes the proportion of variation in students’ follow-up test scores that can be explained. Specifically, we developed an algorithm based on a genetic search package available for R67 (Mebane and Sekhon 2008) to select the k covariates that maximize the regression R2, where we choose the value of k and the algorithm selects the k covariates that maximize R2. For example, if we pick k = 5, the algorithm searches for the five covariates (out of all available covariates) that maximizes the regression R2. For each test score outcome, we found the five68 covariates that maximize the regression R2. We then estimated all impact regressions using all of these covariates. Those covariates are (1) student baseline GRADE
67“R is a language and environment for statistical computing and graphics. It is a GNU project which is similar
to the S language and environment which was developed at Bell Laboratories (formerly AT&T, now Lucent Technologies) by John Chambers and colleagues.” See [http://www.r-project.org/about.html] accessed on June 2, 2008.
68We found that adding 20 covariates instead of 5 covariates only increased the regression R2 for the GRADE impact regression from 0.541 to 0.547, thereby providing insufficient benefit to warrant the cost in degrees of freedom.

G.4
scores, (2) student baseline TOSCRF scores, (3) student ELL status, (4) student race/ethnicity, (5) teacher race, and (6) school urbanicity. We also included district fixed effects in our regression model (in the form of district indicator variables) to further increase statistical precision.69 We treat district effects as fixed rather than random because (1) districts were not randomly sampled and (2) districts were not randomly assigned. Stated differently, if we were to repeat the study we would have the same districts represented in the study and in the treatment and control groups, meaning that districts do not vary and do not contribute to variation in impacts. In equation form, the regression model we estimated is:
(1) yi, j = α +δ1CRISS j + δ2RA j + δ3R4K j + δ4R4R j + βXi, j + γ kDk + u jk=1
10
∑ +ε i, j
where i and j index students and schools, respectively; CRISS, RA, R4K, and R4R are treatment group indicators (for Project CRISS, ReadAbout, Reading for Knowledge, and Read for Real, respectively); X represents covariates; D1-D10 are district indicators; u is a school-level random intercept; and ε is a student-level random intercept. The impact of the interventions relative to the control group (the omitted category) is given by the coefficients on the treatment group indicators. For example, the impact of Project CRISS is given by δ1. Below we describe how we account for the correlation between students within schools that is implied by the school-level random intercept.
2. Clustering of Students To account for correlation in the error term between students within the same schools, we estimated standard errors using Taylor series linearization with the software package SUDAAN.70 This approach yields impact estimates that are the same as ordinary least squares (OLS) impact estimates, but adjusts the standard errors in order to account for clustering of students within schools.
An alternative approach to account for clustering would be to estimate a mixed effects model using software such as SAS (using the proc mixed command) or HLM. The difference between estimating our impact model using HLM instead of SUDAAN is that HLM calculates parameter estimates as a weighted average of within-school and between-school effects, while
69Alternatively, we could have included block indicator variables, which would have reduced the degrees of
freedom for the impact regressions from 67 to 63. As a robustness check, we conducted statistical tests using 63 degrees of freedom instead of 67 and found that p-values increased by less than 0.001, which does not change the statistical significance of any of our findings.
70Students are also clustered within classrooms, but classrooms were neither randomly sampled nor randomly assigned and therefore do not contribute to variance. We treat classroom effects as fixed by centering all classrooms within a school at the school-level means of all variables used in the impact regressions (both outcomes and covariates). We also ran impacts without mean centering and found that it did not change the sign, statistical significance, or magnitude of reported impacts.

G.5
SUDAAN calculates the same parameter estimates as OLS. The parameter estimates from SUDAAN can be interpreted as the marginal effect of a variable for the average student in the sample. The interpretation of the HLM parameter estimates is less clear because the weights used to create the weighted average are selected to minimize variance, not to represent any particular group. Because there is no “within-school” treatment effect (because there is no within-school variation in treatment status), however, HLM and SUDAAN will both estimate treatment effects using between-school variation in treatment status only. The only difference between the two approaches will be in the estimate of the effects of covariates that vary within schools (such as students’ baseline test scores).
We chose to use Taylor series linearization instead of mixed effects modeling for our benchmark model because the parameter estimates are easier to interpret (as noted above) and because it allows for greater flexibility theoretically and it facilitates the implementation of the analysis. From a theoretical perspective, the Taylor series linearization approach is more flexible because it accounts for any within-school correlations between students that are not explicitly specified, whereas HLM requires that all correlations be known and fully specified. From an implementation perspective, the software used to account for clustering using Taylor series linearization is easier to integrate into our overall approach to estimating impacts. This is because SUDAAN can be completely controlled programmatically from SAS whereas HLM cannot.71
3. Missing Data
We encounter missing data in two contexts. First, we encounter missing covariate data in our impact regressions. Second, we encounter missing outcome data when estimating impacts on the GRADE and ETS follow-up tests. We discuss how each of these is addressed in the analysis below.
Missing Covariates72
We implemented an approach to account for missing covariates to maximize the number of observations that would contribute to the estimation of impacts of the curricula. We account for missing covariates by imputing the missing variable to the mean of the variable and including a missing value indicator in our regression equation. By using this approach we ensure that the parameter estimate for each covariate is based only on nonmissing observations while allowing an observation that is missing data on one covariate to still contribute to estimating the effects of covariates for which that observation is not missing data. (In the context of this evaluation, the primary concern is ensuring that all observations with follow-up data contribute to the estimation
71There are software packages that can estimate mixed effects models while providing much better
programming control than HLM, for example proc mixed in SAS or the LMER package in R. However these packages do not properly account for school-level weights, whereas SUDAAN does.
72This discussion applies only to missing covariates, such as baseline test score and race/ethnicity. It does not apply to the treatment indicator variables. The treatment indicator variables are never missing because we know the random assignment status of every school in the study.

G.6
of the coefficients on the treatment status indicators.) This approach may result in parameter estimates for covariates with missing data that do not fully represent the entire study sample. Because the purpose of including covariates is to increase the precision of the impact estimates, this issue has little practical significance in this context. Table G.1 shows the proportion of the sample missing each of the covariates included in our impact regressions.
Missing Follow-up Tests
Missing follow-up test score data have two potential implications. First, if students who have follow-up test score data in a treatment group are different from those who have follow-up test score data in the control group, then impacts could be biased. Evidence of this kind of bias would be either a differential rate of nonresponse between the treatment and control groups or different characteristics of respondents between treatment and control groups. Second, if students who are missing test score data are different from those who are not, then the impacts calculated for the analysis sample (that is, students who are not missing the outcome variable) might not be completely representative of students in the study sample.
Our analysis indicates that the impact estimates are unlikely to be biased due to differential
nonresponse between the treatment and control groups. The proportion of students with a score on each test is between 84 and 90 percent (Table G.2). Statistically significantly more students in the Reading for Knowledge treatment arm have a GRADE and ETS social studies score than students in the control group (a difference of 4 and 6 percentage points, respectively), but there are no other statistically significant differences. In addition, as shown in Tables G.3-G.5, the average characteristics of students with follow-up test scores do not differ systematically among the treatment and control groups (including comparisons between students in the control group and Reading for Knowledge group). Of the 240 comparisons made in these three tables, only three are statistically significant (which is well within the number of differences one might expect to occur by chance alone). We conclude from these comparisons that the internal validity of the study is not threatened by missing follow-up test score data.
However, there is evidence that nonrespondents are more disadvantaged than respondents.
Specifically, we see that nonrespondents have lower baseline test scores, are more likely to be overage for grade, and are more likely to be identified as having a disability (Table G.6). Nonrespondents are also more likely to be black, less likely to be white, and less likely to be classified as English language learners.
We used nonresponse weights to account for these differences in baseline characteristics of students who do and do not have a follow-up test. These weights are described in detail in Section 5.

G.7
TABLE G.1
PROPORTION OF SAMPLE MISSING EACH COVARIATE, BY OUTCOME
Composite Test Score
GRADE Score
Social Studies Reading
Comprehension Assessment
Score
Science Reading Comprehension
Assessment Score
School Locationa 3.6 3.6 3.7 3.6
Teacher Raceb 1.2 1.2 1.2 1.1
Baseline GRADE 4.2 4.1 4.1 4.1
Baseline TOSCRF 4.5 4.4 4.4 4.3
Student English Language Learner Status 22.5 22.5 21.6 23.1
Student Racec 34.5 34.4 34.3 34.8
Student Ethnicityd 53.5 53.4 52.7 54.0 aSchool location includes indicators for “Urban,” “Urban Fringe,” and “Rural” locations.
bTeacher race includes indicators for “White,” “Black,” “Asian,” and “Native American/Pacific Islander.”
cStudent race includes indicators for “White,” “Black,” “Asian,” and “Native American/Pacific Islander.”
dStudent ethnicity includes an indicator for “Hispanic.”
GRADE = Group Reading Assessment and Diagnostic Evaluation. TOSCRF = Test of Silent Contextual Reading Fluency.

G.8
TABLE G.2
PROPORTION OF STUDENTS WITH FOLLOW-UP TEST SCORES, BY EXPERIMENTAL CONDITION
Follow-Up Tests Control Group
Project CRISS ReadAbout
Read for Real
Reading for
Knowledge
Combined Treatment
Group
GRADE 86 88 88 88 90* 88 (.52) (.45) (.44) (.05) (.20)
ETS Social Studies 84 87 86 87 90* 87 (.23) (.57) (.40) (.03) (.15)
ETS Science 85 85 89 88 86 87 (.93) (.06) (.09) (.55) (.15)
Source: Reading comprehension tests administered by study team. Note: The p-values from t-tests of treatment and control group differences in means are presented in parentheses.
These tests account for clustering of students within schools. *Statistically different at the .05 level. ETS = Educational Testing Service. GRADE = Group Reading Assessment and Diagnostic Evaluation.

G.9
TABLE G.3
AVERAGE BASELINE CHARACTERISTICS OF STUDENTS WITH FOLLOW-UP GRADE SCORES, BY EXPERIMENTAL CONDITION
Control Group
Project CRISS ReadAbout
Read for Real
Reading for Knowledge
Combined Treatment
Group Percentage in Study Schools at 98 95 97 95 98 96 Beginning of School Year (.13) (.58) (.22) (.10) (.19) GRADE Score (Average) 100.35 101.51 99.91 99.66 101.49 100.66 (.45) (.55) (.36) (.50) (.80) TOSCRF Score (Average) 88.58 89.30 88.18 88 90.01 88.88 (.56) (.28) (.21) (.19) (.73)
Female (Percentage) 49 52 50 50 48 50 (.06) (.75) (1) (.20) (.44)
Age (Average) 10.68 10.72 10.69 10.75 10.71 10.72 (.76) (.63) (.34) (.93) (.39)
Overagea (Percentage) 20 22 20 24 22 22 (.93) (.62) (.46) (.78) (.49)
Hispanic (Percentage) 78 73 80 71 66 73 (.97) (.59) (.82) (.50) (.70) Race (Percentage)
White 36 42 37 45 49 43 (.93) (.61) (.71) (.42) (.41)
Black 42 39 44 41 39 41 (.82) (.74) (.98) (.83) (.93)
Asian 3 2 4 2 3 3 (.86) (.56) (.20) (.94) (.79)
Native American 4 0* 2 2 0 1 (.04) (.65) (.82) (.08) (.16)
Number of Days Absent in Prior 12.95 9.98 11.18 14.62 10.98 11.66 School Year (Average) (.54) (.80) (.49) (.76) (.73) Eligible for Free or Reduced-Price 59 60 63 58 57 60 Lunch (Percentage) (.94) (.51) (.82) (.63) (.98) Classified as English Language 30 26 31 33 24 29 Learner (Percentage) (.72) (.84) (.76) (.65) (.88) Identified as Having a Disability b 9 9 11 12 12 11 (Percentage) (.52) (.94) (.46) (.58) (.54) Received Remedial or Specialized 50 28 37 51 34 37 Services in Readingc (Percentage) (.43) (.87) (.51) (.65) (.47)
Number of Studentsd 1,179 1,154 1,095 1,077 1,067 4,393

Table G.3 (continued)
G.10
Source: Student Records Form. Baseline GRADE and TOSCRF tests administered by study team. Note: Baseline characteristics are reported only for students who were present in study schools at baseline. The
p-values from tests of treatment and control group differences in means are presented in parentheses. These tests account for clustering of students within schools.
aWe considered a fifth grader to be overage for grade if he or she was 11 or older as of September 1, 2006.
bA student was identified as having a disability if any of the following categories were indicated on the student records form: autism, deaf-blindness developmental delay, emotional disturbance, hearing impairment, learning disability, mental retardation, orthopedic impairment, other health impairment, speech or language impairment, traumatic brain injury, visual impairment, and other disability not included in this list.
cServices in reading include reading support, speech/language support, English as a Second Language (ESL), Title I, tutoring, and other forms of extra help to bring students up to grade level.
dThe number of students presented in this row is the number with follow-up GRADE scores. Response rates vary across items.
*Statistically different at the .05 level. GRADE = Group Reading Assessment and Diagnostic Evaluation. TOSCRF = Test of Silent Contextual Reading Fluency.

G.11
TABLE G.4
AVERAGE BASELINE CHARACTERISTICS OF STUDENTS WITH FOLLOW-UP SOCIAL STUDIES READING COMPREHENSION SCORES, BY EXPERIMENTAL CONDITION
Control Group
Project CRISS ReadAbout
Read for Real
Reading for Knowledge
Combined Treatment
Group Percentage in Study Schools at 98 96 97 94 98 96 Beginning of School Year (.44) (.02) (.22) (.64) (.06) GRADE Score (Average) 100 102 100 100 101 101 (.40) (.28) (.54) (.49) (.95) TOSCRF Score (Average) 88 90 89 88 90 89 (.46) (.37) (.17) (.56) (.33)
Female (Percentage) 48 54 52 50 48 51 (.19) (.80) (.14) (.31) (.37)
Age (Average) 11 11 11 11 11 11 (.72) (.15) (.72) (.62) (.36)
Overagea (Percentage) 20 21 20 24 22 22 (.84) (.34) (.91) (.54) (.45)
Hispanic (Percentage) 78 76 79 70 65 73 (.87) (.85) (.42) (.65) (.7)
Race (Percentage) White 36 41 36 44 50 42 (.99) (.75) (.33) (.58) (.43)
Black 40 39 46 44 39 42 (.84) (.84) (.79) (.70) (.90)
Asian 4 2 3 1 2 2 (.88) (.13) (.97) (.79) (.33)
Native American 4 0* 2 3 1 1 (.04) (.50) (.32) (.88) (.20) Number of Days Absent in Prior 14 9 10 14 11 11 School Year (Average) (.56) (.55) (.81) (.65) (.56) Eligible for Free or Reduced-Price 61 60 60 59 56 59 Lunch (Percentage) (.85) (.95) (.60) (.98) (.84) Classified as English Language 31 26 29 31 25 28 Learner (Percentage) (.75) (.76) (.71) (.96) (.85) Identified as Having a Disability b 9 8 12 13 12 11 (Percentage) (.28) (.36) (.62) (.54) (.38) Received Remedial or Specialized 52 28 35 49 35 37 Services in Readingc (Percentage) (.45) (.54) (.68) (.78) (.41)
Number of Studentsd 576 573 537 541 553 2,204

Table G.4 (continued)
G.12
Source: Student Records Form. Baseline GRADE and TOSCRF tests administered by study team. Note: Baseline characteristics are reported only for students who were present in study schools at baseline. The
p-values from tests of treatment and control group differences in means are presented in parentheses. These tests account for clustering of students within schools.
aWe considered a fifth grader to be overage for grade if he or she was 11 or older as of September 1, 2006.
bA student was identified as having a disability if any of the following categories were indicated on the student records form: autism, deaf-blindness developmental delay, emotional disturbance, hearing impairment, learning disability, mental retardation, orthopedic impairment, other health impairment, speech or language impairment, traumatic brain injury, visual impairment, and other disability not included in this list.
cServices in reading include reading support, speech/language support, English as a Second Language (ESL), Title I, tutoring, and other forms of extra help to bring students up to grade level.
dThe number of students presented in this row is the number with follow-up social studies reading comprehension scores. Response rates vary across items.
*Statistically different at the .05 level. GRADE = Group Reading Assessment and Diagnostic Evaluation. TOSCRF = Test of Silent Contextual Reading Fluency.

G.13
TABLE G.5
AVERAGE BASELINE CHARACTERISTICS OF STUDENTS WITH FOLLOW-UP SCIENCE READING COMPREHENSION SCORES, BY EXPERIMENTAL CONDITION
Control Group
Project CRISS ReadAbout
Read for Real
Reading for Knowledge
Combined Treatment
Group Percentage in Study Schools at 97 94 97 96 99* 96 Beginning of School Year (.06) (.75) (.50) (.02) (.41) GRADE Score (Average) 100.35 101.54 99.95 99.84 101.65 100.73 (.49) (.55) (.43) (.49) (.75) TOSCRF Score (Average) 89.08 89.06 87.71 87.73 89.97 88.60 (.67) (.12) (.13) (.24) (.61)
Female (Percentage) 49 52 49 50 48 50 (.29) (.54) (.88) (.54) (.75)
Age (Average) 10.67 10.72 10.69 10.75 10.73 10.72 (.88) (.72) (.50) (.60) (.34)
Overagea (Percentage) 19 21 20 23 22 22 (.91) (.77) (.50) (.67) (.49)
Hispanic (Percentage) 79 71 81 71 69 73 (.79) (.55) (.79) (.64) (.69)
Race (Percentage) White 37 43 38 46 49 44 (.91) (.63) (.71) (.51) (.48)
Black 41 38 43 39 38 39 (.84) (.76) (.94) (.84) (.87)
Asian 3 3 5 2 3 3 (.88) (.41) (.45) (.81) (.79)
Native American 3 0 2 1 0 1 (.12) (.36) (.72) (.) (.15) Number of Days Absent in Prior 12.55 10.30 11.96 15.42 10.90 12.15 School Year (Average) (.55) (.93) (.44) (.66) (.91) Eligible for Free or Reduced-Price 59 59 66 57 57 60 Lunch (Percentage) (.86) (.21) (.60) (.68) (.88) Classified as English Language 30 26 33 34 24 29 Learner (Percentage) (.7) (.74) (.77) (.62) (.94) Identified as Having a Disability b 10 10 9 11 12 10 (Percentage) (.83) (.67) (.66) (.48) (.75) Received Remedial or Specialized 48 27 38 51 34 38 Services in Readingc (Percentage) (.42) (.92) (.48) (.67) (.54)
Number of Studentsd 593 568 559 536 503 2,166

Table G.5 (continued)
G.14
Source: Student Records Form. Baseline GRADE and TOSCRF tests administered by study team. Note: Baseline characteristics are reported only for students who were present in study schools at baseline. The
p-values from tests of treatment and control group differences in means are presented in parentheses. These tests account for clustering of students within schools. P-values could not be obtained when none (or most) of the students exhibited a given characteristic. This is indicated by a (.).
aWe considered a fifth grader to be overage for grade if he or she was 11 or older as of September 1, 2006.
bA student was identified as having a disability if any of the following categories were indicated on the student records form: autism, deaf-blindness developmental delay, emotional disturbance, hearing impairment, learning disability, mental retardation, orthopedic impairment, other health impairment, speech or language impairment, traumatic brain injury, visual impairment, and other disability not included in this list.
cServices in reading include reading support, speech/language support, English as a Second Language (ESL), Title I, tutoring, and other forms of extra help to bring students up to grade level.
dThe number of students presented in this row is the number with follow-up science reading comprehension scores. Response rates vary across items.
*Statistically different at the .05 level. GRADE = Group Reading Assessment and Diagnostic Evaluation.

G.15
TABLE G.6
BASELINE CHARACTERISTICS OF STUDENTS WITH AND WITHOUT FOLLOW-UP TEST SCORES
GRADE Social Studies Reading
Comprehension Science Reading Comprehension
Students With a Score
Students Without a
Score
Students With a Score
Students Without a
Score
Students With a Score
Students Without a
Score Percentage in Study Schools at 96.5 90.2* 96.6 95.1* 96.4 95.2* Beginning of School Year (0.00) (0.03) (0.01) GRADE Score (Average) 100.6 96.4* 100.6 99.8* 100.6 99.7* (0.00) (0.00) (0.00) TOSCRF Score (Average) 88.8 86.3* 88.9 88.2* 88.7 88.4 (0.00) (0.22) (0.00) Female (Percentage) 50.0 46.7 50.4 49.3 50.0 49.6 (0.23) (0.75) (0.42) Age (Average) 10.71 10.96* 10.70 10.74* 10.70 10.75* (0.00) (0.05) (0.00) Overagea (Percentage) 21.4 38.9* 21.4 23.6* 20.9 24.0* (0.00) (0.00) (0.03) Hispanic (Percentage) 73.7 67.4 73.8 72.9 74.2 72.6
(0.20) (0.09) (0.43) Race (Percentage)
White 41.6 32.8* 41.1 41.0 42.4 39.9 (0.04) (0.06) (0.98)
Black 40.6 53.0* 41.6 41.2 39.5 43.0* (0.01) (0.01) (0.75)
Asian 2.7 1.2 2.4 2.8 3.0 2.2 (0.09) (0.06) (0.34)
Native American 1.7 1.6 1.9 1.6 1.4 2.0 (0.87) (0.13) (0.48) Number of Days Absent in 11.8 10.1 11.5 11.8 12.2 11.3 Prior School Year (Average) (0.37) (0.09) (0.54) Eligible for Free or Reduced-Price Lunch (Percentage) 59.4 57.6 59.3 59.3 59.6 59.1 (0.61) (0.73) (1.00) Classified as English Language 28.5 15.3* 28.3 26.7 29.1 26.1* Learner (Percentage) (0.01) (0.00) (0.17) Identified as Having a Disability b (Percentage) 10.3 16.0* 10.6 10.9 10.2 11.3 (0.02) (0.23) (0.72) Received Remedial or Specialized Services in Readingc (Percentage) 39.5 28.0 40.0 38.1 39.3 38.7 (0.08) (0.64) (0.11)
Number of Studentsd 5,572 778 2,759 3,591 2,746 3,604
Source: Student Records Form. Baseline GRADE and TOSCRF tests administered by study team. Note: Baseline characteristics are reported only for students who were present in study schools at baseline. The p-values
from tests of differences in means between students with and without test scores are presented in parentheses. These tests account for clustering of students within schools.

Table G.6 (continued)
G.16
aWe considered a fifth grader to be overage for grade if he or she was 11 or older as of September 1, 2006.
bA student was identified as having a disability if any of the following categories were indicated on the student records form: autism, deaf-blindness developmental delay, emotional disturbance, hearing impairment, learning disability, mental retardation, orthopedic impairment, other health impairment, speech or language impairment, traumatic brain injury, visual impairment, and other disability not included in this list.
cServices in reading include reading support, speech/language support, English as a Second Language (ESL), Title I, tutoring, and other forms of extra help to bring students up to grade level.
dThe number of students presented in this row is the number participating in the study. Response rates vary across items. *Statistically different at the .05 level. GRADE = Group Reading Assessment and Diagnostic Evaluation. TOSCRF = Test of Silent Contextual Reading Fluency.

G.17
4. Multiple Comparisons
In this study, making clear distinctions between effects that are real and those that are due to chance is complicated by the issue of multiple comparisons. By comparing multiple intervention groups to a control group, for multiple outcomes, the probability that one of those differences will appear to be statistically significant is greater than the probability that a single difference will appear statistically significant. Intuitively, this is similar to the difference between the probability of a single toss of a coin yielding heads and the probability that at least one of several coin tosses will yield heads.
Our benchmark approach to adjusting p-values to account for multiple comparisons begins
with the establishment of several different sets, or domains, of multiple tests. Each domain pertains to a separate research question. We then adjust p-values for tests within these domains so that we control the probability of drawing a false conclusion. The first domain consists of 12 tests—the impact of each of four interventions on each of three test scores. The second domain consists of 4 tests—the effect of each intervention on a composite test score. The third domain consists of 3 tests—the effect of the combined treatment group on each of three test scores. The fourth domain consists of a single test—the effect of the combined treatment group on the composite test score. The last domain consists of 6 tests—the pairwise comparisons among the four treatment groups. The p-values reported in the impact tables are adjusted within these domains to account for multiple comparisons.
Within domains we calculate p-values using a generalized version of the Dunnett (1955) adjustment. Dunnett’s approach takes into account correlations between tests due to a shared control group, drawing critical values based on a multivariate t-distribution. Hothorn, Bretz, and Westfall (2008) implement a more generalized procedure that is also based on a multivariate t-distribution but adjusts p-values for multiple tests taking into account correlations that arise for any reason (not just a common control group). We use this approach to adjust for both multiple treatment groups and multiple outcomes. For the exploratory analyses described below, we also adjust for multiple subgroups.
5. Weights
Accounting for nonresponse and random assignment probabilities in our benchmark models required the use of weights with two components. The overall weight used in the analysis is the product of these two components.73
The first component involves weighting by the inverse of random assignment probabilities.
In districts where the number of schools is evenly divisible by five, every school has an equal chance of being assigned to one of the five experimental conditions (four treatment groups and one control group). However, in districts where the number of schools is not evenly divisible by
73In all, eight weights were created. Weights were created for each of the study’s four test scores (ETS science comprehension, ETS social studies comprehension, GRADE, and the composite). Weights for each of the four test scores were created in two ways, corresponding to the two types of comparisons being made: (1) the pooled treatment group versus the control group and (2) all pairwise comparisons (both between treatment groups and between each treatment group and the control group).

G.18
five, we conducted random assignment such that the probability of being assigned to the control group is higher than the probability of being assigned to any given treatment group.74 We take into account these assignment probabilities in our analysis so that all five experimental groups are balanced in terms of their representation of school districts.
The second component involves accounting for nonresponse to adjust for differences in
baseline characteristics of students who do and do not have a follow-up test (as described above in Section 3). For each follow-up test score, we estimated a propensity regression model where the outcome is a binary variable that equals one if a student has a follow-up test score and zero otherwise. We calculated the expected probability of having a follow-up test score for every student using baseline data.75,76 We then created a weight that is inversely proportional to the probability of having a follow-up test score, meaning that students with a lower probability of having a follow-up test score are weighted more heavily in our analysis.
B. BENCHMARK APPROACH TO CALCULATING EXPLORATORY IMPACTS
The exploratory analyses examine how impacts vary by student and teacher characteristics, school conditions, and teacher practices. Each of these analyses is implemented by interacting the treatment dummy variables in equation 1 with subgroup dummy variables. However, the interpretation of these impacts differs depending on whether the subgroup is defined at baseline or could itself be affected by the interventions. Subgroups defined by student characteristics (such as baseline test scores), teacher characteristics (such as years of experience), and school conditions (such as concentration of ELL students in the school) cannot be affected by the intervention. Impacts for these subgroups can be interpreted as causal. Subgroups defined by teacher practices, however, could be affected by the interventions, which complicates interpretation because the treatment and control groups are no longer equivalent within those subgroups. Impacts for these subgroups cannot be interpreted as causal.
The benchmark approach for the exploratory analysis is the same as for the confirmatory
analysis in all ways but one. The exploratory analysis uses the same approach for regression
74If all schools in the control group within a district left the study, we would lose the ability to calculate any
impacts in that district. To reduce the chance of this happening, we chose to assign “extra” schools in a district to the control group.
75The baseline data used in the propensity score models included students' demographic characteristics (age, gender, race, ethnicity, whether the student is disabled, and whether the student received any reading services), students' baseline scores on the GRADE and TOSCRF assessments, characteristics of each student’s teacher (degree and experience), and characteristics of each student’s school (percentage of students eligible for free or reduced-price lunch and percentage of students classified as English language learners). Only those characteristics that were statistically significant were kept in the final model for each of the eight weights.
76Because of the extent to which baseline test scores are associated with nonresponse (see Table G.6), separate nonresponse models were estimated for students without baseline test score data. Because of the small number of students that fell into this category, a weighting class approach was used to develop nonresponse weights for these students. In this method, students are assigned to cells based on their characteristics and then the respondents in each cell are essentially weighted up to represent the nonrespondents in that cell. The same set of characteristics listed above (with the exception of baseline test scores) was used in this approach.

G.19
adjustment, clustering, missing data, and weights. The only difference in the benchmark approach between the exploratory analysis and the confirmatory analysis is how we deal with multiple comparisons. For the exploratory analysis, we do not adjust for multiple comparisons across all subgroups. We adjust only for multiple comparisons within each subgroup analysis. For each subgroup analysis, we calculate 12 impacts (four interventions times three outcomes) for each of two subgroups (for example, low and high achievers) and the difference in those 12 impacts between the two subgroups for a total of 36 comparisons. We adjust for those comparisons using the same adjustment based on the multivariate t-distribution described above.

APPENDIX H
ASSESSING ROBUSTNESS OF THE IMPACTS


H.3
This appendix describes the robustness of our impacts to variations in the benchmark model described in Appendix G and to additional issues that might influence our findings.
A. ROBUSTNESS OF THE BENCHMARK APPROACH
The benchmark approach reflects the methodological choices we made to calculate impacts. While we think these are the best methodological choices for this study, there are valid alternatives to many of these choices that could potentially alter our findings. In this section we assess the sensitivity of our findings to variations in our benchmark model. Specifically, we assess sensitivity to (1) the inclusion of covariates, (2) the approach to adjusting for clustering, (3) the use of nonresponse weights, and (4) the approach used to adjust for multiple comparisons.
1. Regression Adjustment
Without covariate adjustment, the statistically significant negative impacts reported in Chapter III are no longer statistically significant but are still negative (Table H.1). The loss of statistical significance is not surprising, given that regression adjustment for baseline covariates dramatically increased the precision of the impact estimates on this study (see Appendix G for details). However, unbiased impacts can be calculated without any covariate adjustment at all.
2. Clustering
Our findings are not sensitive to the method used to account for clustering. In the benchmark model, we accounted for clustering of students within schools when calculating standard errors using the SUDAAN computer program, which accounts for clustering using Taylor series linearization. An alternative approach, as described further in Appendix G, is to account for clustering using mixed effects modeling.
A comparison of the estimates generated by SUDAAN and HLM shows little difference (Table H.2). We find that the impacts and standard errors using these two approaches are very similar. Therefore, our findings would not have been substantively different if we had used HLM instead of SUDAAN.
3. Nonresponse Weights
The magnitude and statistical significance of our findings are not sensitive to the use of nonresponse weights (Table H.1). As described in Appendix G, we see no systematic differences in the characteristics of students with valid follow-up test scores between the control and treatment groups, but we do see an overall difference in the characteristics of students with and without follow-up test scores (those without follow-up test scores appear more disadvantaged). The lack of sensitivity to the use of nonresponse weights implies that (1) impacts are not substantially different for disadvantaged students and (2) estimated impacts would not have been different had we not used nonresponse weights.

H.4
TABLE H.1
SENSITIVITY OF IMPACT ESTIMATES TO ALTERNATIVE SPECIFICATIONS
Difference in Spring Test Scores Between Each of the Following
and the Control Group:
Project CRISS ReadAbout
Read for Real
Reading for
Knowledge
Combined Treatment
Group
Composite Test Scorea
Benchmark modelb
Impact -0.02 -0.05 -0.07 -0.12* -0.07* Effect Size -0.02 -0.06 -0.08 -0.14 -0.08 p-value 0.98 0.69 0.45 0.02 0.01
Model with no covariates Impact -0.05 -0.04 -0.15 -0.08 -0.08 Effect Size -0.06 -0.04 -0.16 -0.08 -0.09 p-value 0.89 0.94 0.16 0.65 0.06
Model with weights that adjust for random assignment probability but not nonresponse Impact -0.02 -0.05 -0.07 -0.12* -0.07* Effect Size -0.02 -0.06 -0.08 -0.14 -0.08 p-value 0.98 0.69 0.45 0.02 0.01
Alternative approaches to adjusting p-values for multiple comparisons Bonferroni adjusted p-value 1.00 1.00 0.63 0.02 0.01 Benjamini-Hochberg adjusted p-value 0.64 0.37 0.31 0.02 0.01
GRADE Score
Benchmark modelb
Impact -0.57 -0.98 -0.89 -1.56 -1.12* Effect Size -0.04 -0.07 -0.06 -0.11 -0.08 p-value 0.99 0.85 0.80 0.12 0.02
Model with no covariates Impact -0.77 -0.75 -1.79 -0.64 -1.05 Effect Size -0.06 -0.05 -0.13 -0.05 -0.08 p-value 1.00 1.00 0.73 1.00 0.33
Model with weights that adjust for random assignment probability but not nonresponse Impact -0.57 -0.98 -0.89 -1.56 -1.12* Effect Size -0.04 -0.07 -0.06 -0.11 -0.08 p-value 0.98 0.79 0.74 0.11 0.02
Alternative approaches to adjusting p-values for multiple comparisons Bonferroni adjusted p-value 1.00 1.00 1.00 0.14 0.02 Benjamini-Hochberg adjusted p-value 0.62 0.42 0.42 0.07 0.02
Social Studies Reading Comprehension Assessment Score
Benchmark modelb
Impact -0.89 -0.51 -1.86 -2.24 -1.44 Effect Size -0.03 -0.02 -0.06 -0.08 -0.05 p-value 1.00 1.00 0.96 0.79 0.49

Table H.1 (continued)
H.5
Difference in Spring Test Scores Between Each of the Following
and the Control Group:
Project CRISS ReadAbout
Read for Real
Reading for
Knowledge
Combined Treatment
Group
Model with no covariates Impact -2.78 -0.67 -4.65 -2.22 -2.39 Effect Size -0.09 -0.02 -0.16 -0.07 -0.08 p-value 0.98 1.00 0.34 0.95 0.29
Model with weights that adjust for random assignment probability but not nonresponse Impact -0.89 -0.51 -1.86 -2.24 -1.44 Effect Size -0.03 -0.02 -0.06 -0.08 -0.05 p-value 1.00 1.00 0.94 0.73 0.44
Alternative approaches to adjusting p-values for multiple comparisons Bonferroni adjusted p-value 1.00 1.00 1.00 1.00 0.61 Benjamini-Hochberg adjusted p-value 0.75 0.77 0.57 0.42 0.20
Science Reading Comprehension Assessment Score
Benchmark modelb
Impact 0.66 -0.96 -1.38 -5.78* -2.32 Effect Size 0.02 -0.03 -0.05 -0.21 -0.08 p-value 1.00 1.00 1.00 0.02 0.20
Model with no covariates Impact -1.64 -0.75 -4.61 -4.00 -2.68 Effect Size -0.06 -0.03 -0.17 -0.14 -0.10 p-value 1.00 1.00 0.36 0.56 0.16
Model with weights that adjust for random assignment probability but not nonresponse Impact 0.66 -0.96 -1.38 -5.78* -2.32 Effect Size 0.02 -0.03 -0.05 -0.21 -0.08 p-value 1.00 1.00 1.00 0.02 0.17
Alternative approaches to adjusting p-values for multiple comparisons Bonferroni adjusted p-value 1.00 1.00 1.00 0.02 0.21 Benjamini-Hochberg adjusted p-value 0.75 0.72 0.72 0.02 0.11
Source: Reading comprehension tests administered by study team.
aThe composite is based on the three tests presented in this table. Each test score is converted into a z-score by subtracting the mean and dividing by the standard deviation of the variable for students in the sample. The composite is the simple average of the three z-scores.
bThe “benchmark” model includes weights that adjust for nonresponse and random assignment probability and the following covariates: baseline GRADE score, baseline TOSCRF score, student ethnicity and race, student English language learner status, school location, teacher race, and district indicators.
*Statistically different at the .05 level. GRADE = Group Reading Assessment and Diagnostic Evaluation.

H.6
TABLE H.2
COMPARISON OF BENCHMARK AND HLM MODELS
Difference Between Each of the Following and the Control Group:
Control Group Mean
Project CRISS ReadAbout
Read for Real
Reading for Knowledge
Combined Treatment
Group
Composite Test Scorea Benchmark
Impact 0.02 -0.02 -0.05 -0.07 -0.12 -0.07 Std. Error (0.05) (0.05) (0.05) (0.04) (0.03)
HLM Impact -0.03 -0.05 -0.08 -0.12 -0.07 Std. Error (0.05) (0.05) (0.05) (0.05) (0.03)
GRADE Score Benchmark
Impact 100.81 -0.57 -0.98 -0.88 -1.55 -1.12 Std. Error (0.62) (0.72) (0.61) (0.60) (0.40)
HLM Impact -0.65 -0.98 -0.92 -1.54 -1.11 Std. Error (0.71) (0.68) (0.70) (0.68) (0.39)
Social Studies Reading Comprehension Assessment Score Benchmark
Impact 501.67 -0.89 -0.50 -1.86 -2.24 -1.44 Std. Error (2.23) (1.70) (1.72) (1.52) (1.12)
HLM Impact -0.85 -0.66 -2.29 -2.41 -1.57 Std. Error (1.97) (1.87) (1.96) (1.91) (1.11)
Science Reading Comprehension Assessment Score Benchmark
Impact 501.51 0.66 -0.96 -1.38 -5.78 -2.31 Std. Error (1.48) (1.53) (2.25) (1.79) (1.26)
HLM Impact 0.71 -1.03 -1.42 -5.70 -2.32 Std. Error (1.80) (1.72) (1.80) (1.75) (1.18)
Number of Schoolsb 21 17 17 16 18 68
Number of Studentsb 1,368 1,316 1,248 1,227 1,191 4,982 Source: Reading comprehension tests administered by study team. Note: For each outcome, the number reported in the column labeled “Control Group Mean” is the actual average
outcome for the control group, not a regression-adjusted mean. The numbers reported in the remaining columns are, by row, (1) the impact and (2) the standard error of the impact. The social studies and science reading comprehension assessments were developed by ETS. Regression-adjusted impacts were calculated taking into account the clustering of students within schools. Variables in this model include baseline GRADE score, baseline TOSCRF score, student ethnicity and race, student English language learner status, school location, teacher race, and district indicators.

Table H.2 (continued)
H.7
aThe composite is based on the three tests presented in this table. Each test score is converted into a z-score by subtracting the mean and dividing by the standard deviation of the variable for students in the sample. The composite is the simple average of the three z-scores.
bThe numbers in these rows refer to the schools and students participating in the study. The proportion of students in each experimental condition with follow-up test scores is reported in Appendix Table G.2.
ETS = Educational Testing Service. GRADE = Group Reading Assessment and Diagnostic Evaluation. TOSCRF = Test of Silent Contextual Reading Fluency.

H.8
4. Multiple Comparisons
The statistical significance of our findings is not sensitive to the technique used to adjust for multiple comparisons (Table H.1). We used two alternative approaches, one that is more conservative and one that is less conservative than our benchmark approach. The statistically significant negative impacts reported in Chapter III are still statistically significant even when using the more conservative Bonferroni adjustment. When using the less conservative Benjamini-Hochberg procedure, we do not see any newly statistically significant findings.
B. SENSITIVITY TO ADDITIONAL ISSUES
After completing our descriptive and impact analyses, we identified several additional issues to investigate through sensitivity analysis. Below we list these issues and the results of our sensitivity analyses.
Adding Teacher Age and Teacher Experience as Covariates
Adding teacher age and teacher experience as covariates did not change our findings (not shown in table). Teacher age and experience are not included as covariates in our benchmark model because they do not explain enough variation in follow-up test scores to increase the precision of our impact estimates. However, because we observed a statistically significant difference in teacher age between the treatment and control groups at baseline, we investigated whether adding these two covariates to our impact regressions for the full sample of students would change our findings. The statistically significant negative impacts remained negative and statistically significant, and no finding that previously was insignificant became statistically significant.
Estimating Impacts with Raw Test Scores
Using raw test scores instead of standardized scores reduces the statistical significance of some impacts (not shown in table). Calculating impacts on the raw GRADE score instead of the standardized score has no effect on statistical significance because the standardized GRADE score is just a linear transformation of the raw score. However, the ETS standardized scores are nonlinear transformations of the raw score. When calculating impacts on the raw ETS scores, we find that the p-value for the impact of Reading for Knowledge on the science comprehension score increases from 0.02 to 0.11 and that the magnitude of the point estimate falls to -0.17 standard deviations from -0.21 standard deviations. Reading for Knowledge still has a statistically significant, negative impact on the composite test score (the p-value rises from 0.02 to 0.04).

H.9
District-Specific Effects
We assessed the sensitivity of the negative effect of Reading for Knowledge on the ETS science comprehension test to individual school districts by recalculating the overall impact after dropping each district. That is, we calculated 10 impacts, each time dropping one of the 10 districts so that each impact included 9 districts. We found that the negative impact of Reading for Knowledge lost statistical significance after dropping the district with the most students in the study, but was otherwise robust to dropping individual districts from the analysis. Because we would expect to lose statistical precision when dropping a large number of students from the study, we do not believe this undermines the overall finding that Reading for Knowledge had a negative impact on the ETS science comprehension test score.
Students with Only Baseline and Follow-up Tests
Restricting the analysis sample to only students with both baseline and follow-up tests reduces the statistical significance of some findings. This is not surprising, as this restriction reduces the student sample size by nearly 20 percent, which limits the study’s power to detect impacts. With this restriction, the negative impact of Reading for Knowledge is no longer statistically significant (although the sign is still negative). However, the negative effect of the combined treatment group remains statistically significant, and this negative impact is clearly driven by Reading for Knowledge (Table H.3).
Imputing Missing Outcomes for English Language Learners
Some students were deemed ineligible for testing by field staff because of low English proficiency. If an intervention were to affect students’ eligibility for testing by improving their English ability, impacts could be biased. Across all five arms of the study, we found only 32 students who were deemed ineligible at followup because of this issue. To assess whether these students might be driving our impacts, we imputed their test scores to the lowest scores observed in the data. This imputation did not change the sign, magnitude, or statistical significance of any finding (not shown in table).
Interacting Treatment Status with Continuous Measures of Prior Achievement
The use of continuous subgroup indicators changed one of the two achievement subgroup findings. Our benchmark subgroup analyses compared impacts for students with above-median prior achievement to impacts for students with below-median prior achievement. (As described in Chapter III and in the next section, we also estimated several other variations based on different cutoffs to form the subgroups.) As an additional sensitivity test, we also estimated a model in which a continuous measure of prior achievement was interacted with treatment indicator variables. The results of this analysis are shown in Tables H.4 and H.5.

H.10
TABLE H.3
DIFFERENCES IN SPRING TEST SCORES BETWEEN TREATMENT AND CONTROL GROUPS, FOR STUDENTS WITH BASELINE AND FOLLOW-UP SCORES
Difference Between Each of the Following and the Control Group:
Control Group Mean
Project CRISS ReadAbout
Read for Real
Reading for Knowledge
Combined Treatment
Group
Composite Test Scorea Impact 0.02 -0.02 -0.05 -0.05 -0.10 -0.07* Effect Size -0.02 -0.06 -0.06 -0.11 -0.08 p-value 0.97 0.68 0.69 0.10 0.02 Number of Students with at Least One Baseline Score and One Follow-up Score 1,143 1,093 1,062 1,034 1,040 4,229
GRADE Score Impact 100.81 -0.50 -0.97 -0.66 -1.25 -1.01* Effect Size -0.04 -0.07 -0.05 -0.09 -0.07 p-value 1.00 0.86 0.98 0.39 0.04 Number of Students with Baseline and Follow-up GRADE Scores 1,141 1,091 1,058 1,025 1,034 4,208
Social Studies Reading Comprehension Assessment Score Impact 501.67 -1.38 -0.47 -1.29 -2.05 -1.44 Effect Size -0.05 -0.02 -0.04 -0.07 -0.05 p-value 1.00 1.00 1.00 0.90 0.46 Number of Students with at Least One Baseline Score and a Social Studies Reading Comprehension Assessment Scoreb 554 544 516 507 526 2,093
Science Reading Comprehension Assessment Score Impact 501.51 0.55 -1.08 -1.15 -4.96 -2.15 Effect Size 0.02 -0.04 -0.04 -0.18 -0.08 p-value 1.00 1.00 1.00 0.11 0.26 Number of Students with at Least One Baseline Score and a Science Reading Comprehension Assessment Scoreb 568 530 535 512 492 2,069
Number of Schoolsc 21 17 17 16 18 68
Number of Studentsc 1,368 1,316 1,248 1,227 1,191 4,982
Source: Reading comprehension tests administered by study team.

Table H.3 (continued)
H.11
Note: For each outcome, the number reported in the column labeled “Control Group Mean” is the actual average outcome for the control group, not a regression-adjusted mean. The numbers reported in the remaining columns are, by row, (1) the impact, (2) the effect size, and (3) the p-value of the impact. The social studies and science reading comprehension assessments were developed by ETS. Regression-adjusted impacts were calculated taking into account the clustering of students within schools. Variables in this model include baseline GRADE score, baseline TOSCRF score, student ethnicity and race, student English language learner status, school location, teacher race, and district indicators.
aThe composite is based on the three tests presented in this table. Each test score is converted into a z-score by subtracting the mean and dividing by the standard deviation of the variable for students in the sample. The composite is the simple average of the three z-scores.
bThese sample sizes are smaller than for the other tests because students were randomly assigned to take either the Social Studies or the Science Reading Comprehension Assessment, and no student took both.
cThe numbers in these rows refer to the schools and students participating in the study. *Statistically different at the .05 level. ETS = Educational Testing Service. GRADE = Group Reading Assessment and Diagnostic Evaluation. TOSCRF = Test of Silent Contextual Reading Fluency.

H.12
TABLE H.4
DIFFERENCES IN SPRING TEST SCORES BETWEEN TREATMENT AND CONTROL GROUPS, INTERACTING TREATMENT STATUS WITH STUDENT BASELINE FLUENCY
Difference Between Each of the Following and the Control Group:
Control Group Mean
Project CRISS ReadAbout
Read for Real
Reading for Knowledge
Combined Treatment
Group
Composite Test Scorea Impact 0.02 -0.02 -0.05 -0.07 -0.12* -0.07* Effect Size -0.02 -0.06 -0.08 -0.14 -0.08 p-value 1.00 0.88 0.69 0.03 0.02 Interaction Between Baseline TOSCRF and Treatment Indicator
Coefficient -0.03 -0.02 0.00 -0.00 -0.01 p-value 0.97 0.99 1.00 1.00 0.95
GRADE Score Impact 100.81 -0.53 -1.00 -0.88 -1.62 -1.12* Effect Size -0.04 -0.07 -0.06 -0.12 -0.08 p-value 1.00 0.96 0.95 0.16 0.04 Interaction Between Baseline TOSCRF and Treatment Indicator
Coefficient -0.05 -0.02 -0.00 0.05 0.01 p-value 1.00 1.00 1.00 1.00 1.00
Social Studies Reading Comprehension Assessment Score Impact 501.67 -0.90 -0.67 -1.93 -2.17 -1.43 Effect Size -0.03 -0.02 -0.07 -0.07 -0.05 p-value 1.00 1.00 1.00 0.95 0.74 Interaction Between Baseline TOSCRF and Treatment Indicator
Coefficient -0.32 -0.26 -0.17 -0.35 -0.27* p-value 0.37 0.44 0.98 0.42 0.05
Science Reading Comprehension Assessment Score Impact 501.51 0.60 -0.98 -1.33 -5.80 -2.30 Effect Size 0.02 -0.04 -0.05 -0.21 -0.08 p-value 1.00 1.00 1.00 0.05 0.37 Interaction Between Baseline TOSCRF and Treatment Indicator
Coefficient 0.13 0.09 0.20 0.11 0.12 p-value 1.00 1.00 1.00 1.00 0.95
Number of Schoolsb 21 17 17 16 18 68
Number of Studentsb 1,368 1,316 1,248 1,227 1,191 4,982
Source: Reading comprehension tests administered by study team.

Table H.4 (continued)
H.13
Note: For each outcome, the number reported in the column labeled “Control Group Mean” is the actual average outcome for the control group, not a regression-adjusted mean. The numbers reported in the remaining columns are, by row, (1) the impact, (2) the effect size, (3) the p-value of the impact, (4) the coefficient on the interaction between baseline TOSCRF and the treatment indicator, and (5) the p-value of that interaction. The social studies and science reading comprehension assessments were developed by ETS. Regression-adjusted impacts were calculated taking into account the clustering of students within schools. Variables in this model include baseline GRADE score, baseline TOSCRF score, student ethnicity and race, student English language learner status, school location, teacher race, and district indicators.
aThe composite is based on the three tests presented in this table. Each test score is converted into a z-score by subtracting the mean and dividing by the standard deviation of the variable for students in the sample. The composite is the simple average of the three z-scores.
bThe numbers in these rows refer to the schools and students participating in the study. *Statistically different at the .05 level. ETS = Educational Testing Service. GRADE = Group Reading Assessment and Diagnostic Evaluation. TOSCRF = Test of Silent Contextual Reading Fluency.

H.14
TABLE H.5
DIFFERENCES IN SPRING TEST SCORES BETWEEN TREATMENT AND CONTROL GROUPS, INTERACTING TREATMENT STATUS WITH STUDENT BASELINE COMPREHENSION
Difference Between Each of the Following and the Control Group:
Control Group Mean
Project CRISS ReadAbout
Read for Real
Reading for Knowledge
Combined Treatment
Group
Composite Test Scorea Impact 0.02 -0.02 -0.05 -0.06 -0.12* -0.07* Effect Size -0.03 -0.06 -0.07 -0.14 -0.08 p-value 1.00 0.89 0.70 0.04 0.02 Interaction Between Baseline GRADE and Treatment Indicator
Coefficient -0.00 -0.00 0.05 -0.01 0.01 p-value 1.00 1.00 0.58 1.00 0.86
GRADE Score Impact 100.81 -0.57 -0.99 -0.87 -1.56 -1.12* Effect Size -0.04 -0.07 -0.06 -0.11 -0.08 p-value 1.00 0.97 0.95 0.22 0.04 Interaction Between Baseline GRADE and Treatment Indicator
Coefficient 0.02 0.02 0.04 0.03 0.03 p-value 1.00 1.00 1.00 1.00 0.80
Social Studies Reading Comprehension Assessment Score Impact 501.67 -0.94 -0.52 -1.74 -2.17 -1.42 Effect Size -0.03 -0.02 -0.06 -0.07 -0.05 p-value 1.00 1.00 1.00 0.97 0.75 Interaction Between Baseline GRADE and Treatment Indicator
Coefficient -0.07 -0.15 0.07 -0.11 -0.06 p-value 1.00 0.95 1.00 1.00 0.96
Science Reading Comprehension Assessment Score Impact 501.51 0.66 -0.94 -1.28 -5.70* -2.32 Effect Size 0.02 -0.03 -0.05 -0.21 -0.08 p-value 1.00 1.00 1.00 0.05 0.35 Interaction Between Baseline GRADE and Treatment Indicator
Coefficient -0.03 0.07 0.12 -0.11 0.03 p-value 1.00 1.00 1.00 1.00 1.00
Number of Schoolsb 21 17 17 16 18 68
Number of Studentsb 1,368 1,316 1,248 1,227 1,191 4,982
Source: Reading comprehension tests administered by study team.
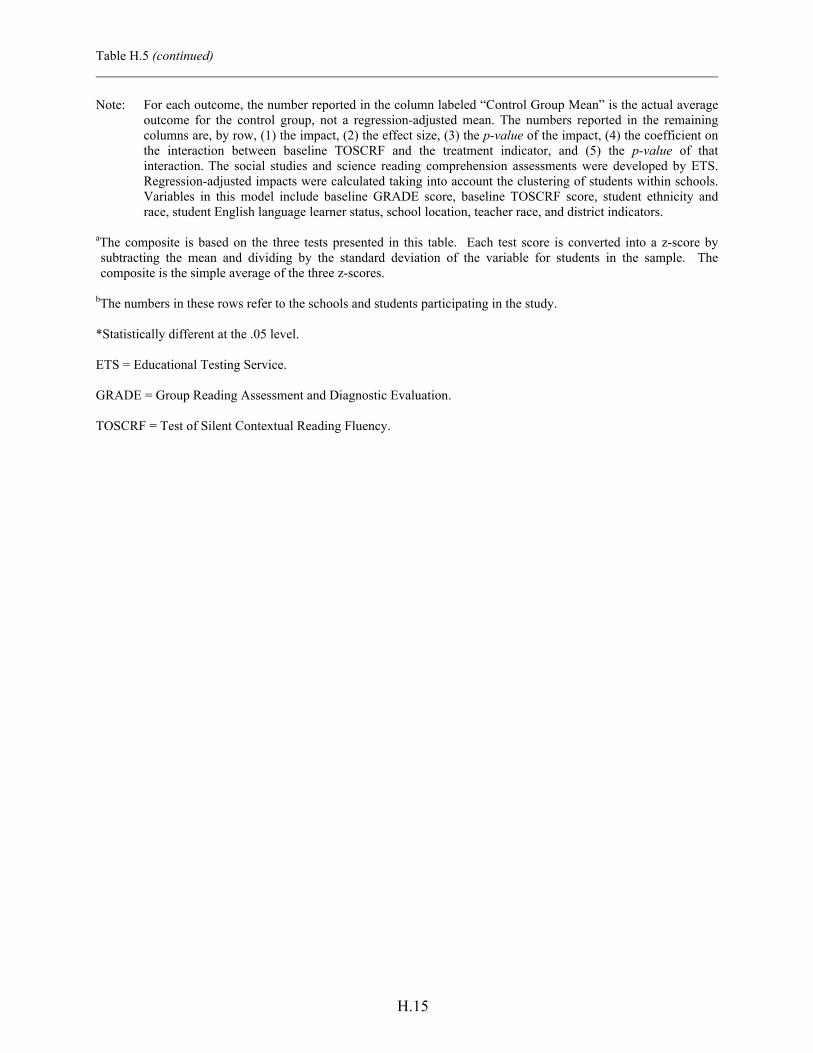
Table H.5 (continued)
H.15
Note: For each outcome, the number reported in the column labeled “Control Group Mean” is the actual average outcome for the control group, not a regression-adjusted mean. The numbers reported in the remaining columns are, by row, (1) the impact, (2) the effect size, (3) the p-value of the impact, (4) the coefficient on the interaction between baseline TOSCRF and the treatment indicator, and (5) the p-value of that interaction. The social studies and science reading comprehension assessments were developed by ETS. Regression-adjusted impacts were calculated taking into account the clustering of students within schools. Variables in this model include baseline GRADE score, baseline TOSCRF score, student ethnicity and race, student English language learner status, school location, teacher race, and district indicators.
aThe composite is based on the three tests presented in this table. Each test score is converted into a z-score by subtracting the mean and dividing by the standard deviation of the variable for students in the sample. The composite is the simple average of the three z-scores.
bThe numbers in these rows refer to the schools and students participating in the study. *Statistically different at the .05 level. ETS = Educational Testing Service. GRADE = Group Reading Assessment and Diagnostic Evaluation. TOSCRF = Test of Silent Contextual Reading Fluency.

H.16
We find one statistically significant interaction: for the combined treatment group, the impact on social studies reading comprehension appears more negative for students with higher baseline fluency. This finding is consistent with the fluency subgroup analysis reported in Chapter III, which also found a negative impact on social studies comprehension for high fluency students. The one finding that differs from what was presented in Chapter III is for subgroups formed by students’ baseline comprehension levels. In the benchmark models shown in Chapter III, we found a negative impact for students with comprehension levels in the bottom third of the sample. In the models shown in Table H.5, none of the interactions between the treatment indicator and baseline GRADE scores are statistically significant.
Defining Achievement Subgroups by Tertiles
We assessed the sensitivity of subgroup impacts to the way in which student achievement subgroups were formed. We formed student subgroups by dividing the sample at the median (as was done for other subgroups), by dividing the sample at the norm sample average, and by splitting the sample into the bottom, middle, and top third of the prior achievement distribution. For the combined treatment group, we found the following statistically significant findings:
• Comparing students above and below the sample median on the baseline fluency assessment, we found a statistically significant, negative effect on social studies comprehension scores for students that scored above the median at baseline (effect size: -0.14, see Table III.7).
• Comparing students above and below the norm sample average on the baseline fluency assessment, we found a statistically significant, negative effect on social studies comprehension scores for above-average students (effect size: -0.23, see Table III.6).
• Comparing the top and the middle thirds of the sample on the baseline fluency assessment, we found a statistically significant, negative effect on social studies comprehension scores for students with baseline fluency in the top third of the distribution (effect size: -0.15, see Table III.10).77
• Comparing the top and bottom (and middle and bottom) thirds of the sample on the baseline comprehension assessment, we found a statistically significant, negative effect across treatments on composite test scores and GRADE scores of students with baseline comprehension in the bottom third of the sample (effect sizes: -0.14, -0.15, -0.09, and -0.08, see Tables III.13 and III.14).78
77When we compare the bottom and top third of the sample in terms of students’ baseline fluency levels, the
combined treatment effect on the social studies comprehension scores of students in the top third is negative, but it is no longer statistically significant (p-value: 0.33, Table III.8).
78A similar pattern was found in the models split at the sample median and national norm sample average, although those findings were not statistically significant (Tables III.11 and III.12, p-values: 0.13, 0.15, 0.13, and 0.15).

H.17
Impacts for Novice Teachers
Teacher experience subgroup results were sensitive to the subgroup cutoff used. We assessed the sensitivity of impacts to the way in which we defined the teacher experience subgroups. In one approach, we used 10 years of experience (the study’s median) as the cutoff. In the other, we compared the effects of the interventions on test scores for students taught by teachers with less than five years of experience and students taught by teachers with five or more years of experience. In the analyses based on the 10-year cutoff, we found a negative effect of Reading for Knowledge on science comprehension scores for teachers with more than 10 years of experience (effect size: -0.36, see Table III.17). In the analyses based on the five-year cutoff, we found—for the combined treatment group—a negative impact on the composite scores of students taught by teachers with more than five years of experience (effect size: -0.09, Table III.18).
Sensitivity of Teacher Practice Scales
We assessed the sensitivity of the benchmark approach to the way in which we constructed the teacher practice scales. As noted in Chapter II, the benchmark approach to forming teacher practice scales used averages of behavior tallies across classroom observation intervals for each teacher and item. As a sensitivity test, we also constructed the scales using the same items for each of the scales, but using sums of behavior tallies across intervals. Findings based on sums (shown in Table H.6) were similar to those based on averages (shown in Table II.13), with statistically significant, negative effects observed for Project CRISS and the combined treatment group on the Traditional Interaction scale (effect sizes: -0.70 and -0.51).
As an additional sensitivity test, we considered a different set of teacher instructional
practices scales. These scales were constructed by grouping all items pertaining to teaching comprehension to create a Teaching Comprehension scale, and all items regarding teaching vocabulary to create a Teaching Vocabulary scale. These scales were also created in two ways: using sums and using averages of tallies from the classroom observations.
On the Teaching Comprehension scale, there were no statistically significant differences between treatment and control group teachers’ scores (Table H.7). We found statistically significant differences on the Teaching Vocabulary scale, which showed that teachers in the treatment group were less likely to engage in vocabulary-related teaching practices (Table H.7, effect sizes: -0.50, -0.55, -0.59, -0.72, -0.89). This pattern of findings is consistent with the pattern observed for the Traditional Interaction and Reading Strategy Guidance scales shown in Chapter II. In particular, there were no statistically significant impacts on the Reading Strategy Guidance scale, which is focused on comprehension practices, and there were statistically significant, negative impacts on the Traditional Interaction scale, which—based on an examination of impacts on individual items that are part of that scale—appeared to be driven by differences in vocabulary-related teaching practices.

H.18
TABLE H.6
DIFFERENCE IN SPRING CLASSROOM PRACTICES BETWEEN TREATMENT AND CONTROL GROUP TEACHERS, FOR SCALES BASED ON SUMS OF TALLIES ACROSS OBSERVATION INTERVALS
Difference Between Each of the Following and the Control Group:
Control Group Mean
Project CRISS ReadAbout
Read for Real
Reading for
Knowledge
Combined Treatment
Group
Traditional Interaction Scale Impact 502.83 -5.08* -3.78 -3.75 -2.46 -3.70* Effect size -0.70 -0.52 -0.52 -0.34 -0.51 p-value 0.02 0.40 0.07 0.52 0.01
Reading Strategy Guidance Scale Impact 498.24 0.20 1.53 1.24 1.20 1.09 Effect size 0.03 0.20 0.16 0.16 0.14 p-value 1.00 0.99 0.99 1.00 0.84
Classroom Management Scale Impact 502.54 0.30 -9.36 -5.87 30.61 4.23 Effect size 0.00 -0.07 -0.05 0.24 0.03 p-value 1.00 1.00 1.00 0.90 1.00
Number of Teachers 59 52 50 54 53 209
Source: Classroom Observations. Note: The scales presented in this table were constructed to capture the frequency of the behaviors in each
instructional practice domain shown above, using sums of tallies across observation intervals for each teacher and item. For each scale, the number reported in the column labeled “Control Group Mean” is the actual average value of the scale for the control group, not a regression-adjusted mean. The numbers reported in the remaining columns are, by row, (1) the impact (difference in means between treatment and control group), (2) the effect size, and (3) the p-value of the impact. Regression adjusted impacts were calculated taking into account the clustering of teachers within schools. The p-values presented in this table were computed taking into account the presence of four treatment groups and are adjusted for estimating impacts on three scales. Variables in this model include Baseline GRADE Score, Baseline TOSCRF Score, student ethnicity and race, student Limited English Proficiency (LEP) status, school location, teacher ethnicity and race, and district indicators. Smaller scale values represent lower levels of behaviors in the instructional practice domain, while larger values represent higher values of the behaviors.
*Statistically different at the .05 level.

H.19
TABLE H.7
DIFFERENCES IN SPRING CLASSROOM PRACTICES BETWEEN TREATMENT AND CONTROL GROUP TEACHERS, FOR TEACHING COMPREHENSION AND TEACHING VOCABULARY SCALES
Difference Between Each of the Following and the Control Group:
Control Group Mean
Project CRISS ReadAbout
Read for Real
Reading for
Knowledge
Combined Treatment
Group
Teaching Comprehension Scale, Based on Averages of Tallies Impact 500.11 -0.73 -1.04 -0.03 -0.33 -0.56 Effect Size -0.20 -0.28 -0.01 -0.09 -0.15 p-value 0.70 0.27 1.00 1.00 0.45
Teaching Comprehension Scale, Based on Sums of Tallies Impact 501.01 -1.94 -1.32 -0.41 -0.77 -1.10 Effect Size -0.34 -0.23 -0.07 -0.13 -0.19 p-value 0.69 0.95 1.00 1.00 0.60
Teaching Vocabulary Scale, Based on Averages of Tallies Impact 503.42 -6.83* -4.53 -4.53 -3.30 -4.70* Effect Size -0.72 -0.48 -0.48 -0.35 -0.50 p-value 0.01 0.38 0.12 0.60 0.01
Teaching Vocabulary Scale, Based On Sums Of Tallies Impact 504.57 -8.34* -5.02 -5.50* -2.29 -5.11* Effect Size -0.89 -0.54 -0.59 -0.24 -0.55 p-value 0.00 0.38 0.02 0.93 0.01
Number of Teachers 59 52 50 54 53 209
Source: Classroom Observations.
Note: The scales presented in this table were constructed to capture the frequency of the behaviors in each instructional practice domain shown above. For each scale, the number reported in the column labeled “Control Group Mean” is the actual average value of the scale for the control group, not a regression-adjusted mean. The numbers reported in the remaining columns are, by row, (1) the impact (difference in means between treatment and control group), (2) the effect size, and (3) the p-value of the impact. Regression adjusted impacts were calculated taking into account the clustering of teachers within schools. The p-values presented in this table were computed taking into account the presence of four treatment groups and are adjusted for estimating impacts on four scales. Variables in this model include Baseline GRADE Score, Baseline TOSCRF Score, student ethnicity and race, student Limited English Proficiency (LEP) status, school location, teacher ethnicity and race, and district indicators. Smaller scale values represent lower levels of behaviors in the instructional practice domain, while larger values represent higher values of the behaviors.
*Statistically different at the .05 level.

APPENDIX I
KEY DESCRIPTIVE STATISTICS FOR CLASSROOM OBSERVATION AND FIDELITY DATA


I.3
TABLE I.1
DESCRIPTIVE STATISTICS FOR EXPOSITORY READING COMPREHENSION CLASSROOM OBSERVATION INSTRUMENT ITEMS, BASED ON THE AVERAGE NUMBER OF TIMES EACH PRACTICE WAS OBSERVED DURING
THE 10-MINUTE OBSERVATION INTERVALS
Mean Standard Deviation
Reliability, All
Observation Pairs
Reliability, Excluding
Observation Pairs with
Zero Tallies
Part I, Comprehension
Activates prior knowledge and/or previews text before reading Teacher models 0.01 0.04 .949 .925 Teacher explains, reviews, provides examples and elaborations 0.57 0.59 .937 .896 Students practice 1.01 1.09 .982 .963
Explicit comprehension instruction that teaches students about text structure
Teacher models 0.00 0.02 1.00a n.a.bTeacher explains, reviews, provides examples and elaborations 0.24 0.43 .974 .964 Students practice 0.38 0.78 .978 .967
Explicit comprehension instruction that teaches students how to use comprehension strategies
Teacher models 0.02 0.06 .021 .973 Teacher explains, reviews, provides examples and elaborations 1.17 1.43 .978 .970 Students practice 1.70 1.79 .981 .974
Explicit comprehension instruction that teaches students how to generate questions
Teacher models 0.00 0.02 .798 1.00 Teacher explains, reviews, provides examples and elaborations 0.25 0.36 .790 .677 Students practice 0.43 0.56 .916 .893
Explicit comprehension instruction that teaches text features to interpret text
Teacher models 0.00 0.02 .778 1.00 Teacher explains, reviews, provides examples and elaborations 0.20 0.30 .943 .914 Students practice 0.25 0.38 .870 .806
Teacher asks students to justify their responses 0.24 0.32 .656 .504 Teacher asks questions based on material in the text that are beyond the
literal level 0.96 1.07 .941 .922 Teacher elaborates, clarifies, or links concepts during and after text
reading 1.26 1.20 .941 .929
Part I, Vocabulary Teacher provides an explanation and/or a definition or asks a student to
read a definition 0.67 0.60 .905 .879 Teacher provides examples, contrasting examples, multiple meanings,
immediate elaborations to students’ responses 0.85 0.81 .971 .961 Teacher uses visuals/pictures, gestures related to word meaning, facial
expressions, or demonstrations to discuss/demonstrate word meanings 0.23 0.46 .922 .881 Teacher teaches word learning strategies using context clues, word parts,
root meaning 0.10 0.21 .970 .969 Students do or are asked to do something that requires knowledge of
words 1.34 1.22 .967 .963 Students are given an opportunity to apply word learning strategies using
context clues, word parts, and root meaning 0.12 0.33 .938 .918
Part I, Grouping Arrangements and Text Reading Teacher is working with:
Whole class (>75% of class) 0.82 0.23 .924 n.a. Large group (> 6 students, < 75% of class) 0.03 0.11 .962 n.a. Small groups (3-6 students) 0.20 0.25 .919 n.a. Pairs 0.10 0.18 .852 n.a. An individual 0.05 0.10 .924 n.a. No direct student contact 0.02 0.06 .528 n.a.

Table I.1 (continued)
I.4
Mean Standard Deviation
Reliability, All
Observation Pairs
Reliability, Excluding
Observation Pairs with
Zero Tallies
Text Reading (applies to reading connected text) Supported oral reading (includes choral and round robin reading) 0.36 0.32 .908 n.a. Independent silent reading 0.28 0.29 .956 n.a. Independent or buddy oral reading 0.33 0.32 .929 n.a. Teacher reads aloud 0.16 0.23 .737 n.a. Teacher reads aloud with students following along silently 0.15 0.22 .865 n.a. Text not present 0.05 0.13 .814 n.a. Text present but not being read 0.23 0.23 .788 n.a.
Part II, Overall Effectiveness of Instruction Gave inaccurate and/or confusing explanations or feedback 0.04 0.17 .334 n.a. Missed opportunity to correct or address error 0.06 0.22 1.00 n.a. Provided opportunities for most students to participate actively during
teacher-led instruction 0.86 0.32 .844 n.a. Paced instruction so that the length of the comprehension or vocabulary
activities was appropriate for this age group 0.89 0.28 .813 n.a. Taught using outlining and/or note taking 0.31 0.41 .797 n.a. Used graphic organizers 0.30 0.41 .888 n.a. Kept students thinking for two or more seconds before calling on a
student to respond to a complex question 0.61 0.46 .711 n.a. Gave independent/pairs/small-group practice in answering
comprehension questions or applying comprehension strategy(ies) with expected written product 0.56 0.45 .769 n.a.
Used writing activities in response to reading (does not include fill-in-the-blank or one-word answers) 0.40 0.45 .874 n.a.
Part II, Overall Management/Responsiveness to Students Teacher maximized the amount of time available for instruction 3.25 0.83 .861 n.a. Teacher managed student behavior effectively in order to avoid
disruptions and provide productive learning environments 3.41 0.77 .863 n.a. Teacher redirected discussion if a student response was leading the group
off topic/focus 3.31 0.77 .602 n.a.
Part II, Overall Student Engagement During Observation Student engagement during the first half of the observation session 2.65 0.54 .842 n.a. Student engagement during the remainder of the observation session 2.59 0.59 .873 n.a. Source: Classroom observations. Note: Reliability was calculated using Pearson correlation coefficients. The first reliability column includes all nonmissing
paired observations, while the second column removes from the calculations observer pairs that reported zero tallies on that specific item (note that the second reliability column is relevant only for the vocabulary and comprehension sections of Part I where observers recorded tallies of the number of times teachers engaged in each behavior so n.a. (not applicable) is shown for all of the other items). For Part I vocabulary and comprehension items, the means, standard deviations, and reliability estimates shown are for the average of the classroom tallies across all the observed 10-minute intervals (up to 10 intervals per teacher).
aThis reliability estimate of 1.0 seems to be inconsistent with the reported standard deviation, which is greater than zero. This occurs because only a subset of observations can be used for the reliability estimates, while the full set of observations are used in calculating the means and standard deviations. For this item, all of the observations used for the reliability calculations had zero tallies, which corresponds to a reliability estimate equal to 1.0.
bInter-rater reliability could not be calculated as there were no remaining observer pairs after dropping the pairs with zero tallies. n.a. = not applicable.

I.5
TABLE I.2
DESCRIPTIVE STATISTICS FOR PROJECT CRISS FIDELITY OBSERVATION ITEMS
Percentage
Standard Deviation
Teachers observed to have done the following during the time when their classes were observed:a Provide instruction or lead activities to generate background knowledge about a topic
or concept before students read about it 64.81 48.20 Help students set goals and determine a purpose before beginning to read 61.11 49.21 Have students read a written text 81.48 39.21 Lead students during and/or after reading in transforming information activities (e.g.
graphic organizer, guided discussion) 79.63 40.65 Include informal or formal writing in the transforming activities (including note-
taking) 74.07 44.23 Use the transforming activities to teach the content of the lesson 74.07 44.23 Discuss or reflect on students’ metacognitive processes during the transforming
activities 44.44 50.16 Lead the whole class in a reflection discussion at the end of the lesson using questions
such as: —b —b A. Metacognition: How did you evaluate your comprehension? B. Background knowledge: Did I assist you in thinking about what you already
knew? C. Purpose setting: Did you have clear purposes? D. Active involvement: How were you actively engaged? E. Discussion: How did discussion clarify your thinking? F. Writing: How did you use writing to help you learn? G. Transformation: What were the different ways you transformed information?
How did this help you? H. Teacher modeling: Did I do enough modeling?
Number of Teachers 54
Source: Classroom observations.
aFidelity observations were conducted only for teachers implementing the assigned curricula; however, all teachers are included in these calculations. The percentage of teachers who reported using Project CRISS is 90.74 percent. We assumed that teachers who were not implementing the curricula did not engage in the activities listed in this table.
bValue suppressed to protect teacher confidentiality.

I.6
TABLE I.3
DESCRIPTIVE STATISTICS FOR READ FOR REAL FIDELITY OBSERVATION ITEMS
Learn Observation Days Practice Observation Days
Percentage
Standard Deviation Percentage
Standard Deviation
Teachers observed to have done the following during the time when their classes were observed:a Before Reading
Reads or asks a student to read the explanation of the Before Reading focus strategy 50.00 51.18 51.42 50.71
Discusses the strategy with students 40.91 50.32 51.42 50.71 Reads or asks a student to read the information in the
My Thinking box 50.00 51.18 n.a. n.a. Asks students to apply the strategy 40.91 50.32 54.29 50.54 Discusses students’ comments n.a. n.a. 45.71 50.54
During Reading Reads or asks a student to read the explanation of the
During Reading focus strategy 54.55 50.96 45.71 50.54 Discusses the strategy with the students 59.09 50.32 n.a. n.a. Reads or asks a student to read the information in the
My Thinking box (notes from the reading partner) 54.55 50.96 40.00 49.71 Asks students to share their thinking about the strategy 54.55 50.96 n.a. n.a. Reminds students to write notes about the strategy n.a. n.a. 34.29 48.16 Stops and addresses the My Thinking notes at the “red
strategy buttons” 59.09 50.32 65.71 48.16 Reads and/or asks students to read the selection 63.64 49.24 65.71 48.16
After Readingb Reads or asks a student to read the After Reading focus
strategy 31.82 47.67 22.86 42.60 Discusses or asks questions about the strategy 22.73 42.89 20.00 40.58 Reads or asks a student to read the information in the
My Thinking box 18.18 39.48 n.a. n.a. Gives a written assignment highlighting the After
Reading focus strategy n.a. n.a. 14.29 35.50 Calls on students to implement the After Reading focus
strategy 13.64 35.13 n.a. n.a. Comprehension
Administers the open book comprehension test —c —c —c —c Corrects tests with the class —c —c —c —c Discusses responses —c —c —c —c
Organizing Information Reads or asks a student to read the information from
the reading partner 18.18 39.48 n.a. n.a. Discusses the graphic organizer 27.27 45.58 n.a. n.a. Asks students to complete graphic organizer n.a. n.a. 11.43 32.28
Writing for Comprehension Reads or asks a student to read the information from
the reading partner 13.64 35.13 n.a. n.a. Reads or asks a student to read the summary 18.18 39.48 n.a. n.a. Asks students to write a summary based on their
completed graphic organizer n.a. n.a. —c 16.90 Identifies how the paragraphs and sentences in the
summary correspond to the information on the graphic organizer 13.64 35.13 n.a. n.a.

Table I.3 (continued)
I.7
Learn Observation Days Practice Observation Days
Percentage
Standard Deviation Percentage
Standard Deviation
Discusses the Three Parts of a Summary Introduction 18.18 39.48 n.a. n.a. Body 18.18 39.48 n.a. n.a. Conclusion 18.18 39.48 n.a. n.a.
Sample Size 22 35
Source: Classroom observations.
aFidelity observations were conducted only for teachers implementing the assigned curricula; however, all teachers are included in these calculations. The percentage of teachers who reported using Read for Real is 80.70 percent. We assumed that teachers who were not implementing the curricula did not engage in the activities listed in this table.
bThe vocabulary and fluency items are not included in the table because developers noted they were not essential for implementation of the Read for Real intervention.
cValue suppressed to protect teacher confidentiality. n.a. = not applicable.

I.8
TABLE I.4
DESCRIPTIVE STATISTICS FOR READABOUT FIDELITY OBSERVATION ITEMS
Percentage Standard Deviation
Teachers observed to have done the following during the time when their classes were observed:a Used the ReadAbout materials 79.25 40.94 Computer workstation used 79.25 40.94 Independent workstation used 50.94 49.99 Provided direction instruction (explain and/or model) on the comprehension or
vocabulary strategy or skill 73.58 44.51 Provided opportunities for students to apply the comprehension or vocabulary
skill (guided practice) 77.36 41.85 Provided students instruction on the selected 6+1 Writing Trait 0.00 0.00 Provided opportunities to apply the 6+1 Writing Trait Model 0.00 0.00
Sample Size 53
Source: Classroom observations.
aFidelity observations were conducted only for teachers implementing the assigned curricula, however, all teachers are included in these calculations. The percentage of teachers who reported using ReadAbout is 86.79 percent. We assumed that teachers who were not implementing the curricula did not engage in the activities listed in this table.

I.9
TABLE I.5
DESCRIPTIVE STATISTICS FOR FIDELITY OBSERVATION ITEMS FOR READING FOR KNOWLEDGE DIRECT INSTRUCTION OBSERVATION DAYS
Percentage
Standard Deviation
Teachers observed to have done the following during the time when their classes were observed:a Post the reading goal 38.09 50.32 Present the reading goal 57.14 50.32 Present the cooperative learning goal 38.09 50.32 Ask students to review vocabulary or provide practice and instruction
(Exception: This is not done on the first day of a new unit.) —b —b Build background knowledge about the topic of text or about a
skill/strategy 66.67 49.24 Explain a skill/strategy or remind students of a skill/strategy recently
learned 71.42 47.67 Read the text aloud and (1) think aloud or model a skill/strategy or (2) ask
the students to apply a skill/strategy 52.38 51.18 Follow the recommended pacing for the lesson 57.14 50.96 Award cooperation and/or improvement points during lesson 52.38 51.18
Sample Size 21
Source: Classroom observations. aFidelity observations were conducted only for teachers implementing the assigned curricula; however, all teachers are included in these calculations. The percentage of teachers who reported using Reading for Knowledge is 83.33 percent. We assumed that teachers who were not implementing the curricula did not engage in the activities listed in this table.
bValue suppressed to protect teacher confidentiality.

I.10
TABLE I.6
DESCRIPTIVE STATISTICS FOR FIDELITY OBSERVATION ITEMS FOR READING FOR KNOWLEDGE COOPERATIVE GROUPS OBSERVATION DAYS
Percentage
Standard Deviation
Teachers observed to have done the following during the time when their classes were observed:a Post the reading goal 60.61 49.90 Present the reading goal 87.88 33.60 Present the cooperative learning goal 66.67 48.26 Ask students to review vocabulary or provide practice and instruction
(Exception: This is not done on the first day of a new unit.) 54.55 50.40 Use a whole group or partner activity to discuss key points about the day’s
skill/strategy 81.82 39.66 Provide feedback and prompts to partner pairs during partner reading 81.82 39.66 Chart individual students’ progress on the setting goals and charting progress
forms during partner reading 27.27 45.68 Review routines for Team Talk discussion 51.52 50.70 Read aloud Team Talk questions 60.61 49.90 Circulate within the classroom and monitor team discussions and provide
prompts 78.79 42.00 Ask team members to share with the class their response and reasoning to
Team Talk questions 75.76 43.99 Follow the recommended pacing for the lesson 54.55 50.40 Award cooperation and/or improvement points during lesson 60.61 49.19
Sample Size 33
Source: Classroom observations.
aFidelity observations were conducted only for teachers implementing the assigned curricula; however, all teachers are included in these calculations. The percentage of teachers who reported using Reading for Knowledge is 83.33 percent. We assumed that teachers who were not implementing the curricula did not engage in the activities listed in this table.

APPENDIX J
STUDY INSTRUMENTS


OMB No.: 1850-0812 Expiration Date: 03/31/2009
Prepared by Mathematica Policy Research, Inc. J-3 Preliminary School Information Form
PRELIMINARY SCHOOL INFORMATION FORM National Evaluation of Reading Comprehension Programs
School District Principal Person completing form Phone number
1. How many students are enrolled: a. In this school? ........................................................................................ ________ Total enrollment
b. In the fifth grade? ............................................................................ ________ Fifth-grade students
2. How many fifth-grade classes do you have? ......................................... ________ Fifth-grade classes
3. What percentage of your school’s students are: a. Eligible for the federally funded free or reduced-price lunch program?____________ % of students
b. Classified as limited English proficient (LEP)? .......................... ____________% of students
4. How many students enrolled in this school are: a. Hispanic or Latino? ................................................................................... ___________ Students
b. Not Hispanic or Latino? ............................................................................. ___________ Students
5. How many students enrolled in this school are (please select one or more categories for each
student): a. American Indian or Alaska Native? ........................................................... ___________ Students
b. Asian? ....................................................................................................... ___________ Students
c. Black or African American? ....................................................................... ___________ Students
d. Native Hawaiian or other Pacific Islander? ............................................... ___________ Students
e. White? .................................................................................................................... ___________ Students
6. Did your school participate in Reading First in the 2005-2006 school year? ........... 1 Yes 0 No
Please complete the other side.
According to the Paperwork Reduction Act of 1995, no persons are required to respond to a collection of information unless it displays a valid OMB control number. The valid OMB control number for this information collection is 1850-0812. The time required to complete this information collection is estimated to average 20 minutes per response, including the time to review instructions, search existing data resources, gather the data needed, and complete and review the information collected. If you have any comments concerning the accuracy of the time estimate(s) or suggestions for improving this form, please write to: U.S. Department of Education, Washington, D.C. 20202-4651. If you have comments or concerns regarding the status of your individual submission of this form, write directly to: U.S. Department of Education, Planning and Evaluation Services, Washington, D.C. 20208-5651.

OMB No.: 1850-0812 Expiration Date: 03/31/2009
Prepared by Mathematica Policy Research, Inc. J-4 Preliminary School Information Form
7. What resources does your school use for its fifth-grade reading curriculum? (Please specify resources for all components of the reading curriculum, including reading comprehension.)
Core Curriculum Name Publisher
Textbook .............................................
Basal reader series .............................
Special program ..................................
Supplemental Curriculum Name Publisher
Specify topic (e.g., phonics):
Specify topic (e.g., phonics):
8. Please complete the table below for the most current average reading and math standardized test scores for this school’s fourth- and fifth-grade students.
Grade Level Test Publisher
Month/ Year
Reading Math Standard
Score* Nat’l
Percentile Standard
Score* Nat’l
Percentile4th
4th
5th
5th
*If standard scores are not available, check here if reporting: 1 Scaled Scores 2 Raw Scores
1 Scaled Scores 2 Raw Scores
9. Did your school make Adequate Yearly Progress (AYP) in the 2005-2006 school year in the following areas:
a. Reading/language arts ........................................................................................ 1 Yes 0 No
b. Mathematics ....................................................................................................... 1 Yes 0 No
c. Attendance rate .................................................................................................. 1 Yes 0 No
10. Did your school make Adequate Yearly Progress (AYP) in the 2004-2005 school year in the
following areas:
a. Reading/language arts ........................................................................................ 1 Yes 0 No
b. Mathematics ....................................................................................................... 1 Yes 0 No
c. Attendance rate .................................................................................................. 1 Yes 0 No
Please return this form to Mathematica, by faxing it to 202-863-1763, attention Melissa Dugger, or by emailing it to [email protected]. Thank you very much.

OMB No.: 1850-0812 Expiration Date: 03/31/2009
Prepared by Mathematica Policy Research, Inc. J-5 School Information Form (2006-2007)
SCHOOL INFORMATION FORM (2006-2007) National Evaluation of Reading Comprehension Programs
INSERT SCHOOL LABEL HERE
1. For what grade levels does this school offer instruction? (CHECK ALL THAT APPLY) 1 Prekindergarten 5 3rd grade 9 7th grade 2 Kindergarten 6 4th grade 10 8th grade 3 1st grade
7 5th grade 11 Other (specify): 4 2nd grade 8 6th grade 12 Ungraded (including ungraded special ed. students)
2. What was the total number of students enrolled in this school around the first of October 2006? ......................................... _________ Students enrolled
3. How many students enrolled in this school are: a. Hispanic or Latino? ......................................................................................... _____________ Students
b. Not Hispanic or Latino? .................................................................................. _____________ Students
4. How many students enrolled in this school are: (PLEASE SELECT ONE OR MORE CATEGORIES FOR EACH STUDENT) a. American Indian or Alaska Native? ................................................................ _____________ Students
b. Asian? ............................................................................................................ _____________ Students
c. Black or African American? ............................................................................ _____________ Students
d. Native Hawaiian or other Pacific Islander? ..................................................... _____________ Students
e. White? .............................................................................................................. _____________ Students
5. What percentage of students in the 2006-2007 academic year are: a. Eligible for the federally funded free or reduced-price lunch program? ....... __________% of students b. Classified as limited English proficient (LEP)? ........................................... __________% of students
6. How many fifth-grade students were enrolled in this school around the first of October 2006? ....................................... ___________ Fifth-grade students
7. How many fifth-grade classes do you have? ................................................ ________ Fifth-grade classes Please complete the other side. According to the Paperwork Reduction Act of 1995, no persons are required to respond to a collection of information unless it
displays a valid OMB control number. The valid OMB control number for this information collection is 1850-0812. The time required to complete this information collection is estimated to average 20 minutes per response, including the time to review instructions, search existing data resources, gather the data needed, and complete and review the information collected. If you have any comments concerning the accuracy of the time estimate(s) or suggestions for improving this form, please write to: U.S. Department of Education, Washington, D.C. 20202-4651. If you have comments or concerns regarding the status of your individual submission of this form, write directly to: U.S. Department of Education, Planning and Evaluation Services, Washington, D.C. 20208-5651.
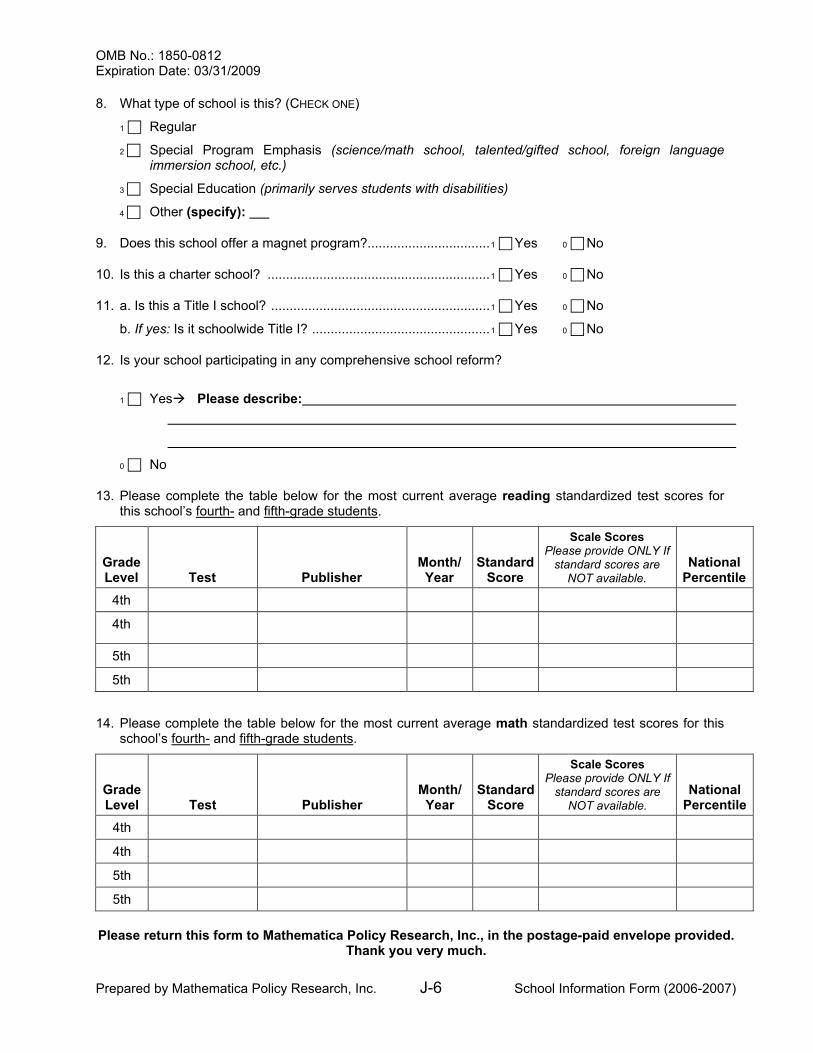
OMB No.: 1850-0812 Expiration Date: 03/31/2009
Prepared by Mathematica Policy Research, Inc. J-6 School Information Form (2006-2007)
8. What type of school is this? (CHECK ONE)
1 Regular
2 Special Program Emphasis (science/math school, talented/gifted school, foreign language immersion school, etc.)
3 Special Education (primarily serves students with disabilities) 4 Other (specify):
9. Does this school offer a magnet program? ................................. 1 Yes 0 No
10. Is this a charter school? ............................................................ 1 Yes 0 No
11. a. Is this a Title I school? ........................................................... 1 Yes 0 No
b. If yes: Is it schoolwide Title I? ................................................ 1 Yes 0 No
12. Is your school participating in any comprehensive school reform?
1 Yes Please describe:
0 No
13. Please complete the table below for the most current average reading standardized test scores for this school’s fourth- and fifth-grade students.
Grade Level Test Publisher
Month/ Year
Standard Score
Scale Scores Please provide ONLY If
standard scores are NOT available.
National Percentile
4th
4th
5th
5th
14. Please complete the table below for the most current average math standardized test scores for this school’s fourth- and fifth-grade students.
Grade Level Test Publisher
Month/ Year
Standard Score
Scale Scores Please provide ONLY If
standard scores are NOT available.
National Percentile
4th
4th
5th
5th
Please return this form to Mathematica Policy Research, Inc., in the postage-paid envelope provided. Thank you very much.

OMB No.: 1850-0812 Expiration Date: 03/31/2009
Prepared by Mathematica Policy Research, Inc. J-7 School Information Form (2006-2007)
STUDENT RECORDS FORM (2006-07) NATIONAL EVALUATION OF READING COMPREHENSION PROGRAMS
1. What is this student’s date of birth? _________ / _______ /_______
MONTH DAY YEAR
2. Is this student male or female? 1 Male 2 Female
3. What is the student’s ethnicity? 1 Hispanic or Latino 0 Not Hispanic or Latino 9 Don’t know
4. What is this student’s race? 1 American Indian/Alaska Native (PLEASE SELECT ONE OR MORE) 2 Asian
3 Black or African American 4 Native Hawaiian or other Pacific Islander 5 White 9 Don’t know
5. How many days was this student absent during the 2006-07 school year? (WRITE “0” IF NO ABSENCES) a. ________ Total days absent in the 2006-07 school year b. ________ Unexcused days absent in the 2006-07 school year (WRITE “NA” IF NOT AVAILABLE)
6. Is this student… (CHECK ONE IN EACH ROW)
YES NO a. Classified as limited English proficient (LEP)? ............................................. 1 0
b. Eligible for the federally funded free or reduced-price lunch program? ......... 1 0
7. For which of the following disability categories has this student been officially identified? (CHECK ALL THAT APPLY)
1 Autism 6 Learning disability 11 Traumatic brain injury 2 Deaf-blindness 7 Mental retardation 12 Visual impairment
3 Developmental delay 8 Orthopedic impairment 13 Other disability (SPECIFY):
4 Emotional disturbance 9 Other health impairment 5 Hearing impairment 10 Speech or language impairment 14 None of the above
Please complete the other side.
According to the Paperwork Reduction Act of 1995, no persons are required to respond to a collection of information unless it displays a valid OMB control number. The valid OMB control number for this information collection is 1850-0812. The time required to complete this information collection is estimated to average 20 minutes per response, including the time to review instructions, search existing data resources, gather the data needed, and complete and review the information collected. If you have any comments concerning the accuracy of the time estimate(s) or suggestions for improving this form, please write to: U.S. Department of Education, Washington, D.C. 20202-4651. If you have comments or concerns regarding the status of your individual submission of this form, write directly to: U.S. Department of Education, Planning and Evaluation Services, Washington, D.C. 20208-5651.
Student bar-coded label

OMB No.: 1850-0812 Expiration Date: 03/31/2009
Prepared by Mathematica Policy Research, Inc. J-8 School Information Form (2006-2007)
8. Which of the following services does this student receive in reading? (CHECK ALL THAT APPLY)
1 Reading support 2 Speech/Language support
3 English as a Second Language (ESL)/English for Speakers of Other Languages (ESOL), English Language Development (ELD)
4 Any other extra support or tutoring (i.e., Title I or other extra help to bring students up to grade- level expectations)
5 None of the above
9. In what grade was this student enrolled in the 2006-07 school year? _______Grade
10. What was this student’s enrollment status on the last day of the 2006-07 school year? (CHECK ONE)
If the student transferred, was expelled, or left for another reason, please fill in the box to the right.
1 Enrolled at this school on the last day of the 2006-07 school year
2 Transferred to another school
3 Expelled
4 Other (SPECIFY)
....
11. Has this student been promoted to the next grade for the 2007-08 school year? (CHECK ONE) If the student will attend a new school next year, please fill in the box to the right.
1 Yes Promoted to grade: ______
0 No
9 Don’t know
Please return this form to Mathematica Policy Research, Inc., in the postage-paid envelope provided or by faxing it to 202-863-1763, attention Melissa Dugger.
Thank you very much.
If attending a new school next year: Name of new school:
New school’s address:
CITY STATE
Last day of attendance: ______/________ /________ MONTH DAY YEAR
Name of new school:
New school’s address: CITY STATE

J-9
TEACHER SURVEY (2006-07)
NATIONAL EVALUATION OF READING COMPREHENSION PROGRAMS
U.S. DEPARTMENT OF EDUCATION
ATTACH LABEL HERE Teacher ID Teacher Name
School ID School Name
IF ABOVE INFORMATION IS INCORRECT,
PLEASE MAKE CORRECTIONS DIRECTLY ON LABEL.
This survey is part of the Evaluation of Reading Comprehension Programs, a national evaluation being conducted for the U.S. Department of Education. The questions ask about the training you received on the reading comprehension program, professional culture at your school, your reflections, and your background. All information you provide will be kept confidential. While you are not required to respond, your cooperation is needed to make the results of this survey comprehensive and accurate. Thank you.
Please return the completed form to: Mathematica Policy Research, Inc. 315 Enterprise Drive Plainsboro, NJ 08536 ATTN: Ms. Season Bedell-Boyle
If you have questions, please contact: Ms. Valerie Williams Phone: 888.535.0283 FAX: 202.863.1763 E-mail: [email protected]
According to the Paperwork Reduction Act of 1995, no persons are required to respond to a collection of information unless it displays a valid OMB control number. The valid OMB control number for this information collection is 1850-0812. The time required to complete this information collection is estimated to average 20 minutes per response, including the time to review instructions, search existing data resources, gather the data needed, and complete and review the information collected. If you have any comments concerning the accuracy of the time estimate(s) or suggestions for improving this form, please write to: U.S. Department of Education, Washington, D.C. 20202-4651. If you have comments or concerns regarding the status of your individual submission of this form, write directly to: U.S. Department of Education, Institute for Education Sciences, Washington, D.C. 20208-5651.
OMB NO.: 1850-0812 EXPIRATION DATE: 03/31/2009


Prepared by Mathematica Policy Research J-11 Teacher Survey (T) 2006-07
SECTION I. READING COMPREHENSION PROGRAM TRAINING This section asks about the training you recently received on the reading comprehension program you are using in your classroom as part of the Evaluation of Reading Comprehension Programs. 1. Thinking about the initial training you received on the reading comprehension program you are using
with your class, how would you rate the following?
IN EACH ROW, CHECK ONE BOX ONLY POOR FAIR GOOD EXCELLENT
a. Trainer’s (or trainers’) knowledge of reading comprehension instruction for fifth graders .............. 1 2 3 4
b. Trainer’s (or trainers’) preparedness ........................ 1 2 3 4
c. Trainer’s (or trainers’) presentation style ................. 1 2 3 4
d. Quality of content covered in training ....................... 1 2 3 4
e. Amount of content covered in training ..................... 1 2 3 4
f. Training schedule (i.e., amount of time spent on the various sessions) ..................................................... 1 2 3 4
g. Materials provided in training ................................... 1 2 3 4
2. Overall, how well did the initial training you received prepare you to use the reading comprehension program with your students? .........................................
NOT AT ALL
1
SOMEWHAT
2
VERY WELL
3
3. What was the first day on which you…
a. Received the initial training ............................................................................ _______/______/2006 MONTH / DAY / YEAR
b. Began using the reading comprehension program in class instruction? ...... _______/______/2006 MONTH / DAY / YEAR
4. If you have any other comments about the training, please note them below.

Prepared by Mathematica Policy Research J-12 Teacher Survey (T) 2006-07
SECTION II. PROFESSIONAL CULTURE This section asks about the professional culture within your school.1
5. CONVERSATIONS ABOUT TEACHING During the past school year, how often have you had conversations with colleagues about…
IN EACH ROW, CHECK ONE BOX ONLY LESS THAN ONCE A MONTH
2 OR 3 TIMES A MONTH
ONCE OR TWICE A WEEK DAILY
a. The goals of this school? ..................... 1 2 3 4
b. Development of new curriculum? ......... 1 2 3 4
c. Managing classroom behavior? ........... 1 2 3 4
d. What helps students learn best? .......... 1 2 3 4
6. MY GRADE LEVEL How much do you disagree or agree with each of the following?
IN EACH ROW, CHECK ONE BOX ONLY STRONGLY DISAGREE DISAGREE AGREE
STRONGLY AGREE
a. Teachers in this grade level trust each other ....... 1 2 3 4
b. It’s OK in this grade level to discuss feelings, worries, and frustrations with other teachers ....... 1 2 3 4
c. Teachers respect other teachers who take the lead in grade level improvement efforts ............... 1 2 3 4
d. Teachers in this grade level respect those colleagues who are expert at their craft ............... 1 2 3 4
PLEASE NOTICE DIFFERENT RESPONSE CHOICES FOR THE ITEM BELOW.
NOT AT ALL A LITTLE SOME
A GREAT EXTENT
e. To what extent do you feel respected by other teachers in this grade level? ............................... 1 2 3 4
PLEASE NOTICE DIFFERENT RESPONSE CHOICES FOR THE ITEM BELOW. NONE SOME
ABOUT HALF MOST
NEARLYALL
f. How many teachers in this grade level really care about each other? ............................................... 0 1 2 3 4
1 Questions 5 through 10 in this section are from The Consortium on Chicago School Research. (1999).
“Improving Chicago's Schools: The Teachers' Turn, 1999; Elementary School Teacher Survey, 1999.” Chicago, IL. Available at www.consortium-chicago.org.

Prepared by Mathematica Policy Research J-13 Teacher Survey (T) 2006-07
7. ACCESS TO NEW IDEAS How often have you…
IN EACH ROW, CHECK ONE BOX ONLY NEVER ONCE TWICE3 TO 4 TIMES
5 TO 9 TIMES
10 OR MORE TIMES
a. Taken courses at a college or university relative to improving your school? ............... 0 1 2 3 4 5
b. Participated in a network with other teachers outside your school? .................................... 0 1 2 3 4 5
c. Discussed curriculum and instruction matters with an outside professional group or organization? ........................................... 0 1 2 3 4 5
d. Attended professional development activities organized by your school (include meetings that focus on improving your teaching)? .................................................... 0 1 2 3 4 5
e. Attended workshops or courses sponsored by your school district (exclude required in-services)? .................................................... 0 1 2 3 4 5
f. Attended professional development activities sponsored by the teachers’ union? .......................................................... 0 1 2 3 4 5
8. MY EXPERIENCE OF CHANGE How much do you disagree or agree with the following?
IN EACH ROW, CHECK ONE BOX ONLY STRONGLY DISAGREE DISAGREE AGREE
STRONGLY AGREE
a. Most changes introduced at this school involve only a few teachers; rarely does the whole faculty become involved ...................... 1 2 3 4
b. We receive adequate professional development support for the changes we introduce at our school ................................... 1 2 3 4
c. Most changes introduced at this school gain little support among teachers ......................... 1 2 3 4

Prepared by Mathematica Policy Research J-14 Teacher Survey (T) 2006-07
9. PROFESSIONAL DEVELOPMENT How much do you disagree or agree with the following?
Overall, my professional development experiences over the past school year… IN EACH ROW, CHECK ONE BOX ONLY
STRONGLY DISAGREE DISAGREE AGREE
STRONGLY AGREE
a. …have included opportunities to work productively with teachers from other schools .......................... 1 2 3 4
b. …have included enough time to think carefully about, to try, and to evaluate new ideas ............... 1 2 3 4
c. …have deepened my understanding of subject matter .................................................................... 1 2 3 4
d. …have helped me understand my students better 1 2 3 4
e. …have been sustained and coherently focused, rather than being short term and unrelated ........... 1 2 3 4
f. …have included opportunities to work productively with colleagues in my school ................................ 1 2 3 4
g. …have led me to make changes in my teaching .. 1 2 3 4
h. …have been closely connected to my school’s improvement plan ................................................. 1 2 3 4
CHECK ONE BOX ONLY
STRONGLY DISAGREE DISAGREE AGREE
STRONGLY AGREE
i. Most of what I learn in professional development addresses the needs of the students in my classroom .............................................................. 1 2 3 4

Prepared by Mathematica Policy Research J-15 Teacher Survey (T) 2006-07
10. LEADERSHIP AND SUPPORT How much do you disagree or agree with the following?
IN EACH ROW, CHECK ONE BOX ONLY STRONGLY DISAGREE DISAGREE AGREE
STRONGLY AGREE
a. The principal at this school is strongly committed to shared decision-making .................................... 1 2 3 4
b. The principal at this school works to create a sense of community in the school ......................... 1 2 3 4
c. The principal at this school promotes parent and community involvement in the school ................... 1 2 3 4
d. The principal at this school supports and encourages teachers to take risks ........................ 1 2 3 4
e. The principal at this school is willing to make changes ................................................................ 1 2 3 4
f. Most changes introduced at this school receive strong support from the principal ........................... 1 2 3 4
g. The principal at this school encourages teachers to try new methods of instruction .......................... 1 2 3 4

Prepared by Mathematica Policy Research J-16 Teacher Survey (T) 2006-07
11. THOUGHTS ABOUT TEACHING READING2 How much do you agree or disagree with the following?
IN EACH ROW, CHECK ONE BOX ONLY STRONGLY DISAGREE DISAGREE AGREE
STRONGLY AGREE
a. I feel I need to make changes in the methods I use to teach children to read and spell ............................................................ 1 2 3 4
b. I get help from staff members to understand some children’s difficulties learning to read .......................................................... 1 2 3 4
c. I have benefited from opportunities to learn more about methods for teaching reading ..................................................... 1 2 3 4
d. The children in my class are making satisfactory progress in learning to read ........................................................................... 1 2 3 4
e. I do not have sufficient materials to teach reading effectively ..... 1 2 3 4
f. I do not understand why some children learn to read easily while other children struggle to learn basic reading skills ........... 1 2 3 4
g. The literacy coach supports my efforts to teach reading effectively ....................................................................................
IF A LITERACY COACH IS NOT AVAILABLE FOR 5TH-GRADE STUDENTS, PLEASE SKIP THIS QUESTION AND CHECK THIS BOX 1 1 2 3 4
h. I have a good understanding of how children acquire language and literacy skills ......................................................................... 1 2 3 4
i. I wish I had more opportunities to discuss how to teach reading with other teachers ..................................................................... 1 2 3 4
j. I feel I am good at teaching reading and writing ......................... 1 2 3 4
k. The principal of my school supports my efforts to teach reading effectively .................................................................................... 1 2 3 4
l. I would like to learn methods to help children develop their oral language ..................................................................................... 1 2 3 4
m. I look for opportunities to learn effective methods to teach reading and writing ..................................................................... 1 2 3 4
n. I could do a better job teaching reading if I had more assistance from aides or volunteers in my class .......................................... 1 2 3 4
o. I know how to assess the progress of my students in reading .... 1 2 3 4
p. The parents of children in my class support my efforts to teach their children to read ................................................................... 1 2 3 4
q. The school day is organized to maximize instructional time ....... 1 2 3 4
2 Items on this page were borrowed from Joanne Carlisle’s “Teacher's QUEST: Self-Administered
Questionnaire” (Regents of the University of Michigan: Ann Arbor, MI, 2003), with minor modifications.

Prepared by Mathematica Policy Research J-17 Teacher Survey 2006-07
SECTION III. TEACHER REFLECTIONS
This section asks for your reflections.3
12. TEACHER REFLECTIONS
IN EACH ROW, CHECK ONE BOX ONLY NOTHING
VERY LITTLE SOME
QUITE A BIT
A GREAT DEAL
a. How much can you do to control disruptive behavior in the classroom? . 1 2 3 4 5
b. How much can you do to motivate students who show low interest in school work? ....................................... 1 2 3 4 5
c. How much can you do to get students to believe they can do well in school work? .................................................. 1 2 3 4 5
d. How much can you do to help your students value learning? ..................... 1 2 3 4 5
e. How much can you do to get children to follow classroom rules? ................... 1 2 3 4 5
f. How much can you do to calm a student who is disruptive or noisy? ..... 1 2 3 4 5
g. How much can you use a variety of assessment strategies? ...................... 1 2 3 4 5
h. How much can you assist families in helping their children do well in school? ............................................. 1 2 3 4 5
PLEASE NOTICE DIFFERENT RESPONSE CHOICES FOR THE ITEMS BELOW.
NOT AT ALL
SMALL EXTENT
MODERATE EXTENT
QUITE A BIT
A GREAT EXTENT
i. To what extent can you craft good questions for your students? ............... 1 2 3 4 5
j. To what extent can you provide an alternative explanation or example when students are confused? ............. 1 2 3 4 5
PLEASE NOTICE DIFFERENT RESPONSE CHOICES FOR THE ITEMS BELOW.
NOT AT ALL SLIGHTLY MODERATELY
QUITE WELL
EXTREMELY WELL
k. How well can you establish a classroom management system with each group of students? ..................... 1 2 3 4 5
l. How well can you implement alternative strategies in your classroom? ......................................... 1 2 3 4 5
3 Items on this page were borrowed with permission from W.K. Hoy and A.E. Woolfolk’s “Teachers’ Sense of
Efficacy Scale” (Elementary School Journal, 93, 355-372), with minor modifications.

Prepared by Mathematica Policy Research J-18 Teacher Survey 2006-07
SECTION IV. BACKGROUND This section asks about your background. 13. How many years have you taught, either full-time or part-time, at the elementary or secondary
level (not counting the current school year)? Include years teaching in both public and private schools. Do not include time spent as a student teacher.
_________TOTAL YEARS TEACHING 14. How many years have you been teaching in THIS school (not counting the current school
year)? If you have had a break in service of one year or more, please report the year that you returned to this school. Do not include time spent as a student teacher. Include years spent teaching both full- and part-time at this school.
_________TOTAL YEARS TEACHING AT THIS SCHOOL 15. What grade levels have you taught? CHECK ALL THAT APPLY 1 1st grade 6 6th grade 11 11th grade 2 2nd grade 7 7th grade 12 12th grade 3 3rd grade 8 8th grade 13 Ungraded 4 4th grade 9 9th grade 14 Kindergarten
5 5th grade 10 10th grade 15 Prekindergarten
16. Column A: For each degree below, please check YES or NO to indicate if you hold that degree. Columns B and C: For those degrees you hold, please specify your major field of study and the year you received the degree.
IN EACH ROW, CHECK ONE BOX IN COLUMN A. IF YOU ANSWER YES IN COLUMN A, COMPLETE COLUMNS B AND C FOR THAT ROW..
A. DEGREE HELD
B. MAJOR C. YEAR
RECEIVED YES NO
a. Associate’s degree ....................................... 1 0
b. Bachelor’s degree ........................................ 1 0
c. Master’s degree ........................................... 1 0
d. Educational specialist or professional diploma (at least one year beyond a master’s degree) .......................................... 1 0
e. Certificate of Advanced Graduate Studies ... 1 0
f. Doctorate (Ph.D., Ed.D.) .............................. 1 0
g. Professional (M.D., D.D.S., J.D., L.L.B) ....... 1 0

Prepared by Mathematica Policy Research J-19 Teacher Survey 2006-07
17. Which of the following describes the teaching certificate you currently hold in this state? CHECK ONE ONLY
1 Regular or standard state certificate or advanced professional certificate
2 Probationary certificate (the initial certificate issued after satisfying all requirements except the completion of a probationary period)
3 Provisional or other type given to persons who are still participating in an “alternative certification program”
4 Temporary certificate (requires some additional college coursework and/or student teaching before regular certification can be obtained)
5 Emergency certificate or waiver (issued to teachers who do not have regular certification who need to complete a regular certification program in order to continue teaching)
18. In what content area does the teaching certificate marked above allow you to teach in this state (e.g., elementary general, secondary general, special ed., a specific subject matter)?
CONTENT AREA
19. Column A: Please indicate if you participated in any professional development activities
listed below in the past 12 months. Column B: If you mark “yes” in Column A, please indicate in Column B how many hours you spent on the activities. Include courses you have taken for recertification or advanced certification, workshops sponsored by your district, conferences, or other training that is relevant to your teaching.
IN EACH ROW, CHECK ONE BOX IN COLUMN A. IF YOU ANSWER YES, CHECK ONE BOX IN COLUMN B.
A. PARTICIPATED? B. NUMBER OF HOURS
YES NO 8 OR
FEWER 9-16 17-32 33 OR MORE
a. Reading instruction .............................. 1 0 1 2 3 4
b. Science instruction ............................... 1 0 1 2 3 4
c. Social studies instruction ..................... 1 0 1 2 3 4

Prepared by Mathematica Policy Research J-20 Teacher Survey 2006-07
20. Are you male or female?
1 Male 2 Female 21. Are you of Hispanic or Latino origin?
1 Yes 0 No
22. How do you describe yourself? (PLEASE SELECT ONE OR MORE)
1 American Indian or Alaska Native 2 Asian 3 Black or African American 4 Native Hawaiian or Other Pacific Islander 5 White 23. What is your year of birth?
____________________ YEAR
CONTACT INFORMATION Please provide your contact information and the best time to reach you in case we have questions about your responses. MR./MS. FIRST NAME LAST NAME
STREET APT. NUMBER
CITY STATE ZIP
E-MAIL ADDRESS
( ) PHONE NUMBER (INCLUDE AREA CODE)
BEST TIME TO REACH YOU
THANK YOU FOR COMPLETING THIS SURVEY FOR THE U.S. DEPARTMENT OF EDUCATION.

J-21
TEACHER SURVEY (2006-07)
NATIONAL EVALUATION OF READING COMPREHENSION PROGRAMS
U.S. DEPARTMENT OF EDUCATION
ATTACH LABEL HERE Teacher ID Teacher Name
School ID School Name
IF ABOVE INFORMATION IS INCORRECT,
PLEASE MAKE CORRECTIONS DIRECTLY ON LABEL.
This survey is part of the Evaluation of Reading Comprehension Programs, a national evaluation being conducted for the U.S. Department of Education. The questions ask about the professional culture at your school, your reflections, and your background. All information you provide will be kept confidential. While you are not required to respond, your cooperation is needed to make the results of this survey comprehensive and accurate. Thank you.
Please return the completed form to: Mathematica Policy Research, Inc. 315 Enterprise Drive Plainsboro, NJ 08536 ATTN: Ms. Season Bedell-Boyle
If you have questions, please contact: Ms. Valerie Williams Phone: 888.535.0283 FAX: 202.863.1763 E-mail: [email protected]
According to the Paperwork Reduction Act of 1995, no persons are required to respond to a collection of information unless it displays a valid OMB control number. The valid OMB control number for this information collection is 1850-0812. The time required to complete this information collection is estimated to average 20 minutes per response, including the time to review instructions, search existing data resources, gather the data needed, and complete and review the information collected. If you have any comments concerning the accuracy of the time estimate(s) or suggestions for improving this form, please write to: U.S. Department of Education, Washington, D.C. 20202-4651. If you have comments or concerns regarding the status of your individual submission of this form, write directly to: U.S. Department of Education, Institute for Education Sciences, Washington, D.C. 20208-5651.
OMB NO.: 1850-0812 EXPIRATION DATE: 03/31/2009


Prepared by Mathematica Policy Research J-23 Teacher Survey 2006-07
SECTION I. PROFESSIONAL CULTURE This section asks about the professional culture within your school.1
1-4. These items are intentionally skipped.
5. CONVERSATIONS ABOUT TEACHING During the past school year, how often have you had conversations with colleagues about…
IN EACH ROW, CHECK ONE BOX ONLY LESS THAN ONCE A MONTH
2 OR 3 TIMES A MONTH
ONCE OR TWICE A WEEK DAILY
a. The goals of this school? ..................... 1 2 3 4
b. Development of new curriculum? ......... 1 2 3 4
c. Managing classroom behavior? ........... 1 2 3 4
d. What helps students learn best? .......... 1 2 3 4
6. MY GRADE LEVEL How much do you disagree or agree with each of the following?
IN EACH ROW, CHECK ONE BOX ONLY STRONGLY DISAGREE DISAGREE AGREE
STRONGLY AGREE
a. Teachers in this grade level trust each other ....... 1 2 3 4
b. It’s OK in this grade level to discuss feelings, worries, and frustrations with other teachers ....... 1 2 3 4
c. Teachers respect other teachers who take the lead in grade level improvement efforts ............... 1 2 3 4
d. Teachers in this grade level respect those colleagues who are expert at their craft ............... 1 2 3 4
PLEASE NOTICE DIFFERENT RESPONSE CHOICES FOR THE ITEM BELOW.
NOT AT ALL A LITTLE SOME
A GREAT EXTENT
e. To what extent do you feel respected by other teachers in this grade level? ............................... 1 2 3 4
PLEASE NOTICE DIFFERENT RESPONSE CHOICES FOR THE ITEM BELOW. NONE SOME
ABOUT HALF MOST
NEARLYALL
f. How many teachers in this grade level really care about each other? ............................................... 0 1 2 3 4
1 Questions 5 through 10 in this section are from The Consortium on Chicago School Research. (1999).
“Improving Chicago's Schools: The Teachers' Turn, 1999; Elementary School Teacher Survey, 1999.” Chicago, IL. Available at www.consortium-chicago.org.

Prepared by Mathematica Policy Research J-24 Teacher Survey 2006-07
7. ACCESS TO NEW IDEAS How often have you…
IN EACH ROW, CHECK ONE BOX ONLY NEVER ONCE TWICE3 TO 4 TIMES
5 TO 9 TIMES
10 OR MORE TIMES
a. Taken courses at a college or university relative to improving your school? ............... 0 1 2 3 4 5
b. Participated in a network with other teachers outside your school? .................................... 0 1 2 3 4 5
c. Discussed curriculum and instruction matters with an outside professional group or organization? ........................................... 0 1 2 3 4 5
d. Attended professional development activities organized by your school (include meetings that focus on improving your teaching)? .................................................... 0 1 2 3 4 5
e. Attended workshops or courses sponsored by your school district (exclude required in-services)? .................................................... 0 1 2 3 4 5
f. Attended professional development activities sponsored by the teachers’ union? .......................................................... 0 1 2 3 4 5
8. MY EXPERIENCE OF CHANGE How much do you disagree or agree with the following?
IN EACH ROW, CHECK ONE BOX ONLY STRONGLY DISAGREE DISAGREE AGREE
STRONGLY AGREE
a. Most changes introduced at this school involve only a few teachers; rarely does the whole faculty become involved ...................... 1 2 3 4
b. We receive adequate professional development support for the changes we introduce at our school ................................... 1 2 3 4
c. Most changes introduced at this school gain little support among teachers ......................... 1 2 3 4

Prepared by Mathematica Policy Research J-25 Teacher Survey 2006-07
9. PROFESSIONAL DEVELOPMENT How much do you disagree or agree with the following?
Overall, my professional development experiences over the past school year… IN EACH ROW, CHECK ONE BOX ONLY
STRONGLY DISAGREE DISAGREE AGREE
STRONGLY AGREE
a. …have included opportunities to work productively with teachers from other schools .......................... 1 2 3 4
b. …have included enough time to think carefully about, to try, and to evaluate new ideas ............... 1 2 3 4
c. …have deepened my understanding of subject matter .................................................................... 1 2 3 4
d. …have helped me understand my students better 1 2 3 4
e. …have been sustained and coherently focused, rather than being short term and unrelated ........... 1 2 3 4
f. …have included opportunities to work productively with colleagues in my school ................................ 1 2 3 4
g. …have led me to make changes in my teaching .. 1 2 3 4
h. …have been closely connected to my school’s improvement plan ................................................. 1 2 3 4
CHECK ONE BOX ONLY
STRONGLY DISAGREE DISAGREE AGREE
STRONGLY AGREE
i. Most of what I learn in professional development addresses the needs of the students in my classroom .............................................................. 1 2 3 4

Prepared by Mathematica Policy Research J-26 Teacher Survey 2006-07
10. LEADERSHIP AND SUPPORT How much do you disagree or agree with the following?
IN EACH ROW, CHECK ONE BOX ONLY STRONGLY DISAGREE DISAGREE AGREE
STRONGLY AGREE
a. The principal at this school is strongly committed to shared decision-making .................................... 1 2 3 4
b. The principal at this school works to create a sense of community in the school ......................... 1 2 3 4
c. The principal at this school promotes parent and community involvement in the school ................... 1 2 3 4
d. The principal at this school supports and encourages teachers to take risks ........................ 1 2 3 4
e. The principal at this school is willing to make changes ................................................................ 1 2 3 4
f. Most changes introduced at this school receive strong support from the principal ........................... 1 2 3 4
g. The principal at this school encourages teachers to try new methods of instruction .......................... 1 2 3 4

Prepared by Mathematica Policy Research J-27 Teacher Survey 2006-07
11. THOUGHTS ABOUT TEACHING READING2 How much do you agree or disagree with the following?
IN EACH ROW, CHECK ONE BOX ONLY STRONGLY DISAGREE DISAGREE AGREE
STRONGLY AGREE
a. I feel I need to make changes in the methods I use to teach children to read and spell ............................................................ 1 2 3 4
b. I get help from staff members to understand some children’s difficulties learning to read .......................................................... 1 2 3 4
c. I have benefited from opportunities to learn more about methods for teaching reading ..................................................... 1 2 3 4
d. The children in my class are making satisfactory progress in learning to read ........................................................................... 1 2 3 4
e. I do not have sufficient materials to teach reading effectively ..... 1 2 3 4
f. I do not understand why some children learn to read easily while other children struggle to learn basic reading skills ........... 1 2 3 4
g. The literacy coach supports my efforts to teach reading effectively ....................................................................................
IF A LITERACY COACH IS NOT AVAILABLE FOR 5TH-GRADE STUDENTS, PLEASE SKIP THIS QUESTION AND CHECK THIS BOX 1 1 2 3 4
h. I have a good understanding of how children acquire language and literacy skills ......................................................................... 1 2 3 4
i. I wish I had more opportunities to discuss how to teach reading with other teachers ..................................................................... 1 2 3 4
j. I feel I am good at teaching reading and writing ......................... 1 2 3 4
k. The principal of my school supports my efforts to teach reading effectively .................................................................................... 1 2 3 4
l. I would like to learn methods to help children develop their oral language ..................................................................................... 1 2 3 4
m. I look for opportunities to learn effective methods to teach reading and writing ..................................................................... 1 2 3 4
n. I could do a better job teaching reading if I had more assistance from aides or volunteers in my class .......................................... 1 2 3 4
o. I know how to assess the progress of my students in reading .... 1 2 3 4
p. The parents of children in my class support my efforts to teach their children to read ................................................................... 1 2 3 4
q. The school day is organized to maximize instructional time ....... 1 2 3 4
2 Items on this page were borrowed from Joanne Carlisle’s “Teacher's QUEST: Self-Administered
Questionnaire” (Regents of the University of Michigan: Ann Arbor, MI, 2003), with minor modifications.

Prepared by Mathematica Policy Research J-28 Teacher Survey 2006-07
SECTION II. TEACHER REFLECTIONS
This section asks for your reflections.3
12. TEACHER REFLECTIONS IN EACH ROW, CHECK ONE BOX ONLY NOTHING
VERY LITTLE SOME
QUITE A BIT
A GREAT DEAL
a. How much can you do to control disruptive behavior in the classroom? . 1 2 3 4 5
b. How much can you do to motivate students who show low interest in school work? ....................................... 1 2 3 4 5
c. How much can you do to get students to believe they can do well in school work? .................................................. 1 2 3 4 5
d. How much can you do to help your students value learning? ..................... 1 2 3 4 5
e. How much can you do to get children to follow classroom rules? ................... 1 2 3 4 5
f. How much can you do to calm a student who is disruptive or noisy? ..... 1 2 3 4 5
g. How much can you use a variety of assessment strategies? ...................... 1 2 3 4 5
h. How much can you assist families in helping their children do well in school? ............................................. 1 2 3 4 5
PLEASE NOTICE DIFFERENT RESPONSE CHOICES FOR THE ITEMS BELOW.
NOT AT ALL
SMALL EXTENT
MODERATE EXTENT
QUITE A BIT
A GREAT EXTENT
i. To what extent can you craft good questions for your students? ............... 1 2 3 4 5
j. To what extent can you provide an alternative explanation or example when students are confused? ............. 1 2 3 4 5
PLEASE NOTICE DIFFERENT RESPONSE CHOICES FOR THE ITEMS BELOW.
NOT AT ALL SLIGHTLY MODERATELY
QUITE WELL
EXTREMELY WELL
k. How well can you establish a classroom management system with each group of students? ..................... 1 2 3 4 5
l. How well can you implement alternative strategies in your classroom? ......................................... 1 2 3 4 5
3 Items on this page were borrowed with permission from W.K. Hoy and A.E. Woolfolk’s “Teachers’ Sense of
Efficacy Scale” (Elementary School Journal, 93, 355-372), with minor modifications.

Prepared by Mathematica Policy Research J-29 Teacher Survey 2006-07
SECTION III. BACKGROUND This section asks about your background. 13. How many years have you taught, either full-time or part-time, at the elementary or secondary
level (not counting the current school year)? Include years teaching in both public and private schools. Do not include time spent as a student teacher.
_________TOTAL YEARS TEACHING 14. How many years have you been teaching in THIS school (not counting the current school
year)? If you have had a break in service of one year or more, please report the year that you returned to this school. Do not include time spent as a student teacher. Include years spent teaching both full- and part-time at this school.
_________TOTAL YEARS TEACHING AT THIS SCHOOL 15. What grade levels have you taught? CHECK ALL THAT APPLY 1 1st grade 6 6th grade 11 11th grade 2 2nd grade 7 7th grade 12 12th grade 3 3rd grade 8 8th grade 13 Ungraded 4 4th grade 9 9th grade 14 Kindergarten
5 5th grade 10 10th grade 15 Prekindergarten
16. Column A: For each degree below, please check YES or NO to indicate if you hold that degree. Columns B and C: For those degrees you hold, please specify your major field of study and the year you received the degree.
IN EACH ROW, CHECK ONE BOX IN COLUMN A. IF YOU ANSWER YES IN COLUMN A, COMPLETE COLUMNS B AND C FOR THAT ROW..
A. DEGREE HELD
B. MAJOR C. YEAR
RECEIVED YES NO
a. Associate’s degree ....................................... 1 0
b. Bachelor’s degree ........................................ 1 0
c. Master’s degree ........................................... 1 0
d. Educational specialist or professional diploma (at least one year beyond a master’s degree) .......................................... 1 0
e. Certificate of Advanced Graduate Studies ... 1 0
f. Doctorate (Ph.D., Ed.D.) .............................. 1 0
g. Professional (M.D., D.D.S., J.D., L.L.B) ....... 1 0

Prepared by Mathematica Policy Research J-30 Teacher Survey 2006-07
17. Which of the following describes the teaching certificate you currently hold in this state? CHECK ONE ONLY
1 Regular or standard state certificate or advanced professional certificate
2 Probationary certificate (the initial certificate issued after satisfying all requirements except the completion of a probationary period)
3 Provisional or other type given to persons who are still participating in an “alternative certification program”
4 Temporary certificate (requires some additional college coursework and/or student teaching before regular certification can be obtained)
5 Emergency certificate or waiver (issued to teachers who do not have regular certification who need to complete a regular certification program in order to continue teaching)
18. In what content area does the teaching certificate marked above allow you to teach in this state (e.g., elementary general, secondary general, special ed., a specific subject matter)?
CONTENT AREA
19. Column A: Please indicate if you participated in any professional development activities
listed below in the past 12 months. Column B: If you mark “yes” in Column A, please indicate in Column B how many hours you spent on the activities. Include courses you have taken for recertification or advanced certification, workshops sponsored by your district, conferences, or other training that is relevant to your teaching.
IN EACH ROW, CHECK ONE BOX IN COLUMN A. IF YOU ANSWER YES, CHECK ONE BOX IN COLUMN B.
A. PARTICIPATED? B. NUMBER OF HOURS
YES NO 8 OR
FEWER 9-16 17-32 33 OR MORE
a. Reading instruction .............................. 1 0 1 2 3 4
b. Science instruction ............................... 1 0 1 2 3 4
c. Social studies instruction ..................... 1 0 1 2 3 4

Prepared by Mathematica Policy Research J-31 Teacher Survey 2006-07
20. Are you male or female?
1 Male 2 Female 21. Are you of Hispanic or Latino origin?
1 Yes 0 No
22. How do you describe yourself? (PLEASE SELECT ONE OR MORE)
1 American Indian or Alaska Native 2 Asian 3 Black or African American 4 Native Hawaiian or Other Pacific Islander 5 White 23. What is your year of birth?
__________________ YEAR
CONTACT INFORMATION Please provide your contact information and the best time to reach you in case we have questions about your responses. MR./MS. FIRST NAME LAST NAME
STREET APT. NUMBER
CITY STATE ZIP
E-MAIL ADDRESS
( ) PHONE NUMBER (INCLUDE AREA CODE)
BEST TIME TO REACH YOU
THANK YOU FOR COMPLETING THIS SURVEY FOR THE U.S. DEPARTMENT OF EDUCATION.


J-33
Expository Reading Comprehension Classroom Observation Instrument
Background Information (or Label)
Observer (Place your label here.)
Today's Date / /
mm dd yyyy Check below to indicate your status at this observation:
Assigned Observer ______ QC Observer ______ Reliability Observer______
Teacher (Place teacher label here.) Start time a.m. p.m.
School End time a.m. p.m.
District Subject (check one)
_____Reading/LA _____Science _____Social Studies _____Other
If this is an intervention observation, please check below
____Project CRISS ____Read About (Scholastic)
____Read for Knowledge ____Read for Real
(SFA)
State
For high intensity intervention observations only:
Was this intervention observation prompted?
______Yes _____No
NUMBER
NUMBER
Maximum number of students observed in classroom
Maximum number of adults observed providing instruction or educational support in the classroom (including teacher)
Any special circumstances that interrupted instruction? (Please explain below.)
_________________________________________________________________________________________________ _________________________________________________________________________________________________ _________________________________________________________________________________________________
Note to Observer: Focus on Primary Teacher for rating purposes. If a student teacher is leading class, please do not observe and reschedule the observation.

J-34
Part I 1st Interval Time of Interval _________ to _________
COMPREHENSION
A B C
Before Reading
Teacher Models
Teacher Explains Reviews Provides Examples
Elaborations
Student Practice
Notes
1. The teacher/student activates prior knowledge and/or previews text before reading (e.g., shares background information about the title, author, content, reviews relevant content from previous lessons, makes predictions, makes connections, addresses text features).
Before, During, or After Reading Teacher Models
Teacher Explains Reviews Provides Examples
Elaborations
Student Practice
Notes
2. Explicit comprehension instruction that teaches students about text structure (compare- contrast, cause-effect, problem-solution, time-order, story grammar, etc.)
3. Explicit comprehension instruction that teaches students how to use strategies such as, main idea, summarizing, drawing conclusions, visualizing events, making predictions during and after reading, evaluating predictions, identifying fact vs. opinion, monitoring for comprehension, other ________
4. Explicit comprehension instruction that teaches students how to generate questions
During or After Reading Teacher Models
Teacher Explains Reviews Provides Examples
Elaborations
Student Practice
Notes
5. Explicit comprehension instruction that teaches text features (sub-heads, captions, charts, maps, graphs, pictures, sidebars, bold & italicized words) to interpret text
6. Teacher asks students to justify their responses (e.g., Teacher asks, “Why do you think/say that?” or, “How did you reach that conclusion?”, etc.).
7. Teacher asks questions based on material in the text that are beyond the literal level.
8. Teacher elaborates, clarifies, or links concepts during and after text reading. May be an elaboration of a student response.

J-35
Part I 1st Interval
VOCABULARY (Includes Concepts, Terminology, Ideas; May Be Technical Or Complex Content-Area Vocabulary)
Tally Notes 1. The teacher provides an explanation and/or a definition or
asks a student to read a definition.
2. The teacher provides: a) examples; b) contrasting examples; c) multiple meanings; d) immediate elaborations to students’ responses.
3. The teacher uses visuals/pictures, gestures related to word meaning, facial expressions, or demonstrations to discuss/demonstrate word meanings.
4. The teacher teaches word learning strategies - using context clues, word parts, root meaning.
5. Students do or are asked to do something that requires knowledge of words (e.g., answer questions; define words; make sentences; find words based on clues; physically demonstrate meaning).
6. Students are given an opportunity to apply word learning strategies - using context clues, word parts, root meaning.
Grouping Arrangements and Text Reading (Code during each 10 minute interval)
TEACHER IS WORKING WITH: (Choose all that apply.)
Text Reading (applies to reading connected text) (Choose all that apply.)
1. Whole class (>75% of class) 2. Large group (> 6 students, < 75% of class) 3. Small groups (3-6 students) 4. Pairs 5. An individual 6. No direct student contact
1. Supported oral reading (includes choral and round robin reading) 2. Independent silent reading 3. Independent or buddy oral reading 4. Teacher reads aloud 5. Teacher reads aloud with students following along silently OR 6. Text not present 7. Text present but not being read.
1 2 3 4 5 6 1 2 3 4 5 OR 6 7

J-36
Note: Part I of the observation instrument can be repeated for up to 10 intervals within each class period, depending on the amount of time within each class period that the teacher is using informational text.

J-37
Part II Answer the following questions at the end of your observation.
Based on your overall observations, determine the effectiveness of the instruction you observed.
During/After instruction, the teacher: Comments/Notes 1. Gave inaccurate and/or confusing explanations or feedback. N Y 2. Missed opportunity to correct or address error. N Y 3. Provided opportunities for most students to participate actively during
teacher-led instruction. N Y
4. Paced instruction so that the length of the comprehension or vocabulary activities was appropriate for this age group. N Y
5. Taught using outlining and/or note taking. N Y 6. Used graphic organizers (e.g., semantic map, Venn diagrams). N Y 7. Kept students thinking for 2+ seconds before calling on a student to
respond to complex questions. N Y
8. Gave independent/pairs/small-group practice in answering comprehension questions or applying comprehension strategy(ies) with expected written product. (Can include response journals if a comprehension strategy is entailed.)
N Y
9. Used writing activities in response to reading (does not include fill in the blank or one word answers). N Y
Based on your overall observations, rate the teacher’s management/responsiveness to students*. Minimal/Poor Fair Good Excellent
10. The teacher maximized the amount of time available for instruction. 1 2 3 4
11. The teacher managed student behavior effectively in order to avoid disruptions and provide productive learning environments. 1 2 3 4
12. The teacher redirected discussion if a student response was leading the group off topic/focus. N/O 1 2 3 4
* Items are adapted from Teacher Competency Checklist (Foorman & Schatschneider, 2003). Used by permission of the publisher/authors for research purposes only in the Evaluation of Reading Comprehension Interventions.
Based on your overall observations, rate student engagement during the observation. Few engaged Many engaged Most engaged
13. Student engagement during the first half of the observation session. 1 2 3
14. Student engagement during the remainder of the observation session. 1 2 3


J-39
Intervention Specific Classroom Observation Form: CRISS
Background Information (or label)
Observer
Today's Date / / mm dd yyyy
School
District Start time a.m. p.m.
Teacher End time a.m. p.m.
State
Intervention instruction took place during:
_____Social Studies _____ Science __________Reading/LA ______Not clear
Number
Number
Maximum number of students observed in classroom
Maximum number of adults observed providing instruction or educational support in the classroom (including teacher)
Describe any special circumstances that interrupted instruction.
Notes to Rater: 1. Focus on the regular classroom teacher for rating purposes. If a student teacher or substitute is
leading class, please do not observe and reschedule the observation. 2. Make sure that the teacher is teaching with expository text for your observation.

J-40
Star each section that you observe today. Answer the questions in that section only. Do not answer the questions in the sections that you do not observe.
Does the teacher…
Section I. Preparing for Understanding 1. Provide instruction or lead activities to generate background knowledge about (or review) a topic or concept before students read about it?
Y N
2. Help students set goals and determine a purpose before the students begin reading?
Y N
Section II. Engaging Students with Content and Transforming Information 3. Have students read a written text?
Y N
4a. Lead students during and/or after reading in transforming information activities (e.g. graphic organizer, guided discussion)?
Y N
4b. Include in the transforming activities informal or formal writing? (Includes note-taking)
Y N
5. Use the transforming activities to teach the content of the lesson?
Y N
6. Discuss or reflect on students’ metacognitive processes during the transforming activities?
Y N
Section III. Reflecting on Content and Learning Processes 7. Lead the whole class in a reflection discussion at the end of the lesson using questions such as: A) Metacognition: How did you evaluate your comprehension? B) Background knowledge: Did I assist you in thinking about what you already knew? C) Purpose Setting: Did you have clear purposes? D) Active Involvement: How were you actively engaged? E) Discussion: How did discussion clarify your thinking? F) Writing: How did you use writing to help you learn? G) Transformation: What were the different ways you transformed information? How did this help you? H) Teacher modeling: Did I do enough modeling?
Y N
Please note: You may see all three Sections in one sitting. Or you may see Sections I and II, or Sections II and III, or Section II alone. You should never Sections I and III together. It is also unlikely that you will see I alone or III alone.
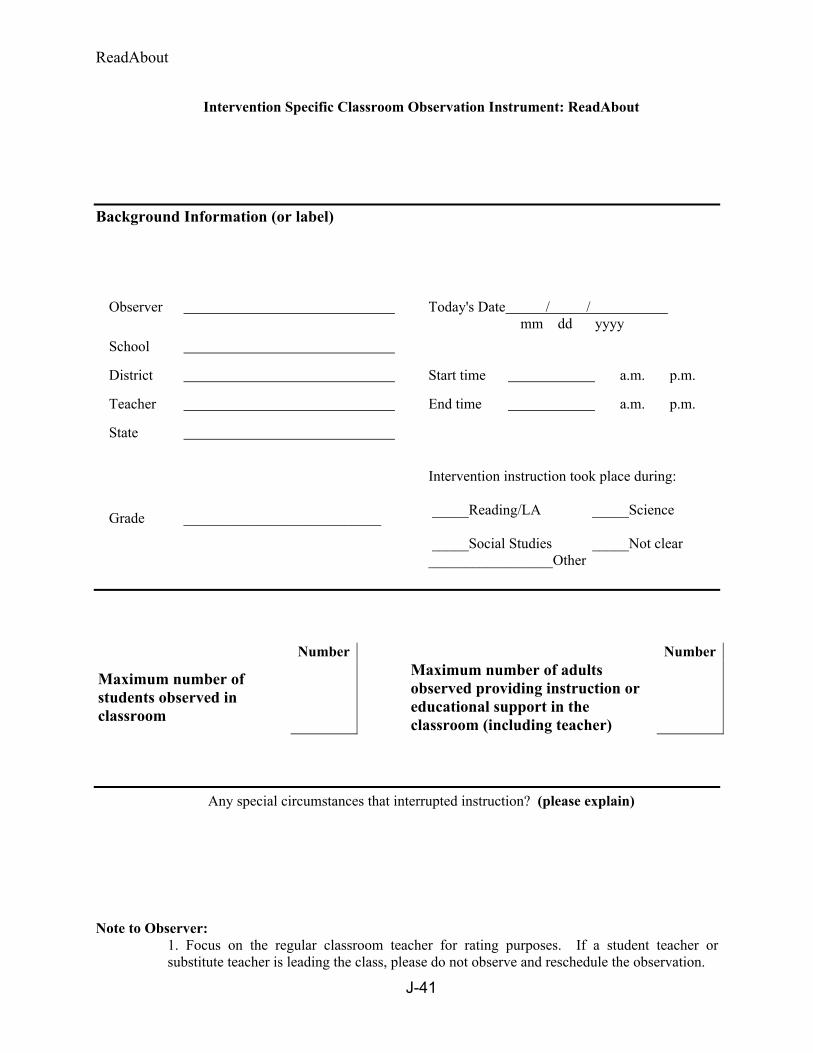
ReadAbout
J-41
Intervention Specific Classroom Observation Instrument: ReadAbout
Background Information (or label)
Observer
Today's Date / / mm dd yyyy
School
District Start time a.m. p.m.
Teacher End time a.m. p.m.
State
Grade ___________________________
Intervention instruction took place during:
_____Reading/LA _____Science
_____Social Studies _____Not clear _________________Other
Number
Number
Maximum number of students observed in classroom
Maximum number of adults observed providing instruction or educational support in the classroom (including teacher)
Any special circumstances that interrupted instruction? (please explain)
Note to Observer:
1. Focus on the regular classroom teacher for rating purposes. If a student teacher or substitute teacher is leading the class, please do not observe and reschedule the observation.

ReadAbout
J-42
Part I o Observe one rotation of teacher-led differentiated instruction (small group). o Place a star by components observed (comprehension, vocabulary and/or writing). o Answer these questions while observing the lesson.
1. Length of small-group instruction rotation: __________minutes
2. Number of students participating: __________________students
3. Did the teacher use ReadAbout materials? ______Yes ______No Check which materials were used (check all that apply): ___SmartFiles ____Differentiated Skills Lesson
____Graphic Organizers/worksheets ___Paperback Library
Teacher-led small group, Comprehension: Did the teacher 4. Provide direction instruction (explain and/or model) on the strategy or skill?
Y N
5. Provide opportunities for students to apply the skill (guided practice)?
Y N
6. What was the primary focus of the teacher-led comprehension instruction? o Author’s purpose o Main idea/details o Draw conclusions o Fact/opinion o Text structure (cause/effect;
compare/contrast, sequence of events, problem/solution)
o Make inferences o Summarizing o Visualizing o Setting purpose o Monitoring (including rereading and repairing) o Questioning
Teacher-led small group, Vocabulary: Did the teacher 7. Provide direct instruction (explain and model) on a vocabulary strategy?
Y N
8. Provide opportunities for students to apply the strategy (guided practice)?
Y N
9. What was the primary focus of the teacher-led vocabulary instruction? o Multiple meanings o Prefixes/suffixes o Using context clues
o Synonym and antonyms o Idioms o Word origins
Teacher-led small group, Writing: Did the teacher 10. Provide students instruction on the selected 6+1 Writing Trait? Y N 11. Provide opportunities to apply the 6+1 Trait model? Y N 12. What was the primary focus of writing instruction?
o Ideas o Organization o Voice o Word Choice
o Sentence fluency o Conventions o Presentation

ReadAbout
J-43
Part II
Computer workstation (If more than one rotation is observed during the teacher-led instruction, note below the number of students/minutes for each rotation. Enter an average amount in the time after item 14 if multiple rotations are observed).
13. How many students were working on the ReadAbout software at the computer workstation? ________students (total)
____students Rotation 1 _____students Rotation 2 ______students Rotation 3
14. How long did the computer workstation rotation last? _____minutes (average)
_____minutes Rotation 1 _______minutes Rotation 2 __________Rotation 3
15. Obtain from the teacher the class-specific Skills Performance Report for the day of the observation only.
16. Ask the teacher to highlight the names of students who were working at the computer workstation during the observation period (the rotation during which you observed the teacher-led small group). Append the report to the completed observation protocol.
Independent workstation
17. How many students were working independently on ReadAbout materials?
_________students
18. What materials were being used by students?
______SmartFiles & Answer Sheets
______Paperback library


Learn
J-45
Intervention Specific Classroom Observation Instrument: Read for Real Phase: Learn
Background Information (or label)
Observer
Today's Date / / mm dd yyyy
School
District Start time a.m. p.m.
Teacher End time a.m. p.m.
State
Intervention instruction took place during:
_____Reading/LA _____Science
_____Social Studies _____Not clear _________________Other
1. Indicate which level of Read for Real you observed (Check only one):
_____A _____B _____C _____D
2. Enter the Title of the Story:
3. Were multiple levels of Read for Real used during this observation? _____yes _____no
4. Instructional Grouping Arrangement (Check all that apply): _____Whole Class _____Small Group (3 or more) _____Pairs
Number
Number
Maximum number of students observed in classroom
Maximum number of adults observed providing instruction or educational support in the classroom (including teacher)
Describe any special circumstances that interrupted instruction.
Note to Observer: 1. Focus on the regular classroom teacher for rating purposes. If a student teacher or substitute teacher is leading the class, please do not observe and reschedule the observation. 2.If multiple levels are used, observe the group to whom the teacher is providing instruction. 3.If an Apply lesson is being taught, reschedule the observation.

Learn
J-46
Phase: Learn
Check (√) the item that indicates where the lesson began. Follow along in the student book. As you observe, circle Yes (Y) or No (N) for the teaching behaviors. Star (*) the item that indicates where the lesson ended. All phases of Read for Real may not be addressed during the observation.
The teacher:
1. Before Reading
a. Reads or asks a student to read the explanation of the Before Reading focus strategy.
Y N
b. Discusses the Before Reading focus strategy with the students. Y N c. Reads or asks a student to read the information in the My Thinking box. Y N d. Asks students to apply the Before Reading focus strategy. Y N
2. During Reading a. Reads or asks a student to read the explanation of the During Reading focus strategy.
Y N
b. Discusses the During Reading focus strategy with the students. Y N c. Reads or asks a student to read the information in the My Thinking box. Y N d. Asks students to share their thinking about the During Reading focus strategy Y N e. Stops and addresses the My Thinking notes at the “red strategy buttons.” __________ __________ out of ___________ ____________ (# addressed) (# possible)
Tally
f. Reads and/or asks students to read the selection aloud. ______Never ________Sometimes __________Always

Learn
J-47
The teacher:
3. After Reading a. Reads or asks students to read the After Reading focus strategy. Y N b. Discusses the After Reading focus strategy with the students. Y N c. Reads or asks a student to read the information in the My Thinking box. Y N d. Calls on students to implement the After Reading focus strategy. Y N
Comprehension e. Administers the open book comprehension test. Y Nf. Corrects tests with the class. Y Ng. Discusses responses.
Y N
Organizing Information h. Read or asks a student to read the information from the reading partner. Y N i. Discusses the graphic organizer. Y N
Writing for Comprehension
j. Reads or asks a student to read the information from the reading partner. Y N k. Reads or asks a student to read the summary. Y N l. Identifies how the paragraphs and sentences in the summary correspond to the information on the graphic organizer.
Y N
m. Discusses the three parts of a summary: Introduction Y N Body Y N Conclusion
Y N
Vocabulary n. Instructs students in the vocabulary skill. Y No. Asks students to complete the vocabulary activity:
_____as a whole class _______ in small groups ______in partners ______independently
Fluency
p. Asks a student to read the fluency tip. Y N q. Asks a student to read the selection. Y N r. Gives students time to practice the selection. Y N


Practice -
J-49
Intervention Specific Classroom Observation Instrument: Read for Real Phase: Practice
Background Information (or label)
Observer
Today's Date / / mm dd yyyy
School
District Start time a.m. p.m.
Teacher End time a.m. p.m.
State
Intervention instruction took place during: _____Reading/LA _____Science _____Social Studies _____Not Clear
________________Other
1. Indicate which level of Read for Real you observed (Check only one):
_____A _____B _____C _____D
2. Enter the Title of the Story:
3. Were multiple levels of Read for Real used during this observation? _____yes _____no
4. Instructional Grouping Arrangement Check all that apply): _____Whole Class _____Small Group (3 or more) _____Pairs
Number
Number
Maximum number of students observed in classroom
Maximum number of adults observed providing instruction or educational support in the classroom (including teacher)
Describe any special circumstances that interrupted instruction.
Note to Observer: 1. Focus on the regular classroom teacher for rating purposes. If a student teacher or substitute teacher is leading the class, please do not observe and reschedule the observation.
2. If multiple levels are used, observe the group to whom the teacher is providing instruction. 3. If an Apply lesson is being taught, reschedule the observation.

Practice -
J-50
Phase: Practice Check (√) the item that indicates where the lesson began. Follow along in the student book. As you observe, circle Yes (Y) or No (N) for the teaching behaviors. Star (*) the item that indicates where the lesson ended. All phases of Read for Real may not be addressed during the observation.
The Teacher:
1. Before Reading
a. Reads or asks a student to read the Before Reading focus strategy. Y N b. Discusses the Before Reading focus strategy with the students. Y N c. Asks students to implement the Before Reading focus strategy. Y N d. Discusses students’ comments. Y N
2. During Reading a. Reads or asks a student to read the During Reading focus strategy. Y N b. Reads or asks a student to read the note from the reading partner. Y N c. Reminds students to write notes about the During Reading focus strategy. Y N d. Reads and/or asks students to read the selection: Y N
e. Stops or reminds students to stop at the red buttons, and write notes on their paper. __________ __________ out of ___________ ____________
(# addressed) (# possible)
Tally

Practice -
J-51
3. After Reading
a. Reads or asks students to read the After Reading focus strategy. Y N b. Discusses or asks question about the After Reading focus strategy. Y N c. Gives a written assignment highlighting the After Reading focus strategy. Y N
Comprehension d. Administers open book comprehension test. Y N e. Corrects tests with the class. Y N f. Discusses responses. Y N
Organizing Information g. Asks students to complete graphic organizer. Y N
Writing for Comprehension h. Asks students to write a summary based on their completed graphic organizer. Y N
Vocabulary i. Instructs students in the vocabulary skill. Y N j. Asks students to complete the vocabulary activity:
_____as a whole class _______ in small groups _____ in partners ______independently
Fluency k. Asks a student to read the fluency tip. Y N l. Asks a student to read the selection. Y N m. Gives students time to practice the selection. Y N


J-53
Intervention Specific Classroom Observation Form: Reading For Knowledge Circle the Day Visited 1 2 3 4
Background Information (or label)
Observer
Today's Date / / mm dd yyyy
School
District Start time a.m. p.m.
Teacher End time a.m. p.m.
State
Intervention instruction took place during:
_____Social Studies _____ Science
__________Reading/LA _____Not clear
Number
Number
Maximum number of students observed in classroom
Maximum number of adults observed providing instruction or educational support in the classroom (including teacher)
Describe any special circumstances that interrupted instruction.
Please record the following: 1. Unit #____ 2. Week #____ 3. Day #____ 4.Book Title_____________________
Notes to Rater:
1. Focus on the regular classroom teacher for rating purposes. If a student teacher or substitute teacher is leading class, please do not observe and reschedule the observation.
2. If today’s class period includes testing, please do not observe and reschedule the observation. 3. Place a star to the left of the section when the lesson started and a star when it concluded

J-54
A. Answer these questions while observing the lesson. Did the teacher… I. Set the Stage
a. Post the reading goal?
Y N
b. Present the reading goal?
Y N
c. Present the cooperative learning goal?
Y N
d. Ask students to review vocabulary or provide practice and instruction? (Exception: This is not done on the first day of a new unit.)
Y N
II. Active Instruction—Days 1, 3
a. Build background knowledge about the topic of text or about a skill/strategy?
Y N
b. Explain a skill/strategy OR remind the students of a skill/strategy recently learned?
Y N
c. Read aloud the text and (1) think-aloud or model a skill/strategy OR (2) ask the students to apply a skill/strategy?
Y N
II. Active Instruction—Days 2, 4
a. Use a whole group or partner activity to discuss key points about the day’s skill/strategy?
Y N
b. Provide feedback and prompts to partner pairs during partner reading?
Y N
c. Chart individual students’ progress on the setting goals and charting progress forms during partner reading?
Y N
d. Review routines for Team Talk discussion?
Y N
e. Read aloud Team Talk questions?
Y N
f. Circulate the classroom and monitor team discussions and provide prompts?
Y N
g. Ask team members to share with the class their responses and reasoning to Team Talk questions?
Y N
B. Answer these two overall questions at the end of the lesson. The teacher followed the recommended pacing for the lesson. (Recommended pacing is 35 minutes +/- 5 minutes.)
Y N
The teacher awarded cooperation and/or improvement points at some point in the lesson.
Y N

J-55
DEVELOPER INTERVIEWS: READING PROGRAM COSTS AND SERVICES Evaluation of Reading Comprehension Programs
I. TEACHER PROFESSIONAL DEVELOPMENT – INITIAL TRAINING
1. I’d like to begin by asking you about the training teachers in the study received before beginning classroom instruction.
a. What type of initial training did your program provide to study teachers? (Examples: in-person group training, in-person individual training)
b. For each type: How long did the initial training last? (Report hours—minus lunch time—to the nearest quarter hour.) c. For each type: How many staff provided initial training (per training session)? d. For each type: What were the roles or positions of the staff providing the initial training (e.g., lead trainer, assistant)?
TABLE 1A-D. TYPICAL INITIAL TRAINING FOR STUDY DISTRICTS
If there were differences in what you provided across study districts, please report here what was typically provided. The next question asks about differences across districts.
TYPE OF TRAINING (a)
LENGTH OF SESSION (TO NEAREST 1/4 HR) (b)
NUMBER OF STAFF PROVIDING SUPPORT (c)
STAFF POSITIONS (d)

J-56
e. Did any of the above initial training items (a-d) differ across study districts? If yes, please note this in the table below: What were the differences? Why did they differ? How many districts did the differences apply to?
TABLE 1E. DIFFERENCES IN INITIAL TRAINING ACROSS STUDY DISTRICTS
TYPE OF TRAINING (a)
LENGTH OF SESSION (TO NEAREST 1/4 HR) (b)
NUMBER OF STAFF PROVIDING TRAINING (c)
STAFF POSITIONS (d)
f. Did any of the above initial training items (a-d) differ from what nonstudy teachers would have received when a school or district purchased the reading program? If yes, please note this in the table below: What were the differences? Why did they differ?
TABLE 1F. DIFFERENCES IN INITIAL TRAINING COMPARED TO NONSTUDY DISTRICTS TYPE OF TRAINING
(a) LENGTH OF SESSION (TO NEAREST 1/4 HR)
(b)NUMBER OF STAFF PROVIDING TRAINING
(c)STAFF POSITIONS
(d)

J-57
g. Is the cost of initial training typically included in the purchase of the reading program? ___ YES ___ NO
If no: (1) What is the cost? $ PER DISTRICT $ PER SCHOOL $ PER TEACHER $ PER STUDENT
(2) Is there a per-teacher discount for training large groups of teachers? __ YES __NO
If yes: (3) What is the discount?
h. Did you provide initial training for teachers who were not able to attend the original training?
___ YES ___ NO
If yes: (1) How did this differ from what nonstudy teachers would have received when a school or district purchased the reading program?
(2) What was the cost of providing this training?

J-58
i. Did you provide training for principals and other administrators?
___ YES ___ NO
If yes: (1) What kinds of training were provided? (2) How did this differ from what nonstudy principals and administrators would have
received when a school or district purchased the reading program? (3) What were the costs involved, if any, for this training?

J-59
II. TEACHER PROFESSIONAL DEVELOPMENT – FOLLOW-UP TRAINING
2. Now let’s discuss the training teachers in the study received after beginning classroom instruction.
a. What type of formal follow-up training did your program provide to study teachers? (Examples: in-person individual training, in-person group training)
b. For each type: How frequently did the formal follow-up training occur (e.g., bimonthly, monthly, once a semester)? c. For each type: How many sessions of formal follow-up training did teachers receive per district? d. For each type: How long did the formal follow-up training last? Report hours (minus lunch time) to the nearest quarter hour. e. For each type: How many staff provided formal follow-up training per session? f. For each type: What were the roles or positions of the staff providing the formal follow-up training (e.g., lead trainer, assistant)?
TABLE 2A-F. TYPICAL FOLLOW-UP TRAINING FOR STUDY DISTRICTS
If there were differences in what you provided across study districts, please report here what was typically provided. The next question asks about differences across districts.
TYPE OF TRAINING (a)
TRAINING FREQUENCY (b)
TOTAL NUMBER OF SESSIONS
(c)
LENGTH OF SESSION (TO NEAREST 1/4 HR)
(d)
NUMBER OF STAFF PROVIDING TRAINING
(e)
STAFF POSITIONS (f)

J-60
g. Did any of the above formal follow-up training items (a-f) differ across study districts? If yes, please note this in the table below: What were the differences? Why did they differ? How many districts did the differences apply to?
TABLE 2G. DIFFERENCES IN FORMAL FOLLOW-UP TRAINING ACROSS STUDY DISTRICTS
TYPE OF TRAINING (a)
TRAINING FREQUENCY (b)
TOTAL NUMBER OF SESSIONS
(c)
LENGTH OF SESSION (TO NEAREST 1/4 HR)
(d)
NUMBER OF STAFF PROVIDING TRAINING
(e)
STAFF POSITIONS (f)
h. Did any of the above formal follow-up training items (a-f) differ from what nonstudy teachers would have received when a school or district purchased the reading program?
If yes, please note this in the table below: What were the differences? Why did they differ? TABLE 2H. DIFFERENCES IN FORMAL FOLLOW-UP TRAINING COMPARED TO NONSTUDY DISTRICTS
TYPE OF TRAINING (a)
TRAINING FREQUENCY (b)
TOTAL NUMBER OF SESSIONS
(c)
LENGTH OF SESSION (TO NEAREST 1/4 HR)
(d)
NUMBER OF STAFF PROVIDING TRAINING
(e)
STAFF POSITIONS (f)
i. Is the cost of follow-up training typically included in the purchase of the reading program? ___ YES ___ NO
If no: (1) What is the cost? $ PER DISTRICT $ PER SCHOOL

J-61
$ PER TEACHER $ PER STUDENT
(2) Is there a per-teacher discount for training large groups of teachers? __ yes __no
If yes: (3) What is the discount?

J-62
III. OTHER TEACHER SUPPORT
3. The next set of questions are about other services or support your program may have provided to teachers in the study (other than the formal follow-up training).
a. What types of other services or support did your program provide to study teachers? (Examples: drop-in consulting to answer
questions, address concerns, demonstrate strategies; e-mail or telephone helpdesk/consulting; conf. calls with teams of teachers) b. For each type: How frequently did the service or support occur (e.g., bimonthly, monthly, once a semester) c. For each type: How many hours overall would you estimate were provided for this support? Report hours (minus lunch time) to
the nearest quarter hour. d. For each type: How many staff provided the service or support (per session)? e. For each type: What were the roles or positions of the staff providing the service or support (e.g., lead trainer, assistant)?
TABLE 3A-E. OTHER SERVICES OR SUPPORT FOR STUDY DISTRICTS
If there were differences in what you provided across study districts, please report here what was typically provided. The next question asks about differences across districts.
TYPE OF SERVICE OR SUPPORT (a)
FREQUENCY (b)
TOTAL HOURS OF SUPPORT (TO NEAREST 1/4 HR)
(c)
NUMBER OF STAFF PROVIDING SUPPORT
(d)
STAFF POSITIONS (e)

J-63
f. Did any of the above services or support items (a-f) differ across study districts? If yes, please note this in the table below: What were the differences? Why did they differ? How many districts did the differences apply to?
TABLE 3F. DIFFERENCES IN SERVICES OR SUPPORT ACROSS STUDY DISTRICTS
TYPE OF SERVICE OR SUPPORT (a)
FREQUENCY (b)
LENGTH OF SESSION (TO NEAREST 1/4 HR)
(d)
NUMBER OF STAFF PROVIDING SUPPORT
(e)
STAFF POSITIONS (f)
g. Did any of the above services or support items (a-f) differ from what nonstudy teachers would have received when a school or district purchased the reading program?
If yes: What were the differences? Why did they differ? TABLE 3G. DIFFERENCES IN SERVICES OR SUPPORT COMPARED TO NONSTUDY DISTRICTS
TYPE OF SERVICE OR SUPPORT (a)
FREQUENCY (b)
LENGTH OF SESSION (TO NEAREST 1/4 HR)
(d)
NUMBER OF STAFF PROVIDING SUPPORT
(e)
STAFF POSITIONS (f)

J-64
h. Is the cost of these services or this support typically included in the purchase of the reading
program? ___ YES ___ NO
If no: (1a) What is the cost for _____________________________________________ (the first service/support)?
$ PER DISTRICT $ PER SCHOOL $ PER TEACHER $ PER STUDENT
(2a) Is there a per-teacher discount for providing services or support to large groups of
teachers? ___ YES ___ NO
If yes: (3a) What is the discount?
(1b) What is the cost for _____________________________________________ (the second service/support)?
$ PER DISTRICT $ PER SCHOOL $ PER TEACHER $ PER STUDENT
(2b) Is there a per-teacher discount for providing services or support to large groups of
teachers? ___ YES ___ NO If yes: (3b) What is the discount?
(1c) Repeat as needed for additional services/supports.

J-65
IV. MATERIALS PROVIDED
4. This set of questions asks about materials your program provided to study schools. a. What materials did your program provide to study schools? If there were differences in
what you provided across study districts, please report here what was typically provided. The next question asks about differences across districts. (1) Teacher training materials (2) Teacher instructional manuals (3) Student instructional materials (4) Other (specify):
b. Did the type or amount of materials differ across study districts? ___ YES ___ NO
If yes: What are the differences? Why did they differ? Note how many districts the differences apply to.
c. Did the type or amount of materials teachers received in the study differ from what they would have received when a school or district purchased the reading program? ___YES __ NO If yes: What are the differences? Why did they differ?

J-66
d. Is the cost of these materials typically included in the purchase of the reading program? ___ YES ___ NO
If no: What is the cost? $ PER DISTRICT $ PER SCHOOL $ PER TEACHER $ PER STUDENT
e. What additional materials or equipment should districts or schools or teachers provide to make the best use of your program?

J-67
V. READING PROGRAM PRICING
5. This set of questions asks about the price of the complete name of reading program program for a nonstudy district or school.
a. What was the typical price a district or school would pay to use the reading program in the
2006–07 school year? Indicate both fixed and variable fees. 1) Fixed fees
ITEM COST PER DISTRICT OR SCHOOL
2) Variable fees per teacher and/or per student (e.g., for teacher training materials, instructional support, classroom materials)
ITEM COST PER TEACHER OR STUDENT
b. Were bulk discounts available during the 2006-07 school year for schools and/or districts buying the reading program for a minimum number or classes or students? If yes: What is the pricing structure for bulk discounts?

J-68
VI. DEVELOPERS’ VIEWS OF IMPLEMENTATION*
6. The last set of questions asks about the quality of the implementation of name of reading program at schools participating in the study.
Name of program: Please complete Questions 6a-c before our scheduled interview. a. Please rate the quality of each school’s implementation relative to one another by
indicating which schools fall into the four categories below (indicate the school by entering in the first table below the number to the left of each school in the second table below).
TOP 1/4 OF SCHOOLS SECOND BEST 1/4 OF SCHOOLS SECOND WORST 1/4 OF SCHOOLS WORST 1/4 SCHOOLS
DISTRICT(CITY, STATE) SCHOOL
District 1 (City, State) 1 – SchoolName1 2 – SchoolName2 3 – SchoolName3
District 2 (City, State) 4 – SchoolName4 5 – SchoolName5
District 3 (City, State) 6 – SchoolName6 7 – SchoolName7
District 4 (City, State) 8 – SchoolName8
District 5 (City, State) 9 – SchoolName9 10 – SchoolName10
District 6 (City, State) 11 – SchoolName11 12 – SchoolName12
District 7 (City, State) 13 – SchoolName13
District 8 (City, State) 14 – SchoolName14 15 – SchoolName15
District 9 (City, State) 16 – SchoolName16 17 – SchoolName17
District 10 (City, State) 18 – SchoolName18 *Questions 6b, c, and d were adapted from the Vendor Perspective on Implementation in Study Schools survey from
the Evaluation of the Effectiveness of Educational Technology Interventions, sponsored by the U.S. Department of Education.

J-69
b. How would you rate the quality of each school’s implementation, compared to the typical implementation for nonstudy schools?
DISTRICT (CITY, STATE)
MUCH WORSE THAN
AVERAGE
SOMEWHAT WORSE THAN
AVERAGE
AVERAGE
SOMEWHAT BETTER THAN
AVERAGE
MUCH BETTER THAN
AVERAGE
DON’T KNOW
District 1 (City, State) 1 – SchoolName1 1 2 3 4 5 9 2 – SchoolName2 1 2 3 4 5 9 3 – SchoolName3 1 2 3 4 5 9
District 2 (City, State) 4 – SchoolName4 1 2 3 4 5 9 5 – SchoolName5 1 2 3 4 5 9
District 3 (City, State) 6 – SchoolName6 1 2 3 4 5 9 7 – SchoolName7 1 2 3 4 5 9
District 4 (City, State) 8 – SchoolName8 1 2 3 4 5 9
District 5 (City, State) 9 – SchoolName9 1 2 3 4 5 9 10 – SchoolName10 1 2 3 4 5 9
District 6 (City, State) 11 – SchoolName11 1 2 3 4 5 9 12 – SchoolName12 1 2 3 4 5 9
District 7 (City, State) 13 – SchoolName13 1 2 3 4 5 9
District 8 (City, State) 14 – SchoolName14 1 2 3 4 5 9 15 – SchoolName15 1 2 3 4 5 9
District 9 (City, State) 16 – SchoolName16 1 2 3 4 5 9 17 – SchoolName17 1 2 3 4 5 9
District 10 (City, State) 18 – SchoolName18 1 2 3 4 5 9

J-70
c. What source(s) of information did you use to determine your ratings in 6a and 6b?
DISTRICT (CITY, STATE)
DISTRICT STAFF
COMMENTS
SCHOOL STAFF
COMMENTS
CLASSROOM OBSERVATIONS
BY YOUR PROGRAM STAFF
TRAINING OBSERVATIONS
BY YOUR PROGRAM STAFF
OTHER (SPECIFY)
District 1 (City, State)
1 2 3 4 5
District 2 (City, State)
1 2 3 4 5
District 3 (City, State)
1 2 3 4 5
District 4 (City, State)
1 2 3 4 5
District 5 (City, State)
1 2 3 4 5
District 6 (City, State)
1 2 3 4 5
District 7 (City, State)
1 2 3 4 5
District 8 (City, State)
1 2 3 4 5
District 9 (City, State)
1 2 3 4 5
District 10 (City, State)
1 2 3 4 5

J-71
d. Please describe any specific aspects of the implementation and instructional conditions in particular study schools that you think the evaluation team should be aware of.
Thank you very much for your input.

APPENDIX K
UNADJUSTED MEANS


K-3
TABLE K.1
UNADJUSTED MEANS FOR TREATMENT AND CONTROL GROUPS
Control Group
Project CRISS ReadAbout
Read for Real
Reading for
Knowledge
Combined Treatment
Group
Baseline (Fall 2006) Test Scores TOSCRF Score 88.25 89.07 87.84 87.80 89.75 88.61 GRADE Score 99.83 100.84 99.59 99.23 101.17 100.21
Follow-up (Spring 2007) Test Scores Composite Test Scorea 0.02 0.06 -0.04 -0.07 0.02 -0.01 GRADE Score 100.81 101.70 99.78 100.07 101.39 100.74 Social Studies Reading Comprehension Assessment Score 501.67 501.48 499.79 497.18 501.03 499.90 Science Reading Comprehension Assessment Score 501.51 502.55 499.94 498.20 499.39 500.06
Number of Studentsb 1,367 1,319 1,246 1,227 1,191 4,983
Source: Reading comprehension tests administered by study team. Note: The social studies and science reading comprehension assessments were developed by ETS.
aThe composite is based on the three tests presented in this table. Each test score is converted into a z-score by subtracting the mean and dividing by the standard deviation of the variable for students in the sample. The composite is the simple average of the three z-scores.
bThe number of students presented in this row is the number participating in the study. The proportion of students in each experimental condition with follow-up test scores is reported in Appendix Table G.2.
ETS = Educational Testing Service. GRADE = Group Reading Assessment and Diagnostic Evaluation. TOSCRF = Test of Silent Contextual Reading Fluency.

K-4