EFFECTIVE INCENTIVES FOR ALUMINIUM INDUSTRY … Incentives For... · EFFECTIVE INCENTIVES FOR...
123
Monograph Series-I EFFECTIVE INCENTIVES FOR ALUMINIUM INDUSTRY IN iNDIA Bishwanath Goldar NATIONAL INSTITUTE Of PUBLIC FINANCE AND POLICY
Transcript of EFFECTIVE INCENTIVES FOR ALUMINIUM INDUSTRY … Incentives For... · EFFECTIVE INCENTIVES FOR...

Monograph Series-I
EFFECTIVE INCENTIVES FOR ALUMINIUM INDUSTRYIN iNDIA
Bishwanath Goldar
NATIONAL INSTITUTE Of PUBLIC FINANCE AND POLICY

Ksm&KHMBHxaaaBaaaattBaaaaaBaan » ffH National Institute of Public &g Finance and Policy gg L I BRAR Y |ss b
New Delhi §a nB Class No. 3 ' '4-~(o<_C j7-2-2. BB Bg Book No. 7 r ~) _______ . §£1 B** Accession No.__ _j_____ £ gm bb b b b b b b b b b b b b b b b k b b b b b b b b b b b

Monograph Series - 1
Effective Incentives for Aluminium
Industry in IndiaNlPPP Library-------
llllllll21382
338.47689722 G57E n i l
Bishwanath Goldar
NATIONAL INSTITUTE OF PUBLIC FINANCE AND POLICY

Price : Rs. 100 Printed in India atSHEELA ART PRINTERS 18, Shivpuri, Delhi. 1100051
Published by Rita Wadhwa on behalf ofNational Institute of Public Finance and Policy 18/2, Satsang Vihar Marg, Special Institutional Area, New Delhi -110057.
@ N ational Institu te of Public F inance and Policy

Page
1
4
27
36
60
85
97
104
113
CONTENTS
Introduction
Background
Methodology and Review of Earlier Studies
Regulation, Price Trends and Profitability
Estimates of Effective Protection and Effective Subsidy Rates
Investment Behaviour of Aluminium Companies
Post-De-regulation Experience
An Overview
References

Preface
The National Institute of Public Finance and Policy is an autonomous non-profit organisation established for carrying out research, undertaking consultancy work and imparting training in the field of public finance and policy.
The present study was done under the macro economic and industrial policy research programme sponsored by the Ford Foundation. The work was planned and conducted by Dr. B.N Goldar.
Government intervention in international trade and domestic markets exert an important influence on the structure of incentives for domestic industries and the subsequent allocation of resources. An analysis of the incentive structure is, therefore, of much significance in assessing the resource allocational implications of government policies. This study analyses effective incentives to production in the Indian aluminium industry. It is hoped that the findings of this painstaking study would be of interest to a wider audience.
The Governing Body of the Institute does not take any responsibility for the views expressed in this report. That responsibility belongs primarily to the authors.
A. BagchiDIRECTOR

A cknow ledgem en ts
This work was done under the Macro-economic and Industry Policy Research Project spon sored by the Ford Foundation. I have benefitted much from the comments of Prof. V.R. Panchamukhi on an earlier draft of this Study. Thanks are due to Shri S.B. Mann for excellent secretarial assistance and accurate word processing. I am also thankful to Mrs. Rita Wadhwa for adept editing and supervising the publication of the study.
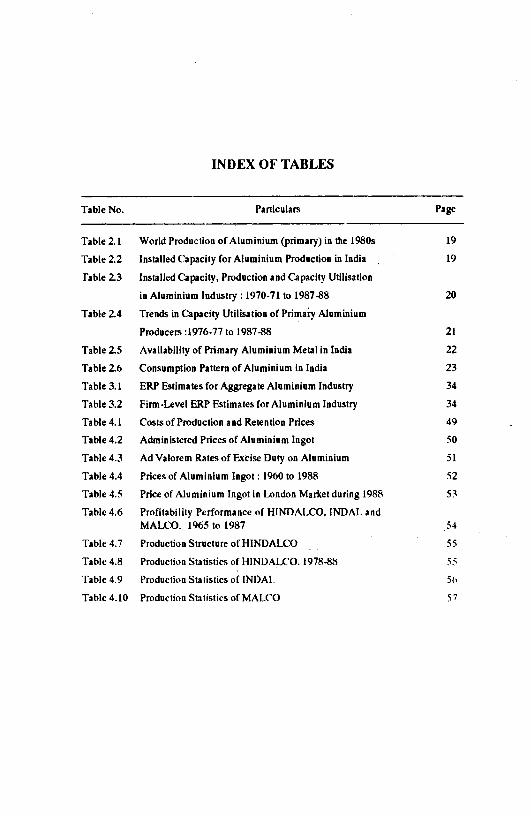
INDEX OF TABLES
Table No. Particulars Page
Table2.1 World Production of Aluminium (primary) in the 1980s 19
Table 2.2 Installed O pacity for Aluminium Production in India 19
Table 2.3 Installed Capacity, Production and Capacity Utilisation
in Aluminium Industry : 1970-71 to 1987-88 20
Table 2.4 Trends in Capacity Utilisation of Primaiy Aluminium
Producers :1976-77 to 1987-88 21
Table 2.5 Availability of Primary Aluminium Metal in India 22
Table 2.6 Consumption Pattern of Aluminium in India 23
Table 3.1 ERP Estimates for Aggregate Aluminium Industty 34
Table 3.2 Firm-Level ERP Estimates for Aluminium Industry 34
Table 4.1 Costs of Production and Retention Prices 49
Table 4.2 Administered Prices of Aluminium Ingot 50
Table 4.3 Ad Valorem Rates of Excise Duty on Aluminium 51
Table 4.4 Prices of Aluminium Ingot: 1960 to 1988 52
Table 4.5 Price of Aluminium Ingot in London Market during 1988 53
Tabic 4.6 Profitability Performance of HINDALCO, INDAL andMALCO. 1965 to 1987 54
Table 4.7 Production Structure of HINDALCO 55
Table 4.8 Production Statistics of HINDALCO. 1978-88 55
Table 4.9 Production Statistics of INDAL 56
Table 4.10 Production Statistics of MALCO 57

Page
75
76
77
77
79
80
81
81
93
93
95
98
99
100
101
INDEX OF TABLES (Cont’d.)
Particulars
Nominal Rate of Protection to Aluminium Production
1979 to 1988
Customs Duty on Aluminium Ingot
Estimates of Effective Rate of Protection to Aluminium
(Primary Metal)
Comparison of Nominal and Effective Rates of Protection
to Aluminium for Aggregate Industry
Estimates of Effective Rate of Protection for Some
Manufactured Products
Effective Protection and Effective Subsidy Coefficient
for Aluminium Firms, 1986 and 1987
Estimates of Effective Rate of Protection to Alumina
Refining and Aluminium Smelting, 1986 & 1987
Estimates of Effective Rates of Protection to Semi-Fabricated
Products. 1986 and 1987
Average Annual Rates of Investment (at 1970-71 Prices).
HINDALCO and INDAL
Determinants of Fixed Investment: Regression Results
HINDALCO and INDAL
Determinant!, of Inventory Investment: Regression Results
HINDALCO and INDAL
Price Increases in Aluminium
Prices of Aluminium, Bombay & Delhi Markets
Price of Aluminium Ingot in London Metal Exchange
Estimates of Effective Rates of Protection to Aluminium,
Rolled Products and Foils

I INTRODUCTION
In the last fourdecades of industrial development in India, the country has basically followed an inward-oriented industrialisation strategy. This strategy was adopted in the belief that the existence of a large domestic market in India and limited possibilities of boosting exports made import substitution the only easy road to rapid industrialization. The objective of self-sufficiency that India had set before herself (partly in reaction to her colonial past) and the serious problems of balance of payments that India faced in the early stages of her industrialization endeavour provided additional grounds for choosing the import-substitution industrialization strategy.
By protecting domestic firms from foreign competition through high tariffs, quantitative restrictions on imports and other controls on imports, domestic entrepreneurs were encouraged to invest in industrial activities. This applies also to industrial investment in the public sector, since import restrictions were necessary for the economic/financial viability of many public sector manufacturing units. Domestic industrial licensing on the other hand helped to reduce uncertainties in profitability that unfettered internal competition could have given rise to, and thereby contributed to a favourable climate for industrial investment.
Tariff, trade restrictions and control on capacity creation in the country must have had a major effect on the incentive structure for industrial production. Other factors that affected the incentive structure include administered price policy, exchange rate policy and distributions of crucial inputs to firms by the government. Evidently, an analysis of these effects on the incentive structure would be of much interest. Such an analysis would be relevant also in the context of current discussions on industrial liberalisation since before the controls on trade and industry are removed one should know what effect these controls hd on the factor

2 EFFECTIVE INCENTIVES FOR ALUMINIUM INDUSTRY IN INDIA
rewards in different industries and thus on the incentives to produce and invest.
The main objective of this study is to estimate and analyse effective incentives to the production of aluminium metal and semi-fabricated products. The analysis is carried out using the methodologies of effective rate of protection and effective subsidy rate, wich have found wide application in empirical studies on the effect of trade restrictions on incentives. Estimation of effective incentives has been done for 1980, 1983, and 1986 to 1988. While the incentive Structure is analysed for some years of the 1980s, trends in production, prices, cost, profitability, investment, etc. have been analysed for much longer period, covering in some cases the last three or four decades to get a better understanding of the Indian aluminium industry.
After being under government control for about 18 years, the Indian aluminium industry was deregulated recently, in March 1989. What effect the deregulation had on the industry, and in particular how did the incentive structure change after deregulation, are important to examine. Sufficient data are not available at present for the period after March 1989 to make a thorough examination of these questions possible. An attempt is made, nevertheless, to assess the effect of the deregulation on the industry using the maximum available data.
The Chapter scheme is as follows. The technology of aluminium production, and the development of the world and Indian aluminium industry are discussed in Chapter II. The methodology of effective protection and effective subsidy rates is briefly discussed in Chapter III. This Chapter also contains a review of earlier studies on effective protection to Indian aluminium industry. Chapter IV discusses the retention price system that has been in existence for primary aluminium producers. Also, in this Chapter, trends in price, cost and profitability are analysed. Estimates of effective protection and effective subsidy rates are presented and analysed in Chapter . Chapter VI is devoted to the analysis of investment behaviour of aluminium companies. Chapter VII discusses
INTRODUCTION 3
the experience of the Indian aluminium industry after it was deregulated in March 1989. In Chapter VIII the main findings of the study are summarised.
II BACKGROUND
Aluminium is a strong durable material that is corrosion resistant, a good conductor of electricity and heat and a good reflector. It is non-mag- netic and non-toxic. It has an enormous range of applications in building and construction, the electrical industry, consumer goods (e.g. utensils), transport containers and packaging, machinery and communications.
Aluminium is the most abundant metal in nature, representing about 8.2 per cent of the earth’s crust. Bauxite is the principal commercial raw material for aluminium production, and consists of hydrated aluminium oxide (alumina) mixed with impurities in the form of iron oxide, silica, titania and other minerals. There are three major forms of bauxite - Gibbsite, or alumina trihydrate (A1203 . 3H20) which contains alumina up to 65 per cent alumina, and Boehmite, or alumina alpha monohydrate (A12 03 . H20) and Diaspore, or beta monohydrate (also A12 03 . H2O) which contain alumina up to 85 per cent Although Boehmite and Diaspore contain a larger percentage of aluminium oxide as compared to gibbsite, they are more difficult to process (because they are harder and not easily soluble in caustic soda in the Bayerprocess for the manufacture of alumina which is the first step in the production of aluminium).
Bauxite mined in Surinam, Guyana, Brazil and Western Australia are only or mostly of trihydrate variety. The European bauxite (Greece, Yugoslavia, Hungary, U.S.S.R.) are, on the other hand, predominantly of monohydrate variety. Jamaican and Guinean bauxite contain both trihydrate and monohydrate. In India, the characteristics of bauxite deposits differ from location to location. In the mines of Shevoroy hills and Kolli hills (Tamil Nadu), Phutkapahar (Madhya Pradesh) and Panchapatmali hills (Orissa) bauxite is mostly of gibbsite (trihydrate) variety. On the other hand, in the mines of Raktidadar and Nanhoodadar, bauxite has a high proportion of diaspore (monohydrate) mixed with

BACKGROUND 5
gibbsite. The characteristics of bauxite obtained from various mines in India also differ in regard to the silica content.
There are three stages in the production of aluminium. In the first stage, bauxite is mined, and then crushed and beneficiated in preparation for the refining process. In the second stage, bauxite is processed into alumina at refineries using the Bayer process, invented by Karl Joseph Bayer in 1888. This is a chemical process which separates aluminium oxide or alumina from the impurities in the bauxite. In the third stage, alumina is convened into aluminium in electrolytic smelters using the method developed by Carles Martin Hall and Paul Heroult in 1886. During smelting, alumina is reduced to aluminium in a series of large electrolytic cells called “pot-1 ines”. Molten aluminium is siphoned off from the bottom of the cells and either continuously cast into commercial shapes or batch cast into ingots for rolling or direct sale.
Aluminium is technically obtainable also from non-bauxite sources, such as nepheline syenite and alunite, but at present the Bayer bauxite process has substantial cost advantage over the alternative processes. In consequence, nearly 95 per cent of the alumina produced in the world is from bauxite source and over 90 per cent of such alumina produced uses the Bayer’s process.
All bauxite mined and alumina produced do not finally get converted into aluminium. Some amounts of bauxite and alumina are consumed by refractory, abrasive, chemical and other industries. In 1985, the total production of alumina in the world was 25.5 million tonnes of which 2.3 million tonnes (9.2%) was of special grade (used in the production of abrasives, refractory, ceramics, spark plug, synthetic gems, tooth paste, etc). The proportion of special grade alumina in total alumina production was nearly 50 per cent in East Asian countries, while the ratio was only about 2 per cent in South Asian countries. It should be pointed out that smelter grade alumina, which is essentially meant to produce aluminium metal, is sometimes used by chemical industries in place of special grade when the latter variety is not easily obtainable indigenously or for cost
6 EFFECTIVE INCENTIVES FOR ALUMINIUM INDUSTRY IN INDIA
reasons. Presently in India, the abrasive manufacturers are buying smelter grade alumina and processing it further for self-use and for sale to other
3abrasive manufacturers.
In addition to primary aluminium smelters (converting alumina into aluminium) which is the main source of supply of the metal, there are smelters that process new scrap (waste from fabrication) and used aluminium scrap into secondary aluminium. The proportion of demand for aluminium being satisfied by the secondary industry is growing steadily because the energy cost of producing primary aluminium is very high and the recycling of aluminium requires less than 5 per cent of the energy needed to produce primary ingot. Presently, secondary aluminium in India is estimated to form about 10 per cent of total consumption, whereas in industrialised industries it accounts for about 30 per cent (U.S.A 30%, Japan 30%, Italy 35% and West Germany 32% in 1986).4
Technology
Bauxite Mining
Most of the bauxite produced in the world is mined by open-cast methods. There are basically three stages in bauxite mining: extraction, crushing and drying. Extraction involves removal of overburden by bulldozers, drag-lines and large-wheel excavators, with the use of explosives for hard terrains. Then, the bauxite is removed by similar methods, and the overburden is replaced to restore the surface of the mines for re-use as forest or agricultural land. The bauxite removed from the mines generally requires crushing (for which crushers are used) for ease of processing. This is followed by drying which may be done at mine- site or at the refinery. The treatment of bauxite ore prior to refining is usually restri: -u to w aning and cleaning to remove sand and some clay.Mine capacities range from approximately 80 thousand tonnes per annum (tpa) to 10 million tpa. The smallest scale operations are in India and China where a few mines operate at 50 to 60 thousand tpa. About 80 percent of the mines in developed countries have capacities greater than 5 lakh tpa

BACKGROUND 7
and IS mines have capacity of over one million tpa.5 The largest bauxite mine in India is the recently developed Panchapatmali mine of Orissa, which has a capacity of 2.4 million tpa. The Gandhamardhan bauxite project (Orissa) which is currently awaiting environmental clearance is to have a capacity of 6 lakh tpa.
Alumina Production
Bauxite is refined into alumina almost exclusively by the Bayer process. Bayer alumina plants consist of two facilities operating in series: a hydrate plant and a calcination plant. The hydrate plant transforms bauxite into alumina hydrate in a process involving the 'following four major operations 6:
1. Grinding and slurring where the crushed ore is fed to ball or rod mills and caustic soda, lime, hot water and spent liquor are added to it, forming a slurry that goes into the digestois.
2. Digestion of the slurry containing bauxite and caustic soda at elevated temperatures and pressure. At this stage, bauxite is dissolved, forming a solution of sodium aluminate, while the reactive silica combines with alumina forming an insoluble sodium aluminium silicate and consuming caustic soda and alumina in the process. (Having a high proportion of reactive silica in the bauxite is, therefore, disadvantageous).
3. Filtration and settling of the insoluble impurities (called red mud) separating them from the sodium aluminate solution which is pumped into precipitators.
4. Precipitation of the sodium aluminate which is seeded with aluminium hydrate crystals, causing about 50-60 per cent of the alumina hydrate to disassociate from the soda and precipitate out as crystals. The mixture is pumped to at least three stages of thickeners which separate the crystals from the caustic solution. The coarsestproduct is sent to the calcination department; the products of theprevious two stages are recycled to the precipitators for seed to

8 EFFECTIVE INCENTIVES FOR ALUMINIUM INDUSTRY IN INDIA
control panicle size; and the caustic solution (spent liquor) is recycledfor further use.
The calcination of alumina hydrate to alumina (Al2 03) involves the removal of moisture and of the chemical bonded hydroxide by roasting the hydrate at 1150 to 1250oC. Before the 1950s, rotary kilns were used for this purpose, but afterwards there has been widespread use of fluid bed calciners, which use 33 per cent less fuel, and are cheaper to install and maintain. Most Indian alumina plants, however, continue to use rotary kilns for calcination.
Aluminium Production
The Hall-Heroult electrolytic reduction process is used for smelting alumina into aluminium. In the smelter, alumina is dissolved in cells (pots) containing a molten electrolyte bath consisting mostly of cryolite (sodium aluminium fluoride). Excess aluminium fluoride and calcium fluoride (fluorspar) are added to lower the melting point and improve operation. A pot consists of an outer iron shell with inner carbon lining which serves as cathode. This surrounds an inner container or block of baked carbon (anode). An aluminium reduction plant has a large number (50-200) electrolytic cells electrically connected in a series (known as potlines).
The passagepf direct current through the electrolyte decomposes the dissolved alumina. Aluminium metal is deposited at the cathods and therefore collects at the bottom of the cell (below the cryolite bath) from where it is siphoned periodically (and transported to holding furnaces which feed the casting machines). Oxygen is released at the anodes where it reacts with carbon, forming a mixture of carbon dioxide and carbon monoxide. Thus, the anodes are consumed and must be replaced regular- ly. The smelting process is continuous. Alumina is added, anodes replaced, and molten aluminium periodically siphoned off without interrupting current to the cells.
Two types of reduction plants are currently inuse - (i) prebaked anode plants and (ii) Soderberg (self-baking) anode plants. The Soderberg anode

BACKGROUND 9
system produces anodes continuously by feeding unbaked carbon paste (made from calcined petroleum coke and coal tar pitch) into a casing at the top of the smelter pot. The heat of the pot bakes the paste as it moves into the pot, providing a constantly renewed anode. In the prebaked anode
gsystem, solid anodes are made ina separate process and lowered progressively into the bath as they are consumed. The prebaked anode system has a numberof advantages over the Sodeiberganode system, including lowr; consumption of anode, easy recovery of fluorines from the cell, exhaust gases and lesser pollution problems. However, in India, most smelters use the Soderberg paste method.
The smelting process is highly power intensive. Power cost is the most important cost item in the production of aluminium. Considerable R & D efforts have therefore been made in the past to reduce power requirement in aluminium production. Originally, when the Hall-Heroult process was developed in 1886, the power requirement per tonne of aluminium was about 40,000 kwh. With better cell design and operational improvement, the power requirement was reduced to about 20,000 kwh per tonne by 1925, and to-day it has come down to as low as 12,800 kwh per tonne of aluminium production at the most efficient. In India,
where smelters have electrolytic cells of early fifties design, the power consumption norms are 17 to 19 thousand kwh per tonne of
oaluminium production.
With the possibilities of further energy saving in the Bayer- Hall- Heroult process of aluminium production getting more and more limited, R & D efforts have been directed towards developing new routes of aluminium production. Notable among them are Alcoa’s Chloride process, the Toth process and the direct reduction process. In the Alcoa chloride process bauxite is converted into aluminium chloride, which is then electrolysed. It offers an energy saving of 30% to 9000 kwh per tonne of aluminium. Also, it does not require scarce cryolite and fluoride, and dispenses with expensive C.P. coke consum, .ion. The Toth process is based on a series of chemical reactions and does not require electrolysis.

10 EFFECTIVE INCENTIVES FOR ALUMINIUM INDUSTRY IN INDIA
The main advantage of this process is that it does away with the use of electricity altogether. The direct deduction process adopts a totally enclosed blast furnace route to reduce bauxite with coke to produce aluminium and silicon alloy (alusil). Thus, expensive electricity is substituted by cheaper thermal energy. It should be noted that the processes discussed above are still in the development stage and have not yet been commercialised.
Fabrication
Molten aluminium metal obtained from smelteis are transferred to melting and holding furnaces, where it is combined with recycled scrap and alloying elements (copper, magnesium, silicon and manganese). The molten aluminium alloy is treated and then cast into ingots or billets. For the manufacture of wire rods, the molten metal is directly transferred to the casting machines. From the ingots or billets, aluminium products are made through processes such as rolling, extruding, forging and drawing.10
World Aluminium Industry
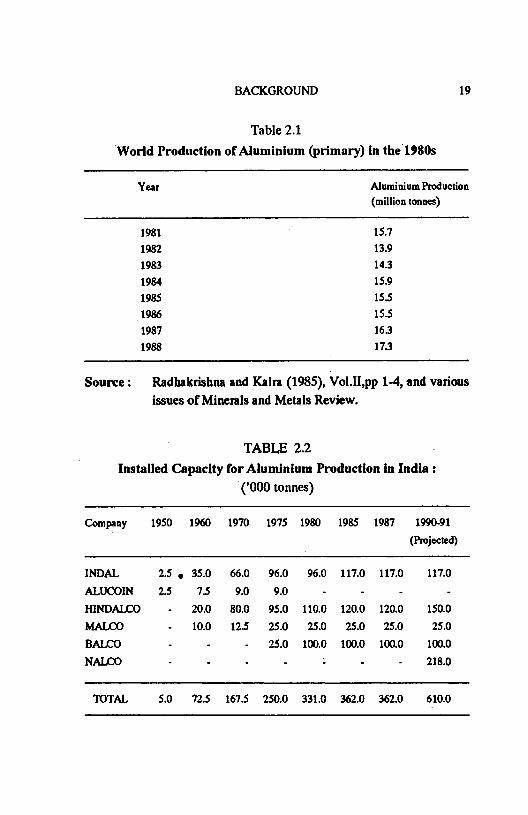
From a very small production level of 13 tonnes perannum about 100 years ago, the world aluminium industry has reached today a production level of over 17 million tonnes per annum. Analysis of production figures for aluminium (primary metal) for the last four decades brings out that in the 1950s and 1960s the world aluminium industry experienced a rapid growth at the rate of about 10 per cent per annum. The world production of aluminium was 1.5 milliontonnesinl950. It rose to 10.3 million tonnes in 1970.11 There was a marked slowdown in the growth rate of the world aluminium production after 1970. Between 1970 and 1980, the growth rate was 4.6 per cent per annum. In 1980, the production level reached 16.1 million tonnes. The growth of the world aluminium production has been very slow in the 1980s (See Table 2.1). Between 1980 and 1982, production fell by about 2.2 million tonnes. The production level reached in 1980 was surpassed only in 1987. A signfificant increase took place in 1988 when the production level reached 17.3 million tonnes. Between

BACKGROUND 11
1980 and 1988, the growth rate in production was 0.9 per cent per annum, well below the growth rate achieved in the 1970s.
The progressive deceleration of aluminium production from the endof 1960s may be attributed, among other factors, to: (1) rise in energyprices and the consequent rise in the cost of producing aluminium, (2) thescope of substitution of aluminium for other materials in electric cables,packaging, construction and transportationgettingincreasingly exhaustedin the main OECD consuming markets, and (3) secondary metal (scrap
12recovery) taking an increasing share of total consumption.
There is a high degree of vertical and horizontal integration in the world aluminium industry. A large part of the world’s productive capacity of bauxite, alumina and aluminium is owned and operated by six multinational corporations: ALCOA, ALCAN, Kaiser, Reynolds, Pechiney and Alusuisse. Till the end of the sixties, these six companies together controlled over 70% of the world production of aluminium. Their share has declined significantly since then. In 1980, the share of the six companies in total world capacity of aluminium smelting was 41%. In bauxite mining and alumina refining, the share of these companies was 54% and 56% respectively in 1978/79.13 In the 1980s, the share of the six companies has declined further. In 1985, their share in world capacity of aluminium smelting was 35 per cent.
Until the decade of the forties, bauxite, alumina and aluminium were produced mainly in Europe, the Soviet Union, the United States and to a lesser extent in the Guinas (only bauxite). Thus, during this period, the entire production cycle remained principally concentrated in the industrial nations nearer to the major metal markets. Cost considerations drove the aluminium companies to seek new sources of supply of bauxite after the Second World War, which was reflected in the rise of Guyana and Surinam as the main producers of bauxite, supplying primarily to North America. The industry got increasingly internationalised with the emergence of new important • bauxite producers : Jamaica in 1950s and Australia and Guinea in the 1960s.14

12 EFFECTIVE INCENTIVES FOR ALUMINIUM INDUSTRY IN INDIA
Escalating energy cost in the seventies and the consequent rise in transportation cost have led to significant restructuring of the world aluminium industry. There has been an increasing transfer of alumina production from developed countries to the bauxite producing countries.15 The sharp rise in thermal electricity prices in energy importing countries, coupled with the stagnation in consumption in the 1980s, have led to the closures of aluminium smelters in Japan, U.S.A. and Western Europe. Japan has been the most striking case, where aluminium smelting capacity has been reduced to less than one-fourth (from 1.4 million tonnes in 1980 to 0.3 million tonnes in 1986). In this period, production capacity of aluminium in USA h^s been reduced from 4.97 million tonnes to 3.8 million tonnes. Unless a major breakthrough occurs in the technology of aluminium production and/or in low cost power generation, the geographical distribution of aluminium smelting capacity is likely to change in future towards the developing regions of Asia and Africa with large unutilised potentials of hydro-electricpowerand to other regions having abundant natural gas supply or cheap hydro- electric power.
While some countries were closing down aluminium smelters, some others were installing new smelting capacities. Indeed, in the decade ending 1982, there was a substantial expansion in the world capacity of smelting aluminium.16 As a result of the continued new investment and deceleration in demand for primary aluminium, there has beena sharp fall in capacity utilization. According to one estimate, capacity utilisation in aluminium smelters in non-socialist countries was 77 per cent in 1983 as against 93 per cent in 1973. Despite adverse world market conditions, investment in additional aluminium smelting capacity has continued in the 1980s. The world annual production capacity of aluminium was 17.4 million tonnes in 1982. In the next six years, the capacity got raised to 18.8 million tonnes.
Recently, there has been a significant improvement in capacity utilisation in aluminium production. In 1988, the average rate of capacity

BACKGROUND 13
utilisation in aluminium smelteis in market economy countries was over 94 per cent which is the highest rate achieved since 1974.
Substantial expansion in production capacity for aluminium is expected in the 1990s. From 18.8 million tonnes in 1988, the world capacity of aluminium smelting is expected to increase by the mid-1990s to about 25 million tonnes (and may even reach 27 million tonnes).
World Market
Although the share of the six multinationals in aluminium industries has declined over time, they continue to dominate international trade in bauxite, alumina and aluminium. The major part of international trade in bauxite and alumina takes place as internal transfers between affiliates of the six companies mentioned above. The remaining part of the trade in bauxite and alumina is mostly done on the basis of long-term contracts.
Since most of the aluminium production in the world takes place in developed countries and consumed by affiliated fabricators, there is only a limited spot market for aluminium metal. While more free metal is entering the market as new producers emerge, the six companies continue to dominate price setting of aluminium. Since 1978, aluminium has been traded on the London Metal Exchange (LME), which provides a source of spot price quotations. However, the volume traded on LME, while growing, still represents a very small percentage of total sales.
The price of aluminium ingot has been relatively stable overtime and has not increased as much as the prices of competing metals. In part, this is due to the big producers’ strategy to discourage new entrants by keeping the price low and increasing it only in line with costs. Also, the fact that there has been reasonably close matching of capacity to demand has contributed to price stability. Between 1960 and 1973, the price of aluminium in London market rose from $513 to $669 per tonne, reflecting a barely 2 per cent increase per annum. Between 1973 and 1978 there was a sharp increase in the price of aluminium by 56%, i.e., an annual growth rate of about 9%. After 1978, there have been fluctuations in aluminium
14 EFFECTIVE INCENTIVES FOR ALUMINIUM INDUSTRY IN INDIA
price from year to year, reflecting primarily short-term excess demandand excess supply situations, but the trend growth rate has been low.Between 1978 and 1986, the increase in aluminium price was from $ 1045to $1152 per tonne, implying a growth rate of about 1% per annum. Therehave been sharp increases in aluminium price in 1987 and 1988. The pricewas $1560 per tonne in 1987 and over 2500 US$ per tonne in1988.17From 1978 to 1987, the spot price for alumina remained mostlyin the range $100 to $150 per tonne. There was a sharp increase in theprices of alumina in 1988. From $150 per tonne in the beginning of theyear, the spot price briefly touched $700 per tonne. In mid-1988, theaverage price paid for alumina by world smelters was about $200 per
17tonne.
Indian Aluminium Industry
The aluminium industry in India started with the production of household utensils from imported sheets and circles. A sizeable utensils industry was built up from 1929 onwards but indigenous manufacture of aluminium metal was attempted only in 1937. A public limited company - Aluminium Corporation of India (ALUCOIN) - was formed to set up an integrated plant near Asansol (West Bengal) for the manufacture of aluminium metal, utilising the bauxite available from Ranchi and Plamau districts of Bihar. Production of aluminium started in 1944. The initial installed capacity for aluminium ingot was 2000 tonnes per annum (tpa).
Another company - Aluminium Production Company of India Ltd. - was incorporated in 1938 as a private limited company. In 1944, it was converted into a public limited company under its present name, Indian Aluminium Company Ltd. (INDAL). The company commenced operations in 1941 with the fabrication of imported ingots into sheets and circles at Belur (West Bengal). Production of aluminium from imported alumina started in 1943 at Alwaye (Kerala) with an installed capacity o f2500 tpa, and production of alumina from indigenous bauxite in 1948 at Muri (Bihar) with an installed capacity of 6500 tpa. At present, this company has three smelters at Alwaye (I^erala), Hirakud (Orissa) and Belgaum

BACKGROUND 15
(Karnataka). The installed capacities of these three smelters are 20, 24 and 73 thousand tpa respectively, i.e. 117 thousand tpa in total. The company also has semi-fabrication capacity of about SO thousand tpa at different locations in the country. The company has foreign collaboration with ALCAN (Canada), which holds 50.5% equity share (in 1986).
18The Hindustan Aluminium Company (HINDALCO) was registered as a public limited company in 1958. It started with an initial capacity of 20 thousand tpa of aluminium metal production. The alumina plant and smelter were located at Renukoot in Uttar Pradesh. The unit has now expanded to 120 thousand tpa of installed capacity. It has achieved the distinction of being the largest single integrated aluminium smelter plant in India. The present licensed capacity of the firm for rolling and extrusions is about 34 thousand tpa, and the licensed capacity for all semi- fabricated products is about 55 thousand tpa. The company has foreign collaboration with Kaiser (USA), which has an equity participation of 26.7% (in 1986).
The Madras Aluminium Compa ny Ltd. (MALCO) was set up in 1960 as a public limited company. Production of alumina and aluminium commenced from 1965. The unit was located at Muttur (Tamil Nadu). The initial installed capacity of the smelter was 10 thousand tpa, which has now expanded to 25 thousand tpa. The company has licensed capacity for semi-fabrication of 17.5 thousand tpa. The Company has foreign collaboration with Montecatini (Italy), which has an equity participation of 27%.
The public sector entered the aluminium industry with the setting up of the Bharat Aluminium Company Ltd. (BALCO) in 1965. The company established an integrated aluminium complex at Korba in Madhya Pradesh. The company had technical collaboration with Chemokomple'x (Hungary) for the alumina plant and with Tsvetmetromexport (USSR) for the smelter. The alumina plant was commissioned in April, 1973 and the first phase of the smelter (25,000 tpa capacity) in May 1975. At present, BALCO has installed capacity of 1 lakh tpa of aluminium production.

16 EFFECTIVE INCENTIVES FOR ALUMINIUM INDUSTRY IN INDIA
The company has semi-fabrication capacity of 82 thousand tpa at Korba19and 6.4 thousand tpa at Bidhanbag.
Another big aluminium unit has recently come up in the public sector. This is the aluminium complex set up in Orissa by the National Aluminium Company (NALCO). The project comprises of a bauxite mine of 2.4 million tpa capacity at Panchapatmali (Koraput district), an alumina plant of 8 lakh tpa capacity at Damanjodi (Koraput district), a 2.18 lakh tpa smelter at Angul (Dhenkanal district), a captive power plant of 600 MW capacity (5 units of 120 MW each) at Angul and related port facilities at Vishakapatnam for export of alumina and import of caustic soda. The company has technical collaboration with Pechiney (France).
The setting up of mining facility and alumina plant for the NALCO project has been accomplished in accordance with the time schedule of implementation. But, considerable teething problems have been faced in regard to smelter. Phase I of the smelter was scheduled to be completed by December 1986 and Phase II by September 1987. Completion of the first phase of the smelter has taken two years more than scheduled, and the full capacity of both phases of 2.18 lakh tpa is expected to be achieved only during 1990-91.
In 1987-88, NALCO’s production of aluminium metal was 25 thousand tonnes. With the completion of phase I of the smelter, the production increased in the following year, 1988-89, to 78.8 thousand tonnes. In its very first year of commercial production, NALCO earned foreign exchange by exporting 76.8 thousand tonnes of alumina. During 1988-89, NALCO exported 380 thousand tonnes of alumina and 15 thousand tonnes of aluminium metal, earning Rs.235 crores of foreign exchange.
tailed capacity for aluminium production (primaryetal) in different companies and the industry as a whole for selected year in the past is shown inTable 2.2. It is seen from the table thatthe total installed capacity has increased from 5 thousand tonnes in 1950 to 3.62 lakh tonnes in 1987.

BACKGROUND 17
With the completion of the NALCO project, there will be an addition to the total installed capacity by 2.18 lakh tonnes. Also, HINDALCO is building its sixth potline which will take its aluminium smelting capacity to 1.5 lakh tonnes. Thus, the projected total installed capacity for 1990-91 is 6.1 lakh tonnes.
Currently, large expansions in capacity are being planned by the major domestic producers of aluminium. NALCO hopes to add new production lines and take its capacity from 218 thousand tonnes to 330 thousand tonnes. HINDALCO aims at raising its capacity from 120 thousand tonnes to 150 thousand tonnes in 1990 and has plans to raise it subsequently to 250 thousand tonnes (with matching expansion in alumina capacity and downstream rolling and extrusions). BALCO has plans for raising its capacity from 100 thousand tonnes to 150 thousand tonnes. If these expansion plans get approved and materialised the country’s production capacity of aluminium will go up to 8.72 lakh tonnes by the mid-1990s.
Time-series on installed capacity and production in the aluminium industry for the period 1970-71 to 1988-89 are presented in Table 2.3, in which capacity utilisation rates are also given. It is seen from the table that in this period the growth in aluminium production has been slower than the growth in installed capacity for aluminiu. This is reflected in a significant downward trend in the rate of capacity utilisation, as the last column of the table brings out.
Company-wise capacity utilisation figures for the period 1976-77 to 1988-89 are presented in Table 2.4. It is seen from the table that BALCO has made a remarkable improvement in the rate of capacity utilisation from 25.1% in 1976-77 to 96.5% in 1986-87. Capacity utilisation in HINDALCO has also improved substantially. On the other hand, there has been a marked dccline in the rates of capacity utilisation in INDAL and MALCO. The rate of capacity utilisation in INDAL and MALCO has been quite low in rccent years. This is attributable largely to inadequate and irregular power supply to these units.

18 EFFECTIVE INCENTIVES FOR ALUMINIUM INDUSTRY IN INDIA
Table 2.5 shows trends in the availability of aluminium in India which is an indicator of the level of consumption of aluminium in the country. In 1950-51, apparent consumption of aluminium (in terms of availability) was about 15 thousand tonnes. In the next twenty yeas, there was a rapid growth in the consumption of aluminium in India. Thus, in 1970-71, apparent consumption of aluminium was 174 thousand tonnes, which gives a growth rate of 13% per annum. This rapid growth in domestic demand for aluminium was met by increasing production of aluminium in the country, and the dependence on imports wa greatly reduced. In 1950-51, imports constituted 72.5% of the availability. In 1970- 71, this ratio was only 3.7%. In comparison with the 1950s and 1960s, the growth in aluminium consumption in the 1970s was much slower. Thus, between 1970-71 and 1979-80, the growth rate in availability was 3.6% per annum. The growth rate of aluminium consumption was a little higher in the 1980s. Between 1979-80 and 1987-88, the growth rate in availability was 4.6% per annum. However, in this period there was greater dependence on imports.20
Table 2.6 shows the consumption pattern of aluminium for selected years. It is seen from the table that in 1950 nearly half of the consumption of aluminium in the country was for household and consumer durables (mostly utensils). This proportion fell sharply over time. In 1984, only about a fifth of the total consumption of aluminium was for this purpose. On the other hand, the use of aluminium for electrical applications gained substantial in importance from 20 per cent of total consumption in 1950 to 50 per cent of total consumptin in 1984. This has come about through the increasing substitution of copper conductors by aluminium, and the rapid growth of the power sector. It may be mentioned in this connection that in recent years the off-take of electrical conductor (EC) grade aluminium has been quite depressed because State Electricity Boards (who are the main consumers) ave been facing severe financial constraints and in their investment programmes, relatively greater emphasis is being put on generation than on transmission and distribution, compared to the investment pattern prevailing in the 1970s.
BACKGROUND 19
Table 2.1World Production of Aluminium (primary) in the 1980s
Year Aluminium Production(million tonnes)
1981 15.71982 13.91983 14.31984 15.91985 15.51986 15.51987 16.31988 173
S ource: Radhakrishna and Kalra (1985), Vol.II,pp 1-4, and variousissues of Minerals and Metals Review.
TABLE 2.2Installed Capacity for Aluminium Production in India :
(’000 tonnes)
Company 1950 1960 1970 1975 1980 1985 1987 1990-91(Projected)
INDAL 2.5 . 35.0 66.0 96.0 96.0 117.0 117.0 117.0ALUCOIN 2.5 7.5 9.0 9.0 - - - -HINDALCO - 20.0 80.0 95.0 110.0 120.0 120.0 150.0MALCO - 10.0 12.5 25.0 25.0 25.0 25.0 25.0BALCO - - - 25.0 100.0 100.0 100.0 100.0NALCO - - - - - - - 218.0
TOTAL 5.0 72.5 167.5 250.0 331.0 362.0 362.0 610.0

20 EFFECTIVE INCENTIVES FOR ALUMINIUM INDUSTRY IN INDIA
TABLE 2.3
1980 Installed Capacity, Production and Capacity Utilisation in Aluminium Industry : 1970-71 to 1987-88
Year Installed Capacity
(’000 Ml)
Production
(•000 MT)
Capacity Utilisation (per cent)
1970-71 156 167 107.11971-72 173 181 104.61972-73 195 176 90.31973-74 195 148 75.91974-75 210 127 60.51975-76 246 187 76.01976-77 266 209 78.61977-78 291 179 61.51978-79 321 214 66.71979-80 321 192 59.81980-81 321 199 62.01981-82 321 207 64.51982-83 321 208 64.81983-84 362 220 61.01984-85 362 276 76.21985-86 362 264 72.91986-87 362 257 71.01988-89 471 357 75.8
* includes new pots installed by NALCO.
Source: Thangaraju and Kothari (1986) and various issues of Mineraland Metals Review.

BACKGROUND 21
TABLE 2.4Trends in Capacity Utilisation of Primary Aluminium Producers :
1976-77 to 1987-88(Percent)
CompanyYear
BALCO HINDALCO INDAL MALCO IndustryAverage
1976-77 25.1 88.2 82.2 71.6 78.61977-78 31.6 57.8 68.5 74.9 61.51978-79 31.9 70.7 83.8 86.2 66.51979-80 30.5 71.5 66.4 8 8.4 59.81980-81 28.4 69.8 75.8 88.0 6X01981-82 34.8 63.1 70.5 55.4 64.51982-83 43.5 74.3 54.2 48.6 64.81983-84 60.4 75.0 47.0 26.4 61.01984-85 87.4 105.0 41.4 56.8 76.21985-86 96.5 100.5 32.3 38.8 72.91986-87 96.5 101.9 23.8 41.2 71.01987-88 91.0 102.3 25.8 34.0 66.0*1988-89 93.4 104.1 42.3 42.4 75.8*
* including NALCO.
S ource: Thangaraju and Kothari (1986), and various issues ofMinerals and Metals Review.

22 EFFECTIVE INCENTIVES FOR ALUMINIUM INDUSTRY IN INDIA
TABLE 2.5Availability of Primary Aluminium Metal in India
(’000 tonnes)
Year Production Imports Availability Import- Availability Ratio (%)
1950-51 4.1 10.8 14.9 7151960-61 18.3 25.4 43.7 58.11970-71 168.8 6.4 174.0 3.71971-72 181.5 21.2 202.7 10.51972-73 ‘ 174.8 1.7 176.4 1.01973-74 147.8 1.6 149.5 1.11974-75 126.6 2.7 129.3 2.11975-76 187.3 5.1 185.1 2.81976-77 208.7 03 187.3 0.21977-78 178.5 9.0 186.9 4.81978-79 213.7 32.2 245.9 13.11979-80 191.8 51.1 239.5 21.31980-81 199.0 117.6 309.1 38.01981-82 206.8 28.7 232.1 5.71982-83 208.1 193 227.5 8.51983-84 221.0 18.0 239.0 7.51984-85 276.0 55.0 331.0 16.61985-86 265.0 25.0 290.0 8.61986-87 257.0 65.0 322.0 20.21987-88 278.0 65,0 343.0 19.0
Source: Compiled from Lai and Abroi (1986) and Minerals andMetals Review, August, 1988 (p.15).

BACKGROUND 23
TABLE 2.6 Consumption Pattern of Aluminium in India
(Per cent)
Use\Year 1950 1960 1970 1980 1984
ElectricalHousehold & consumer
20 40 48 52 50
durables 52 24 28 18 18Transportation 6 13 8 12 15Canning and packaging 10 11 8 6 7Building and construction 2 2 2 6 7Machinery, equipment andothers 10 10 6 6 3
TOTAL 100 100 100 100 100
Source: Thangaraju and Kothari (1986).

24 EFFECTIVE INCENTIVES FOR ALUMINIUM INDUSTRY IN INDIA
NOTES
1. Brown and McKern (1987), p.22.
2. See Thangaraju and Kothari (1986), pp 19-26. For more details about mining of bauxite in general and in Indian context see Brown et.al. (1983) pp 6-11, Brown and McKern (1987), p 25- 26, Das Gupta(1985) and NCAER (1983), pp 70 - 94.
3. For more details about spccial grade alumina, see Ramaratnam (1987).
4. See Rao (1988), p 56.
5. Brown and McKern (1987), p 25-26.
6. Brown et.al. (1983), pp 11-13. Also see Radhakrishna and Kalra (1987), Vol.II, Appendix 7.1.
7. Although cathods are not consumed during metal production, they have a limited life of 4-5 years due to thermal and electrical stresses, and need to be replaced from time to time.
8. Ground C.P. Coke is mixed with hot coal tar pitch to bind it into a block and then pressed in a mould to form ‘green’ anode. This is then baked slowly at a temperature upto 1100-1200 C for about 15 days.
9. “Energy Conservation in India’s Aluminium Plants”, Minerals and Metals Review, August 1987, p 46.
10. For details of fabrication methods, see Thangaraju and Kothari(1986), pp 44-53.
11. Radhakrishna and Kalra (1987), Vol.I, p .6 ,35, and Vol.II, p .l- 4.
BACKGROUND 25
12. Between 1976 and 1986, global consumption of primary aluminium increased at the rate of 1.6 percent per annum, while the consumption of scrap increased at the rate of S.2 per cent per annum (Minerals and Metals Review, August 1989, p.40). In 1988 total production of primary aluminium in non-socialist countries was about 14 million tonnes. The production of secondary aluminium in these countries was over 5 million tonnes.
13. Transnational Corporations in the Bauxite/Aluminium Industry, UNCTC, 1981, as cited in Lai and Abroi (1986).
14. Currently, Australia and Guinea are the top two bauxite producing countries in the world. Their production in 1988 was 36.2 and 16.8 million tonnes respectively. In terms of bauxite production, Brazil, Jamaica and U.S.S.R. are in the 3rd, 4th, and 5th place. In 1988, the production of these three countries were 7.7, 7.4 and 5.9 million tonnes respectively. Bauxite production in India was 2.8 million tonnes in 1987 and 3.4 million tonnes in 1988.
15. Since more bauxite is now refined to alumina in the country of origin, there has been a steady decline in the trans- ocean shipments of bauxite in the 1980s while alumina trade has been growing (Minerals and Metals Review, Annual 1989, p.49).
16. Brown and McKern (1987), pp. 13-14.
17. To protect their earnings against increasing volatity of aluminium prices and to secure fresh outlets for their metal, more and more major aluminium producers are moving downstream and investing in fabrication plants.
18. Recently, the company has changed its name to HINDALCO industries Ltd.
19. Minerals and Metals Review, August 1986, p 10.
26 EFFECTIVE INCENTIVES FOR ALUMINIUM INDUSTRY IN INDIA
20. In 1987, imports of aluminium were 78.1 thousand tonnes, and the import-availability ratio was 22.7 per cent. There was a drastic reduction in imports of aluminium in 1988. Imports fell to 7.3 thousand tonnes, and the import-availability ratio came down to 2.1 per cent. This is attributable to a sharp rise in the international price of aluminium and a substantial increase in domestic production of aluminium (by 26.1 per cent). Imports of aluminium have increased again in 1989. In the first ten months of the year, imports of aluminium were 26 thousand tonnes, and the import-availability ratio was about 7 per cent.

I l l METHODOLOGY AND REVIEW OF EARLIER STUDIES
For systematically describing, measuring and analysing the influence of protective and other incentive policies on domestic industries, effective protection and effective subsidy indicators are commonly used. The methodology of measuring effective protection and effective subsidy has been discussed in great detail in Pursell-Roger (1985) Manual for Incentive and Comparative Advantage Studies.1 Therefore, to save space, it is only briefly discussed here.
Effective Protection
Nominal protection is concerned with the impact of trade related incentives to domestic producers (tariffs, quotas, etc.) on the prices of products. Nominal protection measures show to what extent product prices are raised or lowered by such incentives. Let PDi denote the domestic market (protected) price of commodity i and let PWi be the world price of the product, then the nominal protection coefficient for the commodity (NPG) may be defined a s :
NPG = PDi / PWi (3.1)
In this definition, the world price or the border price is generally the cif import price or the fob export price. If the country does not actually import or export the commodity, the border price is estimated, considering possible external sources of supply, price quotations of such ex- porters, and port-to- port transportation costs. Studies attempting greater sophistication in the estimation of NPC also take into account the location of domestic producers and inland transportation costs.
Consider the case of a homogeneous good which is both produced and sold domestically, and imported under competitive conditions. It is assumed further that consumers are indifferent between the locally

28 EFFECTIVE INCENTIVES FOR ALUMINIUM INDUSTRY IN INDIA
produced and imported versions of the good. Imports are subject to an ad valorem tariff on cif value, and this is the only relevant government incentive. The country concerned is small in relation to the global trade in the good and can import as much as it wants at a given world price.
In this case, the nominal rate of protection is equal to the rate of tariff. This equality will, however, not hold in general. Thus, if there are quantitative restrictions on imports of the commodity, the domestic price may exceed the world price by a margin greater than the tariff rate. Similarly, if the tariff rate is so high that the good is not imported at all, then the gap between the domestic price and the world price may be lower than the tariff rate. In this situation, the tariff is partially redundant. Such redundancy in tariff may occur because competition among domestic producers keeps the price low, or there is administrative price control.
Information about the structure of nominal protection across products is useful for analysing the impact of incentives on prices and hence on the pattern of consumption. But, to study the impact of incentives on production activity (or the value adding process of production), one requires the inter-industrial structure of effective protection rates which take into account protection to output and to intermediate inputs of the activities.
The efective rate of protection (ERP) to an activity is defined as the difference between value added in that activity at domestic (protected) prices (VAd) and value added at world or border (freely traded) prices (VAw) expressed as a proportion of value added at world prices, i.e.,
ERP = VAd-VAw (3.2)VAw
It shows to what extent the income of the primary factors engaged in the activity goes up as a result of protection.
The concept of ERP can be expressed in another way. If both the final product and the material inputs used in the production could be bought or sold in world markets at given prices, then with a given exchange rate there would be certain processing margin into which a

METHODOLOGY AND REVIEW OF EARLIER STUDIES 29
producer in a particular country will have to fit his processin costs (cost of labour, land and capital including an acceptable profit margin). Tariffs and other measures, through their effects on prices, widen or narrow this processing margin. Effective protection is then simply the difference between the observed processing margin, and what that margin would be in the absence of tariffs and other interventions.
Let Pd be the domestic price of a commodity and Id be the value of intermediate inputs in domestic prices needed to produce one unit of the commodity. Then, the value added at domestic prices by producing one unit of the commodity is
VAd = Pd-Id (33)
which is also the observed processing margin. Let Pw be the world price of the product and NPCothe nominal protection coefficient for output, then the following relationship holds
Pw = Pd / NPCo (3.4)
Similarly, let Iw be the value of intermediate inputs at world prices. Then, the average nominal protection coefficient for intermediate inputs NPC1, may be derived as
NPC1 = Id / Iw (3.5)
or
Iw = Id / NPC1 (3.5a)
Using these notation, the value added at world prices may be written as
VAw = Pw — Iw (3-6)
= (P d /N P C o)-(Id /N P C 1) (3.6a)which is clearly the processing margin in the absence of tariffs and other

30 EFFECTIVE INCENTIVES FOR ALUMINIUM INDUSTRY IN INDIA
interventions. The effective protection coefficient (EPC) and the effective rate of protection (E^P) may be defined as
EPC = VAd (3l7)VAw
Pd - Id________ (3.7a)(Pd/N PCo) - (Id /NPC1)
ERP = E P C -1 (3.8)
The measurement of ERP gets complicated once it is recognised that some intermediate inputs (e.g., power) may not be tradeable. Various conventions have been developed to deal with non-tradeable intermediate inputs in the framework of effective protection.
The simple Balassa method assumes that the supply of non- tradeable intermediate inputs is infinitely elastic and that the protective structure has no effect on their prices. Under this approach non-tradeable intermediate inputs are treated in the same way as tradeable inputs with zero nominal protection, i.e., the non-tradeable intermediate inputs are deducted from the gross output along with tradeable inputs to get value added.
The simple Corden method assumes that the supply of non- tradeable intermediate inputs is less than infinitely elastic and that the protective structure affects their prices in much the same way as it affects the income of primary factor. Under this approach, non-tradeable intermediate inputs are lumped in with value added aggregate. Measured in this manner, effective protection to an activity includes protection to the primary factors used in the activity and protection to industries producing non- tradeable intermediate inputs used in the activity.
In the more sophisticated Corden approach, non-tradeable intermediate inputs are broken down into their value added and tradeable goods components. The value added component of the non-tradeable

METHODOLOGY AND REVIEW OF EARLIER STUDIES 31
intermediate inputs is added to the value added in the original tradeable good activity. The tradeable input component is treated along with other tradeable inputs.
The more sophisticated Balassa approach maintains the assumption of non-tradeable intermediate inputs being supplied at constant cost, but allows for protection induced changes in the prices of tradeable inputs used in the production of non- tradeable goods.
While the choice of themethod significantly affects absolute values of ERPs, the ranking of industries may not be affected very much. The simple Coiden and Balassa methods are easy and quick to compute, but obviously some information is lost. The sophisticated Corden method is probably conceptually most correct, but it clubs protection to processing activity with associated non-tradeable intermediate input activities, and requites much more data than the simple Corden and Balassa methods.
Effective Subsidy
ERP shows how tariff and other such interventions affect the prices of output and intermediate inputs and thereby influence the attractiveness of production activities. It should be recognised that concessional credit, tax preference and subsidy on intermediate inputs would also influence the attractiveness of production activities. To take into account the influence of such measures on the attractiveness of a production activity, effective subsidy indicators are used. Let VAddenote value added at domestic prices, VAw value added at world/border prices and S the net value of subsidies, then the effective subsidy coefficient (ESC) may be defined as
(3.9)
and the effective rate of subsidy (ERS) as
ERS = E S C -1 (3.10)

32 EFFECTIVE INCENTIVES FOR ALUMINIUM INDUSTRY IN INDIA
It should be noted that while tariff, quota etc. affect the processing margin of a commodity, the subsidies mentioned above affect the processing costs without affecting the processing margin into which these costs must fit. Another point to be noted is that in the computation of the subsidies some norms have to be used. Thus, to compute credit subsidy one has to compare the rate of interest on debt capital actually paid by a firm and the average or normal rate of interest. Similarly, actual tax rate on profits has to be compared with the normal tax rate, and actual power tariff with the average power tariff or the cost of power generation. Evidently, the value of et subsidy, S in eq. 3.9, can be negative, which would indicate that the incentive for production created by tariff and other such interventions is paitly offset by government policies relating to credit, taxation and public sector pricing.
Earlier Studies on Effective Protection for Indian Aluminium Industry
There have been two earlier studies on effective protection for Indian aluminium industry. These are the studies of Panchamukhi (1978) and Gupta (1987). In both the studies, ERP has been estimated for production of primary aluminium from bauxite (including the stage of alumina production). Panchamukhi has presented ERP estimates for two units and the industry (aggregation of the two units) for the period 1959 to 1970. ERP estimates for a third unit has been presented for 1969 and 1970. Gupta has presented ERP estimates for 1967 and 1977. He has covered all the four primary aluminium production firms in the country - one in the public sector and three in the private sector. For the firm which has plants in different locations, plant-wise ERP estimates have been presented. Gupta has estimated ERP using both the simple Balassa method and the simple Corden method (discussed above).
In Table 3.1, ERP estimates for the aggregate aluminium industry made by Panchamukhi (1978) and Gupta (1987) are presented. These estimates bring out that the Indian aluminium industry enjoyed a high level of protection in the early 1960s. The estimates indicate that there

METHODOLOGY AND REVIEW OF EARLIER STUDIES 33
was a downward trend in the level of effective protection to aluminium industry after 1963. ERP estimates for 1970 and 1977 are found to be negative from which it appears that the industry was disprotected in those and probably most other years of the 1970s.
Firm-level estimates of ERP made by the two authors are presented in Table 3.2. The estimates reveal considerable inter- firm variation in the level of effective protection (also, year to year variations in ERP are quite sharp). The observed variations in ERP across firms, are attributed by theauthors to the inter-firm differences in regard to scale of production, capacity utilisation, technology, sources of input supply, managerial efficiency, etc.
One limitation of the two studies is that these consider only effective protection to primary aluminium production activity. Since primary aluminium producers, themselves, fabricate a large part of their metal production, for a proper understanding of the incentive structure of aluminium industry, i.t is important to estimate also effective protection to fabricated products.

34 EFFECTIVE INCENTIVES FOR ALUMINIUM INDUSTRY IN INDIA
Table 3.1ERP Estimates for Aggregate Aluminium Industry
(per cent)
Year Panchamukhi GuptaEstimate 1 Estimate 2
1959 71.71960 132.41963 m i1966 44.91967 21.6 5.9 4.01969 9.71970- -19.41977 -46.7 -19.2
Source: Panchamukhi (1978) and Gupta (1987).
Table 3.2Firm-Level ERP Estimates for Aluminium Industry
(percent)
Year Firm 1 Firm 2 Firm 3 Finn 4
1969 16.8 1.1 -304.91970- 23 -25.8 -52.41977- 6.1 -40.8 -19.9 1.1
Source: Panchamukhi (1978) and Gupta (1987).

METHODOLOGY AND REVIEW OF EARLIER STUDIES 35
NOTES
For theoretical discussion on effective protection, see Corden (1971, 1985) and Tower (1984).
Alternatively, one estimates the fob export price for the commodity in question considering the prices at which major importing countries are buying and the transportation costs.
An alternative approach to the analysis of effective incentives for domestic production involves a comparison between a situation in which tariffs, quantitative restrictions on imports, domestic taxes, subsidies, etc. are all present with anothersituation in which all these are absent. Comparing value added in the two situations, a measure of “total protection” may be obtained. This will be different from the effective protection and effective subsidy coefficients discussed above. It should be possible to decompose the “total protection” measure into parts that can be attributed to trade restrictions, subsidies, etc. Though what is needed to compute the effective protection and effective subsidy coefficients.

IV REGULATION, PRICE TRENDS AND PROFITABILITY
The Indian aluminium industry has been under government regula- tionsince 1970.1 There was regulation on pricing, and also on distribution of aluminium. After being under government regulation for about 18 years, the industry was deregulated recently, in March 1989. Though it would have been quite interesting to make a comparative study of price, cost, profitability, and effective protection and subsidy rates for the Indian aluminium industry before and after the deregulation, it has not been possible to do so due to non-availability of the data required for such analysis for the period after March 1989. Thus the period coveted for the empirical analysis presented in this and the next Chapter is upto the end of 1988 and the post- deregulation experience of the Indian aluminium industry is taken up separately in Chapter VII.
Prior to 1975, the government exercised informal control over the distribution ofaluminium. From 1975, the distribution was brought under the purview of the Aluminium Control Order. By notifications issued in July 1975, each producer was required to produce 50 per cent of his metal production as EC (electrical conductor) grade in the shape of ingots and wire-rods, for supply to units against allotments made by the Aluminium Controller. In imposing this control, the objective of the government was to ensure adequate availability of EC grade metal for the manufacture of cables and conductors needed for rural electrification programme. However, in later years (mid-1980s), this control on distribution caused serious problems for aluminium producers, since the State Electricity Boards slowed down investment in transmission and distribution (due to financial difficulties and for other reasons), and in consequence the off-take of EC grade metal fell far short of the stipulated 50 per cent production level. The share of EC grade metal in total apparent consumption was 61 per

REGULATION, PRICE TRENDS AND PROFITABILITY 37
cent in 1976-77. This ratio came down to about 42 per cent in 1983-84, and further to about 35 per cent in 1987-88.
The system of pricing which has been prevalent since October 1978 (till February 1989) is as follows. There was a retention price for each producer based on cost of production plus a post standard tax return on shareholders’ funds. The rate of return was linked to the level of capacity utilisation. It ranged from 7% at 55% capacity utilisation to 12% at 90% capacity utilisation. There was a controlled pool price (basic price), which was a weighted average of retention prices of the producers, the weights being the production tonnages. A producer whose retention price was lower than the sale price had to pay the difference between the sale price and retention price for each tonne of metal sold into an account called the Aluminium Regulation Account. A producer whose retention price was higher than the sale price drew from the said account the difference between the sale price and retention price for each tonne of metal sold.aControlled pool prices were Gxed by the government for CG ingot , EC grade ingot and EC grade wire-rods. Prices of semi-fabricated products (sheets, plates, etc.) were not controlled by the government. From October 1979, the government brought imported aluminium under the ambit of price control and introduced a formula for calculation of ‘aluminium price equalization amount’ to form a part of the Aluminium Regulation Account.
Costs and Retention Prices
Radhakrishna and Kalra (1987) have analysed increases in cost of production and retention prices for aluminium producers for the period 1978 to 1983. Their analysis brings out that the increases in retention prices granted by the government has not always kept pace with increases in cost. Table 4.1 shows cost of production and retention prices for the aluminium producers for different years from 1978 to 1983. It was seen from the table that in the late 1970s and early 1980s the cost of production of aluminium in BALCO was much higher than that in INDAL, HIN- DALCO and MALCO. In 1978 and 1979, the retention prices covered

38 EFFECTIVE INCENTIVES FOR ALUMINIUM INDUSTRY IN INDIA
the cost of production for INDAL, HINDALCO and MALCO. In the next few years, the cost of production rose sharply. The retention prices were revised on July 1980, March 1981, and December 1981. However, there was no revision during 1982 and 1983. It is seen from the table that in 1982 and 1983, the cost of production was higher than the retention price in all the four firms.
Subsequently, retention prices were revised in May 1984, December 1985, March 1987, January 1988, and November 1988. Making a comparison between costs of production and retention prices for 1987 and 1988 (up to June), it is found that in 1987 cost was higher than retention price for one firm and in 1988 this was so for three firms out of four.4
Between 1978 and 1988, there were large increases in cost of production of aluminium in HINDALCO, INDAL and MALCO. The cost figures for 1988 were nearly three times those for 1978. These increases in cost of production are attributable to increases in the prices of inputs. One major source of cost escalation was the hike in the power rates. Power cost constitutes about 40 per cent of the total cost of producing aluminium. The average (weighted) power rate for HINDALCO, INDAL and MALCO was 14 paise per KWH in 1979.5 It increased to 50 paise per KWH in 1988. This alone would raise the cost of production by six/seven thousand rupees per tonne of aluminium, i.e., nearly half of the actual increase in the cost of production between 1979 and 1988.
Administered Prices and Excise Duty
The administered prices of CG and EC grade aluminium ingot prevailing on different dates since October 1978 are shown in Table 4.2. The figures in parentheses are the basic prices (producers’ average prices), while the figures without parentheses are prices inclusive of excise duty (purchasers’ prices).
It is seen from the table that the administered price of CG aluminium ingot was raised from a little over Rs.12 thousand per tonne in October 1978 to about Rs.35 thousand per tonne in November 1988. The ad

REGULATION, PRICE TRENDS AND PROFITABILITY 39
ministered price of EC grade ingot was fixed at a slightly higher level than that for CG grade - the difference ranging from Rs.100 to Rs.400 per tonne.
Between October 1978 and November 1988, the administered price of aluminium ingot (average of CG and EC grade) increased at the linear rate of about 18 per cent per annum. The rate of increase in the basic price was much higher at about 24 per cent per annum. Comparing administered prices on different dates, it is found that the increase in price was quite slow between March 1981 and March 1986. The rate of increase was only 3.8 per cent per annum.
In Table 4.3, the rates of excise duty on CG aluminium ingot, semi-fabricated products and circles (0.56 to 2.00 mm.) are presented. It is seen from the table that in December 1981 and again in December 1985 the excise duty on CG ingot (also on EC grade ingot) was reduced substantially. In March 1981, the administered price of CG ingot was Rs.18492 per tonne, which was made up of basic price of Rs.12842 per tonne and excise duty of Rs.5650 per tonne. The basic price was raised to Rs.19435 per tonne in December 1985 (i.e., an increase at the rate of about 11 per cent per annum). The excise duty was reduced to Rs.2322 per tonne. As a result there was only a small increase in the administered price of CG ingot between March 1981 and December 1985. The rate of increase was at 3.7 per cent per annum.
Another point to be noted is that before December 1981 the rates of excise duty on ingot and semi-fabricated products were equal. While the excise duty rates were reduced for both ingots and semi-fabricated products in December 1981 and again in December 1985, the reduction in excise duty on semi-fabricated products was not as much as that on ingots. There arose, as a result, a marked difference between the excise duty rates for ingots and semi-fabricated products. This gap has been reduced somewhat from November 1988 by raising the rate of excise duty on aluminium ingot from 11 to 18 per cent. It should be pointed out here that due to the Proforma Credit Scheme (and the MODVAT Scheme

40 EFFECTIVE INCENTIVES FOR ALUMINIUM INDUSTRY IN INDIA
introduced recently), the reduction of excise duty on aluminium ingot provided little cost advantage to the producers of semi-fabricated product (sheets, plates, etc.) and the down- stream units based on the semi-fabricated products.
Price Trends
Table 4.4 gives prices of aluminium ingot in London market and in India for different years from 1960 to 1988. These prices are annual averages. For the London market, the price series for the period 1960 to 1983 have been taken from Radhakrishna and Kalra (1987, Vol. 2, Appendix 2.7). To extend this series up to 1988, price quotations of London Metal Exchange have been taken from various issues of Minerals and Metals Review. For expressing the prices in US dollar and Indian rupee, the exchange rates have been taken from International Financial Statistics.
It is difficult to form a comparable time series for price of aluminium ingot in India. Taking data from Annual Survey of Industries (Census Sector), average purchase price of aluminium ingot has been computed for years 1961 through 1966, and 1968 through 1970. These are shown in the table. For 1977 and 1978, price quotations for CG and EC grade ingot are available in Revised Index Number of Wholesale Prices in India. These quotations have been used to compute domestic price of aluminium ingot (average of CG and EC grade) for 1977 and 1978. For subsequent years, the administered price of aluminium ingot (average of CG and EC grade) has been used to construct the price series. Considering the administered prices prevailing in different months of a year, the annual averages have been computed.
Figure 4.1 depicts movements in the price of aluminium ingot in London market (expressed in U.S. dollar) over the period 1960 to 1988. Along with actual prices, trend values estimated by fitting an exponential trend, are shown.

REGULATION, PRICE TRENDS AND PROFITABILITY 41
From Table 4.4 and Figure 4.1, it is seen that during the period 1960 to 1973 there was not much increase in the price of aluminium ingot in London market (expressed in US dollar). The price of aluminium ingot per tonne was $513 in 1960. It increased to $669 in 1973. This involves an annual growth rate of 2.06 per cent per annum. The slow growth in aluminium price in world market in the 1960s and early 1970s is mainly attributable to the fact that there was a balance between capacity and demand in this period. Also, the world market was oligopolistic, being dominated by six major aluminium companies. These companies followed a policy of keeping aluminium price low and raising it only in line with production cost, so as to discourage new entry into the industry.
Profits derived from aluminium operations began to decline sharply after 1973 as a result of oil price hike, increase in the prices of other forms of energy input and increase in taxes on bauxite. As new and partly government- backed aluminium projects went on stream in developing countries, the share of the six majors in the world aluminium smelter capacity declined substantially; and along with this went down their control over the market price. The six majors therefore decided to raise aluminium prices. Between 1973 and 1978, the aluminium price increased by 56 per cent, i.e., at the annual rate of 9.3 per cent.
After 1978, there have been sharp fluctuations in aluminium prices from year to year, reflecting primarily short- term excess demand and excess supply situations. Between 1978 and 1986, the aluminium price in London market grew at the rate of 1.2 per cent per annum. In 1987 the aluminium price increased by 35.4 per cent. In 1988, there was another sharp increase in aluminium price by 63 per cent, bringing the price level to $2542per tonne. The explanation for the sharp rise in aluminium price in 1988 lies primarily in the closure of a substantial part of the world aluminium smelting capacity (due to rising energy costs and continuing slump in the world aluminium market) in the 1980s, and the supply- shortage developing subsequently.6

42 EFFECTIVE INCENTIVES FOR ALUMINIUM INDUSTRY IN INDIA
Figure 4.1 brings out clearly that the aluminium price prevailing in London market during 1988 was exceptionally high in relation to the past trend. An examination of month-wise price quotations during 1988, presented in Table 4.5, reveals that a peak in aluminium price occurred in June 1988 when the price reached $3594 per tonne. Since June 1988, the international price of aluminium has been falling. In December 1988, the price was $2378 per tonne, which was lower than the price prevailing in June 1988 by about $1200 per tonne.8
Turning back to Table 4.4, the last column gives the ratio of the price of aluminium ingot in India to that in London market. It is seen that in the first half of the 1960s, the price ratio was significantly above one, i.e., the price in India was more than the international price. Between 1965 and 1970, the rate of increase in the aluminium price in London market (expressed in rupees) was much higher than that in India (partly a result of the devaluation of the Indian Rupee in 1966). Consequently, the price ratio fell from 1.44 in 1965 to 1.02 in 1970. However, between 1970 and 1977, there was a steep rise in aluminium prices in India, and the price ratio increased to 1.38 in 1977. In the post-1977 period, the price ratio has been about 1.3 or above for most years. It is only in 1988 that the price of aluminium ingot in India was lower than the international price.
Next, trends in aluminium prices in the 1980s are analysed using month-wise data. Figure 4.2 depicts the behaviour of the price of aluminium ingot in London market (Pound per tonne) from January 1980 to December 1988. Fitting a linear trend line to the data, a significant upward trend in the international aluminium price is found. The trend values are shown in the figure along with the actual prices. It is seen clearly that the price prevailing in June 1988 was exceptionally high in relation to the trend.
Figure 4 3 depicts the behaviour of prices of aluminium ingot in India. In the figure, the administered price of CG ingot and the price at which aluminium ingot were being traded in Bombay market are both shown. Average monthly price quotations for aluminium in the Bombay market

REGULATION, PRICE TRENDS AND PROFITABILITY 43
have been taken from various issues of Minerals and Metals Review. Such data being available only from February 1981, the earlier period is not included in the figure.
It is seen from Figure 4.3 that during 1981 and 1982, the market price of aluminium was less than or almost equal the administered price. In the subsequent period, the market price always exceeded the administered price, generally by a substantial margin. Looking at the figure, it seems the administered price fixed by the government did have an important influence on the price prevailing in the market. To study this relationship econometrically, a regression equation has been estimated using data for the period February 1981 to December 1988. The price prevailing in Bombay market (pB) has been regressed on administered price of CG ingot (pA) and the price prevailing in London market, expressed in Rupees (pL). To eliminate the trend effect on these variables, a time trend variable (T) has been included in the regression equation. The estimated regression equation is shown below (t-values in parentheses) :
pB = 3592.7 + 0.5853 pA + 0.2838 pL + 50.3 T
(5.613) (8.458) (4.186)
n = 95 R2 = 0.938 F = 459.6 DW = 0.53
The coefficients of pA and pL are both positive (as one would expect) and statistically significant at one per cent level. It may be inferred therefore that the administered price fixed by the government and the price prevailing in London market were two important determinants of the price of aluminium ingot in Bombay market.
Profitability
It has been pointed out above that the Indian aluminium industry was under government control since 1970 (till February 1989). Formal control on distribution of aluminium was imposed from 1975; and the prices of both CG and Ec grade aluminium were controlled by the government from 1978. There was a system of retention prices fixed for

44 EFFECTIVE INCENTIVES FOR ALUMINIUM INDUSTRY IN INDIA
each producer to cover the cost plus a post standard tax return on shareholders’ funds. It would be interesting to find out how profitability of aluminium companies was affected by these controls.
Although retention prices for aluminium ingot were supposed to give the producers a rate of return ranging from 7 per cent at 55 per cent capacity utilisation to 12 per cent at 90 per cent capacity utilisation, the revisions made to the retention prices over time did not keep pace with increasing costs, and in consequence the primary producers often found the retention prices umemunerative. This had two effects :9
(1) Increased use of ingots by the primary producers for their own consumption (in the semi-fabrication department) and arising consequently a shortage of CG ingot for downstream industries.
(2) A disproportionate increase in the prices of semi-fabricated products by the primary producers to make up for unremunerative returns on the sale of ingots (and EC grade wire rod) at controlled prices, thereby distorting the link between the price of ingot and semi-fabricated products.
Table 4.6 shows profitability of HINDALCO, INDAL and MALCO for different years between 1965 and 1987. To measure profitability, the ratio of net profit to net worth has been taken. BALCO has not been included in the table since it has been incurring losses year after year since its inception. At the bottom of the table, the average profitability rates during 1965-69 (when the industry was not under government control) and 1978-87 (when both pricing and distribution of aluminium were controlled) are presented.
It is seen from the table that during 1965-69, the profitability rate of HINDALCO exceeded 20% in three years out of five and was a little over 13% in the two remaining years. The average rate of profitability of HINDALCO for the five year 1965-69 was 183 percent, which was quite high. In this period, the profitability performance of INDAL was also good. The rate of profitability of INDAL was about 14% or higher in four

REGULATION, PRICE TRENDS AND PROFITABILITY 45
years out of five. The average rate of profitability of INDAL for 1965-69 was 13.9%.
The rate of profitability of MALCO was very low at 2.8% in 1965, which was the first year of production of the company. The rate of profitability rose steadily in the following years and reached 16.4% in 1969 and 19.7% in 1970. The average rate of profitability of MALCO for the five year period 1965-69 was 9.8%; and if 1965 is excluded it was11.3%.
HINDALCO and MALCO suffered a major set back in their profitability performance in the post-1970 period. The average profitability rate during 1978-87 was 4.9 per cent for HINDALCO and •13.6 per cent for MALCO. However, INDAL did not experience any such marked fall in the profitability rate. Thus, the average profitability rate for INDAL was 11.8 percent during 1970-77 and 8.9 per cent during 1978-87.10
The superior performance of INDAL (despite the fact that its utilisation rate of smelter capacity has in recent years come down drastically due to power shortage) is probably attributable to its production structure. Production statistics of HINDALCO, INDAL and MALCO are presented in Tables 4.7 through 4.10. It is clearly seen from these tables that in relation to the production of primary metal and EC grade wire rod (Properzi tod) the production of semi-fabricated products (which are more profitable to produce) is relatively much higher in INDAL.

FIG
UR
E 4.
1A
LU
MN
.PR
ICE
(LO
ND
ON
)-1
960
-88
46
< 0 ' * C \ I C V C O C 0 * C M t- « < 0 *
C s i N N o d d
(spues no qjJ iw jed $
60 61
62 63
64 65
66 67
68 69
70 71
72 73
74 75
76 77
78 79
80 81
82 83
84 85
86

FIG
URE
4.2
47
(spuBsnoLix)XW JOd punod
AC
TU
AL
P
RIC
E
* T
rsir
NC
V
AL
Uii
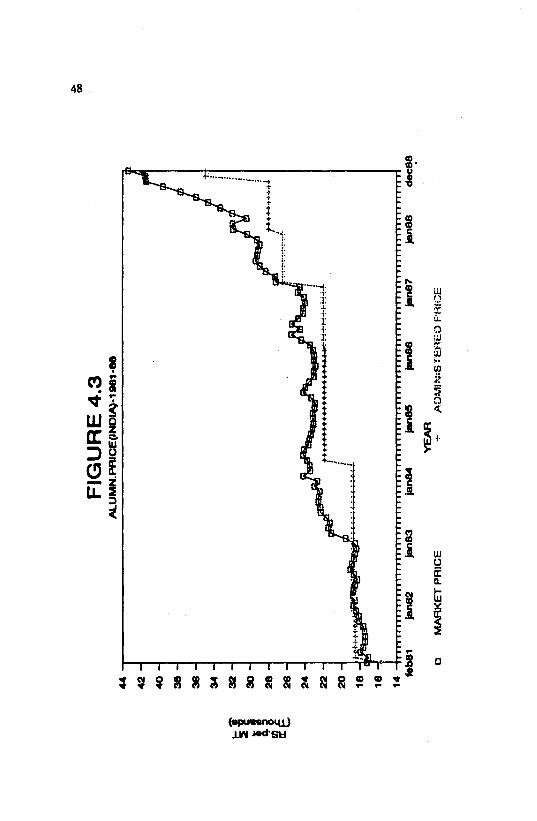
48
(spumnom) 1W »d su
MA
RK
ET
PRIC
E f
AQ\1
!*;:S
Ti
iRiiO
P
HK

REGULATION, PRICE TRENDS AND PROFITABILITY 49
Table 4.1Costs of Production and Retention Prices
(Rs. per tonne)Year/Firm Total Cost of
ProductionRetention Price at the end of the year
Surplus(+)Defidt(-)
1978 INDAL 6264 7355 +HINDALCO 7297 8038 +MALCO 8543 8770 *BALCO 14511 11208 -
1979 INDAL 6622 7355 +HINDALCO 8523 8691 fMALCO 9547 10029BALCO 21223 12570 -
1980 INDAL 11172 8681 -HINDALCO 10974 8691 -MALCO 11778 10029 -BALCO 23310 12570 -
1981 INDAL 13204 14485 +HINDALCO 13383 12365 -MALCO 14791 15472 +BALCO 30164 18051 -
1982 INDAL 14873 14485 -HINDALCO 14214 12365 -MALCO 17365 15472 -BALCO 32417 18051 -
1983 INDAL 16463 14485 -HINDALCO 15908 12365 -MALCO 25126 15472 -BALCO N.A 18051 -
Source: Based on Tables 6.9 through 6.14 of Radhakrishna and Kalia(1987).

50 EFFECTIVE INCENTIVES FOR ALUMINIUM INDUSTRY IN INDIA 50
Table 4.2Administered Prices of Aluminium Ingot
(Rs. per tonne)
Date CG EC
October 1978 12258 12400(8632) (8732)
October 1979 13718 14089(9661) (9922)
July 1980 15723 16349(10995) (11433)
March 1981 18492 18636(12842) (12942)
December 1981 18679 18805(15311) (15411)
May 1984 21847 21965(18405) (18505)
December 1985 21767 21991(19435) (19635)
March 1986 21961 22188(19435) (19635)
March 1987 26449 27152(23828) (24028)
January 1988 27982 28712(25209) (25409)
November 1988 34986 35222(29649) (29849)
Source: Compiled from various issues of Minerals and MetalsReview.
Note : Figures in parentheses are basic prices and figures withoutparentheses are puchaseis’ prices (basic + excise duty).
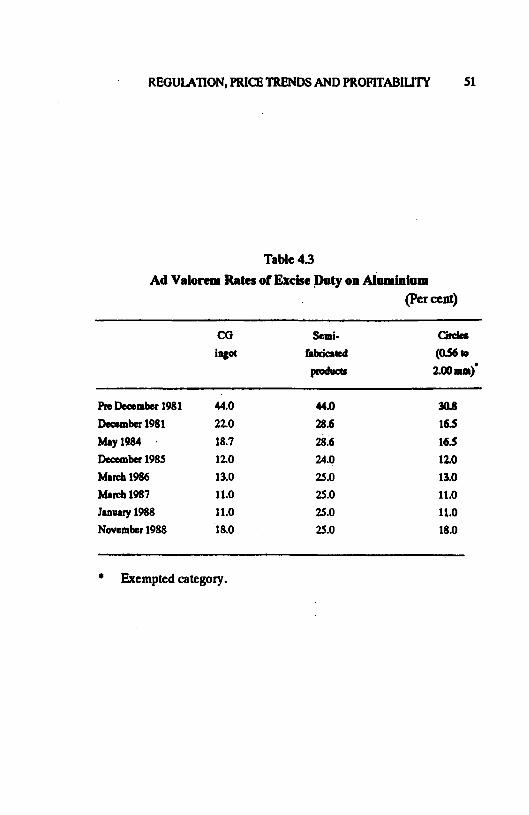
REGULATION, PRICE TRENDS AND PROFITABIUTY 51
Table 4 3Ad Valorem Rates of Excise Duty on Aluminium
(Percent)
CGingot
Semi-fabricaledproducts
Gfdec (0t56to 2.00 mm)*
Pie December 1981 44.0 44.0 30.8December 1981 22.0 28.6 16.5May 1984 18.7 28.6 165December 1985 110 24.0 110Match 1986 13.0 25.0 13.0Match 1987 11.0 25.0 11.0January 1988 11.0 25.0 11.0November 1988 18.0 25.0 18.0
* Exempted category.
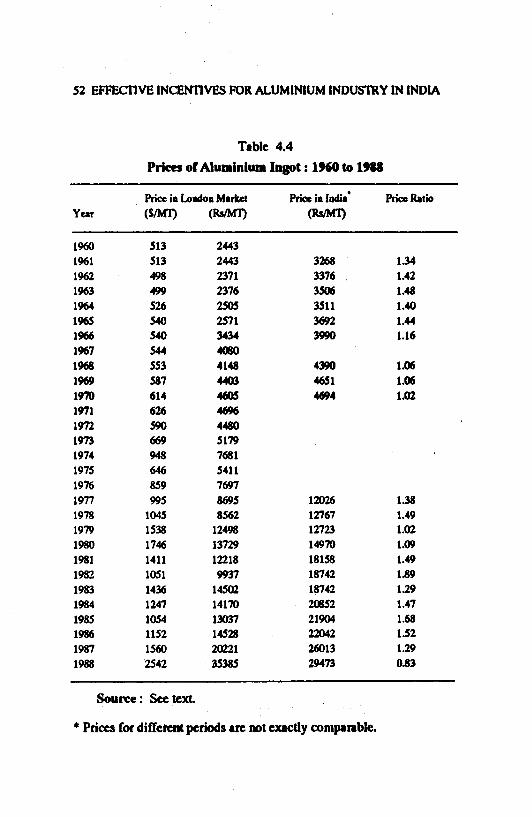
52 EFFECTIVE INCENTIVES FOR ALUMINIUM INDUSTRY IN INDIA
Table 4.4Prices of Aluminium Ingo t: 19(0 to 1988
YearPrice in London Market (S/MT) (Rs/MT)
Price in India’ (Rs/MT)
Price Ratio
1960 513 24431961 513 2443 3268 1.341962 498 2371 3376 1.421963 499 2376 3506 1.481964 526 2505 3511 1.401965 540 2571 3692 1.441966 540 3434 3990 1.161967 544 40801968 553 4148 4390 1.061969 587 4403 4651 1.061970 614 4605 4694 IM1971 626 46961972 590 44801973 669 51791974 948 76811975 646 54111976 859 76971977 995 8695 12026 1381978 1045 8562 12767 1.491979 1538 12498 12723 1.021980 1746 13729 14970 1.091981 1411 12218 18158 1.491982 1051 9937 18742 1.891983 1436 14502 18742 1.291984 1247 14170 20852 1.471985 1054 13037 21904 1.681986 1152 14528 22042 1.521987 1560 20221 26013 1.291988 2542 35385 29473 0.83
Source: See text
* Prices for different periods are not exactly comparable.

REGULATION, PRICE TRENDS AND PROFITABILITY 53
Table 4.5Price of Aluminium Ingot in London Market during 1988
Month Pound/MT Doilar/MT RsJMT
January 1113 2007 26278February 1217 2138 27942Match 1379 2524 32806April 1337 2508 33077May 1601 2995 39865June 2017 3594 49558(13th June) 23S0 4187 57740July 1516 2585 36429August 1594 2706 38543September 1417 2386 34603October 1330 2308 33942November 1319 2385 35705December 1321 2378 36301
Source: Various issues of Minerals and Metals Review.

54 EFFECTIVE INCENTIVES FOR ALUMINIUM INDUSTRY IN INDIA
Table 4.6Profitability Performance of HINDALCO, INDAL and MALCO,
1965 to 1987(Per cent)
Year Profitability Rate (ratio of net profits to net worth)
HINDALCO INDAL MALCO
1965 21.5 20.0 181966 22.2 13.9 6.41967 13.1 14.4 9.11968 13.4 8.0 12.31969 21.9 153 16.41970 11 16.8 19.71971 11.5 19.0 10.01972 6.1 117 9.11973- 1.6 7.4 1.11974- 20.4 10.7 9.01975- 1.3 10.6 4.11976 15.5 11.1 10.71977 6.8 9.2 -41.61978 4.1 19.1 11.61979 4.3 11.9 6.71980 0.9 6.0 5.41981 2.8 9.3 -24.51982 1.8 7.6 -26.01983 2.9 -10.6 -180.81984 9.0 13.6 -41.61985 3.5 16.3 -4.31986 5.2 10.5 -29.1*1987 10.8 5.1 N.A.
Avenge ** for 1965-69
183 13.9 9.8
Average ** for 1978-87
4.9 8.9 -13.6
* For 18 months, January 86 to June 87.
** Based on average net profit and average net worth for the relevant period.

REGULATION, PRICE TRENDS AND PROFITABILITY 55
Table 4.7Production Structure of HINDALCO
(Tonne)
1986 1987 1988
Aluminium Ingot 123425 122508 157826Rolled Products 26498 28524 31702Extruded Products 9064 9902 12969Conductor Re-draw 29492 31588 38111Commercial Rods 951 1220 2880
* for IS months ending March 1989.
Table 4.8Production Statistics of HINDALCO, 1978*88
(’000 tonnes)
Primary Metal Rolled and Extruded Products
1978 66 271979 78 301980 74 321981 77 311982 91 301983 94 301984 122 331985 124 341986 123 361987 122 381988* 158 45
* for IS months ending March 1989.

56 EFFECTIVE INCENTIVES FOR ALUMINIUM INDUSTRY IN INDIA
Table 4.9 Production Statistics o f INDAL
(*000 tonnes)
1978 1982 1985 1986 1987 1988*
Aluminium Ingot 823 70.2 37.4 28.5 31.6 573
Rolled Products 28.6 32.4 38.1 403 42.5 54.9
Extruded Products S.l1
4.2 5.6 4.6 6.2 9.1
Properzi Rods 9.9 10.0 4.9 1.6 - 17
Foil 2.5 2.4 3.5 3.5 4.0 6.0
Alumina 18.8 49.6 113.3 147.3 124.9 15.9
* for 15th months ending March 1989.

REGULATION. PRICE TRENDS AND PROFITABILITY 57
Table 4.10 Production Statistics of MALCO
(Tonnes)
1978 1981 1983 1985 1986-87*
Primary Me til 23117 14891 4989 10742 14665
Properzi Rod 10500 6875 754 4720 6433
Extruded Products - 555 810 1681 2901
Rolled Products - - 25 10 191
* For 18 months.

58 EFFECTIVE INCENTIVES FOR ALUMINIUM INDUSTRY IN INDIA
NOTES
1. Under Aluminium (Control) Order of 1970.
2. Irrespective of whether the produced primary aluminium is sold directly orused in the firm’s own plant for producing semi- fabricated products, the payment had to be made to the Aluminium Regulation Account.
3. Prior to 1978, a dual price system was followed. The government used to fix only the price of EC grade metal (and require firms to produce 50% of their output as EC grade). The price of CG ingot was not controlled; it was fixed by the companies.
4. This analysis is based on cost data provided in the Report of the Working Group on Aluminium, Magnesium, Titanium, Vanadium and Gallium for the Eighth Five Year Plan, Ministry of Steel and Mines, May 1989.
5. During the period 1968-72, aluminium producers got power, on an average, at the rate of 4 paise per KWH. HINDALCO received bulk of its power supply from U.P. State Electricity Board at the rate of 2 paise per KWH. The cost of power generation in HINDALCO’s own captive power plant was 4.5 paise per KWH. The State Electricity Boards were charging about 13 paise per KWH from bulk consumers (which was probably subsidised) in that period. See Gupta (1987), pp. 112-3.
6. See Kalra (1988).
7. On 13 June 1988, the spot price ofaluminium ingot in London market reached the all-time high figure of $4187 per tonne.

REGULATION, PRICE TRENDS AND PROFITABILITY 59
8. The downward trend in international price of aluminium ingot has continued in 1989.
9. Shah (1986), p. 29.
10. The profitability performance of HINDALCO and INDAL improved significantly in 1988. For the 15-month period ending March 1989, the ratio of net profits to net worth was 17 per cent for HINDALCO a nd 25.6 percent for INDAL. However, the performance of MALCO has been poor.
V ESTIMATES OF EFFECTIVE PROTECTION AND EFFECTIVE SUBSIDY RATES
Estimates of effective protection and effective subsidy rates for the Indian aluminium industry are presented in this chapter. Effective rates of protection to the production of primary aluminium metal have been estimated forfourprimary producers HINDALCO, INDAL, MALCO and BALCO1 for the years2 1980,1983 and 1986 to 1988. Effective subsidy rates have been estimated for three aluminium firms for 1986 and 1987. To get a better insight into the structure of incentives, effective protection rates have been estimated also for the two processes, alumina refining and aluminium smelting, separately, and for the production of semi- fabricated products (extrusions, rolled products, and foils). These estimates have been made at the aggregate industry level and relate to 1986 and 1987.
Data Sources
For estimating effective protection and effective subsidy rates, basic data (input requirements, cost structure, input prices, etc.) have been drawn from Radhakrishna and Kalra (1987), Thangaraju and Kothari (1986), NCAER (1983) and the Report of the Working Group on Aluminium, Manasium, Titanium, Vanadium and Gallium for the Eighth Five Year Plan (Ministry of Steel and Mines, May 1989). Domestic and international prices of major inputs in aluminium production have been provided in Radhakrishna and Kalra (1987) for the period 1979 to 1983/1984. To get such prices for recent years and for inputs for which prices are not available in the study of Radhakrishna and Kalra, various other sources have been utilised. Domestic prices of inputs have been worked out from cost data of aluminium producers obtained from the sources mentioned above. Wherever found necessary, price quotations reported in the official series Revised Index Numbers of Wholesale Prices

ESTIMATES OF EFFECTIVE PROTECTION 61
in India (hereafter abbreviated as RINWPI) have been used. To get border prices of inputs, unit values of imports (or exports, in certain cases) have been used. Unit values have been computed from Monthly Statistics of Foreign Trade of India and Indian Petroleum Statistics. Also, unit values computed from Yearbook of International Trade Statistics (UN) and price quotations in international markets have been used for this purpose.
Border price of aluminium ingot is obtained on the basis o f annual average price (spot) quotations in the London Metal Exchange (LME), which is reported in Minerals and Metals Review. Domestic prices of aluminium ingot are the retention and controlled pool prices (depending on the production unit for which the estimate is made) are announced by the government from time to time. These have been compiled from various sources.
For semi-fabricated products, domestic prices have been taken from price quotations reported in RINWPI. Since domestic prices of semifabricated products are taken from RINWPI, these are inclusive of excise duty. To maintain consistency, purchasers’ price of aluminium ingot (CG) has been taken as the domestic price of aluminium in the computation of ERP for semi-fabricated products. Border prices have been obtained on the basis of unit values of exports computed from data on quantity and value of exports of aluminium products published in Minerals and Metals Review.
Price o f Aluminium Ingot
As noted earlier, border price of aluminium ingot is obtained on the basis of annual average price (spot) quotations in the London Metal Exchange. To obtain the cif import price in India, it is necessary to add to the quoted LME price, transportation costs and allied expenses. From some information on transportation of aluminium metal available in the study of Brown et.al. (1983), it seems that, in 1980, the cost of transporting one tonne of aluminium ingot from European countries to India was about U.S.$100. This figure has been used to compute landed price of

62 EFFECTIVE INCENTIVES FOR ALUMINIUM INDUSTRY IN INDIA
aluminium ingot in India from the data on price of aluminium ingot prevailing in London market.
It has been noted in Chapter 4 above, that the international price of aluminium in 1988 was much higher than what one would expect on the basis of the past trend. In particular, the price prevailing in June 1988 was exceptionally high. Since such abnormal price variations may distort the estimates of effective rate of protection, the international price of aluminium for 1988 has been computed after excluding price quotations for the month of June.
It has been noted earlier that only a small part of the global trade in aluminium takes place through the London Metal Exchange. Thus, to judge the correctness of the border prices computed from LME price quotations, these need be compared with unit values of imports of aluminium ingot in India. A comparison of the computed border prices with unit values of imports is presented below :
Year Border price based on LME price quotations
(RsVMT)
Unit value of imports (Rs./MT)
% difference
1980 14515 14864 2.41981 13084 14108 7.81982 10883 11396 4.71983 15512 14309 -7.81984 15306 15770 3.01985 14274 14261 -0.11986 15789 15620 -1.11987 21517 21310 -1.01988 35440 30031 -15.3April ’88 to March ’89 34300* -3.2
* estimated from available month-wise import data.

ESTIMATES OF EFFECTIVE PROTECTION 63
It is seen that for six out of the nine years, the difference between the two sets of prices is less than five perccnt. For 1981 and 1983, unit values differ from the computed border prices by 7.8 per cent, Which is again not large. But, for 1988, the unit value is found to be much lower (by 153%) than the computed border price. This seems to be attributable largely to the fact that a sizeable part of the imports of aluminium in India during 1988 occurred in the first three months when the international price level was relatively low compared to the average price level during the year. Also, unit import values may deviate from current international market prices due to time lags in delivery. When the unit value for the period April 1988 to March 1989 is compared with the computed border price for 1988, the difference is found to be quite small.
The system of pricing and distribution control on primary aluminium producers which existed in India from 1978 to 1988 has been described in Chapter IV. In view of such controls on pricing and distribution, the “domestic" price of aluminium ingot to be used in the estimation of effective protection rates depends on the production unit for which such estimate is made. For the individual primary producers, the relevant price is the average retention price of CG and EC grade aluminium ingot.4 This price varies significantly from one primary producer to another. On the other hand, if the analysis is carried out at the aggregate industry level, the relevant price is the average controlled pool price (net of excise duty) of CG and EC grade. In both cases, annual averages have been taken of the retention prices/controlled pool prices prevailing in different months of a year.
Price of Bauxite
Since bulk of the world trade in bauxite takes place among the six major multinational companies and their affiliates, and of the remaining, most is under long-term contracts, it is very difficult to estimate the ‘free-trade’ reference price for Indian bauxite. One set of figures that are available is the U.S. cif import price of Jamaican bauxite, which is shown below :

64 EFFECTIVE INCENTIVES FOR ALUMINIUM INDUSTRY IN INDIA
Year U.S. cif import priceof Jamaican bauxite
(SAonne)1980 41.21981 40.01982 36.01983 34.71984 33.01985 30.01986 28.01987 26.0
It is seen that in 1980 and 1981, the price of bauxite was about forty dollars per tonne. It has been steadily declining since then and came down to 26 dollars per tonne in 1987.
The prices of bauxite given above are quite high in relation to the fob export price of Indian (non-calcined) bauxite, which is shown below :
Year Fob export price of I ndian bauxite( non-calcined)(RsVTonne) (S/Tonne)
1980-81 118 14.91981-82 123 13.71982-83 137 14.21983-84 135 13.11984-85 152 12.81985-86 175 14.31986-87 187 14.6
It is seen that the fob export price (unit value) of Indian bauxite expressed in U.S.S remained by and large in the range of $13 to $15 per tonne during the years 1980-81 to 1986-87.

ESTIMATES OF EFFECTIVE PROTECTION 65
It should be pointed out here that before April 1985, when the export policy was liberalised, there were government restrictions on the exports of bauxite from India. Therefore, the unit export values may not correctly represent the border prices of Indian metallurgical grade bauxite. It seems, however, that the unit values of bauxite exports from India shown above would be much closer to the border prices than the fob export prices of Jamaican bauxite repotted in Radhakrishna and Kalra (1987) or the cif U.S. import prices of Jamaican bauxite presented above. Accordingly, the unit value of exports of bauxite from India has been taken as the border price for 1980 and 1983. Since, for recent years data on export of bauxite from India are not available, the border price has been taken as $14.6 per tonne, which is the unit value realised in 1986-87.
The primary aluminium producers in India get their supply of bauxite (from their captive mines) at varying prices. This variation in the price of bauxite is due largely to differences in mining costs and in the distance over which the bauxite mined has to be transported. To apply a uniform price of bauxite for all aluminium producing firms does not methodologically seem correct inter-firm differences in the cost of procuring bauxite enters into the fixation of retention prices. Accordingly, while estimating the effective protection rate to an individual producer, the unit cost of procuring bauxite for the producers has been used as the ‘domestic* price. When the analysis is carried out at the aggregate industry level, a weighted average of the firm specific bauxite prices has been taken.
Nominal Protection to Aluminium
Nominal rates of protection to aluminium (primary metal) production have been computed by taking the ratio of administered price5 (average of CG and EC grade ingot) to the landed price6 of imported aluminium (based on LME price quotations plus transportation cost). Such computations have been done for the four primary producers and the aggregate industry, for the period 1979 to 1988. The results are presented in Table 5.1.

66 EFFECTIVE INCENTIVES FOR ALUMINIUM INDUSTRY IN INDIA
Table 5.1 reveals that the nominal rate of protection to aluminium production varied considerably from year to year in the period 1979 to 1988. The nominal rate of protection was significantly negative in three years 1979,1980 and 1988, while it was significantly positive in four year 1982, 1984,1985 and 1986. Also, there were marked differences in the nominal rate of protection among the four primary producers. Inter-firm differences in nominal protection is clearly attributable to the system of retention prices for firms. Inter-temporal variations are in normal protection traceable mainly from year to year fluctuations in the international price of aluminium ingot and ihe domestic administered prices not being sufficiently linked to the international price.
Table 5.2 shows for a number of years the rate of customs duty on imports of aluminium ingot. It is seen from the table that from August 1976 to March 1985, the rate of customs duty was raised steadily from 20 to 40 per cent ad valorem. In this period, it seems, the rate of customs duty bore little relation to the relative price of aluminium in international market vis-a-vis the price in India. But, from April 1985, frequent changes (sometimes twice or thrice in a year) were made in the rate of customs duty in response to changes in the international price of aluminium vis-a-vis the domestic price (administered). It is seen, however, that in the period from 1977 to 1987, the rate of customs duty was maintained at 20% or higher level, though in several years during this period, the domestic price for aluminium producers was lower than the world price, i.e. the nominal rate of protection was negative. It is only in 1988, that the import of aluminium ingot was put under Open General Licence and the rate of customs duty was brought down to a substantially low level.
Effective Protection to aluminium
Estimates of effective rate of protection (ERP) to aluminium (primary metal) are presented in Table 5 3 . Estimates are presented in the table for the four primary producers, for the years 1980, 1983 and 1986 to 1988. Estimates of ERP are presented also for the industry as a whole, which

ESTIMATES OF EFFECTIVE PROTECTION 67
have been obtained by taking a weighted average of firm-level estimates, the weights being the relative production levels (in relevant years) of the firms. For making these estimates, the simple Cordon method has been used. Bauxite, caustic soda, C.P. coke, cryolite, aluminium flouride,npitch, lime, fuel oil and coal are taken as tradeable inputs. Other tradeable inputs, such as soda ash, flurspar and carbon black, are combined into one miscellaneous group, for which the nominal protection
Qcoefficient is assumed to be unity.
It is seen from Table 5.3 that ERP was negative for all the four firms in 1980, 1983 and 1988. ERP was negative for two firms in 1986 and three firms in 1987, out of the four. ERP for the aggregate industry was close to zero in 1986 and negative in the other four years. In 1988, ERP for the aggregate industry was - 44.5% and in 1980 it was -50.8%.
A negative ERP indicates disprotection of the industrial activity, i.e., the non-tradeable factors engaged in the activity receive less reward than what they would have received in the absence of tariffs and other such restrictions on trade, and government controls on prices of output and tradeable inputs. For Firm 4, ERP is found to be -59.9% for 1980. This figure may be interpreted as indicating that in 1980, non-tradeable inputs (including primary inputs, labour and capital) engaged in aluminium production in Firm 4 earned an income of about 60% less than what they would have earned if aluminium ingot and the various tradeable inputs could be traded freely without any customs duty and there was noogovernment control on the price of aluminium ingot.
Earlier studies on effective protection to aluminium production in India, reviewed in Chapter 3 above, have found that ERP was positive in the 1960s. The estimates show a clear downward trend in ERP after 1963, indicating that the extent of protection to aluminium has been going down. Estimates of ERP for 1970 made by Panchamukhi (1978) and for 1977 made by Gupta (1987) indicate that the industry was disprotected in those years and probably most other years of the 1970s. From the estimates presented in this study it seems that ERP was negative for most years of

68 EFFECTIVE INCENTIVES FOR ALUMINIUM INDUSTRY IN INDIA
the 1980s. Considering the present estimates along with the estimates of Panchamukhi and Gupta, it would therefore appear that the production of aluminium metal in India has remained disprotected for quite a long time coninciding by and large with the period during which the industry was under government control.
As in the case of nominal protection, the effective protection rate is found to vary substantially among the four firms. Disprotection is more pronounced for Firms 1 and 4, compared to Firms 2 and 3. This inter-firm variation in ERP is attributable to the system of firm specific retention prices, though there are differences also in the average rate of nominal protection to tradeable inputs.10
InTable5.4 a comparison is presented between nominal and effective protection rates to aluminium for the aggregate industry. The table also shows the nominal rate of protection to tradeable inputs (as a group). It is interesting to note that while the average rate of nominal protection to tradeable inputs was only 2.2 per cent in 1980, it was more than SO per cent in the other four yeais. In 1986 and 1987, the nominal rate of protection to aluminium was positive. But, the average rate of nominal protection to tradeable inputs was far higher, the net result of which was a near zero or negative effective rate of protection. Comparing nominal and effective protection rates to aluminium, it is found that the latter is lower than the former in all the five years by 10 percentage points or more.
At this stage, it would be useful to take a look at ERP estimates for other manufacturing industries, and find out where the aluminium industry stands relative to other manufacturing industries in terms of the extent of protection.
In a recent study carried out by the World Bank (India, An Industrialising Economy in Transition, 1989), effective rates of protection have been estimated for 66 major industries covering almost the entire manufacturing sector. The actual ERP estimates have not been presented

ESTIMATES OF EFFECTIVE PROTECTION 69
in the study, but the industries have been classified into high, moderate and low categories according to the level of effective protection. The ranges are taken as follows: high, above 70 per cent; moderate, 30 to 70 per cent; and low, less than 30 per cent (including negative). The study finds that effective protection was high in 21 industries, moderate in 5 industries and low in 30 industries. Using the middle values of the protection ranges -100 per cent for high, SO per cent for moderate and IS per cent for low - weighted average rates of effective protection have been computed. These turn out to be 40 per cent using value added at world prices as weights and 46 per cent using value added at domestic prices as weights.
In studies undertaken by ICICI, BICP and CEI, effective rates of protection have been estimated for some Indian industries for recent years.11 These estimates arc shown in Table 5.5.
For most industries for which ERP estimates are presented in the table, the estimated ERP is found to be positive. In some cases, the estimated ERP is very high, over 300 per cent. ERP estimates are found to be negative in four industries in the ICICI study and for some auto ancillary items in the BICP study. For sheet glass, the estimated ERP is -96.8 per cent, which is remarkable since it implies that value added at domestic prices is only about 3 per cent of the value added at world prices. Considering the ERP estimates presented in the table along with the findings of the World Bank study mentioned above, it seems that in a majority of Indian industries there was significant positive effective protection, and aluminium belongs to that minority group which was disprotected.
Effective Subsidy
As pointed out in Chapter 3 above, effective subsidy coefficient (ESC) is a more comprehensive measure of incentives to a production activity than effective protection coefficient (EPC), since ESC takes into account taxes and subsidies on non-tradeable inputs, besides the effect of trade restrictions and other government interventions on prices of output

70 EFFECTIVE INCENTIVES FOR ALUMINIUM INDUSTRY IN INDIA
and tradeable inputs. Ideally, in the computation of ESC, one should consider all taxes and subsidies, along with norms for each. But, in empirical studies, inadequate availability of data often forces the researchers to confine attention to only important items. Recognising the significance of ESC, its estimation has been attempted for the aluminium firms. For making the estimates, only the subsidy on power is included. It may be mentioned, however, that power constitutes about 40 per cent of the total cost of production of aluminium ingot and about 60 per cent of the cost of non-tradeable inputs, and a subsidy on power has therefore an important bearing on incentives to the production activity. For firms which draw power from their own captive plants, subsidy arises from underpricing of inferior grades of coal (used in power generation) which is attributable to the coal pricing policy of the government. For firms which draw power from the State Electricity Boards (SEBs), subsidyarises from (1) SEB charging a lower rate for power to the aluminium unit
12than its cost of generation , and (2) SEB’s cost of generation being lower than what it would have been otherwise as a result of the coal pricing policy of the government and the supply of concessional credit by the government/financial institutions.
ESC has been estimated for Firms 1, 2 and 3 for the year 1986 and 1987. It has not been possible to make such estimates for Firm 4 due to certain gaps in the available data. Before presenting the ESC estimates, some details about the estimation of subsidy on power is given below.
That poorer grades of non-coking coal, mainly used in the power13sector, are severely underpriced, is recognised widely. This has been
held mainly responsible for the massive losses incurred by Coal India Ltd. in recent years. The cost of production of coal per tonne was Rs.219 in 1986-87 and Rs.225 in 1987-88. The average realisation per tonne of coal was about Rs.192 in those two years. This involved a loss of Rs.27 per tonne in 1986-87 and Rs.33 per tonne in 1987-88, which may be treated as average subsidies per tonne of coal in those two years. There was, in addition, an element of cross subsidisation among different grades of coal.

ESTIMATES OF EFFECTIVE PROTECTION 71
One approach to the estimation of cross subsidy is to compare the administered prices of different grades of coal with gross calorific values of those grades. From such a comparison, it appears that inferior grades of non-coking coal were cross-subsidised to the extent of about Rs.28 per tonne. Thus, the total subsidy on coal used for power generation comes to about Rs.55 per tonne for 1986 and Rs.61 per tonne for 1987 (as against the supply price of about Rs.120 per tonne).14
For an aluminium firm which draws power from its own captive plant, the amount of subsidy per tonne of aluminium is computed considering (1) the consumption of power per tonne of aluminium, (2) the consumption of coal per unit of power generated, and (3) subsidy per tonne of coal used in power generation. For a firm that draws power from SEBs, the computation of subsidy is more complex. Additional information15 needed is : (1) the rate at which the aluminium unit gets power, (2) the costs of generation of the SEB, (3) share of hydel in SEB’s total power generation, (4) ratio of imports (from central sector and inter-State sources) to net generation of the SEB, (5) coal consumption per unit of power generated in coal-based plants, and (6) interest cost and net fixed capital employed. Capital cost subsidy is computed as the difference between actual interest payment and the imputed cost at 12 per cent return on net fixed assets.
From the computations made, the amount of subsidy on account of power per tonne of aluminium produced is found to range from Rs.838 to Rs.7958. The estimated ESCs are shown in Table 5.6. To facilitate comparison, this table also shows the EPCs.
It is seen from the table that ESC estimates exceed the EPC estimates for all the three firms. But, it is only in the case of Firm 3 that the estimated ESC is substantially higher than the estimated EPC. Indeed, it is interesting to note that while EPC estimate for Firm 3 for 1987 is less than unity (indicating disprotection), the estimated ESC is well above unity.

72 EFFECTIVE INCENTIVES FOR ALUMINIUM INDUSTRY IN INDIA
Comparing weighted averages, it is found that estimated ESC is higher than estimated EPCby 10.4 per cent for 1986 and 10.6 per cent for 1987. From this, it appears that the estimates of ERP to aluminium industry presented in Table 5.4 above overstates somewhat the extent of disprotection to the industry.
Processwise ERP Estimates
In the analysis presented so far, aluminium production has been treated as one production activity. It would be interesting and useful to divide the production process of aluminium into two parts - alumina refining and aluminium smelting - and study effective protection to these two processes separately. This analysis has been carried out at the aggregate industry level for the years 1986 and 1987.
Table 5.7 gives the ERP estimates for alumina refining and aluminium smelting. The table brings out clearly the sharp difference that existed between the two processes in terms of effective rate of protection. ERP estimates for alumina refining are 108.2 per cent for 1986 and 109.6 per cent for 1987. But, ERP estimates for aluminium smelting are significantly negative at -15.3 per cent for 1^86 and -22.8 per cent for 1987. This clearly shows that the incentive structure created by trade restrictions and administered price policies of the government favoured production of alumina from bauxite, but not production of aluminium from alumina.
Effective Production to Semi-fabricated Products
A substantial part of aluminium produced by the four primary producers are used in their semi-fabrication units for producing (1) properzi rods, (2) rolled products (flats, sheets, circles, coils, foils, etc.), and (3) extruded products (rods, tubes, etc.). Prior to March 1989, when the industry was deregulated, there was government control on the price of properzi rods (based on EC grade metal), but there was no control on prices charged for rolled and extruded products. It is believed that primary producers over-priced the rolled and extruded products to make up for

ESTIMATES OF EFFECTIVE PROTECTION 73
inadequate profits earned or losses incurred on the production of aluminium metal. Thus, for a proper assessment of the incentive structure of aluminium industry, it is important to examine effective rates of protection to rolled and extruded products.
Domestic price quotations for (1) extrusions, (2) rolled products other than foils, and (3) foils have been taken from RINWPI.16 Border prices for these aluminium products have been obtained from export trade data given in Minerals and Metals Review. Unit e?y>ort values of the relevant categories of semi-fabricated aluminium products are taken as the border prices. Since there are many types of rolled and extruded products and there is also significant variation in quality, it has not been possible to match adequately the unit export values (as border prices) with the product categories for which domestic prices are available. This is a deficiency of the ERP estimates for semi-fabricated products presented here. There is, therefore, need for caution in drawing inferences from the results.
Table 5.8 shows the estimated effective rates of protection to (i) extrusions, (ii) rolled products other than foils, and (iii) foils. The estimates relate to 1986 and 1987. It is seen from the table that estimates of ERP to rolled products and foils are quite high, especially for 1987. ERP tp Foils for 1987 is found to be over three hundred per cent, which may be interpreted as showing that the processing margin in foils (including any abnormal profits earned) in 1987 was over eight times what the processing margin would have been in the absence of trade restrictions and government controls on pricing and distribution of aluminium. .
Compared to ERP estimates for rolled products and foils, ERP estimates for extruded products are much lower; but these are positive. It may be mentioned in this connection that while primary producers dominate the market for rolled products, there are many secondary producers in the market for extruded products. In 1983, 85 per cent of the licensed capacity of rolled products was with the primary producers. For extrusions, the relevant ratio was 50 per cent. The existence of a large number of secondary producers for extrusion but not for rolled products

74 EFFECTIVE INCENTIVES FOR ALUMINIUM INDUSTRY IN INDIA
is attributable, among other reasons, to lower investment requirement of extrusion plants and the minimum efficient scale for extrusions (500 tpa) being much smaller than that for rolled products (20,000 tpa). This has naturally led to greater competition among firms producing aluminium extrusions, which is probably one of the reasons for the relatively low ERP for extruded products (compared to rolled products).
Summing up
ERP estimates for aluminium firms presented in this chapter indicate that there was disprotection to aluminium production in most years of the 1980s. Estimates of ESC which take into account subsidy on power indicate that the extent of disprotection is overstated somewhat by the ERP estimates. When the production process of aluminium is broken into two processes, alumina refining and aluminium smelting, and ERP is estimated for them separately it is found that the production of alumina from bauxite is sufficiently protected, and it is the production of aluminium from alumina which has a negative effective rate of protection. A substantial part of the metal produced by aluminium firms are used by themselves for manufacturing semi- fabricated products. Estimates of ERP to semi-fabricated products are found to be positive. The estimates are quite high for rolled products and foils.

Year
1979198019811982198319841985198619871988
ESTIMATES OF EFFECTIVE PROTECTION
Table 5.1Nominal Rate of Protection to Aluminium Production
1979 to 198S(Per cent)
HINDALCO INDAL MALCO BALCO Industry
-38.4 -44.7 -31.7 -13.2 -32.7-40.1 -44.8 -30.9 -13.4 -28.2-7.1 -13.1 -1.9 18.3 -2.232.0 33.1 42.2 65.9 41.1-7.4 -6.6 -0.3 16.4 -1.07.8 10.6 36.9 37.7 17.2
18.8 22.5 54.5 52.6 29.99.5 15.5 40.3 44.0 23.7-2.0 -53 12.0 21.2 7.8
-35.8 -32.4 -29.4 -19.1 -27.5
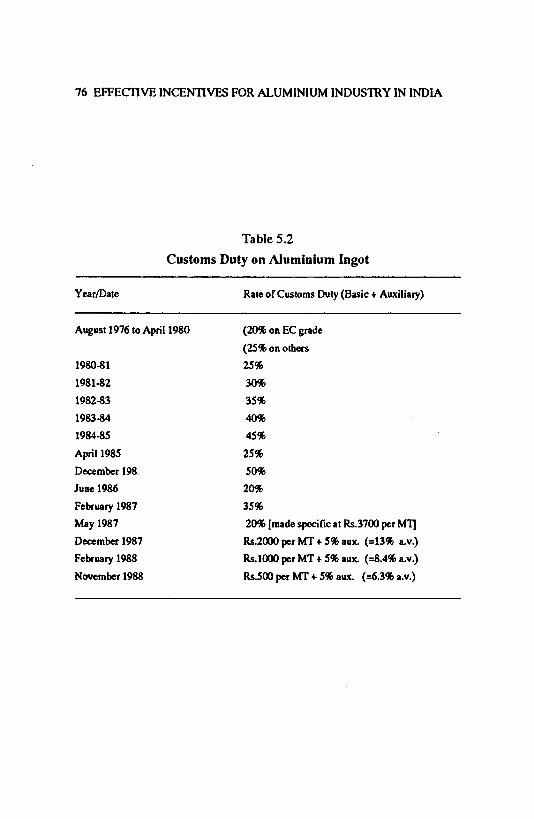
76 EFFECTIVE INCENTIVES FOR ALUMINIUM INDUSTRY IN INDIA
Table 5.2 Customs Duty on Aluminium Ingot
Year/Date Rate of Customs Duty (Basic + Auxiliary)
August 1976 to April 1980 (20% on EC grade(25% on others
1980-81 25%1981-82 30%1982-83 35%1983-84 40%1984-85 45%April 1985 25%December 198. 50%June 1986 20%February 1987 35%May 1987 20% [made specific at Rs.3700 per MT]December 1987 Rs.2000 per MT + 5% aux. (=13% a.v.)February 1988 Rs.1000 per MT + 5% aux. (=8.4% a.v.)November 1988 Rs.500 per MT + 5% aux. (=6.3% a.v.)

ESTIMATES OF EFFECTIVE PROTECTION 77
Table 5 3Estimates of Effective Rate of Protection to Aluminiur
(Primary Metal)
(Percent)
1980 1983 1986 1987 1988
Firm 1 -52.7 -30.5 •16.5 •20.7 -51.0Firm 2 -24.9 -6.9 21.4 3.1 •34.3Firm 3 -47.0 •30.6 12.2 -10.9 -47.8Firm 4 -59.9 •36.7 •12.6 -26.5 -47.4
Industry* -50.8 -25.9 -0.9 -12.4 -44.5
* Weighted average based on production levels.

78 EFFECTIVE INCENTIVES FOR ALUMINIUM INDUSTRY IN INDIA
Table 5.4Comparison of Nominal and Effective Rates of Protection to
Aluminium for Aggregate Industry
(Per cent)
Year Nominal Production Effectiveprotection
Output (1) Output (2) Tradeableinputs
1980 -28.2 -37.0 2.2 -50.8
1983 -1.0 -0.7 56.0 -25.9
1986 23.7 24.2 96.2 -0.9
1987 7.8 6.5 76.6 -12.4
1988 -27.5 29.2 53.6 -44.5
Note : Nominal protection rates shown under the head output(1) are based on pool prices, and those under the head output (2) are obtained by taking a weighted average of nominal protection rates of the four firms. Nominal protection rates for inputs and effective protection rates are similarly obtained as weighted averages of firm level estimates.
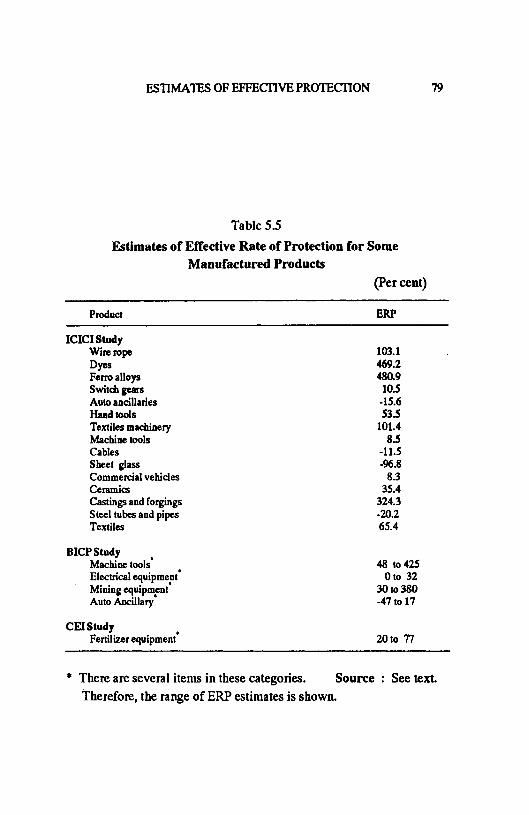
ESTIMATES OF EFFECTIVE PROTECTION 79
Tabic 5.5Estimates of Effective Rate of Protection for Some
Manufactured Products(Per cent)
Product ERP
ICICI StudyWire rope 103.1Dyes 469.2Ferro alloys 480.9Switch gears 10.5Auto ancillaries -15.6Hand tools 53.5Textiles machinery 101.4Machine tools 8.5Cables -11.5Sheet glass -96.8Commercial vehicles 8.3Ceramics 35.4Castings and forgings 324.3Steel tubes and pipes -20.2Textiles 65.4
BICP StudyMachine tools 48 to 425Electrical equipment Oto 32Mining equipment 30 to 380Auto Ancillary -47 to 17
CEI StudyFertilizer equipment 20 to 77
* There are several items in these categories. Source : See text. Therefore, the range of ERP estimates is shown.

80 EFFECTIVE INCENTIVES FOR ALUMINIUM INDUSTRY IN INDIA
Table 5.6Effective Protection and Effective Subsidy Coefficient
for Aluminium Firms, 1986 and 1987
EPC ESC
1986Firm 1 0.835 . 0.910Firm 2 1.214 1.287Firm 3 1.122 1.801
Weighted avenge 1.009 1.113
19*7Firm 1 0.793 0.850Firm 2 1.031 1.168Firm 3 0.891 1.362
Weighted average 0.895 1.001
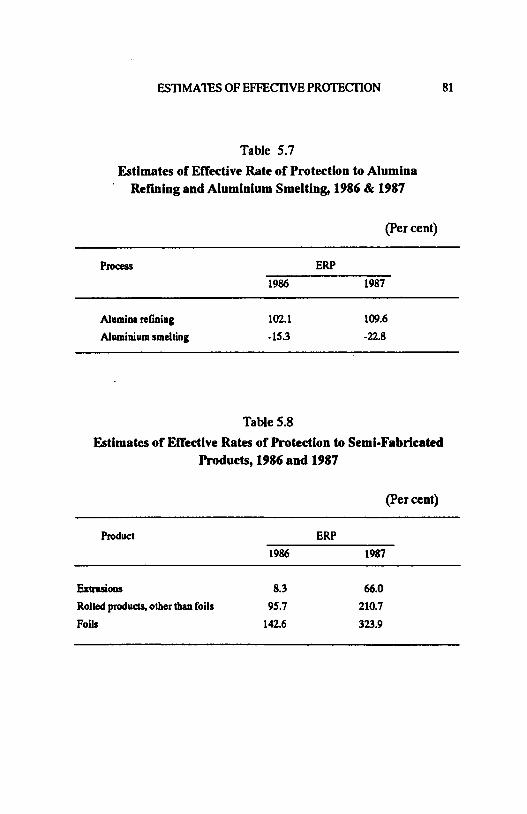
ESTIMATES OF EFFECTIVE PROTECTION 81
Table 5.7Estimates of Effective Rate of Protection to Alumina
Refining and Aluminium Smelting, 1986 & 1987
(Per cent)
Process ERP1986 1987
Alumina refining 102.1 109.6Aluminium smelting -153 -22.8
Table 5.8Estimates of Effective Rates of Protection to Semi-Fabricated
Products, 1986 and 1987
(Per cent)
Product ERP"1986 1987
Extrusions 8.3 66.0Rolled products, other than foils 95.7 210.7Foils 142.6 323.9

82 EFFECTIVE INCENTIVES FOR ALUMINIUM INDUSTRY IN INDIA
NOTES
1. NALCO which has come on stream very recently is excluded from the analysis.
2. The choice of years for study is largely dictated by the availability of data.
3. An average has been taken of the average prices prevailing in different months in a year.
4. An average of CG and EC grade is taken because the primary producers were under obligation to produce 50 percent of their metal production as EC grade ingot and wire rods.
5. For firms, the retention prices are used, and for the industry, the pool price is used.
6. It does not include customs duty.
7. Border price of coal is obtained on the basis of landed cost of Australian coal in India after making adjustments for differences in gross caloric value (GCV).
8. Since the cost of items included in this group forms a small part of the total cost of tradeable inputs, a different assumption about NPC of this group will not have any appreciable effect on the ERP estimates.
9. Such an inference would be right for a firm which is engaged in the production of aluminium ingot only. But, for a multiproduct firm, the actual incomes of labour, capital and other non- tradeable inputs need not be low, as a result of disprotection, if there is significant protection to some other activities for the firm (say, production of

ESTIMATES OF EFFECTIVE PROTECTION 83
semi-fabricated products) and the gains in income from such protection is shared with inputs which are engaged in activities that are disprotected. It is also important to recognise that this interpretation of ERP estimates has implicit in it the “small country” assumption, i.e., India’s foreign trade in aluminium and in inpujts used in aluminium production does not affect the international prices of those items.
10 Further, there are inter-firm differences in input consumption rates and the price at which bauxite is procured.
11. The estimates of ICICI (Industrial Credit and Investment Corporation of India) have been taken from their study, Export Performance of ICICI Financed Companies, 1978-79 to 1980-81, 1985. The estimates of CEI (Confederation of Engineering Industry) are taken from their study, Capital Goods Under Project Imports. 1986. The estimates of BICP (Bureau of Industrial Costs and Prices) have been taken from their publication, Strategies for Cost Reduction : Some Lessions from B.I.C.P. Studies, Studies on the Structure of the Industrial Economy, No.7, Ministry of Industry, June 1988.
12. Supply of power to aluminium smelters provides certain advantages to SEBs in maintaining a high plant load factor and thereby reducing cost of generation per unit of power. Thus, the entire difference between the cost of generation of power in a SEB and the price charged to an aluminium unit cannot be considered as a subsidy. The correction needed to separate the subsidy element is, however, very difficult to make and it has not been attempted for this reason.
13. See, for example, The Energy Scene , Advisory Board on Energy, Government of India, December 1987, p. 145.
14. One may argue that the amount of subsidy is over-esiimated, since a part of the cost of production of coal by CIL may be traced to inefficiencies, which should not be considered as a subsidy to the coal-using sectors. While this, no doubt, causes an upward bias, there

84 EFFECTIVE INCENTIVES FOR ALUMINIUM INDUSTRY IN INDIA
is also a downward bias caused by not taking into account the premium that should be put on coal since a non- renewable resource of the country is being depleted.
15. Most of this information has been obtained from Annual Reports of the State Electricity Boards.
16. For rolled products, a simple verage of prices of sheets, coils and circles is taken. For extrusions, a simple average of prices of rods and tubes is taken. The data source on domestic wholesale prices gives three price quotations for foils. Among these three, the price quotation for 0.10 mm. Toggar Foils in reels hard packed is used for the present analysis.
VI INVESTMENT BEHAVIOUR OF ALUMINIUM COMPANIES
In the last two Chapters, the profitability performance of aluminium producers and the incentive structure for the production of aluminium metal and semi-fabricated products were analysed. A related aspect is taken up for analysis in this Chapter, namely, investment behaviour of aluminium companies. The analysis is carried out for two major companies in the private sector, namely, HINDALCO and INDAL. Trends in investment are analysed first. This is followed by a more sophisticated analysis of investment behaviour based on investment functions.
Trends in Investment
Table 6.1 shows average annual rates of investment (at 1970-71 prices) of HINDALCO and INDAL for the periods 1965-69,1970-77and 1978-88.1 As noted earlier, the Indian alumnium industry was brought under government control from 1970. It was under partial government control during 1970-77 and under much stricter government control during 1978-88.
Real rates of fixed and inventory investment shown in the table have been computed from company accounts data drawn from the Stock Exchange Official Directory, Bombay. Gross fixed investment series has been derived from the gross fixed assets series (making adjustments for revaluation of assets), and it has been deflated by the wholesale price
<2 Aindex for machineiy and equipment. A weighted average of wholesale price indices o f aluminium3, bauxite, caustic soda, coal and mineral oil has been used to deflate the series on inventories, and from the deflated series so obtained, inventory investment has been worked out.
It is seen from Table 6.1 that in the five year period 1965 to 1969, HINDALCO’s average annual rate of investment was Rs.764.6 lakh in

86 EFFECTIVE INCENTIVES FOR ALUMINIUM INDUSTRY IN INDIA
fixed assets and Rs.88.2 lakh in inventories. In this period, INDAL’s average a niiual rate of investment was Rs.559.4 lakh in fixed assets. Thus, INDAL was investing relatively more in inventories. Considering fixed assets and inventories together, the average annual rates of investment of HINDALCO and INDAL were Rs.8.53 crore and Rs.7.03 crore, respectively. Corresponding figures for the period 1978-88 were Rs.4.06 crore for HINDALCO and Rs.3.05 crore for INDAL. Thus, compared to the period 1965-69, the rates of investment were much lower during 1978-88. This may be treated as an indication of the depressing effect of price and distribution control on investment activity in the aluminium industry.
The rate of investment of F NDALCO fell sharply in the period 1970-77 in relation to the period 15 ,5-77 in relation to the period 1965-69. In the case of INDAL, the fall in the investment rate was relatively much smaller and there was a marginal increase inthe rate of investment infixed assets. This contrast between HINDALCO and INDAL may have an explanation in the differential profitability performance of the two companies. The average rate of profitability (net profits to net worth) of HINDALCO declined from 18.3 per cent during 1965-69 to 3.2 per cent during 1970-77. Retained profits per year came down from Rs.2.7 crore during 1965-69 to Rs.0.3 crore during 1970-77. Unlike the experience of HINDALCO, there was no marked deterioration in the profitability performance of INDAL after 1970. The average rate of profit during 1970-77 was 11.8 per cent as against 13.9 per cent during 1965-69. Also, retained profits per year was Rs.2.5 crore during 1970-77 as against Rs.1.5 crore during 1965-69. Another point to be noted in this connection is that HINDALCO substantially reduced its outstanding long-term debt between 1970 and 1977. By the end of 1969, deferred liabilities of HINDALCO stood at Rs.19.4 crore. This was reduced to Rs.0.5 crore by the end of 1977. In the next ten years, on the other *iand, there was a large inflow of long-term debt, and deferred li-Kiiiics of the company stood at Rs.95.2 crore by the end of March1989.

INVESTMENT BEHAVIOUR 87
Investment Function Analysis
In empirical studies on investment behaviour, the use of the investment function methodology is quite common. A number of studies for Indianindustriesareavailableinwhich such analysis has been carried out. Mentionable among them is the study of Krishnamurthy and Sastry (1975) in which a systematic analysis of investment and financing decisions of Indian companies was undertaken for seven selected industries (cotton textiles, jute, sugar, paper and paper board, chemicals, engineering and cement), covering the decade 1960-70 for analysis of time series of cross-section of firms, and the period 1956-71 for time series analysis at the industry level.
For Indian aluminium companies, investment function has been estimated by Gupta (1987). He has estimated two equations, one for fixed investment and the other for inventory investment, using pooled time- series and cross-section data, forthe period 1966 to 1974 for HINDALCO, INDAL and MALCO. Alternative specifications of the fixed and inventory investment functions have been tried and dummy variables have been used to allow the intercept vary across firms picking up thereby the influence of firm specific factors. The results of the study indicate that current profits and external finance are important determinants of fixed investment, while the demand factor is not found to be as important. As regards the determinants of inventory investment, the demand factor and external finance are found to be significant. The results also suggest that fixed and inventory investments compete for investment funds.
The specifications of the fixed and inventory investment functions used for the present analysis are similar to those used by Krishnamurty and Sastry (1975) for time-serics analysis. The equations have been specified in the following way :
It = f [ DSt, DSt-l, DSt-2, DSt-3, Pt, FDt ]

88 EFFECTIVE INCENTIVES FOR ALUMINIUM INDUSTRY IN INDIA
INt = g [ DSt, DSt-1, Pt, It, INSt-1 ]
Where,
It = gross fixed investment in year t,
DSt = change in sales in year t,
Pt = profits net of taxes but gross of depreciation in year t,
FDt = net flow of long-term debt in year t,
INt = inventory investment in year t, and
INSt-l = stock of inventories at the end of period t-1.
The investment model used for the analysis is based on the flexible accelerator hypothesis with profits and external finance. For convenience of estimation, the equations are taken as linear. These are estimated by the OLS method using data for the period 1968 to 1988.6
All the variables listed above have been deflated to correct for price changes. The deflators used for fixed investment and inventory investment have already been described above. A weighted average of these two deflators has been used to deflated gross profits and flow of long-term debt in order to express them in terms of the purchasing power of investment goods.7 The time series on sales has been deflated by the wholesale price index for aluminium and changes in sales (DSt, etc) have been computed from the deflated sales series.
Regression results for the fixed and inventory investment equation are presented in Tables 6.2 and 6 3 respectively. The equations have been estimated first for HINDALCO and INDAL separately and then by pooling data for the two companies. While estimating the equations from pooled data, a dummy variable, taking value unity for HINDALCO and zero for INDAL, has been introduced to pick up the influence of firm specific factors (as Gupta 1987, Krishnamurty-Sastry 1975, and many others have done).

INVESTMENT BEHAVIOUR 89
It is seen from Table 6.2 that the estimates of the fixed investment function for HINDALCO and INDAL are similar. In both cases, the coefficients of the sales-change variables are statistically insignificant while the coefficient of the debt- flow variable (FD) is positive and statistically significant. The coefficient of the profit variable (P) has the correct sign, but it is not statistically significant. Applying the Chow test, it is found that the hypothesis that the coefficients of the fixed investment function do not differ between HINDALCO and INDAL is not rejected by the data. The computed F-ratio is 1.07 which is lower than the tabulated F-value of 2.36 at 95 per cent level of confidence. This provides some justification for pooling data for the two companies.
When the fixed investment equation is estimated from pooled data, the coefficients of both profit and debt-flow variables are found to be positive and statistically significant. The coefficients of the sales-change variables are positive, as expected, but these are not statistically significant. When the four sales- change variables are replaced by their average, the coefficient is again found to be positive but statistically insignificant.
The regression results presented in Table 6.2 indicate that profitability and inflow of long term debt are important determinants of fixed investment in the two aluminium companies under study. The demand factor is found to be relatively unimportant. These results accord well with the results reported by Gupta for aluminium companies for the period 1966-74.
Turning now to inventory investment, it is seen from Table 6 3 that equations obtained for HINDALCO and INDAL are similar. The coefficients of the sales-change variables are wrongly signed and statistically insignificant for both companies. The coefficient of the inventory-stock variable (INSt-1) is statistically significant for both companies, which implies that the stock of inventories adjusts to its desired level with a lag. The coefficient of the profit variable (P) is positive, but not statistically

90 EFFECTIVE INCENTIVES FOR ALUMINIUM INDUSTRY IN INDIA
significant. The coefficient of the fixed investment variable (I) is positive for both companies, but statistically significant only for HINDALCO.
The application of the Chow test to test for equality of coefficients yields the same result as obtained for the fixed investment equation. The computed F-ratio is 1.37 which is lower than the critical F-value of 2.42 at 95 per cent level of confidence. Thus, some justification is provided for pooling data for the two companies.
The results obtained from pooled data are not much different from those obtained for the companies separately. The coefficients of the current and one year lagged sales-change variables are negative and statistically insignificant. Replacing these two variables by their average makes little difference to the results. The coefficient of the profitability variable is positive, as one would expect, but it is not statistically significant. The coefficient of the fixed investment variable is positive and statistically significant, which indicates a complementary relationship between fixed and inventory investment.
The finding of a significant positive relationship between fixed and inventory investment is at variance with the results reported by Gupta (1987), who found an inverse relationship (fixed and inventory investment competing for investment funds). Also, Gupta found the demand factor important in determining inventory investment, while the results obtained for this study provide no such indication. The differences in the findings of the two studies may be due to differences in specification of investment functions and time-period covered.
The coefficient of the firm dummy variable is negative in the equation for fixed investment, and is both negative and statistically significant in the equation for inventory investment. From this, it may be inferred that given the values of the explanatory variables, the level of investment in HINDALCO is lower than that in INDAL.

IN VESTMENT BEHAVIOUR 91
Effect of Government Regulation
To study the effect of government regulation on investment behaviour, the fixed and inventory investment functions have been re-es-
O
timated with intercept and slope dummies for the period 1978-88 during which there was strict government control on pricing and distribution of aluminium. The estimated regression equations are shown below. The figures in parentheses are t- values of the coefficients.
Fixed Investment
* I = Const - 0.45 AD + 0.72 (D* AD) + 0.86 P -0.49 (D* P)(-1.1) (1.6) (23) (-1.1)
+ 0.59 FD - 0.37 (D* FD) + 0.61 D - 0.89 FIRM (3.5) (-1.7) (03) (-1.0)
n = 42 R2 =0.55
Inventory Investmeni
IN = Const - 0.08 BD + 0.07 (D* BD) + 0.18 P - 0.12 (D* P)(-0.9) (0.7) (1.3) (-0.7)
+ 0.181 - 0.48 INSL + 1.00 D - 2.26 FIRM (2.3) (-4.0) (1.1) (-2.8)
n s 42 R2 = 0.47
In these two equations, D is a dummy variable taking value unity for observations for the year 1978 to 1988 and zero otherwise, and (D* P), (D* FD), etc. are slope dummies. FIRM is a dummy variable taking value unity for HINDALCO and zero for INDAL. AD is the average of the four sales-change variables and BD is the average of current and one year lagged sales cha nge variables. INSL denotes the stock of inventories with one year lag.
92 EFFECTIVE INCENTIVES FOR ALUMINIUM INDUSTRY IN INDIA
Comparing the two equatioas given above with the last equations of Tables 6.2 and 6.3, it would be realised that the inclusion of intercept and slope dummies for the period 1978-88 has not resulted in any large gain in the explanatory power of the model. It should also be noted that the coefficients of D and the slope dummies arc not statistically significant at 5 per cent level. Yet, the signs of the slope dummies do show a pattern. It is seen that the slope dummy for the sales-change variables has a positive coefficient, while the slope dummy for the profitability variable has a negative coefficient in both fixed and inventory investment equations. Further the coefficient of the slope dummy for the debt-flow variable is negative. From this, it appears that, in the period 1978-88 (when government control on the aluminium industry became much stricter), investment became more responsive to changes in demand and less responsive to financial variables.

INVESTMENT BEHAVIOUR 93
Table 6.1Average Annual Kates of Investment (at 1970-71 Prices),
HINDALCO and INDAL(Rs. lakh)
Gross Fixed Inventory TotalInvestment Investment Investment
HINDALCO
1965-69 764.61970-77 180.6-1978-88 374.4
88.2 852.8-16.1 164.531.8 406.2
INDAL
1965-691970-771978-88
559.4562.6297.3
143.8-29.8
73
703.2532.8304.6

94 EFFECTIVE INCENTIVES FOR ALUMINIUM INDUSTRY IN INDIA
Table 6.2
Determinants of Fixed Investment: Regression Results HINDALCO and INDAL
Period : 1968 to 1988 Dependent variable : It
HINDALCO INDAL Pooled
(1) (2)
ExplanatoryVariables
DSt -0.048 0.156 0.010(-0.89) (0.84) (0.18)
DSt-i 0.034 0.151 0.046 0.122(0.64) (0.71) (0.73) (0.72)
DSt-2 0.040 0.128 0.064 4-year(0.72) (0.73) (1.02) average
DSt-3 0.032 0.019 0.027(0.60) (0.15) (0.48)
Pt 0.240 0.556 0.425* 0.420’(1.59) (117) (2.53) (2.65)
FD. 0.389*’ 0.465* 0.348" 0.358*'(3.26) (2.16) (3.21) (3.43)
Firm Dummy -1.054 -1.007(HINDALCO) (-1.26) (-1.25)
n 21 21 42 42R2 0.585 0.486 0.468 0.457R2 0.407 0.266 0.359 0.399
t-values in parentheses.* significant at 5 per cent level, ** significant at 1 per cent level.

INVESTMENT BEHAVIOUR 95
Tabic 6.3Determinants of Inventory Investment: Regression Results
HINDALCO and INDAL
Period: 1968 to 1988 Dependent variable : INt
HINDALCO INDAL Pooled
(1) (2)
ExplanatoryVariables
DSt -0.020 -0.016 -0.018 -0.023(-0.91) (-0.18) (-0.63) (-0.50)
DSt-i 0.012 •0.007 -0.006 2-year(-0.55) (-0.08) (-0.20) average
Pt 0.329 0.082 0.065 0.061(0.47) (0-35) (0-77) (0.73)
It 0.351" 0.147 0.185* 0.187’(3.43) (1.12) (2.44) (2.51)
INSt-1 -0.683’ -0.426* 0.451** -0.452*’(-4.17) (-2.16) (-3.90) (-3.94)
Firm Dummy -2.133** -2.138**(HINDALCO) (-2-73) (-177)
n 21 21 42 42R* 0.609 0.407 0.435 0.433Rl 0.478 0.209 0.338 0.354
t-values in parentheses.* significant at 5 per cent level.
** significant at 1 per cent level.

96 EFFECTIVE INCENTIVES FOR ALUMINIUM INDUSTRY IN INDIA
NOTES
1. Each period includes both the initial and the terminal year.
2. Both cornpa nies have been consistently closing their a ccounts on 31st December. However, for 1988, accounts were closed on 31st March1989 for 15-month period. Thus, to compute the annual rate of investment and other variables of interest, proportional adjustments have been made.
3. The price indices used for deflating fixed and inventory investment have been taken from Revised Index Number of Wholesale Prices in India (CSO).
4. The weights are based on the composition of inventories in terms of materials and finished and semi-finished goods, and the pattern of consumption of raw materials and fuels.
5. The price index for aluminium includes both metal and semi- fabricated products.
6. For constructing some of the variables, e.g., DSt-4 data for years prior to 1968 are used.
7. Krishnamurty and Sastry (1975) used a similar deflator.
8. This is equivalent to estimating the functions separtely for the periods 1965-77 and 1978-88.

VII POST-DEREGULATION EXPERIENCE
When the prestigious NALCO smelter in the public sector went into production in March 1987, rumours began circulating that controls on aluminium industry would be soon lifted. It was widely believed that the government would lose no time in moving in that direction as soon as NALCO stabilised its production. Once it was known that in its first full year o f production NALCO was headed for achieving production of about 90 thousand tonnes, the government took the opportunity of Budget presentation to announce the decontrol of the aluminium industry from March 1989. Along with the decontrol, several changes were made in the duties on aluminium. Import duty on aluminium ingot was abolished1, and the import duty on aluminium waste and scrap was reduced from 35 per cent to 20 per cent. At the same time, excise duty rates on aluminium and its products were raised. The excise duty on primary aluminium was raised from 18% previously to 20% plus Rs.2500 per tonne. Excise duty on aluminium scrap, powders and flakes and other products like containers, stranded wires and cables was raised from 20% to 30%. Excise on rolled products was increased from 25% to 35%, while, on aluminium circles of 0.56 mm - 2 mm, the rate of duty was increased from 18% to 30%. There was also an increase in excise in aluminium foils from 15% to 25%. In raising the excise duty on aluminium and products, the object of the government, it seems, was to mop up the extra income to be earned by aluminium producers as a result of the decontrol.
After the decontrol announcement, the aluminium producers froze supplies for about a week to determine their prices. Subsequently, they raised the prices by Rs.2000 to Rs.3000 per tonne with effect from March

1. The price increases made by various producers are shown below :
Table 7.1 Price Increases in Aluminium
(Rs./tonne)
98 EFFECTIVE INCENTIVES FOR ALUMINIUM INDUSTRY IN INDIA
CG Ingot EC Ingot Wire Rods
BALCO 2101 2101 2576
HINDALCO 2101 2101 2576
INDAL 2081 2081 2456
MALCO 3251 3291 3866
NALCO 2051 3051 3026
Though with the removal of price control a spate of price increases was feared by aluminium consumers, this did not occur. Rather, there was a downward trend in the market price of aluminium ingot It is seen from Table 7.2 that in February 1989, i.e., before the decontrol, the price of aluminium ingot was Rs.47.77 per kg. in Bombay market and Rs.48.25 per kg. in Delhi market. By the end of 1989, the prices in Bombay and Delhi markets came down to Rs.42.33 and Rs.43.25 per kg., respectively. During this period, there was a downward trend also in the prices of aluminium sheets/coils.
One reason why large increases in aluminium prices did not take place in the post-deregulation period is that there was a significant downward trend in the international price of aluminium in this period and liberal, duty-free import of the metal was permitted by the government. It is seen from Table 7.3 that the price of high grade aluminium ingot in London Metal Exchange declined from $2712 per tonne in July 1988 (over $3600 per tonne in June 1988) to $1634 per tonne in December1989, and further to $1455 in February 1990.

POST-DEREGULATION EXPERIENCE 99
Table 7.2
Prices of Aluminium, Bombay & Delhi Markets
(Rs per kg.)
BombayIngot Ingot
Delhi-........... i -Coil 22 swg.
Oct. 88 41.44 40.50 47.60Nov. 88 41.52 40.88 50.25Dec. 88 43.41 45.25 57.25Jan. 89 46.61 47.25 60.00Feb. 89 A im 48.25 62.15Mar. 89 46.67 48.00 66.90Apr. 89 45.28 45.75 67.88May 89 45.23 44.95 61.46Jun. 89 44.64 44.93 58.81Jul. 89 43.75 44.42 57.56Aug. 89 43.27 43.65 56.10Sep. 89 42.29 42.93 55.10Oct. 89 43.40 42.75 56.50Nov. 89 42.70 43.63 56.00Dec. 89 42.33 43.25 55.50
Source: Minerals <& Metals Review, various issues.
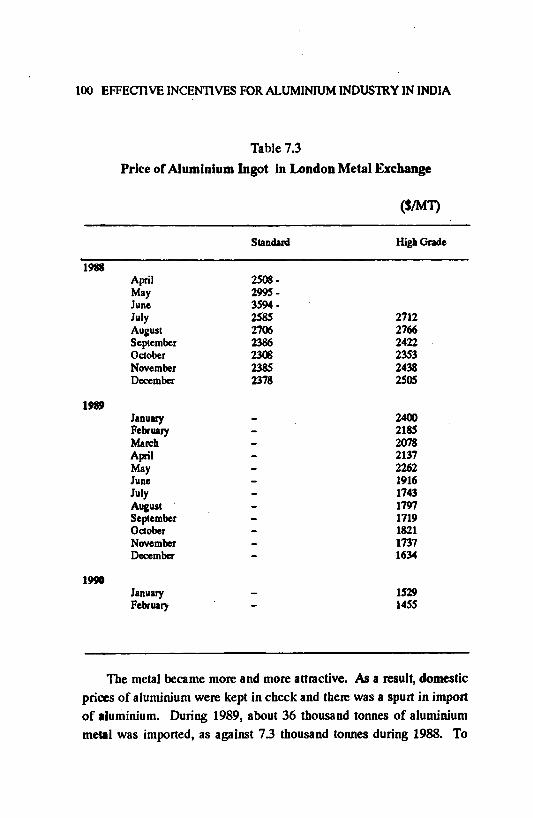
100 EFFECTIVE INCENTIVES FOR ALUMINIUM INDUSTRY IN INDIA
Table 7.3Price of Aluminium Ingot in London Metal Exchange
(S/MT)
Standard High Grade
1988April 2508-May 2995-June 3594-July 2585 2712August 2706 2766September 2386 2422October 2308 2353November 2385 2438December 2378 2505
1989January - 2400February - 2185Match - 2078April - 2137May - 2262June - 1916July - 1743August - 1797September - 1719October - 1821November - 1737December - 1634
1990January - 1529February 1455
The metal became more and more attractive. As a result, domestic prices of aluminium were kept in check and there was a spurt in import of aluminium. During 1989, about 36 thousand tonnes of aluminium metal was imported, as against 73 thousand tonnes during 1988. To

POST-DEREGULATION EXPERIENCE 101
check the spurt in aluminium import, the government reimposed customs duly on aluminium at the rate of 5% ad valorem plus Rs.2500 per tonne in October 1989. This has not, however, been much successful instopping aluminium import.
It would be interesting to take a look now at how the effective rates of protection to the production of aluminium and semi- fabricated products changed in the post-deregulation period. Since sufficient data are not available at present for 1989, only some rough estimates of the effective rates of protection for the period March-Decembfcr 1989 could be made, and these are shown in Table 7.4. Along with these estimates, similar estimates for 1986 and 1987 are also shown in the table.
Table 7.4Estimates of Effective Rates of Protection to Aluminium,
Rolled Products and Foils
(Per cent)
Aluminium Rolled Foils
1986 -0.9 95.7 142.6
1987 -12.4 210.7 323.9
1989 (March-Dec) -10 to -14 57.3 93.9
Comparing domestic (ex-factory) and border prices of aluminium ingot for the period March 1989 to December 1989, the nominal rate of protection to aluminium is found to be 0.6%. Since border prices for tradeable inputs used in aluminium production are not available, it is not possible to compute the nominal rate of protection to tradeable inputs (and therefore value added at world prices). However, going by the average rate of nominal protection to tradeable inputs in the estimates of effective protection to aluminium for three previous years (53.6% for 1988,76.6%
102 EFFECTIVE INCENTIVES FOR ALUMINIUM INDUSTRY IN INDIA
for 1987 and 96.2% for 1986), it does not seem unreasonable to assume that, in 1989, the average rate of nominal protection to tradeable inputs was somewhere in the range of 50% to 100%. The effective rate of protection to aluminium computed on the basis of this assumption, is found to lie in the range -10% to -14%. It may be inferred therefore that the production of aluminium metal continued to be dispiotected, even after the decontrol.
Estimates of effective rates of protection to rolled products and aluminium foils indicate that the production of these semi- fabricated products enjoyed significant protection during March- December 1989. There was, however, afallintherateof protection to these items compared to the protection rates prevailing in 1986 and 1986. It appears therefore the gap between the effective rate of protection to aluminium metal and to semi-fabricated products was reduced in the post-deregulation period.
POST-DEREGULATION EXPERIENCE 103
NOTES
1.
It would be recalled that by the end of 1988, the rate of import duty aluminium ingot was Rs.500 per tonne plus 5 % auxiliary duty.

v m AN OVERVIEW
In the 1950s and 1960s, the world aluminium industry experienced a rapid growth at the rate of about 10 per cent per annum. The Indian aluminium industry also experienced a rapid growth in this period. The installed capacity of aluminium production in India increased from 5 thousand tonnes in 1950 to 167.5 thousand tonnes in 1970. The growth rate in production was about 20 per cent per annum. There was a marked slowdown in the growth rate of world aluminium production after 1970. Between 1970 and 1980, the growth rate of production was 4.6 per cent per annum. And, after 1980, the growth rate of world aluminium production has been still lower. There was a similar slowdown in the growth of aluminium production in India. Between 1970-71 and 1987-88 the growth late was about 3 per cent per annum (as against 20 per cent per annum achieved in the two previous decades).
Six multinational companies (ALCOA, ALCAN, Kaiser, Reynolds, Pechiney and Allusuisse) dominate the world production of aluminium and thus have a strong influence on the world price of aluminium. Till the end of 1960s, these six companies together controlled over 70 percent of the world aluminium production. Their share has declined significantly since then. In 1980, the share of the six multinational companies in the world capacity of aluminium smelting was 41 per cent, and in 1985 it was 35 per cent. ,
The world price of aluminium ingot has remained relatively stable over time. In part, this is due to the big producers’ strategy to discourage new entrants by keeping aluminium price low and increasing it only in line with cost. Between 1960 and 1973, the price of aluminium in London market increased at the rate of only 2 per cent per annum. Between 1973 and 1978 there was a marked increase in the world price of aluminium (due in part to hikes in energy prices). But, the rate of increase was again

AN OVERVIEW 105
low in the period 1978 to 1986 which was marked by wide fluctuations in aluminium price from year to year. There have been sharp increases in the international price of aluminium in 1987 and 1988. The price of aluminium ingot in London market was $1312 in 1986. It increased to $1780 in 1987, and to over $2500 in 1988. There has been a substantial fall in the world price of aluminium during 1989. The price of high grade aluminium ingot in London Metal Exchange fell from $2505 in December 1988 to $1634 in December 1989, and further to $1455 in February 1990.
There was, on the other hand, a more or less steady increase in the price of aluminium in India. From a comparison of aluminium prices, it is found that during the last three decades the price of aluminium ingot in India was almost always higher than the price prevailing in London market The gap between the two prices has been fluctuating considerably, however. It is only in 1988 that the price of aluminium ingot in India was substantially lower than the price prevailing in international markets.
In the 1960s and early 1970s, there were four producers of primary aluminium metal in India - INDAL, HINDALCO, MALCO and ALUCOIN - all in the private sector. A public sector unit, namely, BALCO, entered the industry from the mid-1970s. Subsequently, ALUCOIN was merged with BALCO. Thus in the 1980s, till 1987, there were four primary aluminium producers in India - HINDALCO, INDAL and MALCO in the private sector, and BALCO in the public sector. Another major a luminium unit in the public sector, namely, NALCO, has come on stream recently, and the share of public sector in the production of aluminium ingot in the country is expected to go up sharply in the near future.
In 1950-51, the share of imports in the apparent consumption of aluminium ingot in India was 72.5 per cent. The industry made substantial progress in import substitution in the next two decades (thanks to various policies of the government) and the import availability ratio was reduced to 2.1 per cent by 1969-70. In the period 1972-73 to 1976-77, the country was almost self- sufficient in primary aluminium metal. However, in

106 EFFECTIVE INCENTIVES FOR ALUMINIUM INDUSTRY IN INDIA
years after 1977-78, the domestic production of aluminium did not grow fast enough to meet the increasing requirement of aluminium metal in India and as a result the import-availability ratio went up. In 1987-88, about one fifth of the consumption of aluminium metal in India was met through imports. Thus, in the period from 1977-78 to 1987-88 there was a growing dependence on imports. With a sharp rise in the international price of aluminium and substantial increase in domestic production, there was a drastic reduction in import dependence in 1988 when the import- availability ratio came down to 2.1 percent. But, in 1989, the dependence on imports increased again, and the import- availability went up to about 8 per cent.
The Indian aluminium industry has been under government regulation since 1970 (under Aluminium Control Order of 1970). There was control on pricing and also on the distribution of aluminium. Prior to 1975, the government exercised informal control over the distribution of aluminium. From 1975, the distribution was brought under the purview of the Aluminium Control Order. It was made necessary for each producer to product 50 per cent of his metal production as EC grade in the shape of ingots and wire rods, for supply to units against allotments made by the Aluminium Controller. In imposing this control, the main objective of the government \fras to ensure adequate availability of EC grade metal for the manufacture of cables and conductois needed for the rural electrification programme. However, in later years, this control on distribution caused serious problems for aluminium producers, since the State Electricity Boards slowed down investment in transmission and distribution and consequently the off-take of EC grade metal fell short of the stipulated 50 per cent level of metal production.
From 1970 to September 1978, a dual price system for aluminium ingot was followed. The price of EC grade metal was controlled by the government, while the price of CG aluminium ingot was fixed by the producing companies. From octobtr 1978, prices of both CG and EC grade metal were brought under government control. There was a system

AN OVERVIEW 107
of firm specific retention prices based on cost of production plus a post standard tax return on shareholders’ funds. From October 1979, the government bought imported aluminium (canalised through MMTC) under the ambit of price control and introduced a formula for calculation of ‘aluminium price equalisation amount’ to form a part of the Aluminium Regulation Account (associated with the retention price system).
It should be mentioned here that, after being under government regulation for about 18 years, the Indian aluminium industry was deregulated recently, in March 1989. However, most of the empirical analysis presented in the study relates to the period upto 1988, i.e., before the deregulation. The findings of the analysis for this period are discussed below. Some brief comments on the experience of the industry in the post- deregulation period are made later in the Chapter.
Radhakrishna and Kalra (1987) have analysed increases in cost of production and retention prices for aluminium producers for the period 1978 to 1983. Based on their analysis, they conclude that the increases in retention prices has not always kept pace with increases in costs. Similar analysis carried out for recent years brings out that in 1987 cost exceeded retention price for one firm and in 1988 this was so for three firms out of the four.
Although retention prices for aluminium ingot were supposed to give the producers a rate of return ranging from 7 per cent at 55 per cent capacity utilisation to 12 per cent at 90 per cent capacity utilisation, the revisions made to retention prices over time, it seems, did not keep pace with increasing costs and in consequence the producers often found the retention prices unremunerative. This had two effects : (1) increased use of ingots by the primary producers for their own consumption in semifabrication departments, and (2) a disproportionate increase in the prices of scmi-fabricated products by the primary producers to make up for unremunerative returns on the sale of ingot (and EC wire rods) at controlled prices.

108 EFFECTIVE INCENTIVES FOR ALUMINIUM INDUSTRY IN INDIA
Analysis of trends in profitability of aluminium companies in the private sector reveals that the rates of profitability were relatively lower in the period of government regulation, which perhaps indicates that the firms could not fully avoid the adverse effects of government control on profitability by increasing self-use of the metal and raising prices of semifabricated products (because the firms had to operate under certain constraint, e.g., being required to produce 50 per cent metal as EC grade, and even faced competition from secondary producers in markets for semi-fabricated products). The average profitability rates during 1965-69 were 18.3 per cent for HINDALCO, 13.9 per cent for INDALand 9.8 per cent for MALCO. During 1978-87, when both pricing and distribution controls were prevalent, the average profitability rate were 4.9 per cent for HINDALCO, 8.9 per cent for INDAL and -13.6 per cent for MALCO.
INDAL’s profitability seems to have suffered relatively less on account of government control on pricing and distribution of aluminium. The explanation for this probably lies in INDAL’s production structure. In relation to the production of primary metal, the production of semifabricated products has been much higher in INDAL.
For analysing effective incentives to the Indian aluminium industry, the methodologies of effective protection and effective subsidy rates, which have found wide application in empirical studies on trade policy, have been used in this study. ERP to primary aluminium metal has been estimated separately for the four primary producers and for the industry, for the year 1980,1983 and 1986 to 1988. Effective subsidy coefficient (ESC), taking into account subsidy on power used in aluminium production, has been estimated for three firms, for 1986 and 1987. Effective protection rates have been estimated also for the two processes, alumina refining and aluminium smelting, separately and for the production of semi-fabricated products. These estimates relate to 1986 and 1987.
Estimates of ERP to aluminium production presented in this study show considerable variation across firms and over time. Inter- firm differences in ERP is attributable primarily to the system of retention

AN OVERVIEW 109
prices. Inter-temporal variations in ERP are attributable mainly to fluctuations in international price of aluminium ingot and the domestic administered prices not being sufficiently linked to the international prices.
ERP estimates for aluminium are found to be negative for all the four primary producers for 1980,1983 and 1988. ERP estimates are found to be negative for two firms for 1986 and three firms for 1987, out of the four. For the industry as a whole, a near- zero ERP estimate of -0.9 per cent is found for 1986, while for the other four years the estimates of ERP are found to be significantly negative. The estimated ERP for the aggregate industry is found to be -44.5 per cent for 1988 and -50.8 per cent for 1980. These results indicate that in most years of the 1980s, the aluminium production activity in the country was significantly dis- protected. It may be mentioned here that negative estimates of ERP to ahiminium production has been reported earlier in the studies of Panchamukhi (1978) for 1970 and Gupta (1987) for 1977. It would appear therefore that the industry has been experiencing disprotection for a fairly long period in the past. Another point to be noted in this connection is that among other manufacturing industries for which ERP estimates are available for a recent year, the estimated ERP is positive in most cases. Thus, aluminium production belongs to that minority group of industries which was disprotected.
In a study of incentives to production activities, the question of subsidies on non-tradeable inputs is very important. Keeping this in view, subsidy on power used in aluminium production has been estimated and on that basis effective subsidy coefficient has been computed for three firms for 1986 and 1987. The estimated ESCs are found to exceed the EPCs appreciably and in one case the difference is substantial. From these results it appears that the ERP estimates overstate somewhat the extent of disprotection to the Indian aluminium industry.
Estimating ERP separately for alumina refining and aluminium smelting, it is found that the production of alumina from bauxite is

n o EFFECTIVE INCENTIVES FOR ALUMINIUM INDUSTRY IN INDI/
adequately protected, and it is the production of aluminium from alumina which has a negative effective rate qf protection.
Estimates of ERP for semi-fabricated products arc found to be positive. These are quite high for foils and rolled products other than foils. For 1987, the ERP estimates are 323.9 percent for foils and 210.7 percent for rolled products other than foils. ERP estimates for extruded products are relatively much lower. This is possibly explained by the existence of a large number of secondary producers of extruded products which might have made the market for extruded products very competitive.
It is important to recognise here the multiproduct character of the primary aluminium producing firms in India, who fabricate a substantial amount of the metal produced by them. To compute effective protection for the firms a weighted average of ERP estimates for aluminium, alumina (if sold outside the firm) and semi-fabricated products has to be taken, the weights being based on the pattern of sales. Evidently, although ERP estimates for aluminium are generally negative, the weighted averages may be positive.
The large difference found between ERP estimates for aluminium metal and ERP estimates for semi-fabricated products indicate that the government restrictions on trade, along with the government controls on pricing and distribution of aluminium, have seriously distorted the incentive structure in aluminium industry. These interventions have gone in favour of the production of semi-fabricated products and against the production of aluminium ingot. This may be expected to result in a relatively faster growth in production of semi-fabricated products than in the production of aluminium metal, making it necessary for the country to depend more and more on aluminium imports.
To suppliment the analysis of profitability and production incentives, a n a nalysis of investment behaviour has been underta ken for HINDALCO and INDAL covering the period 1965 to 1988. The analysis brings out that in both companies the rate of investment during 1978-88 (when the
AN OVERVIEW 111
industry was under strict government control) was much lower than that during 1965-69. This may be treated as an indication of the depressing effect of government regulation on investment activity. To draw suchinference is not unjustified since the estimates of investment function\show that profitability is an important determinant of investment, and the analysis of profitability brings out that the profitability of aluminium companies was relatively lower in the period of government regulation. Another interesting finding emerging from the analysis of investment behaviour is that investment became more responsive to demand and less responsive to financial variables in the period 1978-88 compared to the period 1965-77.
The scrapping of the price and distribution control on aluminium ingot and EC wire rods by the government with effect from March 1989 is a major development in the industry. Though at the time of the deregulation, a spate of price increases was feared by aluminium consumers, it did not occur. Rather, there was a downward trend in aluminium prices since March 1989. One reason why large increase in aluminium prices did not take place in the post-deregulation period is that there was a significant downward trend in the price of aluminium ingot in international markets in this period and liberal, duty-free imports of the metal was permitted by the government. Some rough estimates o f the effective rates of protection made for the period March-December 1989 indicate that the production of aluminium remained disprotected even after the decontrol. Production of rolled products and foils, on the other hand, enjoyed significant protection, though there was a reduction in the rate of protection in relation to the rates prevailing in 1986 and 1987. It seems therefore the gap between the effective rates of protection to aluminium metal and to semi-fabricated products got narrowed in the post-deregulation period.
While lifting controls on the aluminium industry, the government abolished import duty on aluminium. It did not matter much at that time since the prevailing international price of aluminium was significantly

112 EFFECTIVE INCENTIVES FOR ALUMINIUM INDUSTRY IN INDIAj
higher than the domestic price. However, with successive decline in the price of aluminium in international markets, imports of aluminium became more and more attractive. This led to a spurt in imports. To check the spurt in aluminium imports, the government reimposed customs duty on aluminium at the rate of 5% ad valorem plus Rs.2500 per tonne in October 1989. Subsequently, aluminium was shifted from Open General License to the Limited Permissible List. In the Budget for 1990-91, customs duty on aluminium has been raised to 5% ad valorem plus Rs.6000 pertonne. For aluminium waste and scrap, the duty rate has been raised from 15% to 35% ad valorem. These changes in tariff should raise the effective rate of protection to aluminium and reduce further the gap between effective protection rates for aluminium and semi-fabricated products.

113
REFERENCES
Brown, M., Dammeit,( A., Meeraus, A. and Stoutjesdijk, A. (1983), “Worldwide Investment Analysis: The Case of Aluminium”, World Bank Staff Working Paper No.603.
Brown, M. and McKern, B.(1987), Aluminium, Copper and Steel in Developing Countries, OECD, Development Centre.
Corden, W.M. (1971), The Theory of Protection, Oxford: Oxford University Press.
Corden, W.M. (1985), Protection, Growth and Trade: Essays in Intema- tional Economics, Basil Blackwell, Oxford.
Das-Gupta, S.K. (1985), “Bauxite Mining in India”, Minerals and Metals Review, August, Pp 33-36.
Gupta, N.C. (1987), Productivity, Investment and Import Substitution in Indian Industries, Anmol Publications, New Delhi.
Kalra, G.D. (1988), “Wanted: A Close Look at Pricing Policy”, Minerals and Metal Review, August, Pp 64-67.
KrishnamurtiK- and Sastry, D.U. (1975), Investment and Financig in the Corporate Sector in India, Tata McGraw-Hill Publishing Company, New Delhi.
Lai, V.B. and Abroi, D .K (1986), “The Aluminium Industry in India: Some Neglected Issues”, Minerals and Metals Review, August, Pp 34-41.
National Council of Applied Economic Research (NCAER), Forward and Backward Linkages in Non-Ferrous Metals and Coal and Lignite Sectors, Vol.II.

114 EFFECTIVE INCENTIVES FOR ALUMINIUM INDUSTRY IN INDIA
Panchamukhi, V.R.(1978), Trade Policies of India, Concept Publishing Company, Delhi.
Pursell, G. and Roger, N. (1985), Mnual for Incentive and Comparative Advantage Studies, World Bank.
Radhakrishna, P.N. and Kalra, G.D. (1987), Aluminium Industry in India, Problems and Prospects, NCAER, Delhi, Vols. I andII.
Ramaratnam, K. (1987), “Alumina - The Wonder Material”, Minerals and Metals Review, November, Pp 22-24.
Rao, P.S. (1980), “A Blue Print for Growth”, Minerals and Metals Review, August, Pp 52-56.
Shah, N.H. (1986), “Developing Applications of Aluminium in India”, Minerals and Metals Review, August, Pp 29-30.
Thangaiju, N. and Kothari V.S. (1986), Energy Use in Aluminium Industry, Tata Energy Research Institute, New Delhi.
Tower, E. (1984), “Effective Protection, Domestic Resource Cost, and Shadow Price”, World Bank Staff Working Paper, No.664, September.


![3 All] Indal Kumar Kushwaha and another V. Rajesh …3 All] Indal Kumar Kushwaha and another V. Rajesh Kumar Gupta and others 639 6. At the admission stage, the following substantial](https://static.fdocuments.in/doc/165x107/5e553e705b98911a592b5dc5/3-all-indal-kumar-kushwaha-and-another-v-rajesh-3-all-indal-kumar-kushwaha-and.jpg)