Effective Implementation of Electric Boosting In Glass ... · Effective Implementation of Electric...
27
Effective Implementation of Electric Boosting In Glass Melting Furnace Mahdie Moaveni 2017 ICG Annual meeting & 32 nd sisecam symposium, Istanbul
Transcript of Effective Implementation of Electric Boosting In Glass ... · Effective Implementation of Electric...

Effective Implementation of Electric Boosting In
Glass Melting Furnace Mahdie Moaveni
2017 ICG Annual meeting & 32nd
sisecam symposium, Istanbul

SIMULLEX GmbH is a consulting and engineering company based in Germany,
specialized in glass melting furnaces.
Our competence is mainly the conduction and evaluation of studies of the melting
concept using the CFD simulation of melting and conditioning processes of all
types of glass.
Introduction 2
The challenges that are posed to today’s competitive glass industry are
environmental emission regulations, higher performance and energy saving.
Precise solutions for each furnace design are required to meet glass
production’s requirements and overcome these challenges.
Advanced computer modeling and an analysis of glass melting furnaces are
reliable tools, which allow you to forecast and to visualize effect of any changes
in geometrical and operational parameters prior to implementation.
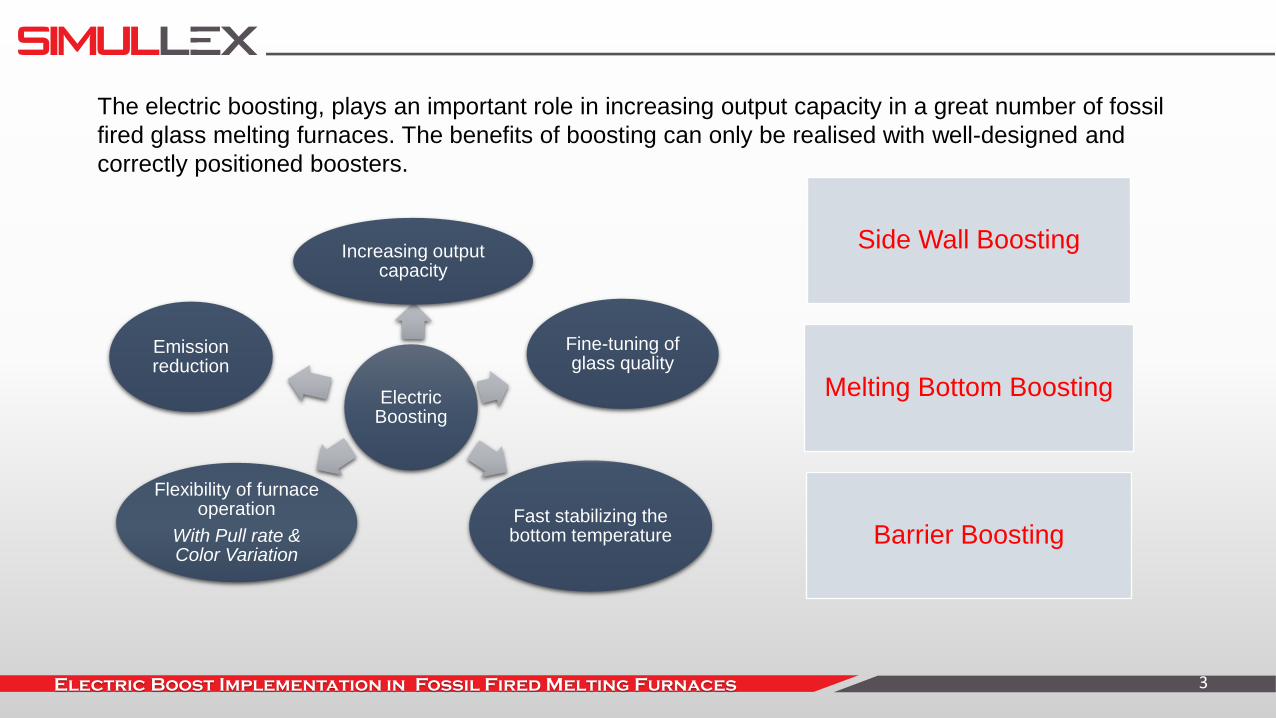
Side Wall Boosting
Melting Bottom Boosting
Barrier Boosting
The electric boosting, plays an important role in increasing output capacity in a great number of fossil
fired glass melting furnaces. The benefits of boosting can only be realised with well-designed and
correctly positioned boosters.
Electric Boosting
Increasing output capacity
Fine-tuning of glass quality
Fast stabilizing the bottom temperature
Flexibility of furnace operation
With Pull rate & Color Variation
Emission reduction
Electric Boost Implementation in Fossil Fired Melting Furnaces 3

Electric Boost Implementation in Fossil Fired Melting Furnaces 4
Well-designed boosting system
Improvement of furnace performance efficiency; Higher productivity
Optimum convection flow in melting area
Proper bottom and riser temperature
Glass quality improvement
Crucial parameters of suitable boosting system design
Type of product / glass composition
Furnace geometry; Splitting concept of energy (Electricity & Fossil)
Presence of other elements instance of bubbling, preheating system, etc.
Experience of furnace designer and furnace operator
Investment & Operation costs e.g. No. of transformers, No. of electrodes, electrode cooling, etc.
Difficulties during maintenance
Mathematical analysis; CFD Simulation

Modelling Case Study
Model Case Study
Case I
119 sqm, 370 tpd, green glass
Case I_V 01
Side Wall Boosting
Case I_V 02
Melting Bottom Boosting
Case I_V 03
Side Wall & Barrier Boosting
Case II
170 sqm, 450 tpd, green glass
Case II_V 01
Side Wall & Barrier Boosting
Case II_V 03
Side-Bottom & Barrier Boosting
Modelling case study:
1. 119 sqm end fired furnace; 370 tpd
2. 170 sqm end fired furnace; 450 tpd
5

Case I; General geometry Description
14000
8500
Pull Rate tpd 370
Product Container Glass
Color green
Cullet % 60
Length mm 14000
Width mm 8500
Melting Surface sqm 119
Melting Depth mm 1200
Ref. Depth mm 2200
Specific Melting
surface t/sqm 3.11
Doghouse 2 Side wall
Burners 3 (each Port)
Natural Gas Nm³/h 1150
Electric Boosting kW 1600
Energy Consumption Kcal/Kg 753
Energy Consumption KJ/Kg 3153
6
Case I

Case I; Boosting Configuration
Case I_V 01
Total Electric power: 1600 KW
12 Side Electrodes
Case I_V 02
Total Electric power: 1600 KW
12 Melting Bottom Electrodes
Case I_V 03
Total Electric power: 1600 KW
6 Side Electrodes (60% El. Power)
10 Barrier Electrodes (40 % El.
Power)
7

Evaluation of Case Study
Temperature distribution in glass batch and superstructure
• Desired riser temperature
• Proper bottom temperature
• Crown temperature over the wall
Convection flow in melting area
Glass quality factors
Evaluation 8
Temperature (°C) Glass Tank Model
Temperature (°C) Combustion Model
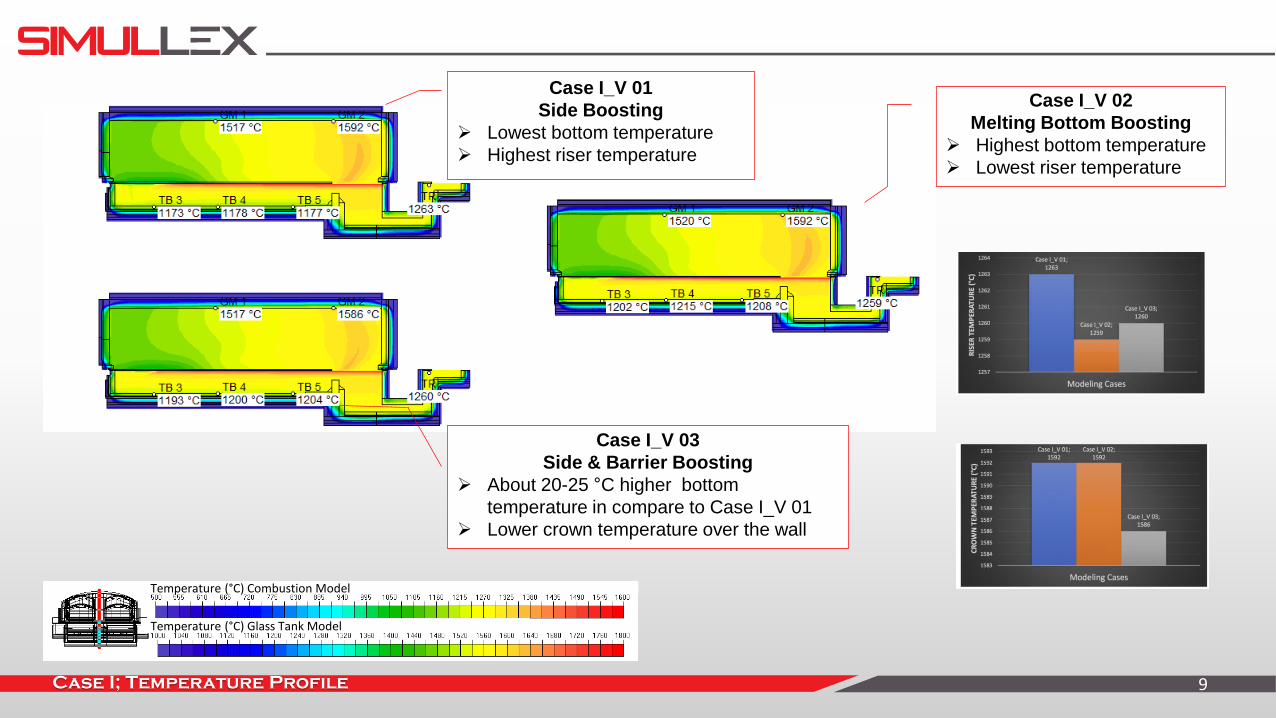
Case I; Temperature Profile
Case I_V 02
Melting Bottom Boosting
Highest bottom temperature
Lowest riser temperature
Case I_V 01
Side Boosting
Lowest bottom temperature
Highest riser temperature
Case I_V 03
Side & Barrier Boosting
About 20-25 °C higher bottom
temperature in compare to Case I_V 01
Lower crown temperature over the wall
9

Case I; Convection Flow; Glass Streamlines; Temperature Profile
Case I_V 01
Side Boosting
Case I_V 02
Melting Bottom
Boosting
Case I_V 03
Side & Barrier
Boosting
10

Case I; Bottom Temperature
Average Temperature of a slice 50 mm from the bottom
along the furnace length
Bottom Temperature (°C) (Refractory)
Case I_V 01
Side Boosting
Case I_V 02
Melting Bottom
Boosting
Case I_V 03
Side & Barrier
Boosting
11

Case I; Temperature profile
Case I_V 01
Side Boosting
Case I_V 02
Melting Bottom
Boosting
Case I_V 03
Side & Barrier
Boosting
12

Glass quality parameters are derived from particle tracking in the glass model.
A large number (200 000) of massless particles are released from the batch chargers and their
trajectories are calculated through the furnace until the outputs at the model end.
Calculation of the residence time for each particle in the glass model
Storage of temperature, viscosity and velocity along each trajectory calculation of the melting, fining
and mixing index
The melting index: indication of the melting quality along the trajectory: a high value means that the
particle resides for a long time in regions with high temperature and low viscosity. ∫Trajectory(T/μ)dt,
The fining index: indication of the fining quality along the trajectory: a high value means that the
particle resides for a long time in regions with temperature above a typical fining temperature and low
viscosity. ∫trajectory((T − A)b /μc)dt
The mixing index: indication of the mixing quality or the inhomogeneity dilution along the trajectory:
the value denotes how many times a 1 cm thick cord can be diluted along the trajectory.
∫trajectory(4 ||grad v|| 2/3 Dr 1/3 )/ (3(0.012/3))dt
Quality Analysis 13

Case i; Quality Analysis
Residence time is the time which the particle spent on its way between the starting point (batch chargers) and the target planes. The Case I_V 03 (Side & Barrier Boosting) shows the highest min. residence time of particles. Subsequently Case I_V 02 (Bottom Boosting) and the lowest value is related to Case I_V 01.
14
The path of fastest particles with minimum residence time

Case i; Quality Analysis
Melting index is a function of local temperature on the trajectory, of dynamic viscosity of glass and of
time. The higher the value of melting index of each trajectory, the longer time has the particle spent in
regions of high temperature and of low viscosity. Thus the melting index informs us about the quality of
melting along the trajectory. The absolute value of melting index depends on the type of glass.
The Case I_V 03 (Side & Barrier Boosting) shows the highest Melting Index
of critical particles. Subsequently Case I_V 02 (Bottom Boosting) and the lowest
Value is related to Case I_V 01 (Side Boosting).
Mixing index is an indicator of inhomogeneity dilution capabilities. It is function of local velocity gradient
tensor and diffusivity of typical cord compound (Al2O3, SiO2, and ZrO2). The results tell us how many
times a 1 cm thick cord has been diluted while it follows the massless particle trajectory.
The Case I_V 03 (Side & Barrier Boosting) shows the highest Mixing Index of critical particles.
Subsequently Case I_V 01 (Side Boosting) and the lowest value is related to Case I_V 02 (Bottom Boosting).
15

Case i; Quality Analysis
Sand dissolution index is a computation for each massless particle's trajectory which corresponds to
sand grain tracing. Statistics are performed on the resulting values. For each trajectory, the theoretical
largeness of sand grains that would be able to be dissolved is calculated. Consequently, as the sand
grain travels through the glass melt, it gradually dissolves at the rate given by the grain growth function
that depends on temperature.
Bubble growth index is a refining indicator which depicts the speed of growth and dissolution of the
bubbles in the glass melt.
The Case I_V 03 (Side & Barrier Boosting) shows the highest values in both indexes.
Subsequently Case I_V 02 (Bottom Boosting) and the lowest value is related to
Case I_V 01 (Side Boosting).
16

Case I; Conclusion
Conclusions Case I:
The Case Study shows that the 119 sqm furnace with Side Wall & Barrier Boosting results higher furnace
efficiency in comparison to the case with Side Wall Boosting and the case with Melting Bottom Boosting
regarding:
Temperature profile in melting depth
Convection flow in melting area
Glass quality
Bottom temperature
17
Is this solution still valid for the furnace with larger
dimension?
This issue has been investigated in Case II of case study.

Pull Rate tpd 450
Product
Container
Glass
Color green
Cullet % 30
Length mm 17000
Width mm 10000
Melting Surface sqm 170
Melting Depth mm 1300
Ref. Depth mm 2500
Specific Melting
Surface t/sqm 2.65
Doghouse 2 Side wall
Burners 3 (each Port)
Natural Gas Nm³/h 1600
Electric Boosting kW 1600
Energy Consumption Kcal/Kg 833
Energy Consumption KJ/Kg 3486
Case II; General Description 18
• High ratio of Fe2 /(Fe2 + Fe3)
• Low thermal conductivity
• Higher temperature gradient in glass depth
• Wide furnace
• High distance of crown in the middle to glass surface
• Weak radiation heat transfer from crown to glass surface
• More distance of side electrodes
• Deeper melting bath
Deviations from Case I: Case II
17000 10000

Case II; Boosting Configuration
Case II_V 01
Total Electric power: 1600 KW
Circle 1: 12 Side Electrodes
Circle 2: 12 Barrier Electrodes
19
Case II_V 02 Total Electric power: 1600 KW
Circle1: 8 Side Electrodes & 4 Bottom
Electrodes
Circle 2: 12 Barrier Electrodes

Temperature (°C) Glass Tank Model
Temperature (°C) Combustion Model
Case I; Temperature Profile
Case II_V 02
Side-Bottom & Barrier
Boosting
Higher bottom
temperature
higher riser temperature
Case II_V 01
Side Boosting &
Barrier Boosting
20

Case I; Convection Flow; Glass Streamlines; Temperature Profile
Case II_V 01
Side Boosting &
Barrier Boosting
Case II_V 02
Side-Bottom &
Barrier Boosting
21

Case Ii; Bottom Temperature
Average temperature of a slice 50 mm from the bottom
along the furnace length
Bottom Temperature (°C) (Refractory)
Case II_V 01
Side Boosting &
Barrier Boosting
Case II_V 02
Side-Bottom &
Barrier Boosting
22
Higher bottom temperature in the melting area in the case II_V 02 is observed.

Case II; Quality Analysis 23
Residence Time (hr)
The path of fastest particles with minimum residence time
Residence time
It’s obvious that the paths of critical particles are more or less similar and that consequently no mentionable advantage through the
relocation of 4 side electrodes to the bottom is achievable.

Case II; Quality Analysis 24
1,00
1,10
1,20
1,30
1,40
1,50
1,60
1,70
1,80
1,90
2,00
Min.Mixingindex
CaseII_V01
CaseII_V02
Regarding the melting index and the sand dissolution index, a considerable improvement can be observed in the Case with the
boosting configuration of Side-Bottom Boosting & Barrier Boosting, whereas the mixing index stays unchanged in both cases.
Melting Index Mixing Index
The results of the massless particle tracing depict that the relocation of 4 of the 12 side electrodes to the bottom has no significant
influence on the residence time, the bubble growth index as well as the fining index of critical particles.
Bubble Growth Index Sand Dissolution Index

Case ii; Conclusion
Conclusions Case II:
The Case Study shows that the 170 sqm furnace with Side-Bottom & Barrier Boosting results higher
furnace efficiency in comparison to the case with Side Wall & Barrier Boosting regarding:
Temperature profile in melting depth
Melting and sand dissolution indicators of glass quality
Bottom temperature
25

Case ii; Conclusion
Conclusions
The Case Study of two furnaces with different dimensions shows that the boosting configuration has an
important influence on the furnace performance regarding glass quality, temperature distribution and
glass current in the furnace. Hence, with the right positioning of the electrode in the Fossil-Electric
furnaces, even while keeping the same amount of energy, we are able to improve the factors referred to
above.
This study has been performed for the mentioned design parameters. Any changes in the furnace
concept regarding furnace geometry, type of glass or the usage of other elements like bubbling and
preheating system can lead to different outcomes.
The significance of individual solution designs for different furnace categories in terms of the furnace
geometry is demonstrated by the evaluation of the results of both case studies. Thus, an optimum
furnace performance can be accomplished through an effective electric boosting configuration.
26

Thanks for your attention!
Dipl.-Ing. Mahdie Moaveni SIMULLEX GmbH
Thomastrasse 7,
92665 Altenstadt
Germany
Phone: +49 9602 6175448
Fax: +49 9602 6175449
Mobile: +49 151 1213 0275
Email: [email protected]
Internet: www.simullex.com


![Delta Boosting Machine and its Application in Actuarial ... · (MARS), regression trees [22] and boosting. 1.1. The Boosting Algorithms. Boosting methods are based on an idea of com-bining](https://static.fdocuments.in/doc/165x107/5f39fd86e92ad51969114a8c/delta-boosting-machine-and-its-application-in-actuarial-mars-regression-trees.jpg)