
Effective Exercise for Fall Prevention— Research and Implementation BC Injury Research &...
26
Effective Exercise for Fall Prevention—Research and Implementation BC Injury Research & Prevention Unit Teleconference Series September 17, 2009 Judy A. Stevens, Ph.D. National Center for Injury Prevention & Control Centers for Disease Control & Prevention
-
Upload
steven-fitzgerald -
Category
Documents
-
view
214 -
download
0
Transcript of Effective Exercise for Fall Prevention— Research and Implementation BC Injury Research &...
Effective Exercise for Fall Prevention—Research and Implementation
BC Injury Research & Prevention Unit Teleconference Series
September 17, 2009
Judy A. Stevens, Ph.D.
National Center for Injury Prevention & Control
Centers for Disease Control & Prevention

Outline
• Background on falls & fall risk factors
• What research tells us about exercise for fall prevention
• Identifying & implementing effective exercise programs
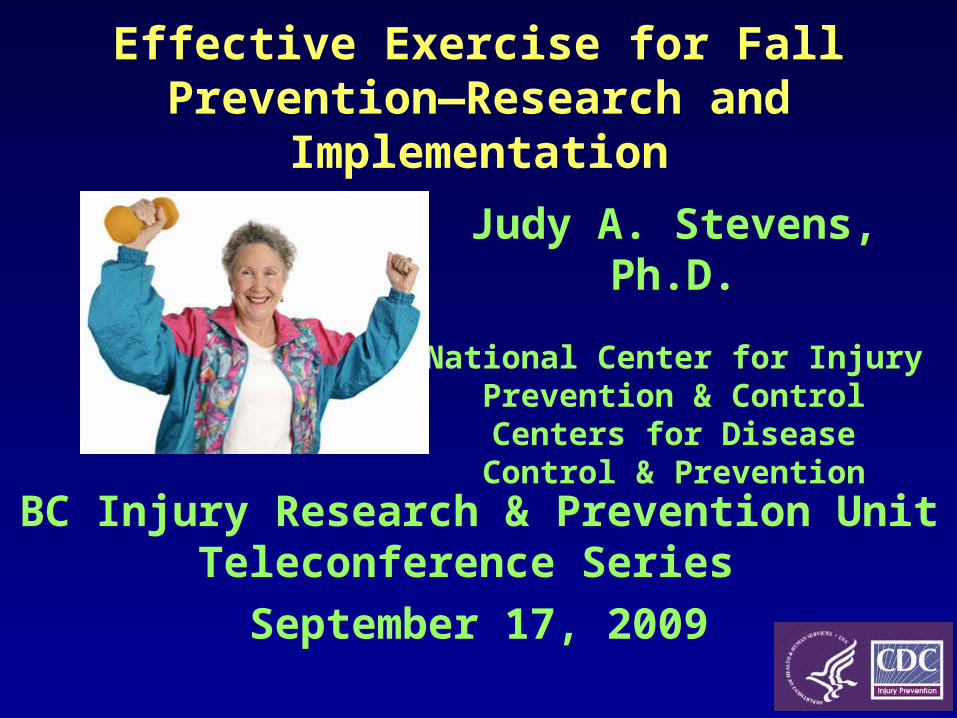
Introduction
• 30-35% of people 65+ fall each year1
• Those who fall are 2-3 times more likely to fall again2
• 10%-20% of falls cause serious injuries3
__________
1. Hornbrook, Gerontologist, 1994; Hausdorff, Arch Phys Med & Rehab, 2001 2. Tinetti, New Eng J Med, 1988; Teno, JAGS,19903. Sterling, J Trauma-Inj Infection & Critical Care, 2001
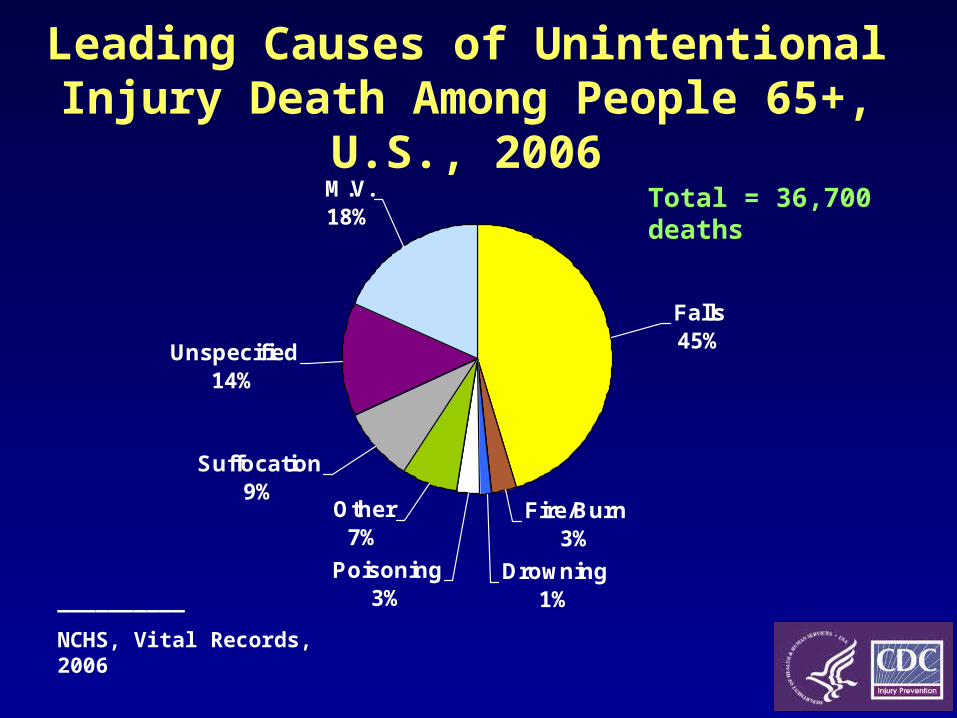
Leading Causes of Unintentional Injury Death Among People 65+, U.S., 2006
M.V.18%
Falls45%
Fire/Burn3%
Drowning1%
Other7%
Poisoning3%
Suffocation9%
Unspecified14%
__________
NCHS, Vital Records, 2006
Total = 36,700 deaths

Fall Death Rates by Sex & Age, U.S., 2006
020
406080
100
120140160
180200
65-69 70-74 75-79 80-84 85+
Age groups
Ra
te p
er
10
0,0
00
Men
Women
__________
NCHS, Vital Records, 2006
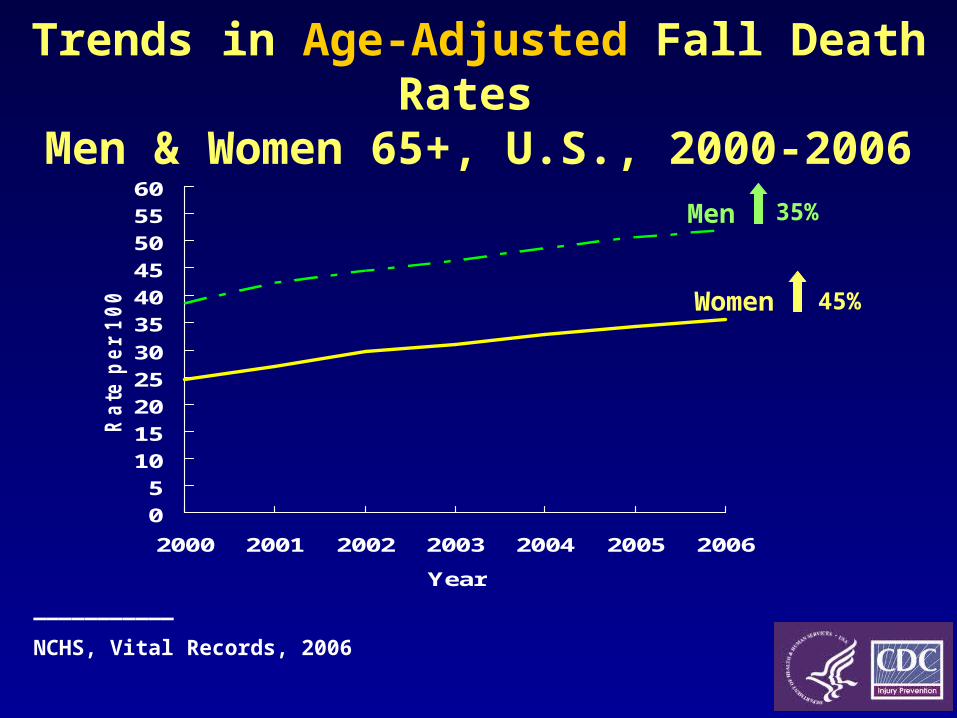
Trends in Age-Adjusted Fall Death Rates Men & Women 65+, U.S., 2000-2006
0
5
10
15
20
25
30
35
40
45
50
55
60
2000 2001 2002 2003 2004 2005 2006
Year
Ra
te p
er
10
0,0
00
Men
Women
___________
NCHS, Vital Records, 2006
35%
45%

Leading Causes of Nonfatal Injuries Among People 65+, U.S., 2007
Struck by/Against8%
MV Occupant5%
Overexertion6%
Cut/pierce4%
Other transport2%
Poisoning2%
All others7%
Bite/sting2%
Unknown2%
Falls62%
__________
NEISS-AIP, 2007
Total = 3.1 million injuries
N=1.9 million

Nonfatal Fall Injury Rates by Sex & Age, U.S., 2007
0
2000
4000
6000
8000
10000
12000
14000
65-69 70-74 75-79 80-84 85+
Age groups
Ra
te p
er
10
0,0
00
Men
Women
__________
NEISS-AIP, 2007

Trends in Age-Adjusted Nonfatal Fall Rates Men & Women 65+, 2001-2007
0
1000
2000
3000
4000
5000
6000
7000
8000
2001 2002 2003 2004 2005 2006 2007
Year
Pe
r 1
00
,00
0 P
op
ula
tio
n
Men
Women
_________
NEISS-AIP 2001-2007
8%
6%

Where Do Falls Happen?
• At home, outside…….......35%
• At home, inside…………..23%
• Away from home, in a
familiar place……………..23%
• Away from home, in an
unfamiliar place………….19%
______
Berg WP, Age & Ageing, 1997

When Do Falls Happen?
30%
52%
14%4%
______
Berg WP, Age & Ageing, 1997
0
25
50
75
100
Morning Afternoon Evening Night
Time of Day
Pe
rce
nt
of
Fa
lls
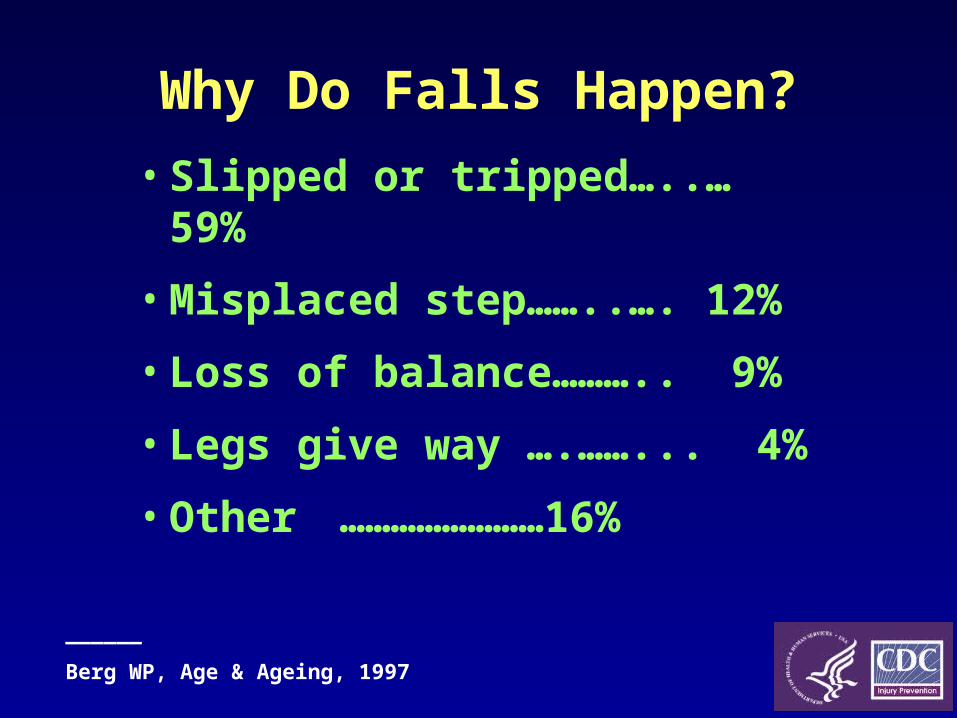
Why Do Falls Happen?
• Slipped or tripped…..… 59%
• Misplaced step……..…. 12%
• Loss of balance……….. 9%
• Legs give way ….……... 4%
• Other ……………………16%
______
Berg WP, Age & Ageing, 1997
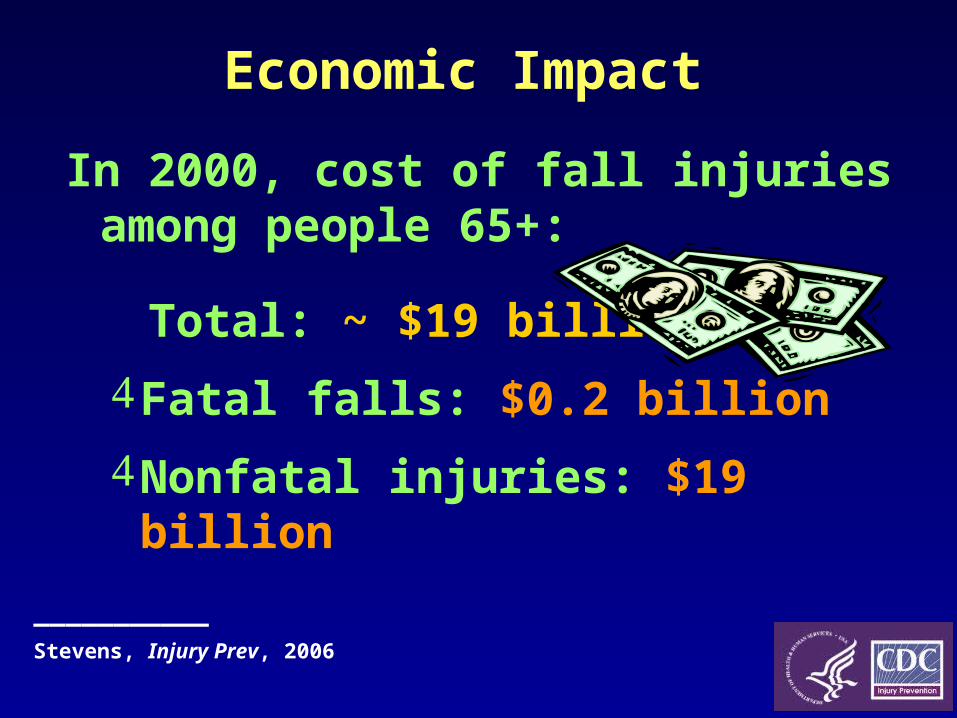
Economic Impact
In 2000, cost of fall injuries among people 65+:
Total: ~ $19 billion
Fatal falls: $0.2 billion
Nonfatal injuries: $19 billion
___________Stevens, Injury Prev, 2006
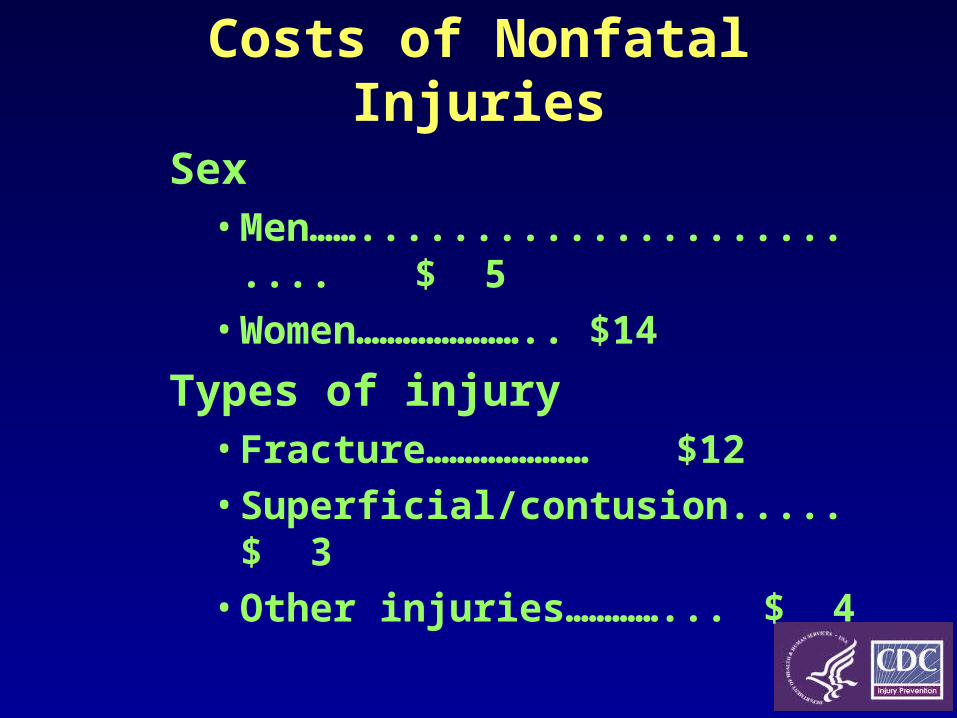
Costs of Nonfatal Injuries
Sex• Men……......................... $ 5• Women…………………..$14
Types of injury• Fracture………………… $12• Superficial/contusion..... $
3• Other injuries…………... $
4

Quality of Life
20% - 36% fear falling1
20% die within a year after hip fracture2
25% in a nursing home one year later3
___________
1. Vellas, Age & Aging, 1997; Friedman SM, JAGS, 2002 2. Lu-Yao, AJPH, 19943. Magaziner, J Gerontology: Medical Sciences, 2000

Fall Risk Factors
• Biological
• Behavioral
• Environmental
__________
V. Scott, 2000
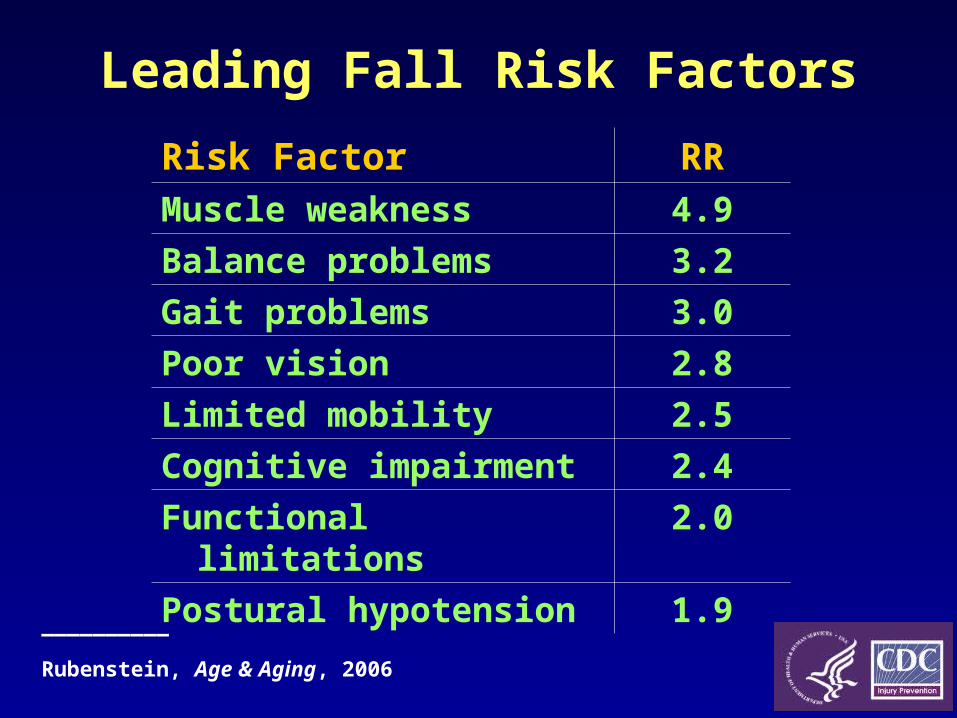
Leading Fall Risk Factors
__________
Rubenstein, Age & Aging, 2006
Risk Factor RRMuscle weakness 4.9
Balance problems 3.2
Gait problems 3.0
Poor vision 2.8
Limited mobility 2.5
Cognitive impairment 2.4
Functional limitations 2.0
Postural hypotension 1.9

Cochrane Review
ProFaNE exercise categories:
• Gait, balance or functional training
• Strength or resistance training
• Flexibility
• 3D (Tai Chi, dance, etc.)
• General physical activity
• Endurance
• Other_________
Gillespie, Cochrane Database of Systematic Reviews, 2009
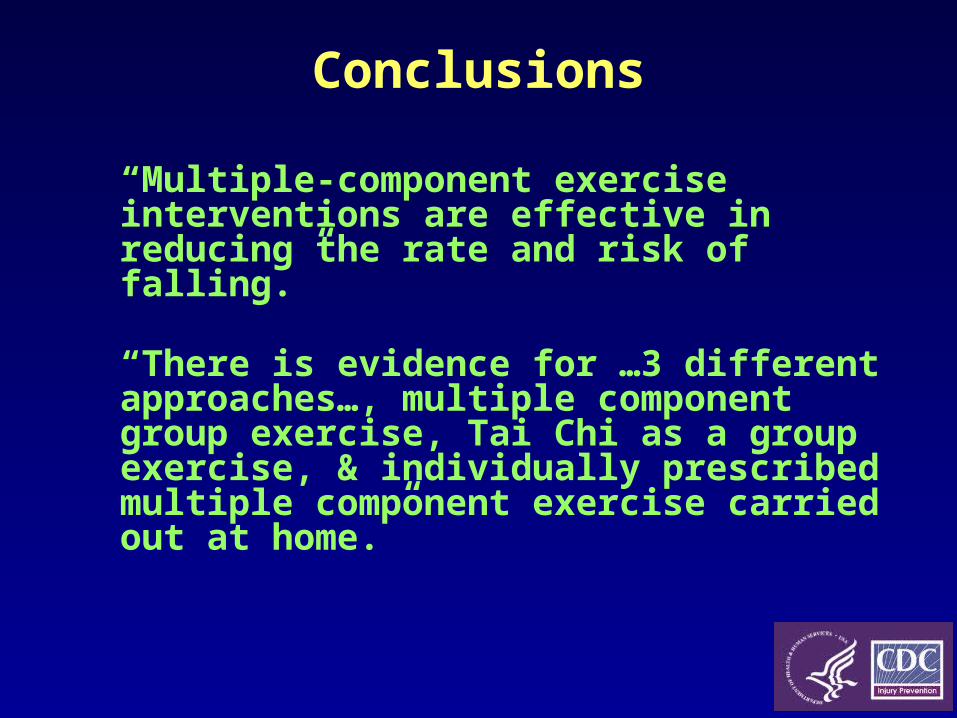
Conclusions
“Multiple-component exercise interventions are effective in reducing the rate and risk of falling.”
“There is evidence for …3 different approaches…, multiple component group exercise, Tai Chi as a group exercise, & individually prescribed multiple component exercise carried out at home.”

What Kind of Exercise Works Best?
• Population• Components: strength,
balance, endurance, flexibility, walking
• Amount of supervision• If progressive• If modified during program• Attendance rate• Dose
_________
Sherrington, JAGS, 2008
Systematic review & meta-analysis of 44 studies
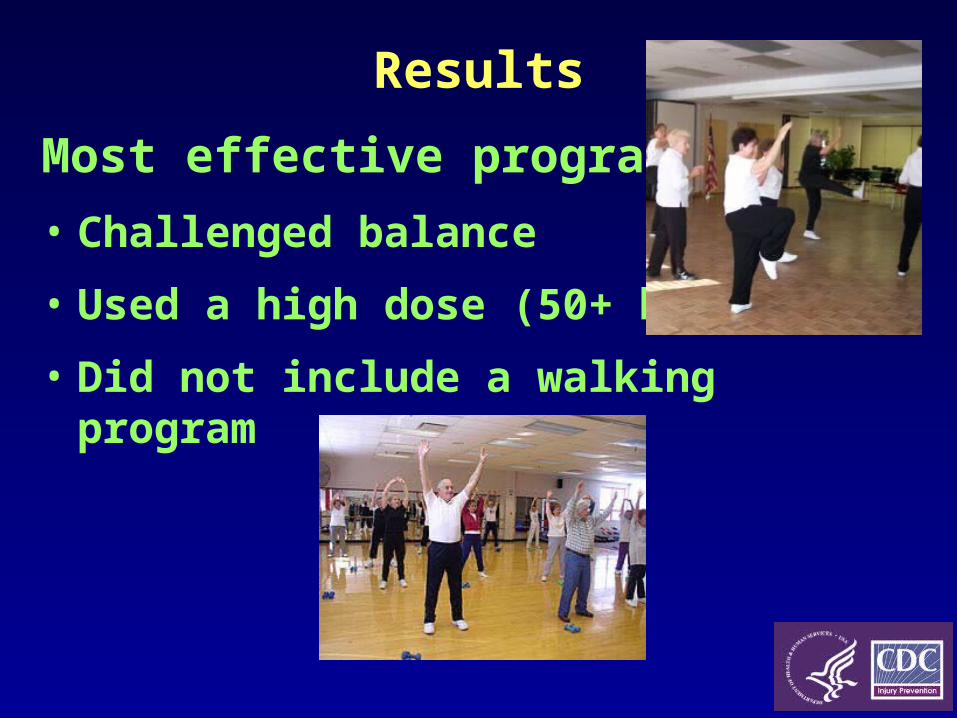
Results
Most effective programs:
• Challenged balance
• Used a high dose (50+ hrs)
• Did not include a walking program

Preventing Falls: What Works
www.cdc.gov/HomeandRecreationalSafety/Falls/preventfalls.htm
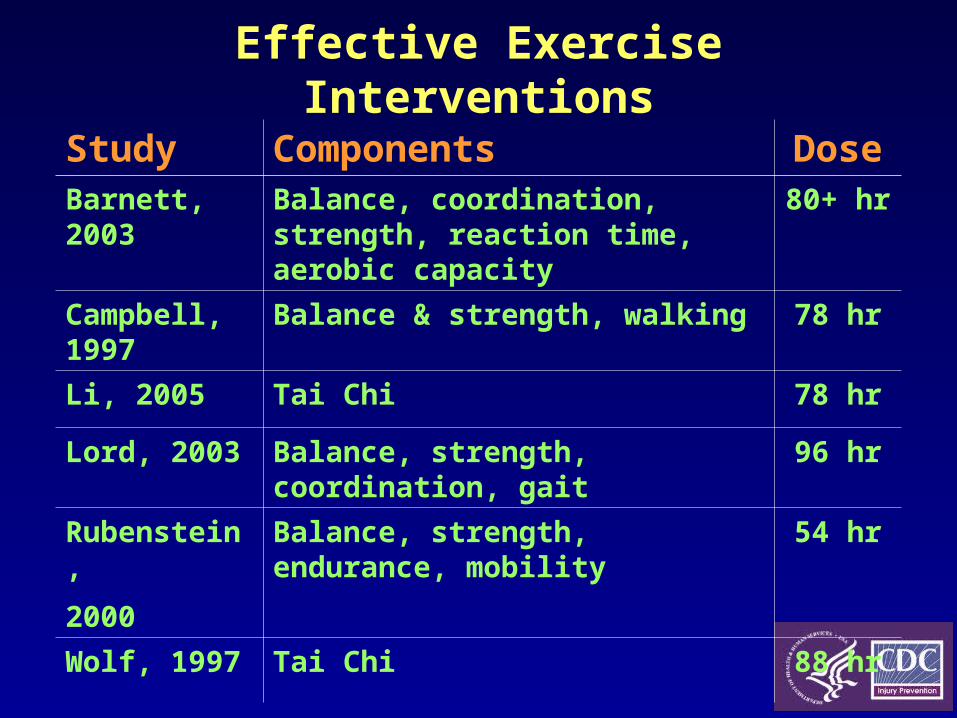
Effective Exercise Interventions
Study Components DoseBarnett, 2003 Balance, coordination, strength,
reaction time, aerobic capacity80+ hr
Campbell, 1997
Balance & strength, walking 78 hr
Li, 2005 Tai Chi 78 hr
Lord, 2003 Balance, strength, coordination, gait
96 hr
Rubenstein,
2000
Balance, strength, endurance, mobility
54 hr
Wolf, 1997 Tai Chi 88 hr

Challenges
• Achieving a sufficient exercise dose
• Motivating older adults to participate in exercise to prevent falls1
_________
Crombie, Age & Ageing, 2004
In Conclusion…
• Programs challenge balance
• Programs include 50+ hours of exercise
• Motivate older adults to participate
Exercise can reduce fall rates if: