effective backtesting annotated - Burns Statistics€¦ · The spread at the end of the year is...
34
1 Effective Backtesting Patrick Burns 2010 Nov http://www.portfolioprobe.com/blog This talk was given at the Thalesians in London on 2010 November 02. I’d like to thank the organizers for frisking attendees at the door for rotten fruit and other projectiles. Photo from istockphoto.com
Transcript of effective backtesting annotated - Burns Statistics€¦ · The spread at the end of the year is...

1
Effective BacktestingPatrick Burns
2010 Nov http://www.portfolioprobe.com/blog
This talk was given at the Thalesians in London on 2010 November 02.
I’d like to thank the organizers for frisking attendees at the door for rotten fruit and other projectiles.
Photo from istockphoto.com

2
When we backtest we want to know what the future will look like.
Photo from stock.xchng

3
We do that by looking at the past.
The path from past to future is not smooth. Our world is chaotic.
Photo from everystockphoto.com

4
Not this sort of chaos.

5
This sort of chaos.
Hurricanes happen.
Photo from everystockphoto.com

6
I’ve used the metaphor of a bridge – a bridge from the past to the future. Bridges can fail.
This is the Tacoma Narrows Bridge 1940 November 7.
Who would have thought that the wind would hit the resonant frequency of that bridge?

7
Who would have thought there would be triple-A rated mortgages on houses like this?

8
If you do a backtest, you will get a plot like this.
In this particular case, the strategy is long-only and we are seeing the performance relative to the index.
What does this plot tell you about the strategy over this time period?

9
The knowledge that we get from plots like we’ve just seen is the worst kind of knowledge – it is knowledge that might not be true.
Everything that we could infer from that plot MIGHT BE WRONG.
I invited the audience to guess the 5 things that I would talk about that we don’t know about the previous plot. They actually did quite well athitting most of the points.
There was a “wrong” topic that I thought would come up that didn’t: slippage. There are probably other meanings for the word, but my take on it is that in a backtest we pretend that we can trade the assets at some given price. We can’t necessarily, and often the difference results in optimistic backtest results. One solution is to increase your estimate for trading costs.
In the following slippage doesn’t matter – the effect is common to all.

10
This plot was created by starting with one particular portfolio at the start of the year. Then trading was done every day that obeyed some set of constraints and tried to take advantage of the “secret sauce” that we are hypothesizing allows us to outperform.
That hypothesis is what we are trying to test.
We want to isolate the effect of the “secret sauce” from everything else that is going on. We can do that.

11
We can do the backtesting operation again, starting with the exact same portfolio, and trading every day obeying the constraints just as before. But we ignore the secret sauce. That is, the trading that is done is random conditional on obeying the constraints.
It isn’t very interesting if we only do that once. But we can do it 100 times, say, (as in this case) and then draw the 95% confidence interval for the random paths. Now we have a true picture of what is happening in this case.
If you thought the strategy was doing poorly at the start of the year, you were mistaken. The strategy is actually neutral for about the first quarter, and then it works basically for the rest of the year. The initial portfolio does worse than the index at the start of the year, and we are tied to the starting portfolio.
But this performance is conditional on the starting portfolio. We are probably interested in any starting portfolio, not a particular portfolio.
12
We can do this whole process over again 20 times with different starting portfolios and compare the strategy performance versus the random paths. The performance percentile will be the percent ofrandom paths that beat the strategy (at a point in time – perhaps the ending time).
If the strategy has no power at all, then you would get a QQplot like this. The data in this plot are just random uniforms.

13
This plot is also sort of saying “no effect” but saying it differently.
This is real data – sometimes we definitely outperform, other times we definitely underperform. That we have those extremes testifies to the power of the technique.

14
Here is what we want to see: no matter where we start, we outperform.

15
This is a scary picture: we almost always underperform. But if we’d started with one particular starting portfolio and only done that backtest, then we would think we had a winning strategy when actually we have a losing strategy.
There was a question from the audience about doing this 20 times rather than some other number. How do we know how many different starting portfolios to use?
The short answer is that I don’t know. It will depend on the variability of the results which we don’t know beforehand. Much fewer than 10 may not give you a very complete view. More than 50 is unlikely to tell you anything new.

16
We are interested in the stability of the strategy across time as well as across different starting points.
This is a tricky plot on three counts:1) This “Outperformance” on the y-axis is different from previous
“Outperformance” on the y-axis. Before it was relative to the index, here it is relative to random.
2) This is the average over the performance (calculated in point 3 below) for the 20 goes with different starting portfolios.
3) This is created by subtracting the average of the random paths (at each point in time) from the strategy (at that point in time).
Now we have a clean view of when the strategy is working and when it isn’t working.
The three previous plots are tied to this one: first quarter (mixed), first half (always outperform), full year (generally underperform).

17
These are the 20 paths that went into the average on the previous plot.
The spread at the end of the year is startling. Remember we are doing the exact same thing over the same period of time; the only thing that is different is the starting portfolio. The strategy can end up working a little for the full year, or be down something like 14%.
Adam Olive noted that if the signal changes slowly enough relative to the turnover, then the portfolios will converge and the lines will become parallel at some point.

18
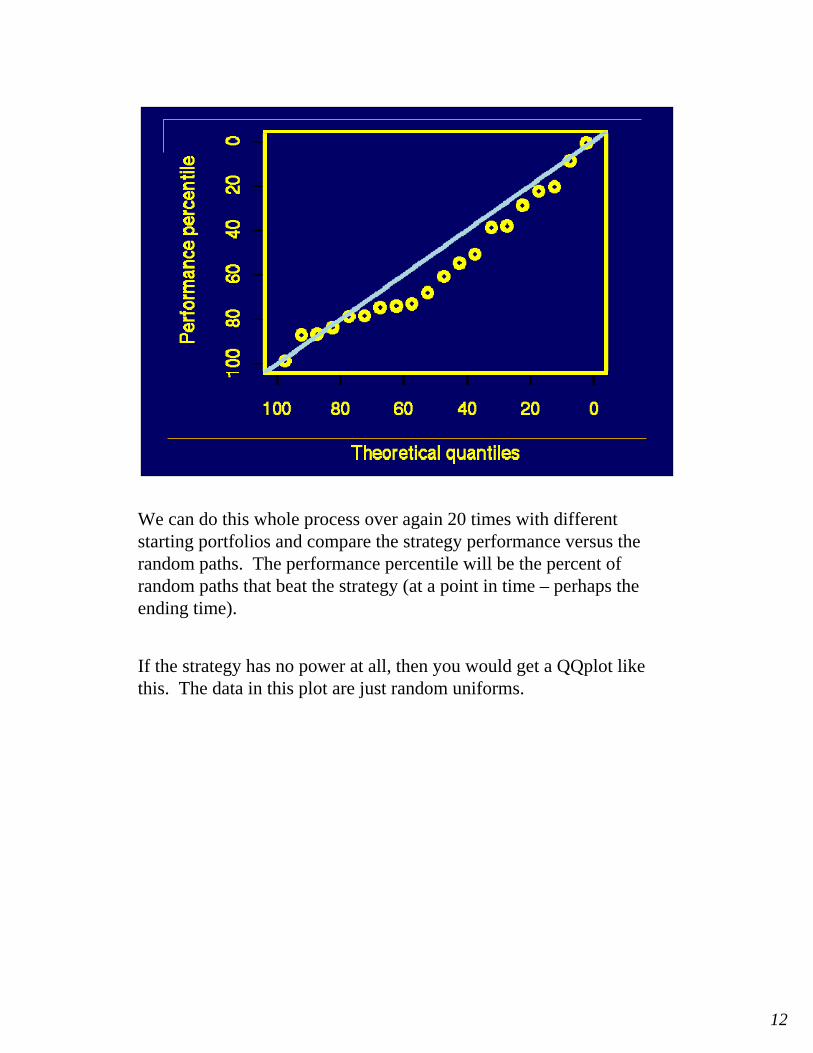
The Coin Toss
Here’s an investment strategy: Every day flip a coin. If it lands heads be in the market the next day, otherwise stay out of the market.
19
I auctioned the 50 pence piece that created this plot with a reserve price of only £100.
No one met the reserve. Silly them.

20
Dividing the Time Series
In-sample for prediction
Long ago Present
prediction out of sample period
In order to outperform we need to have prediction of returns.
In order to know that we have prediction, we need to test out of sample.
In-sample doesn’t do it.
It was one of the great disappointments of my life to learn that just because you have real prediction, that doesn’t mean that you can find a strategy to successfully take advantage of that prediction.

21
Dividing the Time Series
In-sample for prediction
Long ago Present
prediction out of sample period
strategy out of sample period
Test period
You need to test your strategy out of sample. You will end up testing a large number of strategies.
Once you think you know what is going on, you will want to pick what you think is the best strategy and test that one strategy in a new time period. That test is not going to go as well as you hope, and you’re going to pick another pretty good coin from the green period to test in the white period. That is, the white period is likely to becomecontaminated, data-snooping-wise, as well.
The only real out-of-sample that you have is when you have money and you are trading live.

22
SignificanceStability across spaceStability across time
Data snooping in strategiesData snooping in time
So here are the five things we wanted to know about the original plot.
For a single go of the backtest, what sort of significance do we have?
What sort of stability does the outperformance have across different portfolios?
What sort of stability does the outperformance have across time?
What sort of data snooping have we done in strategies?
What sort of data snooping have we done in time?

23
Don’t be wrongDon’t be right
What we’ve seen up until now has been about not being wrong.
We don’t want to be right either.

24
Quantmare
2007 August
For years lots of (equity) quants looked at the same data.
They observed the same set of phenomena.
They created similar strategies.
This led them to similar portfolios.

25
They didn’t know they were in a herd until the credit crunch cracked a whip and the stampede started.
Photo from stock.xchng

26
We all think we are brilliant and we’re in a nice big green pasture that no one else has found.
As far as I can tell there is no way to know how big the herd is that we are in until it is too late.
So how can we mitigate herd risk?
Photo from stock.xchng

27
I think that one thing is to instrument our strategies better.

28
So we know when they work and when they don’t.
That allows us to take advantage of more ephemeral signals that not everyone is going to be in.
Adam Olive gave a good warning on this in that you want to have a strong prior belief in such strategies before you see the data. As with coins you can always find strategies that look good in the data if you look hard enough.

29
This was scary when we first saw it: do the same thing, get vastly different results depending on where you are.
That might be a good thing. If I can take advantage of the particular strategies that work especially well for my portfolio as it happens to be right now, then maybe that will drive me farther from the herd.
On the other hand, that could well be science fiction.

30
Minority game
Quant fund managers are playing the minority game. If you are in the minority, then you win.
We had a go at playing the minority game with black cards and red cards.
We then added a little more realism by having a black win count twice that of a red win.

31
Imagine you are in a scientific study. You are watching this person. Someone comes in, hands him a piece of paper, and then he reads the fake weather report. Your task is now to guess his IQ. You, of course, say this is stupid: all I know of him is reading something that he didn’t even write.
The twist in the study is that he is a subject also. After he reads the fake weather report, he has to guess his own IQ.
The results are that you are right: you are terrible at guessing his IQ. But he is even worse.
What goes wrong when people guess their own IQs?
Irrational exhuberance.
Photo in the public domain from the US government.
32
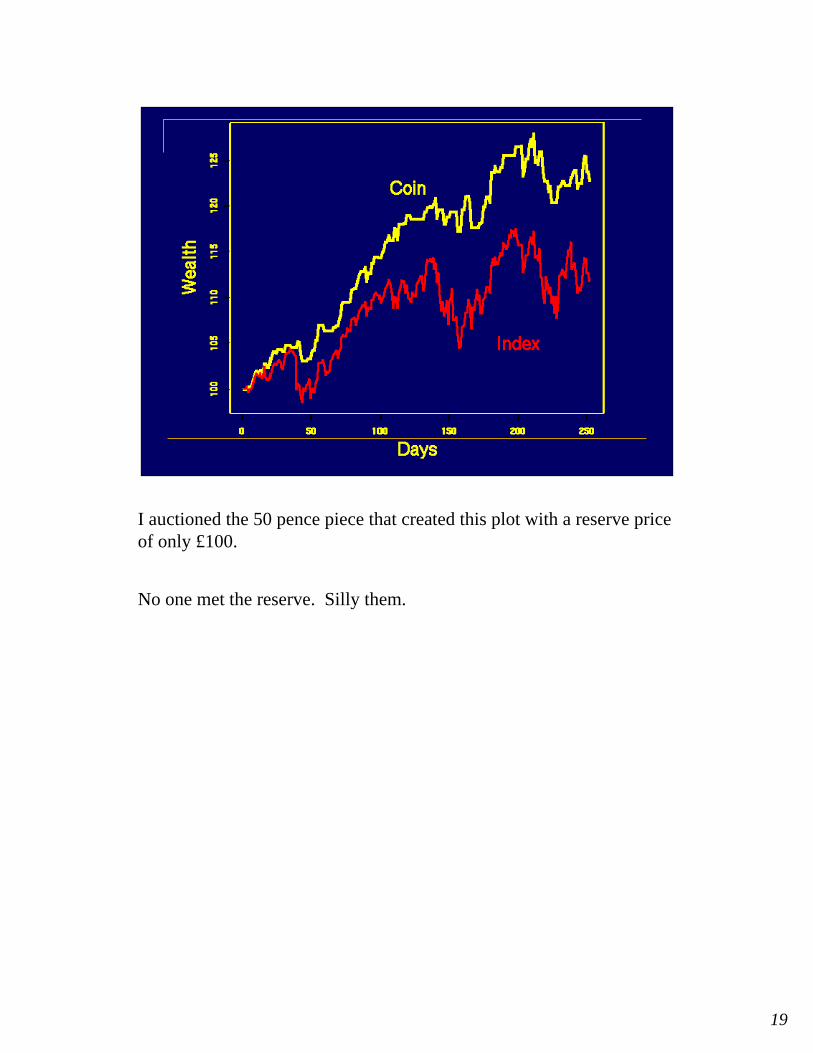
94% of universityprofessors do
above average work
But of course this study was done with undergraduates.
Smart people are going to have more self-knowledge than a bunch of silly undergraduates.
Right?
Both the fake weather report study and the above-average professors are taken from Switch by Chip and Dan Heath.

33
94% of universityprofessors do
above average work
One of the things that I have done is to test trading strategies. I’ve heard myself say, more than once, “Okay, this strategy doesn’t work well here, but when we get to the true out-of-sample period, it will work great.”
That’s completely insane. We have no reason to believe that something will work better out-of-sample. And we have some reasons to believe it will work worse.
I had a couple advantages:*) I didn’t have any money riding on it.*) The strategy wasn’t even my idea.
Still the most rational person I know got emotionally attached to the strategy.

34
If I’ve made you nervous, then I’ve done my job. Scaring the hell out of you would be even better.
Adam Olive afterwards had another piece of wisdom: If somethingdoesn’t work in a backtest, then you should assume it won’t work in future. If something does work in a backtest, you should NOT assume it will necessarily work in future.