Effect of the Minimum Ballast Condition on Bulk Carrier ... · Effect of the Minimum Ballast...
22
Effect of the Minimum Ballast Condition on Bulk Carrier Manoeuvrability for INTERCARGO. A part of BMT in Maritime Transport ISSUE DATE: 19 th September 2008 REPORT NO: C12145.1R
-
Upload
nguyennhan -
Category
Documents
-
view
215 -
download
0
Transcript of Effect of the Minimum Ballast Condition on Bulk Carrier ... · Effect of the Minimum Ballast...
Effect of the Minimum Ballast Condition on Bulk Carrier Manoeuvrability
for INTERCARGO.
A part of BMT in Maritime Transport
ISSUE DATE: 19th September 2008
REPORT NO: C12145.1R

INTERCARGO Bulk Carrier Manoeuvrability
1 Report No: C12145.1R
CONTENTS 1 TERMS OF REFERENCE............................................................................................. 2
2 BACKGROUND............................................................................................................ 2
3 OBJECTIVES OF THE STUDY..................................................................................... 2
4 METHODOLOGY.......................................................................................................... 2
4.1 General.................................................................................................................. 2
4.2 Capesize Bulk Carrier............................................................................................ 3
4.3 Met-ocean Conditions for Tubarao and Ponto de Madeira..................................... 3
4.4 Matrix of Scenarios................................................................................................ 4
5 SIMULATION RESULTS .............................................................................................. 6
6 DISCUSSION................................................................................................................ 8
7 CONCLUSIONS.......................................................................................................... 10
8 REFERENCES............................................................................................................ 11
APPENDIX A – SIMULATION RESULTS........................................................................... 12
Document History
Version Changes By
1 Draft for Release DA, SB
2 Comments from client added SB
Information contained in this document is commercial-in-confidence and should not be transmitted to a
third party without prior written agreement of BMT SeaTech Ltd. © Copyright BMT SeaTech Ltd 2008
Document Information
Project Bulk Carrier Manoeuvrability
Report Title Effect of the Minimum Ballast Condition on Bulk Carrier Manoeuvrability
Client INTERCARGO
Report ref: C12145.1R
Prepared by: Mr Dimitrios Argyros Naval Architect, BMT SeaTech Ltd
Approved by: Mr Simon Burnay Group Manager – Marine Safety & Compliance, BMT SeaTech Ltd

INTERCARGO Bulk Carrier Manoeuvrability
2 Report No: C12145.1R
1 TERMS OF REFERENCE
BMT SeaTech Ltd (BMT) was instructed by INTERCARGO to conduct a simulation study to
assess the effect on ship manoeuvrability of minimum ballast conditions for Capesize bulk
carriers.
The study was undertaken by BMT staff with the simulations being conducted using the PC
Rembrandt ship handling and manoeuvring simulator, developed by BMT. This report
describes the methodology adopted for this project and includes the relevant analysis, a
summary of results, and appropriate conclusions.
2 BACKGROUND
Due to the increased demand for raw materials such as iron ore, it is understood that
a number of bulk terminals have been taking measures to optimise port throughput. This has
resulted in terminals requesting fast ship turn-around times necessitating a very light ballast
arrival condition in order to be able to load at high rates e.g. at up to 16000 tonnes per hour;
in some cases also allowing 90% propeller immersion to facilitate this.
It is therefore understood that a number of operators of large bulk carriers (Capesize) have
reported problems with vessel manoeuvrability due to the requirement for arriving in a
loading condition that results in a very large trim by the stern and significantly higher
windage. Both of these effects are well known to have detrimental effects on vessel
manoeuvrability ref [1], relative to normal loading conditions.
3 OBJECTIVES OF THE STUDY
The aim of this study is to present and quantify the differences in vessel manoeuvrability due
to the requirement for a minimum ballast condition versus the normal arrival loading
condition.
4 METHODOLOGY
4.1 General
The methodology employed for this study was to run a set of simulations for two ports where
the loading rates are known to be 16,000 tonnes per hour ref [2] and [3]. Simulations were
completed for arrival scenarios at the ports of Tubarao and Ponto de Madeira in Brazil,
based on a matrix of scenarios derived from an analysis of met-ocean conditions for the
area. Figures 4.1(a) – (b) present the nautical charts for Tubarao and Ponto De Madeira
respectively, courtesy of UKHO.

INTERCARGO Bulk Carrier Manoeuvrability
3 Report No: C12145.1R
Figure 4.1(a) – Tubarao Bulk Terminal Figure 4.1(b) – Ponto de Madeira Bulk Terminal
4.2 Capesize Bulk Carrier
For the purpose of simulating the vessels which call at these ports, a Capesize vessel was
selected that was felt to be typical for this class of ship. A ship model was provided with the
principal characteristics given in Table 4.1 below.
Parameter Normal Loaded
Condition
Normal Ballast
Condition
Minimum Ballast
Condition
Length Overall [m] 289.0 289.0 289.0
Length Between Perp. [m] 279.0 279.0 279.0
Breadth [m] 45.0 45.0 45.0
Mean Draught [m] 18.0 8.2 5.3
Stern Trim [m] 0.0 1.2 5.15
Propeller Immersion [%] 100% 100% 95%
Rudder Immersion [% of area] 100% 73% 65%
Table 4.1 – 180,000 DWT Capesize Vessel Model Principal Particulars
4.3 Met-ocean Conditions for Tubarao and Ponto de Madeira
A brief analysis of wind, wave and current conditions was undertaken for the ports to be
assessed. The results of this analysis are as follows:
Figures 4.2(a) – (c) present the data used for the Port of Tubarao to establish the tide
heights, wind and wave data to be used in the simulations. Figures 4.3(a) – (c) present the
equivalent data for Ponto de Madeira.

INTERCARGO Bulk Carrier Manoeuvrability
4 Report No: C12145.1R
Tubarao Ponto de Madeira
Figure 4.2(a) – Tubarao Tidal Data Figure 4.3(a) – Ponto de Madeira Tidal Data
Figure 4.2(b) – Tubarao Wind Data Figure 4.3(b) – Ponto de Madeira Wind Data
Figure 4.2(c) – Tubarao Wave Data Figure 4.3(c) – Ponto de Madeira Wave Data
4.4 Matrix of Scenarios
Based on the analysis of the data presented in Section 4.3, the scenario matrix was derived
and is presented in Table 4.2 below. The scenario matrix was derived by analysing the data
presented in Figures 4.2 and 4.3 to obtain the following information:
- Typical tidal ranges in neap and spring cycles.
- Wind and wave data relating to the probability of occurrence e.g. conditions that
occur 50% 25%, 10% and 1% of the time.
- Current conditions based on available public data e.g. Admiralty South American
Pilot.

INTERCARGO Bulk Carrier Manoeuvrability
5 Report No: C12145.1R
Tidal heights were selected for each port that gave a typical height of tide combined with the
relevant current flow. For Tubarao, it was determined that there is a general South-west
current flow parallel to the shoreline of circa 1 knot. This was therefore applied with a tidal
height of 0.8m representing a typical mid-tide condition (i.e. maximum current flow). The
current was defined to be realistic inside the port breakwaters such that the effect is reduced
when close to the berths.
For Ponto de Madeira, the tidal height is much larger (reaching a range of up to 6 metres), in
which case stronger currents can be expected. Based on the data available, a 2 knot
current was selected as being significant, but not extreme. Again a mid-range tidal height of
4 metres was selected.
For wind and wave conditions, analysis was made of the percentage occurrence data in
Figures 4.2 and 4.3 to derive the typical wind speeds and directions for prevailing conditions
(i.e. the majority of the time, or circa 30-50% probability), stronger conditions ( e.g. 25% or
10% probability) and storm conditions (less than 5% probability). The vales used as
presented in Table 4.2 were only included if they represented feasible conditions, i.e. they
are practically as well as theoretically possible to occur and hence conditions with a very low
probabilities of occurrence were not included.
Wind Current Waves
Port ID Condition Speed [kts]
Dir [deg]
Speed [kts]
Dir [deg]
Tide Height +CD [m]
Ht [m]
Period [sec]
Dir [deg]
T1 Ballast 10 30 1 225 0.8 1.5 7.5 90
T2 Ballast 14 30 1 225 0.8 1.5 7.5 90
T3 Ballast 20 30 1 225 0.8 2.5 10.5 90
T4 Light Ballast 10 30 1 225 0.8 1.5 7.5 90
T5 Light Ballast 14 30 1 225 0.8 1.5 7.5 90
Tubarao
T6 Light Ballast 20 30 1 225 0.8 2.5 10.5 90
M1 Ballast 15 90 2 0 4 1.5 5.5 30
M2 Ballast 20 90 2 0 4 2.5 6.5 30
M3 Ballast 20 30 2 0 4 2.5 7.5 30
M4 Light Ballast 15 90 2 0 4 1.5 5.5 30
M5 Light Ballast 20 90 2 0 4 2.5 6.5 30
M6 Light Ballast 20 30 2 0 4 2.5 7.5 30
M7 Ballast 15 90 2 180 4 1.5 5.5 30
M8 Ballast 20 90 2 180 4 2.5 6.5 30
M9 Ballast 20 30 2 180 4 2.5 7.5 30
M10 Light Ballast 15 90 2 180 4 1.5 5.5 30
M11 Light Ballast 20 90 2 180 4 2.5 6.5 30
Ponto de Madeira
M12 Light Ballast 20 30 2 180 4 2.5 7.5 30
Table 4.2 – Scenario Matrix
The manoeuvres required for arrivals at each port can be summarised as:

INTERCARGO Bulk Carrier Manoeuvrability
6 Report No: C12145.1R
Tubarao Ponto de Madeira
- Course keeping during deceleration - Swinging - Backing into berth - Coming alongside
- Course keeping during deceleration - Steady turn / swinging - Coming alongside
The simulations were conducted by BMT’s experienced marine staff in a manner to enable
suitable comparison between specific manoeuvres for the two loading conditions.
Tugs were applied in the simulations to aid berthing and control of the ship. The available
tugs were determined from publically available information (e.g.
http://www.magioli.com/pmadeira.htm#P) and they were controlled using the PC Rembrandt
on-screens controls, applying normal nautical practice for the tug use. In the absence of
specific information, the tug sizes available for Tubarao were assumed to be the same as
Ponto de Madiera.
5 SIMULATION RESULTS
The full set of simulation results are presented in Appendix A.
To assess the differences between the manoeuvring capabilities of the typical Capesize bulk
carrier, it is possible to compare the results of standard manoeuvres such as the turning
circle or zig-zag in the same manner as conducted during the ships sea trials. This was not
the purpose of this study, but it is a well-know effect that as the trim of the vessel increases
by the stern, it becomes more dynamically stable ref [1], that is, it is harder to turn the ship and
the size of the turning radius increases although conversely it is generally easier to check
the yaw of the vessel.
For the purposes of this study, we have assessed the arrival manoeuvres at the ports of
Tubarao and Ponto de Madeira and analysed the results to derive an index that describes
the ability to manoeuvre the ship. Two indices are defined that allow us to present the
engine power and rudder angles used, as a function of certain critical value which were are
set as;
- Critical rudder angle = 20 degrees
- Critical engine rpm = 56 rpm (Half Ahead)
Where rudder angles over 20 degrees and engine orders greater than Half power are
required, it is felt that the manoeuvre has exceeded the limits of safe operation and there are
reduced safety margins.
As rudder effectiveness is directly linked to the use of the main engine (through the wake of
the propeller), the index to assess the manoeuvring ability is therefore defined as a multiple
of rudder and engine factors and allows the determination of a safety margin. It can be
defined as follows:
Ship Safety Index: ( )
( )CRITCRITCRIT
R
R
S
nn
nni
⋅⋅
⋅⋅=δ
δ ……… …………………………………….(i)

INTERCARGO Bulk Carrier Manoeuvrability
7 Report No: C12145.1R
Where δR and δRCRIT are the applied and critical rudder angles respectively and n and nCRIT
are the applied and critical engine rpm values.
Where tugs are required to assist the manoeuvre, they too must have a margin of power in
order to respond to emergency situations and to allow for degradation of the effective bollard
pull with environmental conditions and ‘wear and tear’. A safety index for tug use is also
defined as follows:
Tug Margin Index: ( )( )MAX
TUG
TUG
T
P
Pi = …………………………………………………………….(ii)
Where PTUG and PTUGMAX are the applied tug power and maximum tug power respectively.
The results for these two indices should therefore be less than 1.0 for normal manoeuvring
and provide a means of assessing the relative requirements to safely manoeuvre using the
main engine, steering forces and tug control.
Table 5.1 presents the summary results for the simulations performed.
Run ID Loading
Condition
Maximum Sustained
Ship Index (iS)
Maximum Sustained
Tug Index (iT) Comments
Tubarao
T1 Normal Ballast 0.1 0.5
T4 Min Ballast 0.5 0.5
Min ballast vessel set’s down more under wind, is harder to keep in channel and keep course and cannot generate higher Rate Of Turn (ROT), hence higher ship index. Tug index equal as stern into wind and current zero in port.
T2 Normal Ballast 0.2 0.5
T5 Min Ballast 0.25 0.5 As above.
T3 Normal Ballast 0.4 0.75
T6 Min Ballast 1.0 1.0
ROT and ability to keep course about equal, but min ballast vessel is very hard to keep in channel due to set of wind. Max ship index for min ballast vessel and max tug usage, showing limits of operation.
Ponto de Madeira
M1 Normal Ballast 0.45 0.75
M4 Min Ballast 0.25 0.5
Min ballast vessel is harder to hold on track, but easier to bring alongside berth, hence lower ship index. Ability to turn is worse in certain wind angles – ‘jittery’. Normal ballast vessel is harder to berth hence higher tug index.
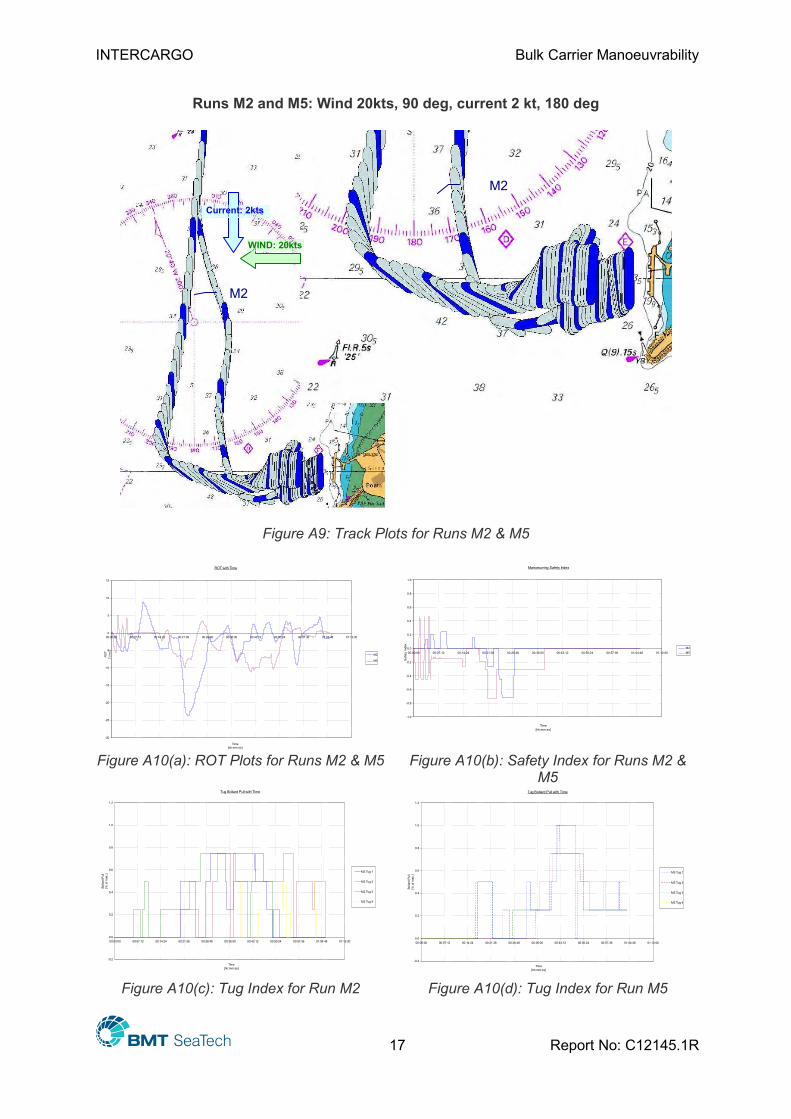
M2 Normal Ballast 0.7 0.75
M5 Min Ballast 0.7 1.0
Harder to control drift of min ballast vessel, turning ability is worse at certain wind angles, hence higher tug index.
M3 Normal Ballast 0.45 0.75
M6 Min Ballast 0.5 0.75
Easier to control yaw of min ballast vessel during approach and easier to move ship laterally in berth. Greater windage balances with current allowing controlled drift, hence ~ equal indices.

INTERCARGO Bulk Carrier Manoeuvrability
8 Report No: C12145.1R
M7 Normal Ballast 0 0.75
M10 Min Ballast 0.6 0.5
Min ballast vessel swings quite easily, but loses headway very quickly. Normal ballast vessel is harder to move laterally onto berth, due to large wind turning moments, hence higher tug index. Higher ship index due to need to keep speed on hence higher RPM used.
M8 Normal Ballast 0.15 0.75
M11 Min Ballast 0.15 0.5 As above
M9 Normal Ballast 0.2 0.5
M12 Min Ballast 0.4 0.75 As above
Table 5.1 – Summary of Results
6 DISCUSSION
The results presented provide an assessment of the relative manoeuvring ability of a typical
Capesize bulk carrier in ‘normal’ and minimum ballast conditions. It was felt to be important
that this comparison be undertaken for realistic manoeuvres and the results for these are
presented in Section 5 above.
However, it is also important to understand the general effects that the use of the minimum
ballast condition has on vessel manoeuvrability. In general terms the minimum ballast
condition has a much reduced draught (and hence vessel displacement) and a large trim by
the stern. This can result in a reduced propeller immersion and less rudder area in the
water.
The general effect of the reduced draught (and displacement) is to reduce the inertia of the
vessel, which means that it will generate momentum much more easily to any stimulating
forces. On the positive side, this can result in a quicker response to steering forces or
engine power for example. However, it also means, that the vessel will generate momentum
much quicker under the action of the wind and to an extent, the current; although the effect
of current is much reduced due to the reduction in draught as there is less underwater area
to act upon.
The reduction in propeller immersion results in a reduced propeller thrust compared to the
propeller being fully immersed. Its performance will also be worsened by so-called aeration
whereby the action of the propeller blades coming out of the water, drags air onto the
propeller blade surface reducing its effectiveness. The reduction in rudder area in the water,
combined with the reduced capability of the propeller (producing reduced propeller wake)
reduces the steering forces that the rudder can apply.
The effect of the stern trim must be considered in conjunction with the effect of the reduced
draught and increased windage. With level trim, the windage has a ‘centre of effort’ (i.e. a
point at which the wind appears to act) that may be expected to be somewhere just aft of
midships as the distribution of area is mainly aft. With stern trim, there is a greater
proportion of the above water area forward and hence the ‘centre of effort’ moves forward
and may be ahead of midships.
For a vessel moving ahead with level trim, then the turning lever due to the windage and the
rudder is large, as both are far aft of the hydrodynamic pivot point which is typically 1/4 to 1/3

INTERCARGO Bulk Carrier Manoeuvrability
9 Report No: C12145.1R
of the length aft of the bow when moving ahead (see Figure 6.1(a)). The hydrodynamic pivot
point may be thought of as the ‘centre of effort’ of the hull, although it is not fixed.
Figure 6.1(a) – Turning Levers in Level Trim Condition
With a large stern trim, the pivot point moves aft relative to its level trim position and hence
this reduces the turning lever that the rudder has, resulting in decreased turning
performance. In addition, the additional windage area forward moves the windage centre of
effort forward and this in turn reduces the turning lever the wind has and may even change
its direction (see Figure 6.1(b)).
Figure 6.1(b) – Turning Levers in Stern Trim Condition
The net result can generally be assumed to be a worsening of turning performance as
demonstrated in Figure 6.2 below. The reduction in turning lever of the wind with stern trim
also explains why the vessel in this condition will tend to drift bodily under the wind rather
than turning. This was especially apparent in a number of runs conducted for this study.
The greater windage area of the minimum ballast vessel was seen to result in lower ROT
and higher tug powers required to swing the vessel. The reduced displacement also leads
to a more ‘jerky’ response, whereby the vessel will quickly build momentum to any applied
forces (e.g. tugs, wind) and therefore needs careful control to ensure that large forces are
not allowed to be imparted for a significant length of time.
Whilst the majority of the effects of the minimum ballast condition can be seen to worsen the
vessels manoeuvring ability, there are some positive effects. The arrival manoeuvres into
Ponto de Madeira with a Southerly flowing current allowed the minimum ballast vessel to be
manoeuvred into the berth using a controlled descent technique with relatively little tug
power and use of the ships engines. This technique used the wind and current to swing the
vessel and drift it down onto the berth. This was not possible with the normal ballast
condition vessel as the wind does not cause a bodily drift, but tends to yaw the vessel
making the manoeuvre harder. This also affects the final stage of the manoeuvre when
bringing the vessel laterally alongside the berth.
R
R

INTERCARGO Bulk Carrier Manoeuvrability
10 Report No: C12145.1R
Figure 6.2 – Comparison of Turning Performance for Normal and Minimum Ballast Conditions
7 CONCLUSIONS
Based on the analysis completed for this study, we can draw the following conclusions:
(i) The requirement for vessels to be in a minimum ballast condition results in a
number of significant effects to the manoeuvrability of the vessel.
(ii) These effects are generally characterised by;
a. Increased bodily drift under the action of wind due to the greater windage and
more even distribution of above water profile area along the vessel.
b. Increased difficulty in swinging the vessel at low or zero speed in significant
wind conditions due to the greater windage.
c. A more ‘jerky’ response to the actions of environmental (e.g. wind or current)
and control forces (e.g. tugs) due to the reduced displacement. This results
in the requirement for control forces (e.g. tugs, rudder etc) to be applied more
often and with lower power (i.e. a little and often) to minimise momentum
build up.
d. A worsening in turning performance when underway with a corresponding
increase in the ability to control yawing motions under certain wind directions
relative to the ships heading. This is due to the reduced turning lever as a
result of the large stern trim.
e. Increased loss of speed when heading into the current for a given engine
power due to the reduced displacement.
Normal Ballast Condition 957m
Min Ballast Condition 1390m

INTERCARGO Bulk Carrier Manoeuvrability
11 Report No: C12145.1R
(iii) In all cases simulated as part of this study, tug powers of 50% or greater were
used consistently. In a number of cases, 75% or even 100% power was
required, indicating a reduction in safety margins for the manoeuvres. There was
no consistent pattern of higher tug power requirements between the two loading
conditions. This is due to the trade off between displacement and windage.
(iv) In almost all cases, the Ship Safety Index was higher for the minimum ballast
condition demonstrating that the minimum ballast condition required higher
engine power and rudder angles to maintain control and manoeuvre the vessel.
(v) In some cases, such as the action of wind or current from certain directions
relative to the ship, positive effects were experienced. These included the ability
to better balance the combined forces due to the wind and current, hence
increasing the ability to maintain course and track.
8 REFERENCES
[1] Principles of Naval Architecture; Volume III: Controllability, rev. 2. Ed. E.V. Lewis
SNAME Publication,1989.
[2] “SUMMARY OF VALE PORT REQUIREMENTS FOR VESSELS PRESENTED FOR
NOMINATION AND ACCEPTANCE FOR TRADING WITHIN VALE’S PORTS”,
available from www.vale.com.
[3] “Tubarão Port Information”; COMPANHIA VALE DO RIO DOCE PORT
OPERATIONS GENERAL MANAGEMENT, Sept 2004.

INTERCARGO Bulk Carrier Manoeuvrability
12 Report No: C12145.1R
APPENDIX A – SIMULATION RESULTS

INTERCARGO Bulk Carrier Manoeuvrability
13 Report No: C12145.1R
SIMULATION RESULTS - TUBARAO
Runs T1 and T4: Wind 10kts, 30 deg, current 1 kt, 225 deg
Figure A1: Track Plots for Runs T1 & T4
ROT with Time
-20
-15
-10
-5
0
5
10
00:00:00 00:14:24 00:28:48 00:43:12 00:57:36 01:12:00 01:26:24
Time
[hh:mm:ss]
ROT
[ °/m
in]
T1
T4
Manoeuvring Safety Index
-0.6
-0.4
-0.2
0.0
0.2
0.4
0.6
0.8
1.0
00:00:00 00:14:24 00:28:48 00:43:12 00:57:36 01:12:00 01:26:24
Time
[hh:mm:ss]
Safety Index
T1
T4
Figure A2(a): ROT Plots for Runs T1 & T4 Figure A2(b): Safety Index for Runs T1 & T4
Tug Bollard Pull with Time
-0.2
0.0
0.2
0.4
0.6
0.8
1.0
00:00:00 00:14:24 00:28:48 00:43:12 00:57:36 01:12:00 01:26:24
Time
[hh:mm:ss]
Bollard Pull
[% of max.]
T1 Tug 1
T1 Tug 2
T1 Tug 3
Tug Bollard Pull with Time
-0.2
0.0
0.2
0.4
0.6
0.8
1.0
00:00:00 00:07:12 00:14:24 00:21:36 00:28:48 00:36:00 00:43:12 00:50:24 00:57:36 01:04:48 01:12:00
Time
[hh:mm:ss]
Bollard Pull
[% of max.]
T4 Tug 1
T4 Tug 2
T4 Tug 3
Figure A2(c): Tug Index for Run T1 Figure A2(d): Tug Index for Run T4
T1
T1
WIND: 10kts
Current: 1kt 10kts

INTERCARGO Bulk Carrier Manoeuvrability
14 Report No: C12145.1R
Runs T2 and T5: Wind 14kts, 30 deg, current 1 kt, 225 deg
Figure A3: Track Plots for Runs T2 & T5
ROT with Time
-20
-15
-10
-5
0
5
10
00:00:00 00:07:12 00:14:24 00:21:36 00:28:48 00:36:00 00:43:12 00:50:24 00:57:36 01:04:48 01:12:00
Time
[hh:mm:ss]
ROT
[ °/m
in]
T2
T5
Manoeuvring Safety Index
-0.4
-0.2
0.0
0.2
0.4
0.6
0.8
1.0
00:00:00 00:07:12 00:14:24 00:21:36 00:28:48 00:36:00 00:43:12 00:50:24 00:57:36 01:04:48 01:12:00
Time
[hh:mm:ss]
Safety Index
T2
T5
Figure A4(a): ROT Plots for Runs T2 & T5 Figure A4(b): Safety Index for Runs T2 & T5
Tug Bollard Pull with Time
-0.2
0.0
0.2
0.4
0.6
0.8
1.0
00:00:00 00:07:12 00:14:24 00:21:36 00:28:48 00:36:00 00:43:12 00:50:24 00:57:36
Time
[hh:mm:ss]
Bollard Pull
[% of max.]
T2 Tug 1
T2 Tug 2
T2 Tug 3
Tug Bollard Pull with Time
-0.2
0.0
0.2
0.4
0.6
0.8
1.0
00:00:00 00:07:12 00:14:24 00:21:36 00:28:48 00:36:00 00:43:12 00:50:24 00:57:36 01:04:48 01:12:00
Time
[hh:mm:ss]
Bollard Pull
[% of max.]
T5 Tug 1
T5 Tug 2
T5 Tug 3
Figure A4(c): Tug Index for Run T2 Figure A4(d): Tug Index for Run T5
T2
T2
WIND: 14kts
Current: 1kt 10kts

INTERCARGO Bulk Carrier Manoeuvrability
15 Report No: C12145.1R
Runs T3 and T6: Wind 20kts, 30 deg, current 1 kt, 225 deg
Figure A5: Track Plots for Runs T3 & T6
ROT with Time
-20
-15
-10
-5
0
5
10
15
00:00:00 00:14:24 00:28:48 00:43:12 00:57:36 01:12:00 01:26:24
Time
[hh:mm:ss]
ROT
[°/m
in]
T3
T6
Manoeuvring Safety Index
-1.2
-1.0
-0.8
-0.6
-0.4
-0.2
0.0
0.2
0.4
0.6
0.8
1.0
1.2
00:00:00 00:14:24 00:28:48 00:43:12 00:57:36 01:12:00 01:26:24
Time
[hh:mm:ss]
Safety Index
T3
T6
Figure A6(a): ROT Plots for Runs T3 & T6 Figure A6(b): Safety Index for Runs T3 & T6 Tug Bollard Pull with Time
-0.1
0.0
0.1
0.2
0.3
0.4
0.5
0.6
0.7
0.8
00:00:00 00:14:24 00:28:48 00:43:12 00:57:36 01:12:00 01:26:24
Time
[hh:mm:ss]
Bollard Pull
[% of max.]
T3 Tug 1
T3 Tug 2
T3 Tug 3
Tug Bollard Pull with Time
-0.2
0.0
0.2
0.4
0.6
0.8
1.0
1.2
00:00:00 00:14:24 00:28:48 00:43:12 00:57:36 01:12:00 01:26:24
Time
[hh:mm:ss]
Bollard Pull
[% of max.]
T6 Tug 1
T6 Tug 2
T6 Tug 3
Figure A6(c): Tug Index for Run T3 Figure A6(d): Tug Index for Run T6
T3
T3
WIND: 20kts
Current: 1kt 10kts

INTERCARGO Bulk Carrier Manoeuvrability
16 Report No: C12145.1R
SIMULATION RESULTS – PONTO DE MADEIRA
Runs M1 and M4: Wind 15kts, 90 deg, current 2 kt, 180 deg
Figure A7: Track Plots for Runs M1 & M4
ROT with Time
-15
-10
-5
0
5
10
00:00:00 00:14:24 00:28:48 00:43:12 00:57:36 01:12:00 01:26:24 01:40:48
Time
[hh:mm:ss]
ROT
[°/m
in]
M1
M4
Manoeuvring Safety Index
-1.0
-0.8
-0.6
-0.4
-0.2
0.0
0.2
0.4
0.6
0.8
1.0
00:00:00 00:14:24 00:28:48 00:43:12 00:57:36 01:12:00 01:26:24 01:40:48
Time
[hh:mm:ss]
Safety Index
M1
M4
Figure A8(a): ROT Plots for Runs M1 & M4 Figure A8(b): Safety Index for Runs M1 & M4
Tug Bollard Pull with Time
-0.2
0.0
0.2
0.4
0.6
0.8
1.0
00:00:00 00:14:24 00:28:48 00:43:12 00:57:36 01:12:00 01:26:24
Time
[hh:mm:ss]
Bollard Pull
[% of max.]
M1 Tug 1
M1 Tug 2
M1 Tug 3
M1 Tug 4
Tug Bollard Pull with Time
-0.2
0.0
0.2
0.4
0.6
0.8
1.0
00:00:00 00:14:24 00:28:48 00:43:12 00:57:36 01:12:00 01:26:24 01:40:48
Time
[hh:mm:ss]
Bollard Pull
[% of max.]
M4 Tug 1
M4 Tug 2
M4 Tug 3
M4 Tug 4
Figure A8(c): Tug Index for Run M1 Figure A8(d): Tug Index for Run M4
WIND: 15kts
Current: 2kts 10kts
M1
M1
INTERCARGO Bulk Carrier Manoeuvrability
17 Report No: C12145.1R
Runs M2 and M5: Wind 20kts, 90 deg, current 2 kt, 180 deg
Figure A9: Track Plots for Runs M2 & M5
ROT with Time
-30
-25
-20
-15
-10
-5
0
5
10
15
00:00:00 00:07:12 00:14:24 00:21:36 00:28:48 00:36:00 00:43:12 00:50:24 00:57:36 01:04:48 01:12:00
Time
[hh:mm:ss]
ROT
[ °/m
in]
M2
M5
Manoeuvring Safety Index
-1.0
-0.8
-0.6
-0.4
-0.2
0.0
0.2
0.4
0.6
0.8
1.0
00:00:00 00:07:12 00:14:24 00:21:36 00:28:48 00:36:00 00:43:12 00:50:24 00:57:36 01:04:48 01:12:00
Time
[hh:mm:ss]
Safety Index
M2
M5
Figure A10(a): ROT Plots for Runs M2 & M5 Figure A10(b): Safety Index for Runs M2 & M5
Tug Bollard Pull with Time
-0.2
0.0
0.2
0.4
0.6
0.8
1.0
1.2
00:00:00 00:07:12 00:14:24 00:21:36 00:28:48 00:36:00 00:43:12 00:50:24 00:57:36 01:04:48 01:12:00
Time
[hh:mm:ss]
Bollard Pull
[% of max.]
M2 Tug 1
M2 Tug 2
M2 Tug 3
M2 Tug 4
Tug Bollard Pull with Time
-0.2
0.0
0.2
0.4
0.6
0.8
1.0
1.2
00:00:00 00:07:12 00:14:24 00:21:36 00:28:48 00:36:00 00:43:12 00:50:24 00:57:36 01:04:48 01:12:00
Time
[hh:mm:ss]
Bollard Pull
[% of max.]
M5 Tug 1
M5 Tug 2
M5 Tug 3
M5 Tug 4
Figure A10(c): Tug Index for Run M2 Figure A10(d): Tug Index for Run M5
WIND: 20kts
Current: 2kts 10kts
M2
M2

INTERCARGO Bulk Carrier Manoeuvrability
18 Report No: C12145.1R
Runs M3 and M6: Wind 20kts, 30 deg, current 2 kt, 180 deg
Figure A11: Track Plots for Runs M3 & M6
ROT with Time
-30
-25
-20
-15
-10
-5
0
5
10
15
20
00:00:00 00:07:12 00:14:24 00:21:36 00:28:48 00:36:00 00:43:12 00:50:24 00:57:36
Time
[hh:mm:ss]
ROT
[ °/m
in]
M3
M6
Manoeuvring Safety Index
-1.0
-0.8
-0.6
-0.4
-0.2
0.0
0.2
0.4
0.6
0.8
1.0
00:00:00 00:07:12 00:14:24 00:21:36 00:28:48 00:36:00 00:43:12 00:50:24 00:57:36
Time
[hh:mm:ss]
Safety Index
M3
M6
Figure A12(a): ROT Plots for Runs M3 & M6 Figure A12(b): Safety Index for Runs M3 &
M6 Tug Bollard Pull with Time
-0.2
0.0
0.2
0.4
0.6
0.8
1.0
00:00:00 00:07:12 00:14:24 00:21:36 00:28:48 00:36:00 00:43:12
Time
[hh:mm:ss]
Bollard Pull
[% of max.]
M3 Tug 1
M3 Tug 2
M3 Tug 3
M3 Tug 4
Tug Bollard Pull with Time
-0.2
0.0
0.2
0.4
0.6
0.8
1.0
00:00:00 00:07:12 00:14:24 00:21:36 00:28:48 00:36:00 00:43:12 00:50:24 00:57:36
Time
[hh:mm:ss]
Bollard Pull
[% of max.]
M6 Tug 1
M6 Tug 2
M6 Tug 3
M6 Tug 4
Figure A12(c): Tug Index for Run M3 Figure A12(d): Tug Index for Run M6
WIND: 20kts
Current: 2kts 10kts
M3
M3

INTERCARGO Bulk Carrier Manoeuvrability
19 Report No: C12145.1R
Runs M7 and M10: Wind 15kts, 90 deg, current 2 kt, 000 deg
Figure A13: Track Plots for Runs M7 & M10
ROT with Time
-25
-20
-15
-10
-5
0
5
10
15
00:00:00 00:07:12 00:14:24 00:21:36 00:28:48 00:36:00 00:43:12 00:50:24 00:57:36
Time
[hh:mm:ss]
ROT
[ °/m
in]
M7
M10
Manoeuvring Safety Index
-2.6
-2.4
-2.2
-2.0
-1.8
-1.6
-1.4
-1.2
-1.0
-0.8
-0.6
-0.4
-0.2
0.0
0.2
0.4
0.6
0.8
1.0
00:00:00 00:07:12 00:14:24 00:21:36 00:28:48 00:36:00 00:43:12 00:50:24 00:57:36
Time
[hh:mm:ss]
Safety Index
M7
M10
Figure A12(a): ROT Plots for Runs M7 & 10 Figure A12(b): Safety Index for Runs M7 &
M10 Tug Bollard Pull with Time
-0.2
0.0
0.2
0.4
0.6
0.8
1.0
00:00:00 00:07:12 00:14:24 00:21:36 00:28:48 00:36:00 00:43:12 00:50:24 00:57:36
Time
[hh:mm:ss]
Bollard Pull
[% of max.]
M7 Tug 1
M7 Tug 2
M7 Tug 3
M7 Tug 4
Tug Bollard Pull with Time
-0.2
0.0
0.2
0.4
0.6
0.8
1.0
00:00:00 00:07:12 00:14:24 00:21:36 00:28:48 00:36:00 00:43:12
Time
[hh:mm:ss]
Bollard Pull
[% of max.]
M10 Tug 1
M10 Tug 2
M10 Tug 3
M10 Tug 4
Figure A12(c): Tug Index for Run M7 Figure A12(d): Tug Index for Run M10
WIND: 15kts
Current: 2kts 10kts
M7
M7

INTERCARGO Bulk Carrier Manoeuvrability
20 Report No: C12145.1R
Runs M8 and M11: Wind 20kts, 90 deg, current 2 kt, 000 deg
Figure A13: Track Plots for Runs M8 & M11
ROT with Time
-25
-20
-15
-10
-5
0
5
10
15
00:00:00 00:07:12 00:14:24 00:21:36 00:28:48 00:36:00 00:43:12 00:50:24
Time
[hh:mm:ss]
ROT
[ °/m
in]
M8
M11
Manoeuvring Safety Index
-1.0
-0.8
-0.6
-0.4
-0.2
0.0
0.2
0.4
0.6
0.8
1.0
00:00:00 00:07:12 00:14:24 00:21:36 00:28:48 00:36:00 00:43:12 00:50:24
Time
[hh:mm:ss]
Safety Index
M8
M11
Figure A14(a): ROT Plots for Runs M8 & 11 Figure A14(b): Safety Index for Runs M8 &
M11 Tug Bollard Pull with Time
-0.2
0.0
0.2
0.4
0.6
0.8
1.0
00:00:00 00:07:12 00:14:24 00:21:36 00:28:48 00:36:00 00:43:12
Time
[hh:mm:ss]
Bollard Pull
[% of max.]
M8 Tug 1
M8 Tug 2
M8 Tug 3
M8 Tug 4
Tug Bollard Pull with Time
-0.2
0.0
0.2
0.4
0.6
0.8
1.0
00:00:00 00:07:12 00:14:24 00:21:36 00:28:48 00:36:00 00:43:12 00:50:24
Time
[hh:mm:ss]
Bollard Pull
[% of max.]
M11 Tug 1
M11 Tug 2
M11 Tug 3
M11 Tug 4
Figure A14(c): Tug Index for Run M8 Figure A14(d): Tug Index for Run M11
WIND: 20kts
Current: 2kts 10kts
M8
M8

INTERCARGO Bulk Carrier Manoeuvrability
21 Report No: C12145.1R
Runs M9 and M12: Wind 20kts, 30 deg, current 2 kt, 000 deg
Figure A13: Track Plots for Runs M9 & M12
ROT with Time
-20
-15
-10
-5
0
5
00:00:00 00:07:12 00:14:24 00:21:36 00:28:48 00:36:00 00:43:12
Time
[hh:mm:ss]
ROT
[ °/m
in]
M9
M12
Manoeuvring Safety Index
-1.0
-0.8
-0.6
-0.4
-0.2
0.0
0.2
0.4
0.6
0.8
1.0
00:00:00 00:07:12 00:14:24 00:21:36 00:28:48 00:36:00 00:43:12
Time
[hh:mm:ss]
Safety Index
M9
M12
Figure A14(a): ROT Plots for Runs M9 & 12 Figure A14(b): Safety Index for Runs M9 &
M12 Tug Bollard Pull with Time
-0.2
0.0
0.2
0.4
0.6
0.8
1.0
00:00:00 00:07:12 00:14:24 00:21:36 00:28:48 00:36:00
Time
[hh:mm:ss]
Bollard Pull
[% of max.]
M9 Tug 1
M9 Tug 2
M9 Tug 3
M9 Tug 4
Tug Bollard Pull with Time
-0.2
0.0
0.2
0.4
0.6
0.8
1.0
00:00:00 00:07:12 00:14:24 00:21:36 00:28:48 00:36:00 00:43:12
Time
[hh:mm:ss]
Bollard Pull
[% of max.]
M12 Tug 1
M12 Tug 2
M12 Tug 3
M12 Tug 4
Figure A14(c): Tug Index for Run M9 Figure A14(d): Tug Index for Run M12
WIND: 20kts
Current: 2kts 10kts
M9
M9