Effect of the Length of a Torpedo Anchor on Its Vertical ...
40
Effect of the Length of a Torpedo Anchor on Its Vertical Holding Capacity by John Voon Hsien Yoong 16034 Dissertation submitted in partial fulfilment of the requirements for the Bachelor of Engineering (Hons) Mechanical Engineering JANUARY 2016 Universiti Teknologi PETRONAS Bandar Seri Iskandar 31750 Tronoh Perak Darul Ridzuan
Transcript of Effect of the Length of a Torpedo Anchor on Its Vertical ...
Effect of the Length of a Torpedo Anchor on Its Vertical Holding
Capacity
by
John Voon Hsien Yoong
16034
Dissertation submitted in partial fulfilment of
the requirements for the
Bachelor of Engineering (Hons)
Mechanical Engineering
JANUARY 2016
Universiti Teknologi PETRONAS
Bandar Seri Iskandar
31750 Tronoh
Perak Darul Ridzuan
CERTIFICATION OF APPROVAL
Effect of the Length of a Torpedo Anchor on Its Vertical Holding
Capacity
by
John Voon Hsien Yoong
16034
A project dissertation submitted to the
Mechanical Engineering Programme
Universiti Teknologi PETRONAS
in partial fulfilment of the requirement for the
BACHELOR OF ENGINEERING (Hons)
MECHANICAL ENGINEERING
Approved by,
_______________________
(Dr. William Pao King Soon)
UNIVERSITI TEKNOLOGI PETRONAS
TRONOH, PERAK
JANUARY 2016
CERTIFICATION OF ORIGINALITY
This is to certify that I am responsible for the work submitted in this
project, that the original work is my own except as specified in the
reference and acknowledgements, and that the original work contained
herein have not been undertaken or done by unspecified sources or
persons.
__________________________
(JOHN VOON HSIEN YOONG)
i
ABSTRACT
Since its introduction in 1996, the torpedo anchor has built a reputation for itself as a
simple and cost effective deepwater anchoring solution. While numerous field tests
and numerical research has been done to verify the torpedo anchors holding capacity
under various load and soil conditions, the effect of the geometry of the anchor itself
on its holding capacity has not been properly identified. This research attempts to
improve the database of knowledge regarding the torpedo anchor. Specifically, the
research objectives are i) to evaluate the vertical holding capacity of torpedo anchors
using analytical and numerical methods and ii) to analyze the correlation between the
total length of a torpedo anchor and its vertical holding capacity. The numerical
method uses a 2-D axisymmetric model to evaluate the vertical holding capacity with
respect to varying total lengths. Both the soil and anchor were simulated as
homogeneous, isotropic linearly elastic materials using plane elements capable of
demonstrating non-linearity and large displacement behaviour. The non-lienar
interaction between the anchor and soil is also modelled using contact finite elements
that allow relative sliding and detachment between the two surfaces in contact.
Results from the numerical analysis is compared with analytical calculations using a
variation of the ultimate load bearing capacity equation for conventional piles to suit
the use for torpedo anchors. The pattern of results obtained from both the numerical
model and the analytical calculations agreed upon the premise that the vertical
holding capacity of a torpedo anchor increases as the total length of the anchor
increases.
ii
ACKNOWLEDGEMENTS
First and foremost, I would like to express my utmost gratitude to my supervisor Dr.
William Pao for allowing me to undertake my Final Year Project under your
supervision and for all your motivational words and patience for me.
I would like to express my sincere thanks to Mr. Abdallelah Ganawa for taking time
out of your hectic schedule to advise me regarding finite element simulation.
Thank you also to my all colleagues for making yourselves available whenever I
needed some help or advice.
Last but not least, I would like to express my perpetual gratitude to my parents for
granting me this opportunity to learn and experience all that I have throughout my
years in Universiti Teknologi PETRONAS.
I also place on the record, my sense of gratitude to one and all, who directly or
indirectly, have lent their hand in the completion of this project.
iii
LIST OF FIGURES
Figure 2.1: Suction pile with taut leg mooring
Figure 2.2: Schematic of Vryhof Stevmanta (left) and Anchor drag installation
(right)
Figure 2.3: Schematic of SEPLA installation
Figure 2.4: Full scale torpedo pile and releasing situation
Figure 2.5: Model B (left) and Model N (right) used in centrifuge test
Figure 2.6: Direction of load applied to the anchor and the two planes used to
measure effect of load inclination with respect to fluke planes
Figure 2.7: Load and reaction forces a pile
Figure 3.1: Flow of project tasks
Figure 3.2: Schematic representation of the torpedo anchor and its relevant
dimensions
Figure 3.3: Schematic of FE model
Figure 3.4: Area of soil body (left) and constraints applied onto soil body (right)
Figure 4.1: Graph of vertical holding capacity versus total length of torpedo
anchor
Figure 4.2: Graph of load resistance versus total length of torpedo anchor
Figure 4.3: Graph of surface area versus total length of torpedo anchor
Figure 4.4: Stress-strain curve of an isotropic linear elastic material
Figure 4.5: Soil-anchor model (left) and Von Mises stress contours after gravity
load (right)
Figure 4.6: Shear stress contours (left) and contact status (right) of the 15m length
anchor model at 3.53MN load
Figure 4.7: Graph of vertical holding capacity versus total length of torpedo
anchor for FE model and analytical calculations
LIST OF TABLES
Table 3.1: Relevant parameters used in analytical calculation of torpedo anchor
holding capacity
Table 3.2: Properties of soil model
Table 3.3: Properties of anchor model

iv
ABBREVIATIONS AND NOMENCLATURE
𝐴𝑝 = area of pile tip
𝐴𝑡𝑖𝑝 = tip area of torpedo anchor
𝐴𝑤𝑎𝑙𝑙 = wall area of torpedo anchor
𝐵 = width of foundation
𝑐′ = cohesion of the soil supporting the pile tip
𝑐𝑢 = undrained cohesion of the soil below pile tip
𝐷 = diameter of torpedo anchor
𝐷𝑝 = pile width
𝑓 = unit friction resistance at any depth 𝑧
𝐿𝑡𝑜𝑡𝑎𝑙 = total length of torpedo anchor
𝐿1 = length of torpedo anchor body
𝐿2 = length of torpedo anchor tip
𝑁𝑐, 𝑁𝑐∗, 𝑁𝑞
∗, 𝑁𝛾∗ = bearing capacity factors
𝑝 = perimeter of the pile section
𝑝𝑜′
= overburden pressure at torpedo anchor mid-length
𝑞 = vertical stress
𝑞𝑎𝑣 = average unit tip resistance of torpedo anchor
𝑞′ = effective vertical stress
𝑞𝑝 = unit point resistance
𝑞𝑢 = ultimate bearing capacity
𝑄𝑓 = friction resistance of torpedo anchor
𝑄𝑝 = pile ultimate load-carrying capacity
𝑄𝑡𝑖𝑝 = tip resistance of torpedo anchor
𝑄𝑣 = vertical pullout/holding capacity of torpedo anchor
𝑠𝑢 = undrained shear strength of soil
𝑊′ = submerged weight of torpedo anchor
𝛼 = adhesion of soil
𝛾 = unit weight of soil
∆𝐿 = incremental pile length over which 𝑝 and 𝑓 are taken constant
𝜏𝑣𝑛 = unit soil friction
v
TABLE OF CONTENTS
ABSTRACT ........................................................................................................................ i
ACKNOWLEDGEMENTS ............................................................................................... ii
LIST OF FIGURES .......................................................................................................... iii
LIST OF TABLES ............................................................................................................ iii
ABBREVIATIONS AND NOMENCLATURE ............................................................... iv
TABLE OF CONTENTS ................................................................................................... v
CHAPTER 1: INTRODUCTION ........................................................................................ 1
1.1 PROJECT BACKGROUND ................................................................................ 1
1.2 PROBLEM STATEMENT .................................................................................. 2
1.3 OBJECTIVE ........................................................................................................ 2
1.4 SCOPE OF STUDY ............................................................................................. 2
CHAPTER 2: LITERATURE REVIEW ............................................................................. 3
2.1 SUCTION PILES/ANCHORS ............................................................................ 3
2.2 VERTICALLY LOADED ANCHORS (VLA) ................................................... 4
2.3 SUCTION EMBEDDED PLATE ANCHOR (SEPLA) ...................................... 6
2.4 TORPEDO ANCHORS ....................................................................................... 7
2.5 LOAD BEARING CAPACITY OF PILES ....................................................... 10
CHAPTER 3: METHODOLOGY ..................................................................................... 14
3.1 PROJECT WORK & FLOWCHART ................................................................ 14
3.2 ANALYTICAL CALCULATIONS .................................................................. 15
3.3 FINITE ELEMENT (FE) MODELING ............................................................. 17
3.4 GANTT CHART................................................................................................ 21
CHAPTER 4: RESULTS AND DISCUSSION ................................................................. 22
4.1 ANALYTICAL CALCULATIONS .................................................................. 22
4.2 FINITE ELEMENT (FE) MODELING ............................................................. 25
CHAPTER 5: CONCLUSION AND RECOMMENDATION .......................................... 29
REFERENCES ................................................................................................................. 30
1
CHAPTER 1
INTRODUCTION
1.1 PROJECT BACKGROUND
The rise to prominence of deepwater oil and gas exploration and production (E&P)
from a state of obscurity to becoming a major consideration in the petroleum
industry’s upstream budget has been apparent in recent decades. However, even with
the discovery of 42 giant fields (>500 million BOE), deepwater E&P remains an
immature avenue in the oil and gas industry in terms of proven and economical
technologies (Weimer et al., 2004). The practicality of using fixed production
platforms, such as jacket platforms and jack-up rigs, is greatly hampered by the
extreme depths that deepwater projects can reach. It becomes increasingly difficult
for a fixed structure to transmit lateral forces (i.e. shear and bending forces) to the
seabed as the water depth at which the structure is fixed increases, resulting in the
swaying of the topside facility (Lewis, 1982). The costs for such enormous fixed
structures also make it uneconomical for usage in deepwater projects (Adrezin et al.,
1996). According to Colligan (1999), the overall feasibility of using fixed platforms
for offshore production stops just a little bit over 1,000 ft, after which alternatives
must be selected. Hence, floating structures such as tension leg platforms (TLPs),
FPSOs and spars are used in place of fixed structures. These structures are able to
yield or move in response to the lateral wind and wave loads on the structure,
reducing the transmission of the total loads to the seabed. In order to achieve this sort
of response, these floating structures need to be secured on location via dynamic
systems such as catenary or taut leg mooring with the use of anchors. This requires
anchors to ‘nail’ one end of each mooring line to the seabed which will attenuate
both vertical and lateral loads acting on the floating structures as tension builds up in
the mooring lines, allowing the structure to move within a fixed design boundary.
The anchors used can be further categorized into suction anchors, vertically loaded
anchors (VLA), suction embedded plate anchors (SEPLA) and torpedo anchors,
depending on their respective working principles and installation methods.
2
1.2 PROBLEM STATEMENT
It is well-known that the installation method of the torpedo anchor, introduced in
1996, is less sophisticated as compared to other deepwater anchors used in the
petroleum industry. Over 60 finned and finless torpedo anchors of various sizes and
weights have been field-tested in recent years. However, due to large penetration
depth variations obtained by practitioners, torpedo anchors still require more
comprehensive testing and full-scale installations of prototypes to increase the
confidence of the petroleum industry in this innovative concept (Colliat, 2002).
Deployed torpedo anchors that have excessive inclination after penetration have been
known to be retrieved and redeployed due to its reduced holding capacity (Raie &
Tassoulas, 2009). While there is no standard design manual for torpedo anchors, the
effect of the torpedo anchor’s length on its eventual holding capacity still has not
been explored thoroughly.
1.3 OBJECTIVE
This project aims to:
a) To evaluate the vertical holding capacity of torpedo anchors using analytical
and numerical methods
b) To analyze the correlation between the length of a torpedo anchor and its
holding capacity
1.4 SCOPE OF STUDY
This project concentrates on the correlation between the vertical holding capacity of
torpedo anchors at different total lengths. The parameter that is investigated in this
project is the total length of the torpedo anchor and how it responds to loads applied
to it at an angle of 90° or vertical at the top end of the anchor. Throughout the course
of this study, no hydrodynamic effects are considered. The soil is modelled as a
homoegeneous, isotropic linear elastic medium
3
CHAPTER 2
LITERATURE REVIEW
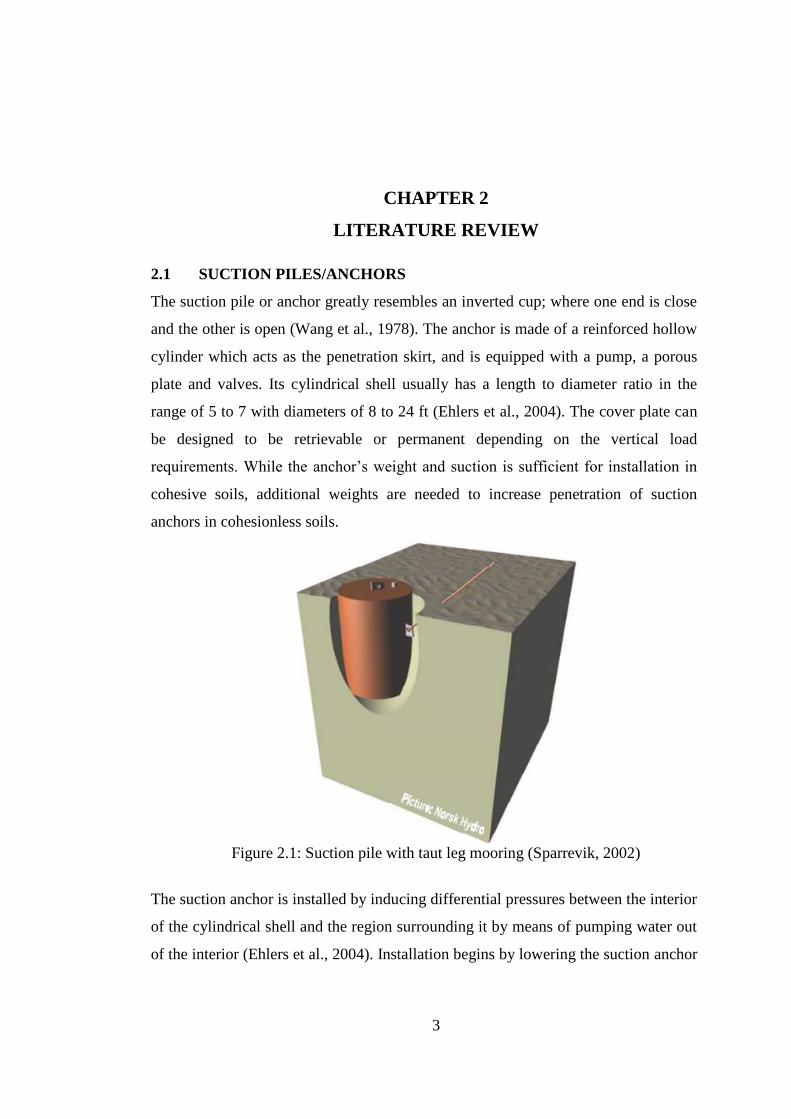
2.1 SUCTION PILES/ANCHORS
The suction pile or anchor greatly resembles an inverted cup; where one end is close
and the other is open (Wang et al., 1978). The anchor is made of a reinforced hollow
cylinder which acts as the penetration skirt, and is equipped with a pump, a porous
plate and valves. Its cylindrical shell usually has a length to diameter ratio in the
range of 5 to 7 with diameters of 8 to 24 ft (Ehlers et al., 2004). The cover plate can
be designed to be retrievable or permanent depending on the vertical load
requirements. While the anchor’s weight and suction is sufficient for installation in
cohesive soils, additional weights are needed to increase penetration of suction
anchors in cohesionless soils.
Figure 2.1: Suction pile with taut leg mooring (Sparrevik, 2002)
The suction anchor is installed by inducing differential pressures between the interior
of the cylindrical shell and the region surrounding it by means of pumping water out
of the interior (Ehlers et al., 2004). Installation begins by lowering the suction anchor

4
to some degree of penetration in the seabed due to its self-weight before pumping
water out of the shell. This results in the hydrostatic pressure outside the shell to be
higher than the reduced pressure inside, providing a pressure difference that will
drive the anchor into the soil in addition to its weight (Andersen et al., 2005).
Mooring loads on the anchor are usually applied to an external padeye on the body of
the shell. Design calculations are carried out to position the load attachment point
(external padeye) such that the applied mooring load and the soil reaction forces are
balanced, and the anchor fails only by translation (Sparrevik, 2002). Due to this the
maximum holding capacity of a suction anchor is usually achieved in translational
mode of failure.
Since its introduction, the suction anchor has been revered for its simplicity in
accurate installation (Ehlers et al., 2004). Being the most experienced deepwater
mooring anchor has led to ever more refined design and installation procedures.
Moreover, any disorientations or misalignments in its installation can be easily
corrected through the direct retrieval of the suction anchor (Senpere & Auvergne,
1982).
The suction anchor’s sheer size and weight may require the rental of a crane vessel
and require more trips to and from shore to deploy the designed number of anchors
(Ehlers et al., 2004). Its installation also cannot be done without the use of an ROV.
In terms of design, the suction anchor has reduced efficiency in cohesionless soils
(Eltaher et al., 2003). According to Ehlers et al. (2004), the design of a suction
anchor requires advanced testing techniques to acquire accurate soil data since these
anchors are known to have problems with holding capacity when installed in layered
soils.
2.2 VERTICALLY LOADED ANCHORS (VLA)
Vertically loaded anchors (VLA) can be employed, with an angle of 35 to 45 degrees
between the seabed and mooring lines, for taut leg mooring applications used in
offshore structures (Huang & Lee, 1998). The VLA essentially comprises of two
parts namely the shank and fluke, the latter of which it derives its holding capacity
5
from. Available VLAs on the market include the Bruce Denla and the Vryhof
Stevmanta.
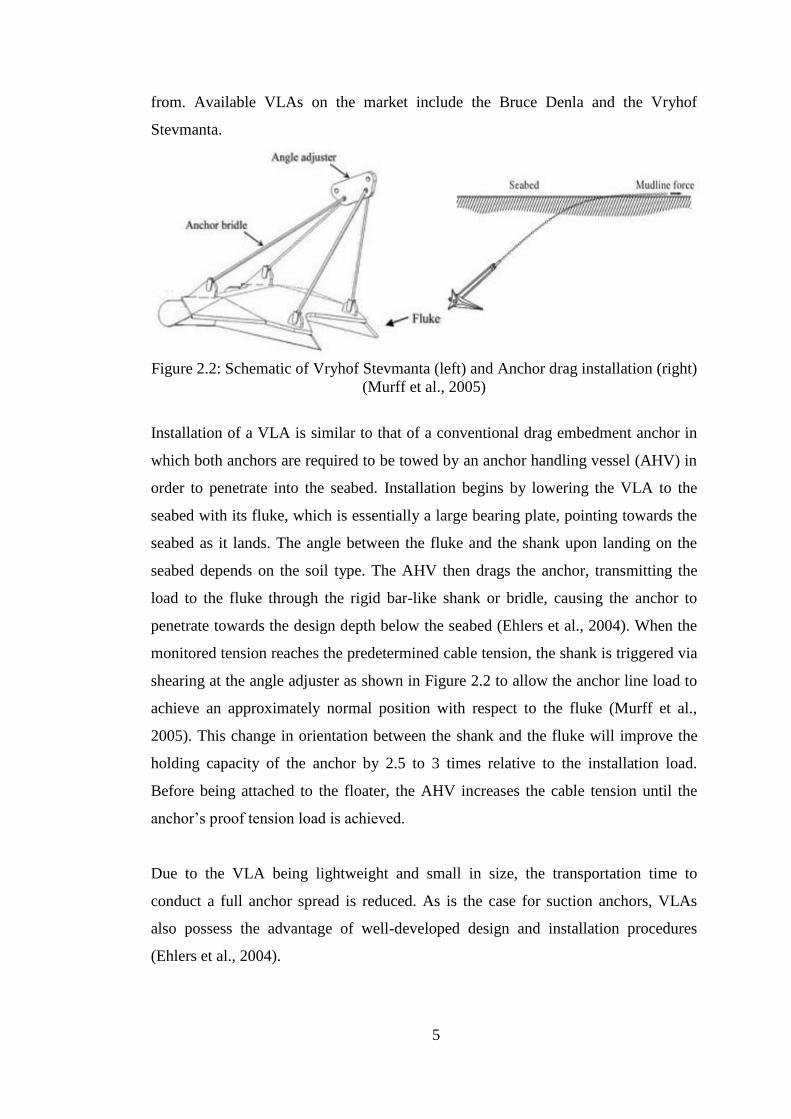
Figure 2.2: Schematic of Vryhof Stevmanta (left) and Anchor drag installation (right)
(Murff et al., 2005)
Installation of a VLA is similar to that of a conventional drag embedment anchor in
which both anchors are required to be towed by an anchor handling vessel (AHV) in
order to penetrate into the seabed. Installation begins by lowering the VLA to the
seabed with its fluke, which is essentially a large bearing plate, pointing towards the
seabed as it lands. The angle between the fluke and the shank upon landing on the
seabed depends on the soil type. The AHV then drags the anchor, transmitting the
load to the fluke through the rigid bar-like shank or bridle, causing the anchor to
penetrate towards the design depth below the seabed (Ehlers et al., 2004). When the
monitored tension reaches the predetermined cable tension, the shank is triggered via
shearing at the angle adjuster as shown in Figure 2.2 to allow the anchor line load to
achieve an approximately normal position with respect to the fluke (Murff et al.,
2005). This change in orientation between the shank and the fluke will improve the
holding capacity of the anchor by 2.5 to 3 times relative to the installation load.
Before being attached to the floater, the AHV increases the cable tension until the
anchor’s proof tension load is achieved.
Due to the VLA being lightweight and small in size, the transportation time to
conduct a full anchor spread is reduced. As is the case for suction anchors, VLAs
also possess the advantage of well-developed design and installation procedures
(Ehlers et al., 2004).
6
The complex installation method which involves the dragging, keying and proof
loading of a VLA requires multiple vessels and an ROV to be completed (Ehlers et
al., 2004). The lack of a monitoring system to track and assure that the anchor has
been installed at design penetration depth also puts the VLA at a disadvantage for
application. Moreover, as noted by Ehlers et al. (2004), VLAs only working
experience with permanent floating structures are within Brazilian waters.
2.3 SUCTION EMBEDDED PLATE ANCHOR (SEPLA)
The suction embedded plate anchor (SEPLA) puts into practice the concepts of the
suction anchor and the vertically loaded anchor (VLA) simultaneously. The SEPLA
consists of a rectangular fluke and a full-length keying flat mounted along the top
edge of the fluke using an offset hinge. Due to the hinge used, soil pressure along the
flap’s top edge will force it to rotate about the fluke which will increase the vertical
end bearing area by four times (Wilde et al., 2001). This will avoid the SEPLA from
translating back up its installation track when a tension load is applied to it.
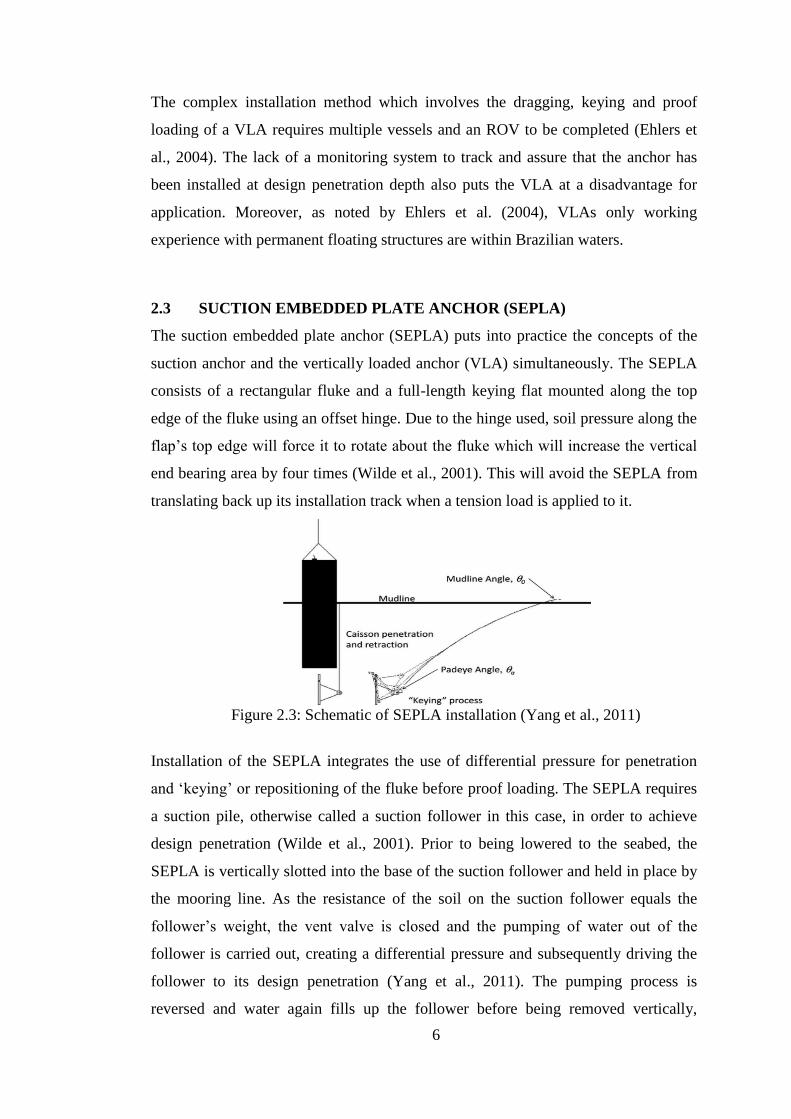
Figure 2.3: Schematic of SEPLA installation (Yang et al., 2011)
Installation of the SEPLA integrates the use of differential pressure for penetration
and ‘keying’ or repositioning of the fluke before proof loading. The SEPLA requires
a suction pile, otherwise called a suction follower in this case, in order to achieve
design penetration (Wilde et al., 2001). Prior to being lowered to the seabed, the
SEPLA is vertically slotted into the base of the suction follower and held in place by
the mooring line. As the resistance of the soil on the suction follower equals the
follower’s weight, the vent valve is closed and the pumping of water out of the
follower is carried out, creating a differential pressure and subsequently driving the
follower to its design penetration (Yang et al., 2011). The pumping process is
reversed and water again fills up the follower before being removed vertically,
7
leaving the SEPLA in place. It is then rotated or ‘keyed’ as the AHV applies a
tension load on the mooring line connected to the SEPLA’s offset padeye, ultimately
achieving a perpendicular orientation relative to the applied load where the SEPLA’s
holding capacity takes effect.
Other than integrating the use of the proven suction installation method, the
SEPLA’s anchor element is also the cheapest to produce among all deepwater
anchors (Ehlers et al., 2004). The position and penetration of the anchor plate part of
the SEPLA is also able to be determined accurately. Its design procedure is also
based on proven design methods of plate anchors.
The main disadvantage of the SEPLA is that it is a proprietary installation method;
which contributes to its limited applications in real time mooring (Ehlers et al.,
2004). Also, according to Ehlers et al. (2004), the installation of a SEPLA will take
about 30% more time as compared to a conventional suction anchor, partly due to the
need for keying and proof loading.
2.4 TORPEDO ANCHORS
The torpedo anchor was introduced in 1996 as an alternative anchor concept to
provide vertical load bearing capacity. In essence, a torpedo anchor is a cylindrical
pipe section with a conical tip and a padeye on top (Raie & Tassoulas, 2009). Fins
are also added to the anchor’s cylindrical shell in order to improve directional
stability during installation (Hasanloo & Yu, 2011). The anchors are filled with high-
density materials such as metal, concrete and scrap chain.
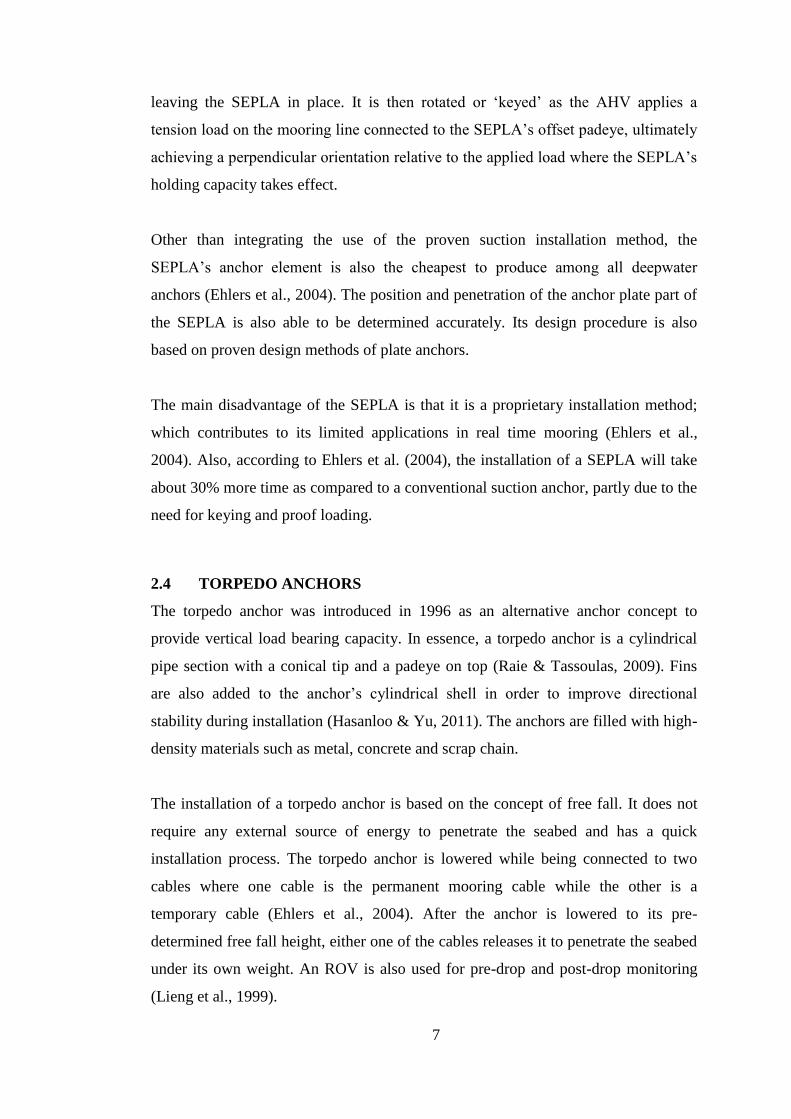
The installation of a torpedo anchor is based on the concept of free fall. It does not
require any external source of energy to penetrate the seabed and has a quick
installation process. The torpedo anchor is lowered while being connected to two
cables where one cable is the permanent mooring cable while the other is a
temporary cable (Ehlers et al., 2004). After the anchor is lowered to its pre-
determined free fall height, either one of the cables releases it to penetrate the seabed
under its own weight. An ROV is also used for pre-drop and post-drop monitoring
(Lieng et al., 1999).
8
Figure 2.4: Full scale torpedo pile and releasing situation (Lieng et al. 1999)
The main advantage of the torpedo anchor is its simplicity in design, being able to
practice the API RP 2A guidelines as used in conventional pile design procedures
(Ehlers et al., 2004). Its compact and robust design is simple and cost effective to
fabricate. The filling of the centre core and completion assembly can also be
performed en route to its installation site since no surface coating is required for the
anchor (Lieng et al., 1999). Due to its working principle, the installation of torpedo
anchors are simple and cost effective; where one vessel and ROV each are able to
complete the task (Ehlers et al., 2004).
The main disadvantage of the torpedo anchor is that it is a proprietary installation
method; which contributes to its limited applications in real time mooring to
Brazilian waters alone (Ehlers et al., 2004). Also, according to Ehlers et al. (2004),
the lack of properly documented design and installation steps, and monitoring
systems for post-installation verticality are also problems faced by users of torpedo
anchors.
9
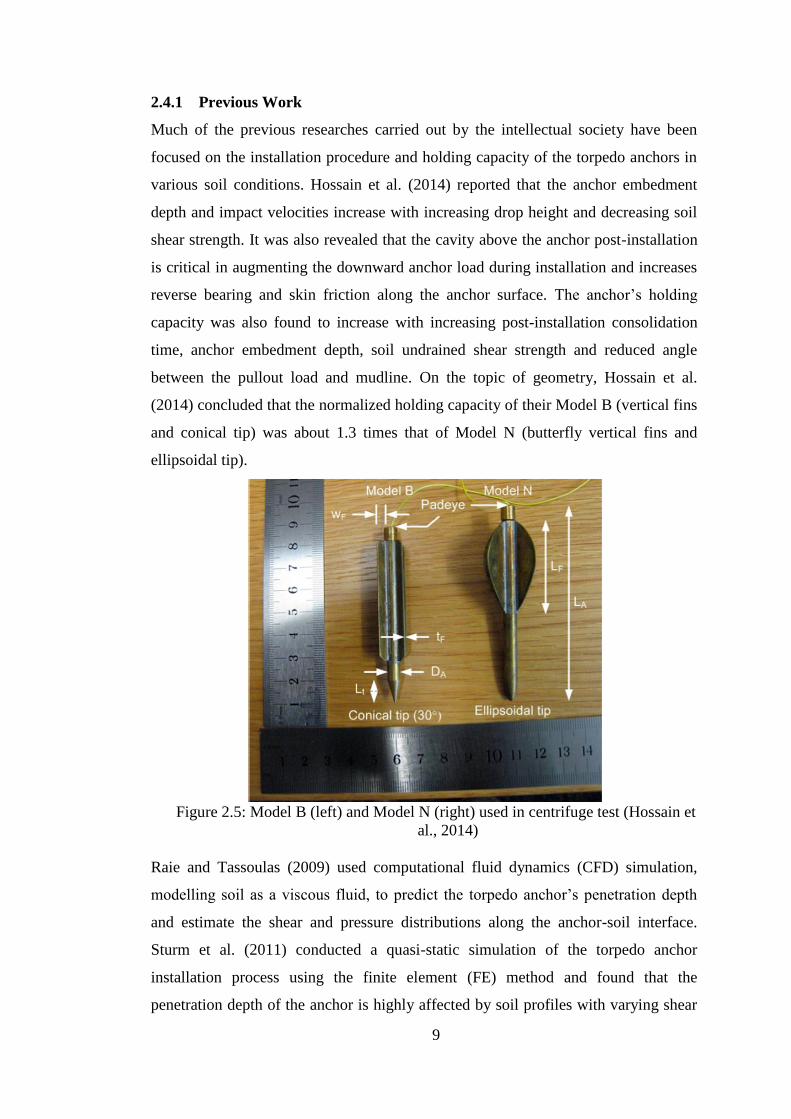
2.4.1 Previous Work
Much of the previous researches carried out by the intellectual society have been
focused on the installation procedure and holding capacity of the torpedo anchors in
various soil conditions. Hossain et al. (2014) reported that the anchor embedment
depth and impact velocities increase with increasing drop height and decreasing soil
shear strength. It was also revealed that the cavity above the anchor post-installation
is critical in augmenting the downward anchor load during installation and increases
reverse bearing and skin friction along the anchor surface. The anchor’s holding
capacity was also found to increase with increasing post-installation consolidation
time, anchor embedment depth, soil undrained shear strength and reduced angle
between the pullout load and mudline. On the topic of geometry, Hossain et al.
(2014) concluded that the normalized holding capacity of their Model B (vertical fins
and conical tip) was about 1.3 times that of Model N (butterfly vertical fins and
ellipsoidal tip).
Figure 2.5: Model B (left) and Model N (right) used in centrifuge test (Hossain et
al., 2014)
Raie and Tassoulas (2009) used computational fluid dynamics (CFD) simulation,
modelling soil as a viscous fluid, to predict the torpedo anchor’s penetration depth
and estimate the shear and pressure distributions along the anchor-soil interface.
Sturm et al. (2011) conducted a quasi-static simulation of the torpedo anchor
installation process using the finite element (FE) method and found that the
penetration depth of the anchor is highly affected by soil profiles with varying shear
10
strengths. For their considered cases, the pure vertical holding capacity of the anchor
is not only unaffected, but may be even higher if the softer layers of soil are covered
with stiffer layers and the flukes of the anchor are positioned in the stiffer soil.
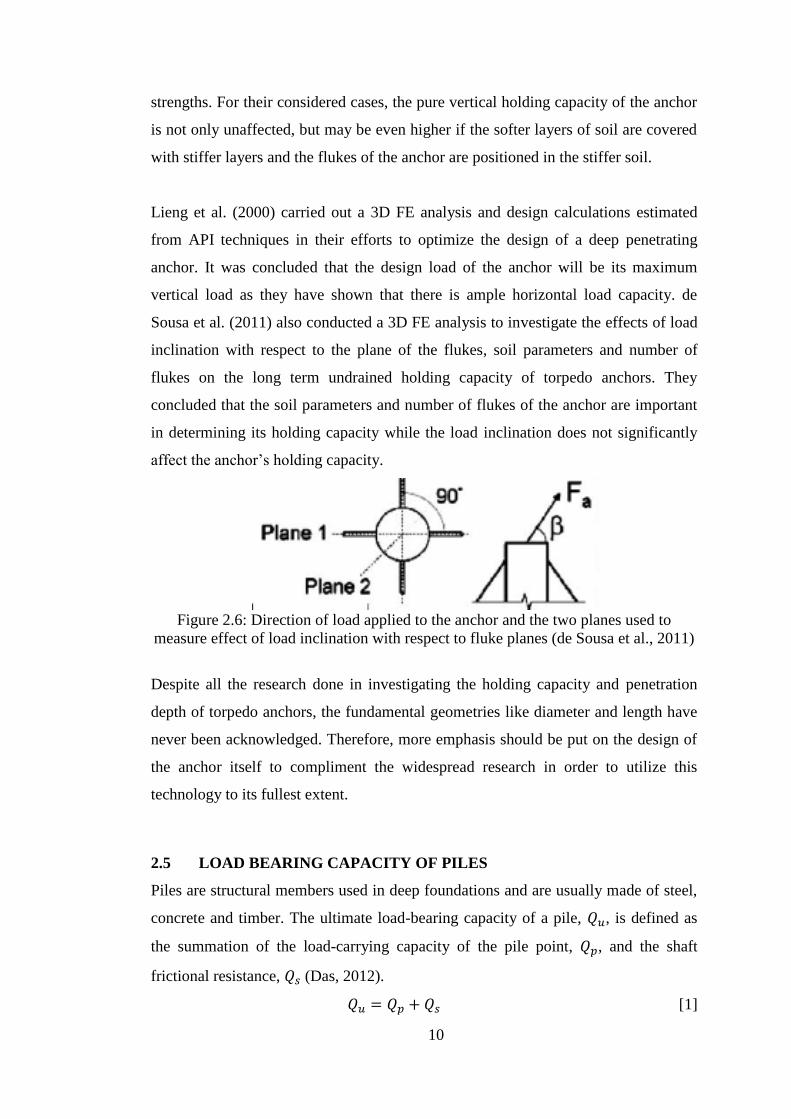
Lieng et al. (2000) carried out a 3D FE analysis and design calculations estimated
from API techniques in their efforts to optimize the design of a deep penetrating
anchor. It was concluded that the design load of the anchor will be its maximum
vertical load as they have shown that there is ample horizontal load capacity. de
Sousa et al. (2011) also conducted a 3D FE analysis to investigate the effects of load
inclination with respect to the plane of the flukes, soil parameters and number of
flukes on the long term undrained holding capacity of torpedo anchors. They
concluded that the soil parameters and number of flukes of the anchor are important
in determining its holding capacity while the load inclination does not significantly
affect the anchor’s holding capacity.
Figure 2.6: Direction of load applied to the anchor and the two planes used to
measure effect of load inclination with respect to fluke planes (de Sousa et al., 2011)
Despite all the research done in investigating the holding capacity and penetration
depth of torpedo anchors, the fundamental geometries like diameter and length have
never been acknowledged. Therefore, more emphasis should be put on the design of
the anchor itself to compliment the widespread research in order to utilize this
technology to its fullest extent.
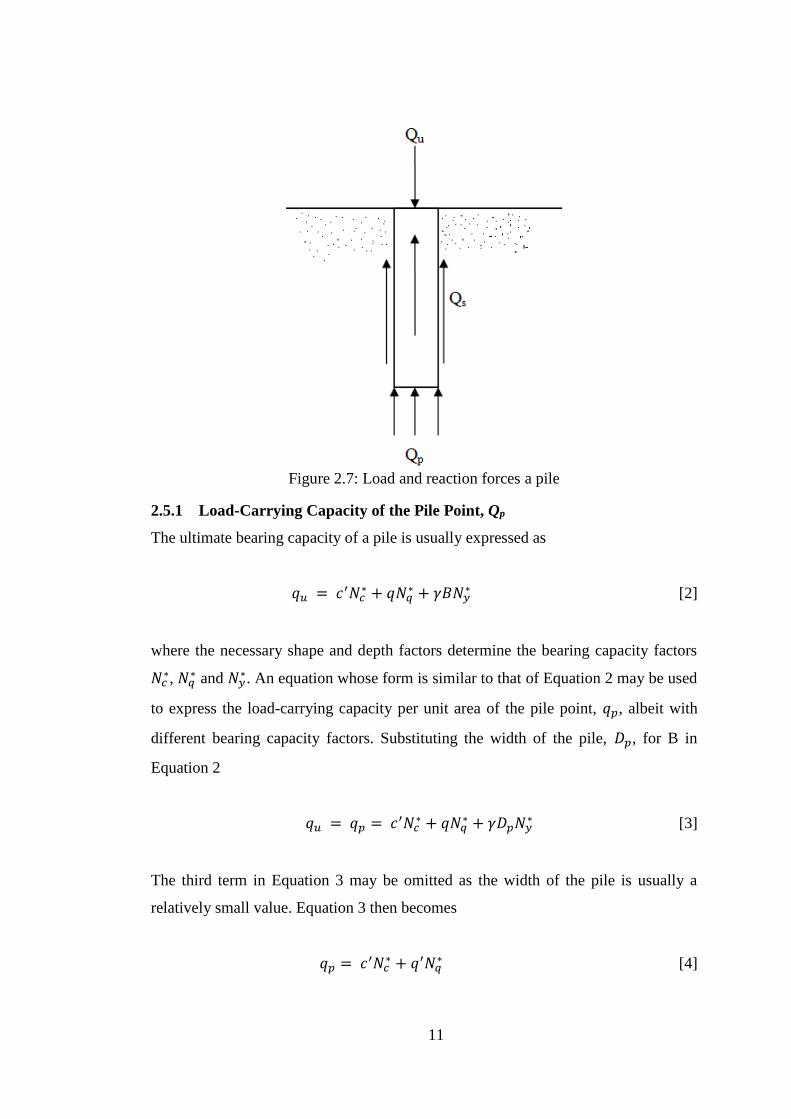
2.5 LOAD BEARING CAPACITY OF PILES
Piles are structural members used in deep foundations and are usually made of steel,
concrete and timber. The ultimate load-bearing capacity of a pile, 𝑄𝑢, is defined as
the summation of the load-carrying capacity of the pile point, 𝑄𝑝, and the shaft
frictional resistance, 𝑄𝑠 (Das, 2012).
𝑄𝑢 = 𝑄𝑝 + 𝑄𝑠 [1]
11
Figure 2.7: Load and reaction forces a pile
2.5.1 Load-Carrying Capacity of the Pile Point, Qp
The ultimate bearing capacity of a pile is usually expressed as
𝑞𝑢 = 𝑐′𝑁𝑐∗ + 𝑞𝑁𝑞
∗ + 𝛾𝐵𝑁𝑦∗ [2]
where the necessary shape and depth factors determine the bearing capacity factors
𝑁𝑐∗, 𝑁𝑞
∗ and 𝑁𝑦∗. An equation whose form is similar to that of Equation 2 may be used
to express the load-carrying capacity per unit area of the pile point, 𝑞𝑝, albeit with
different bearing capacity factors. Substituting the width of the pile, 𝐷𝑝, for B in
Equation 2
𝑞𝑢 = 𝑞𝑝 = 𝑐′𝑁𝑐∗ + 𝑞𝑁𝑞
∗ + 𝛾𝐷𝑝𝑁𝑦∗ [3]
The third term in Equation 3 may be omitted as the width of the pile is usually a
relatively small value. Equation 3 then becomes
𝑞𝑝 = 𝑐′𝑁𝑐∗ + 𝑞′𝑁𝑞
∗ [4]
12
The term 𝑞 has been replaced by 𝑞′ to represent effective vertical stress. Therefore,
the load-carrying capacity of the pile point is the product of the surface area of the
pile tip, 𝐴𝑝, and the vertical stress applied onto the pile, 𝑞𝑝. Multiplying Equation 4
with 𝐴𝑝,
𝑄𝑝 = 𝐴𝑝𝑞𝑝 = 𝐴𝑝(𝑐′𝑁𝑐∗ + 𝑞′𝑁𝑞
∗) [5]
According to Meyerhof’s method, the load-carrying capacity of a pile point in
saturated clays in undrained conditions, where 𝑐𝑢= undrained cohesion of the soil
below the pile tip, can be calculated as
𝑄𝑝 = 𝑁𝑐∗𝑐𝑢𝐴𝑝 = 9𝑐𝑢𝐴𝑝 [6]
2.5.2 Frictional Resistance, Qs
According to Das (2012), frictional skin resistance of a pile can be expressed as
𝑄𝑠 = ∑ 𝑝∆𝐿𝑓 [7]
where 𝑝 = perimeter of the pile section
∆𝐿 = incremental pile length over which 𝑝 and 𝑓 are taken constant
𝑓 = unit friction resistance at any depth 𝑧
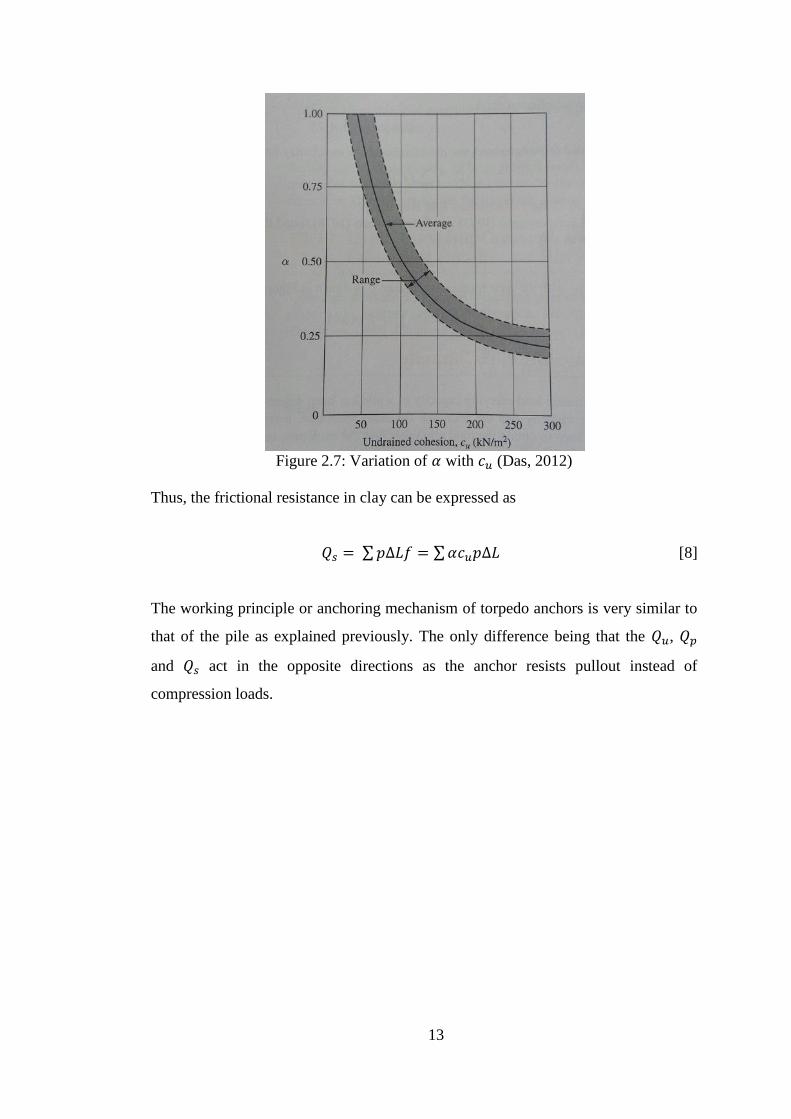
The 𝛼 method states that the unit skin resistance in clayey soils can be represented by
the equation
𝑓 = 𝛼𝑐𝑢 [7]
where 𝛼 is the empirical adhesion factor approximated from its relation with the
undrained cohesion, 𝑐𝑢, as shown in Figure 2.8.
13
Figure 2.7: Variation of 𝛼 with 𝑐𝑢 (Das, 2012)
Thus, the frictional resistance in clay can be expressed as
𝑄𝑠 = ∑ 𝑝∆𝐿𝑓 = ∑ 𝛼𝑐𝑢𝑝∆𝐿 [8]
The working principle or anchoring mechanism of torpedo anchors is very similar to
that of the pile as explained previously. The only difference being that the 𝑄𝑢, 𝑄𝑝
and 𝑄𝑠 act in the opposite directions as the anchor resists pullout instead of
compression loads.

14
CHAPTER 3
METHODOLOGY
3.1 PROJECT WORK & FLOWCHART
Figure 3.1: Flow of project tasks
START
Review of Relevant
Literature & Previous
Works
Formulation of Methodology
Analytical Calculations
𝑄𝑣 = 𝑄𝑓 + 𝑄𝑡𝑖𝑝 + 𝑊′
Model Generation & Simulation
of Parametric Study
Result
Analysis
Formulation of Correlation
END
Modification
15
The project consists of two major parts: the analytical calculations and the finite
element (FE) simulation of the torpedo anchor holding capacity. Each part will be
explained in further detail in subsequent sub-topics.
3.2 ANALYTICAL CALCULATIONS
Analytical calculations will first be carried out to determine the theoretical vertical
holding capacity of torpedo anchors of different lengths. Results from these
calculations will then be used to compare to the results obtained from the finite
element model.
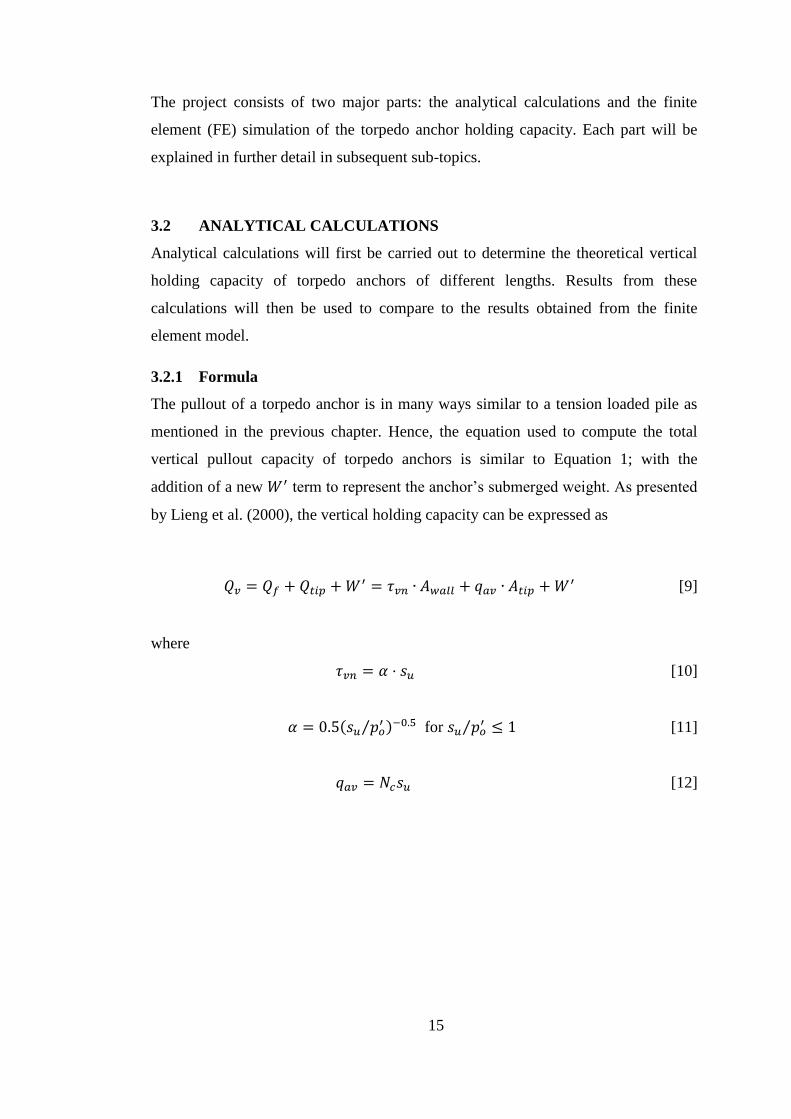
3.2.1 Formula
The pullout of a torpedo anchor is in many ways similar to a tension loaded pile as
mentioned in the previous chapter. Hence, the equation used to compute the total
vertical pullout capacity of torpedo anchors is similar to Equation 1; with the
addition of a new 𝑊′ term to represent the anchor’s submerged weight. As presented
by Lieng et al. (2000), the vertical holding capacity can be expressed as
𝑄𝑣 = 𝑄𝑓 + 𝑄𝑡𝑖𝑝 + 𝑊′ = 𝜏𝑣𝑛 ∙ 𝐴𝑤𝑎𝑙𝑙 + 𝑞𝑎𝑣 ∙ 𝐴𝑡𝑖𝑝 + 𝑊′ [9]
where
𝜏𝑣𝑛 = 𝛼 ⋅ 𝑠𝑢 [10]
𝛼 = 0.5(𝑠𝑢 𝑝𝑜′⁄ )−0.5 for 𝑠𝑢 𝑝𝑜
′⁄ ≤ 1 [11]
𝑞𝑎𝑣 = 𝑁𝑐𝑠𝑢 [12]
16
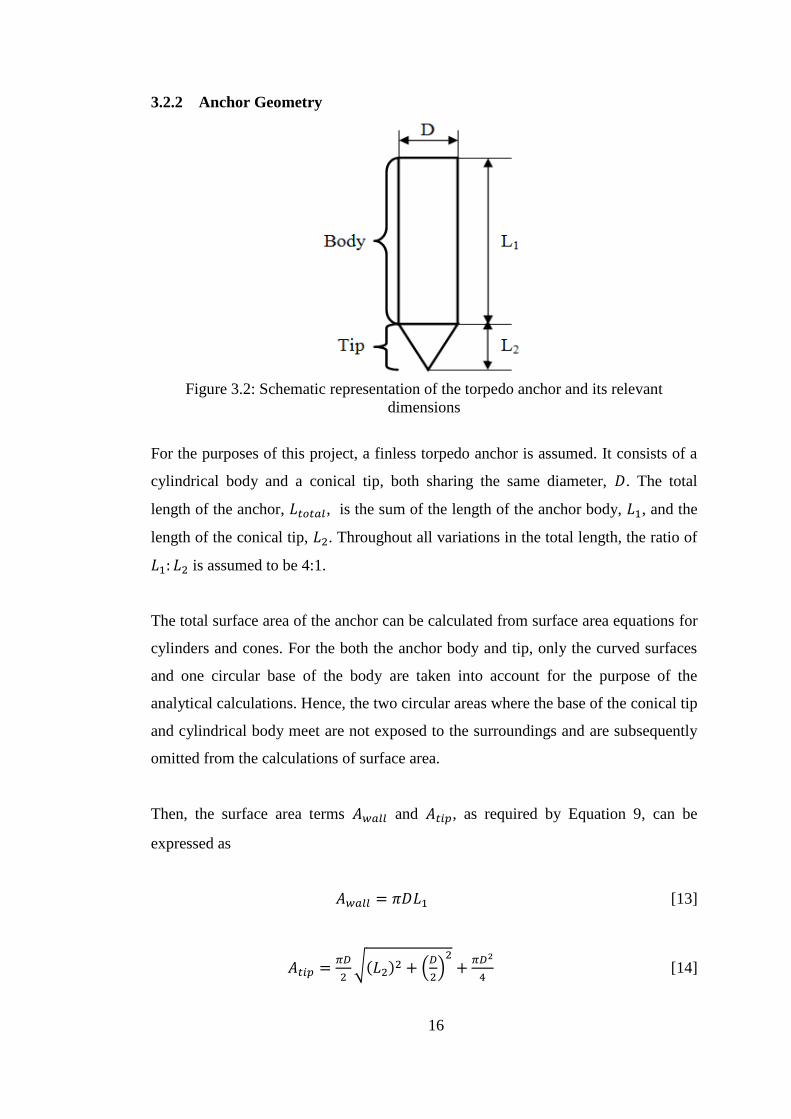
3.2.2 Anchor Geometry
Figure 3.2: Schematic representation of the torpedo anchor and its relevant
dimensions
For the purposes of this project, a finless torpedo anchor is assumed. It consists of a
cylindrical body and a conical tip, both sharing the same diameter, 𝐷. The total
length of the anchor, 𝐿𝑡𝑜𝑡𝑎𝑙, is the sum of the length of the anchor body, 𝐿1, and the
length of the conical tip, 𝐿2. Throughout all variations in the total length, the ratio of
𝐿1: 𝐿2 is assumed to be 4:1.
The total surface area of the anchor can be calculated from surface area equations for
cylinders and cones. For the both the anchor body and tip, only the curved surfaces
and one circular base of the body are taken into account for the purpose of the
analytical calculations. Hence, the two circular areas where the base of the conical tip
and cylindrical body meet are not exposed to the surroundings and are subsequently
omitted from the calculations of surface area.
Then, the surface area terms 𝐴𝑤𝑎𝑙𝑙 and 𝐴𝑡𝑖𝑝, as required by Equation 9, can be
expressed as
𝐴𝑤𝑎𝑙𝑙 = 𝜋𝐷𝐿1 [13]
𝐴𝑡𝑖𝑝 =𝜋𝐷
2√(𝐿2)2 + (
𝐷
2)
2
+𝜋𝐷2
4 [14]
17
3.2.3 Parameters
To conduct the analytical calculations, a certain number of parameters must first be
defined. They are the anchor parameters and soil parameters, both of which can be
seen in the table below.
Parameter Value
Anchor
Lengths 10 m, 13 m, 15 m, 17 m, 20 m
Diameter 1.0 m
Mass 100 tons
Soil
Undrained shear strength, su 18 kPa
Saturated specific weight, γsat 19 kN/m3
Bearing capacity factor, Nc 21.75
Table 3.1: Relevant parameters used in analytical calculation of torpedo anchor
holding capacity
It is important to note that all anchor parameters were arbitrarily assigned after
review of torpedo anchor field test data while the soil parameters were calculated
from the average values of the respective parameters as given by geotechnical
engineering agencies on their company websites. The soil values recorded were for
very soft to medium soft clays, depending on availability of data required.
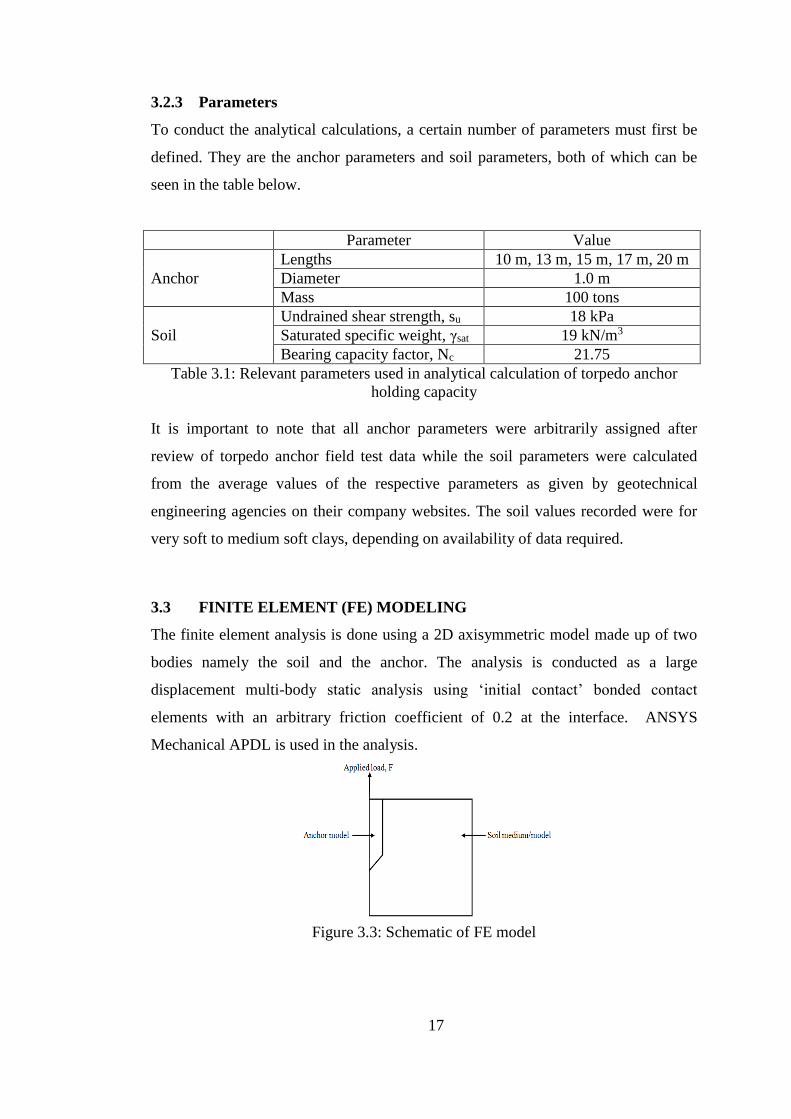
3.3 FINITE ELEMENT (FE) MODELING
The finite element analysis is done using a 2D axisymmetric model made up of two
bodies namely the soil and the anchor. The analysis is conducted as a large
displacement multi-body static analysis using ‘initial contact’ bonded contact
elements with an arbitrary friction coefficient of 0.2 at the interface. ANSYS
Mechanical APDL is used in the analysis.
Figure 3.3: Schematic of FE model
18
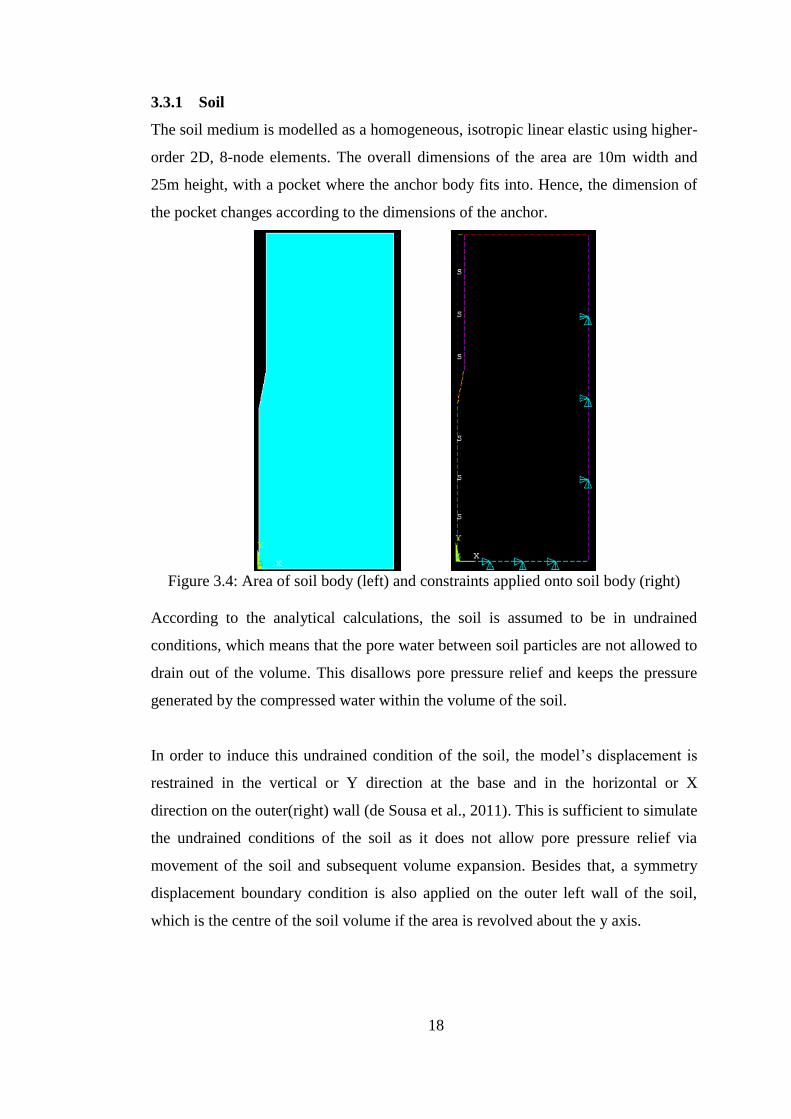
3.3.1 Soil
The soil medium is modelled as a homogeneous, isotropic linear elastic using higher-
order 2D, 8-node elements. The overall dimensions of the area are 10m width and
25m height, with a pocket where the anchor body fits into. Hence, the dimension of
the pocket changes according to the dimensions of the anchor.
Figure 3.4: Area of soil body (left) and constraints applied onto soil body (right)
According to the analytical calculations, the soil is assumed to be in undrained
conditions, which means that the pore water between soil particles are not allowed to
drain out of the volume. This disallows pore pressure relief and keeps the pressure
generated by the compressed water within the volume of the soil.
In order to induce this undrained condition of the soil, the model’s displacement is
restrained in the vertical or Y direction at the base and in the horizontal or X
direction on the outer(right) wall (de Sousa et al., 2011). This is sufficient to simulate
the undrained conditions of the soil as it does not allow pore pressure relief via
movement of the soil and subsequent volume expansion. Besides that, a symmetry
displacement boundary condition is also applied on the outer left wall of the soil,
which is the centre of the soil volume if the area is revolved about the y axis.
19
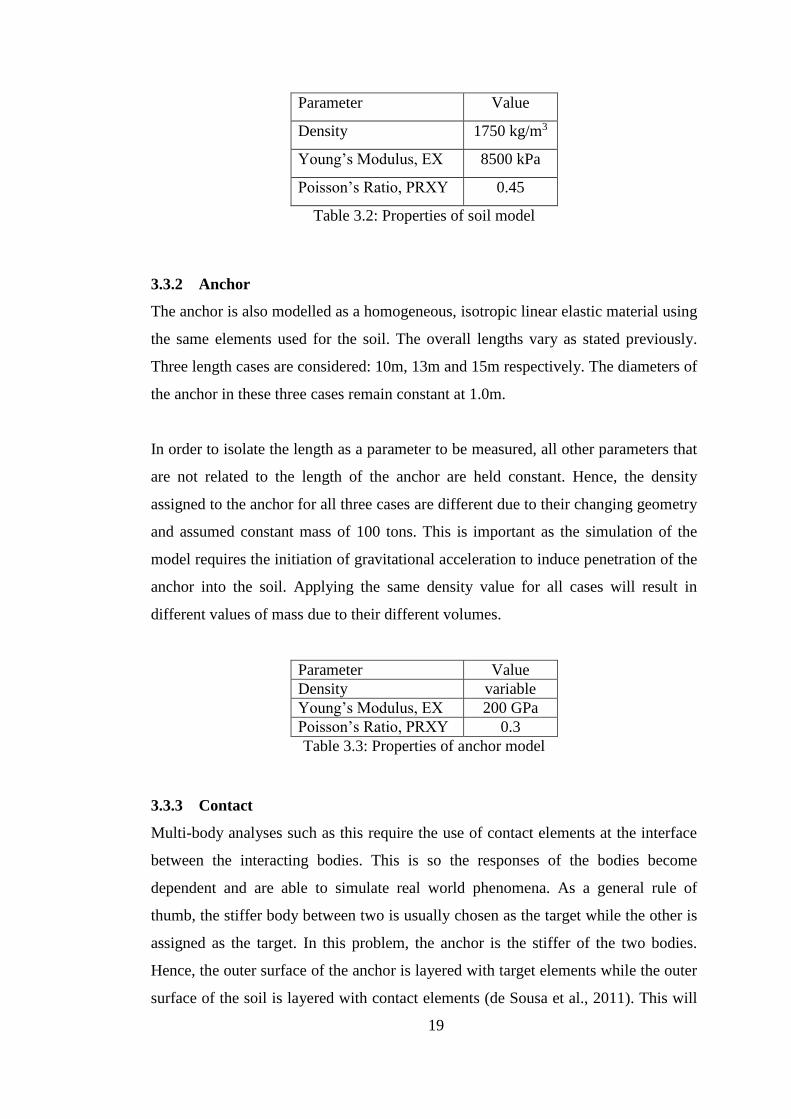
Parameter Value
Density 1750 kg/m3
Young’s Modulus, EX 8500 kPa
Poisson’s Ratio, PRXY 0.45
Table 3.2: Properties of soil model
3.3.2 Anchor
The anchor is also modelled as a homogeneous, isotropic linear elastic material using
the same elements used for the soil. The overall lengths vary as stated previously.
Three length cases are considered: 10m, 13m and 15m respectively. The diameters of
the anchor in these three cases remain constant at 1.0m.
In order to isolate the length as a parameter to be measured, all other parameters that
are not related to the length of the anchor are held constant. Hence, the density
assigned to the anchor for all three cases are different due to their changing geometry
and assumed constant mass of 100 tons. This is important as the simulation of the
model requires the initiation of gravitational acceleration to induce penetration of the
anchor into the soil. Applying the same density value for all cases will result in
different values of mass due to their different volumes.
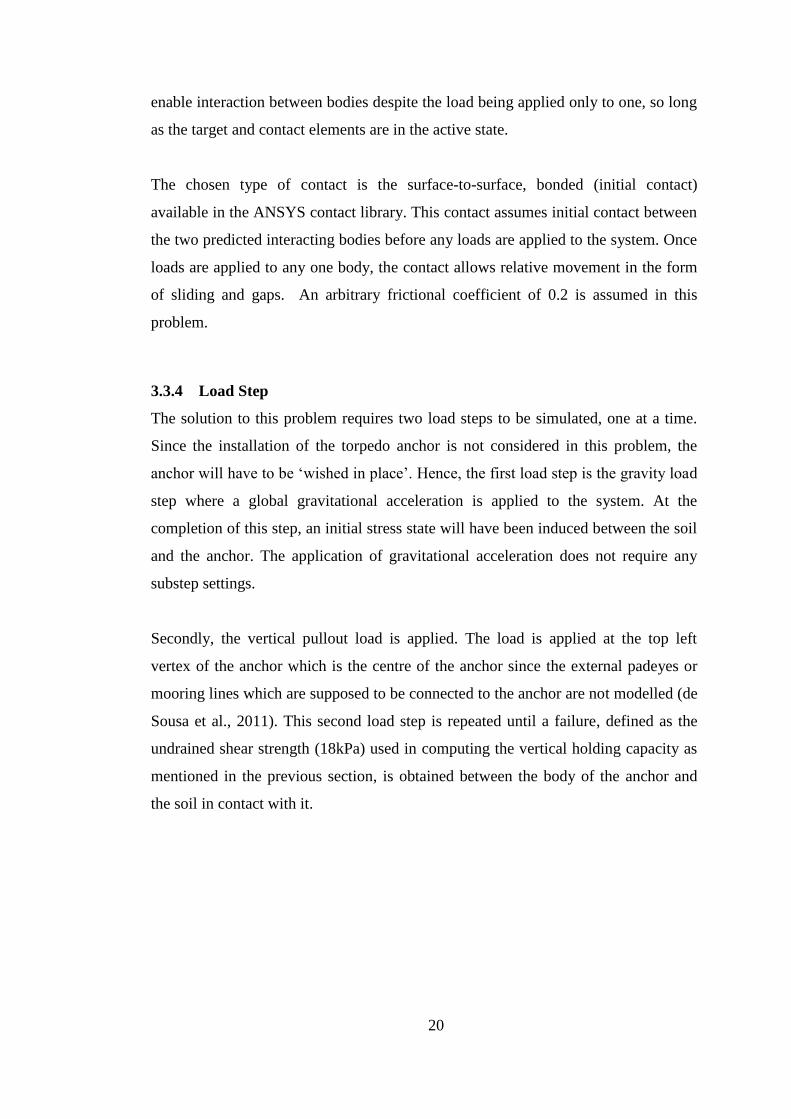
Parameter Value
Density variable
Young’s Modulus, EX 200 GPa
Poisson’s Ratio, PRXY 0.3
Table 3.3: Properties of anchor model
3.3.3 Contact
Multi-body analyses such as this require the use of contact elements at the interface
between the interacting bodies. This is so the responses of the bodies become
dependent and are able to simulate real world phenomena. As a general rule of
thumb, the stiffer body between two is usually chosen as the target while the other is
assigned as the target. In this problem, the anchor is the stiffer of the two bodies.
Hence, the outer surface of the anchor is layered with target elements while the outer
surface of the soil is layered with contact elements (de Sousa et al., 2011). This will
20
enable interaction between bodies despite the load being applied only to one, so long
as the target and contact elements are in the active state.
The chosen type of contact is the surface-to-surface, bonded (initial contact)
available in the ANSYS contact library. This contact assumes initial contact between
the two predicted interacting bodies before any loads are applied to the system. Once
loads are applied to any one body, the contact allows relative movement in the form
of sliding and gaps. An arbitrary frictional coefficient of 0.2 is assumed in this
problem.
3.3.4 Load Step
The solution to this problem requires two load steps to be simulated, one at a time.
Since the installation of the torpedo anchor is not considered in this problem, the
anchor will have to be ‘wished in place’. Hence, the first load step is the gravity load
step where a global gravitational acceleration is applied to the system. At the
completion of this step, an initial stress state will have been induced between the soil
and the anchor. The application of gravitational acceleration does not require any
substep settings.
Secondly, the vertical pullout load is applied. The load is applied at the top left
vertex of the anchor which is the centre of the anchor since the external padeyes or
mooring lines which are supposed to be connected to the anchor are not modelled (de
Sousa et al., 2011). This second load step is repeated until a failure, defined as the
undrained shear strength (18kPa) used in computing the vertical holding capacity as
mentioned in the previous section, is obtained between the body of the anchor and
the soil in contact with it.
21
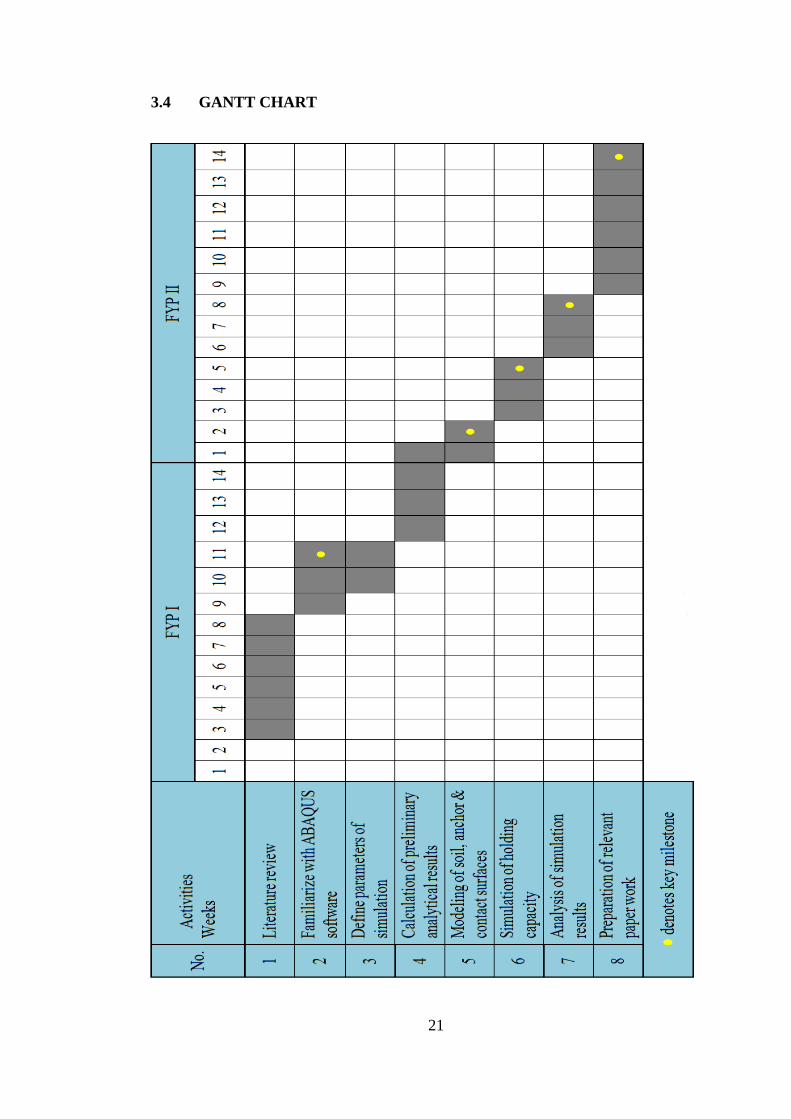
3.4 GANTT CHART
22
CHAPTER 4
RESULTS AND DISCUSSION
4.1 ANALYTICAL CALCULATIONS
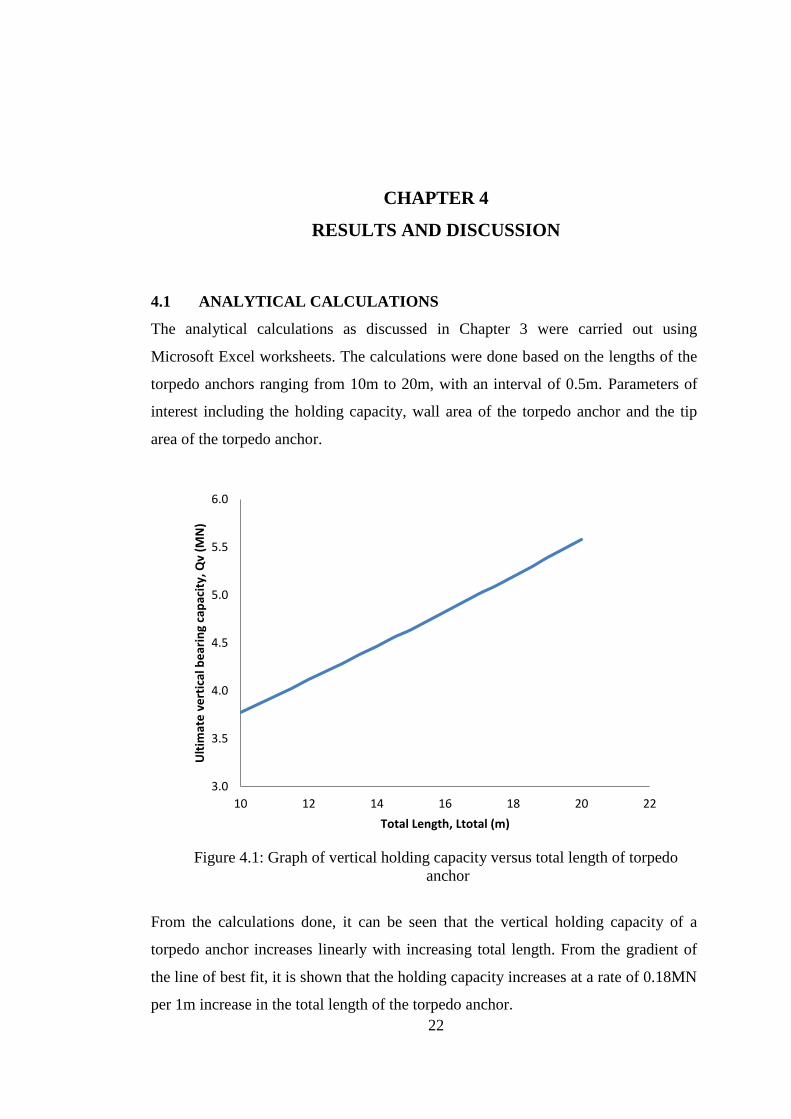
The analytical calculations as discussed in Chapter 3 were carried out using
Microsoft Excel worksheets. The calculations were done based on the lengths of the
torpedo anchors ranging from 10m to 20m, with an interval of 0.5m. Parameters of
interest including the holding capacity, wall area of the torpedo anchor and the tip
area of the torpedo anchor.
Figure 4.1: Graph of vertical holding capacity versus total length of torpedo
anchor
From the calculations done, it can be seen that the vertical holding capacity of a
torpedo anchor increases linearly with increasing total length. From the gradient of
the line of best fit, it is shown that the holding capacity increases at a rate of 0.18MN
per 1m increase in the total length of the torpedo anchor.
3.0
3.5
4.0
4.5
5.0
5.5
6.0
10 12 14 16 18 20 22
Ult
imat
e v
ert
ical
be
arin
g ca
pac
ity,
Qv
(MN
)
Total Length, Ltotal (m)
23
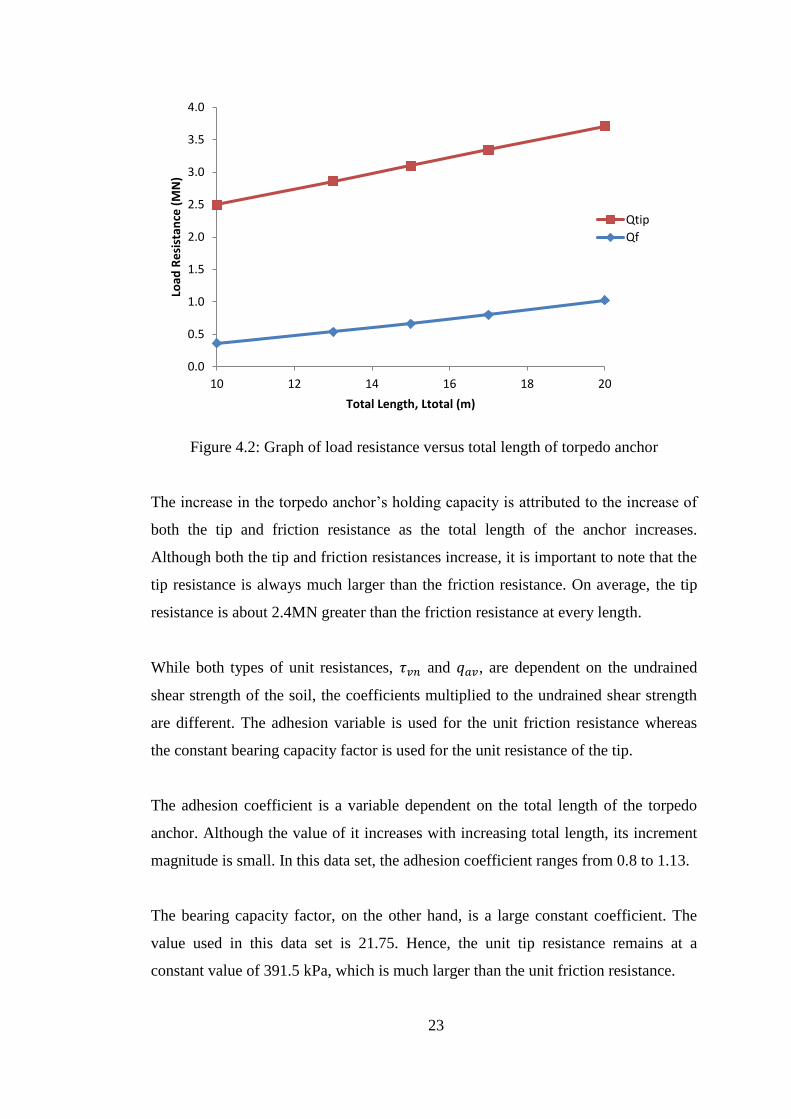
Figure 4.2: Graph of load resistance versus total length of torpedo anchor
The increase in the torpedo anchor’s holding capacity is attributed to the increase of
both the tip and friction resistance as the total length of the anchor increases.
Although both the tip and friction resistances increase, it is important to note that the
tip resistance is always much larger than the friction resistance. On average, the tip
resistance is about 2.4MN greater than the friction resistance at every length.
While both types of unit resistances, 𝜏𝑣𝑛 and 𝑞𝑎𝑣, are dependent on the undrained
shear strength of the soil, the coefficients multiplied to the undrained shear strength
are different. The adhesion variable is used for the unit friction resistance whereas
the constant bearing capacity factor is used for the unit resistance of the tip.
The adhesion coefficient is a variable dependent on the total length of the torpedo
anchor. Although the value of it increases with increasing total length, its increment
magnitude is small. In this data set, the adhesion coefficient ranges from 0.8 to 1.13.
The bearing capacity factor, on the other hand, is a large constant coefficient. The
value used in this data set is 21.75. Hence, the unit tip resistance remains at a
constant value of 391.5 kPa, which is much larger than the unit friction resistance.
0.0
0.5
1.0
1.5
2.0
2.5
3.0
3.5
4.0
10 12 14 16 18 20
Load
Re
sist
ance
(M
N)
Total Length, Ltotal (m)
Qtip
Qf
24
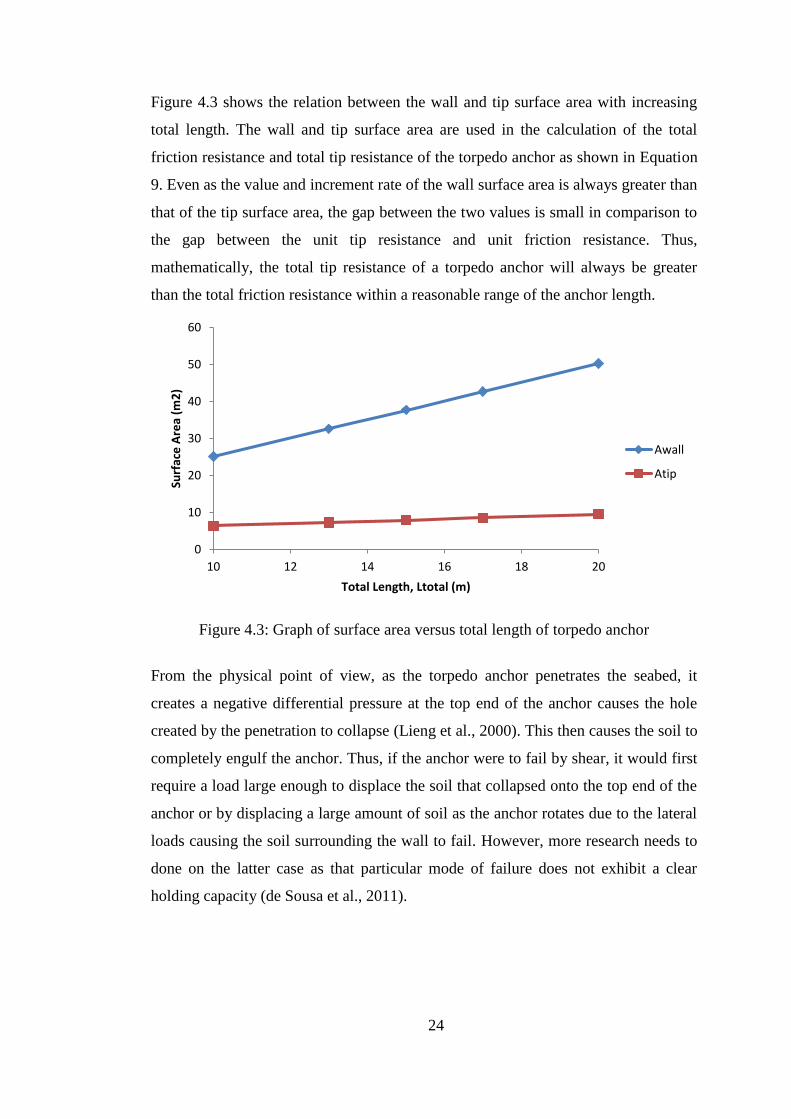
Figure 4.3 shows the relation between the wall and tip surface area with increasing
total length. The wall and tip surface area are used in the calculation of the total
friction resistance and total tip resistance of the torpedo anchor as shown in Equation
9. Even as the value and increment rate of the wall surface area is always greater than
that of the tip surface area, the gap between the two values is small in comparison to
the gap between the unit tip resistance and unit friction resistance. Thus,
mathematically, the total tip resistance of a torpedo anchor will always be greater
than the total friction resistance within a reasonable range of the anchor length.
Figure 4.3: Graph of surface area versus total length of torpedo anchor
From the physical point of view, as the torpedo anchor penetrates the seabed, it
creates a negative differential pressure at the top end of the anchor causes the hole
created by the penetration to collapse (Lieng et al., 2000). This then causes the soil to
completely engulf the anchor. Thus, if the anchor were to fail by shear, it would first
require a load large enough to displace the soil that collapsed onto the top end of the
anchor or by displacing a large amount of soil as the anchor rotates due to the lateral
loads causing the soil surrounding the wall to fail. However, more research needs to
done on the latter case as that particular mode of failure does not exhibit a clear
holding capacity (de Sousa et al., 2011).
0
10
20
30
40
50
60
10 12 14 16 18 20
Surf
ace
Are
a (m
2)
Total Length, Ltotal (m)
Awall
Atip
25
4.2 FINITE ELEMENT (FE) MODELING
Due to the time constraint and unexpected technical issues with the software,
simulations were only completed for the cases of 10 m, 13 m and 15 m total length of
the torpedo anchor.
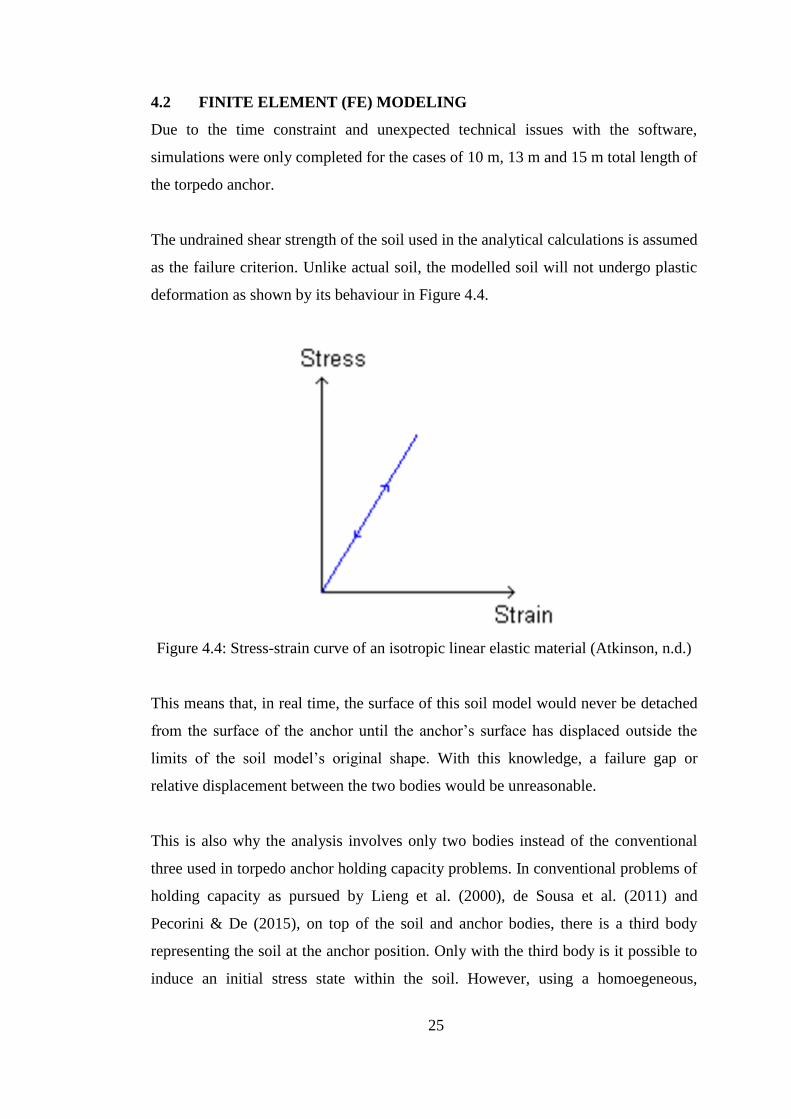
The undrained shear strength of the soil used in the analytical calculations is assumed
as the failure criterion. Unlike actual soil, the modelled soil will not undergo plastic
deformation as shown by its behaviour in Figure 4.4.
Figure 4.4: Stress-strain curve of an isotropic linear elastic material (Atkinson, n.d.)
This means that, in real time, the surface of this soil model would never be detached
from the surface of the anchor until the anchor’s surface has displaced outside the
limits of the soil model’s original shape. With this knowledge, a failure gap or
relative displacement between the two bodies would be unreasonable.
This is also why the analysis involves only two bodies instead of the conventional
three used in torpedo anchor holding capacity problems. In conventional problems of
holding capacity as pursued by Lieng et al. (2000), de Sousa et al. (2011) and
Pecorini & De (2015), on top of the soil and anchor bodies, there is a third body
representing the soil at the anchor position. Only with the third body is it possible to
induce an initial stress state within the soil. However, using a homoegeneous,
26
isotropic linear elastic material, it is unnecessary as the soil model will not undergo
plastic deformation.
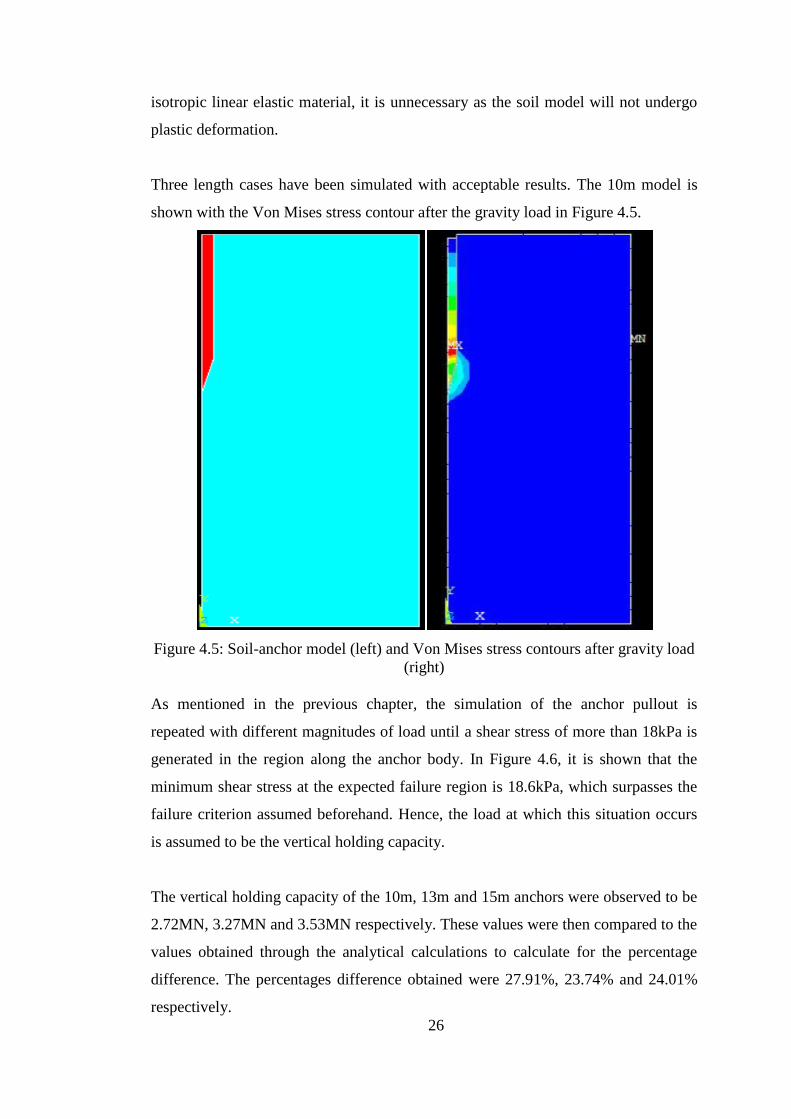
Three length cases have been simulated with acceptable results. The 10m model is
shown with the Von Mises stress contour after the gravity load in Figure 4.5.
Figure 4.5: Soil-anchor model (left) and Von Mises stress contours after gravity load
(right)
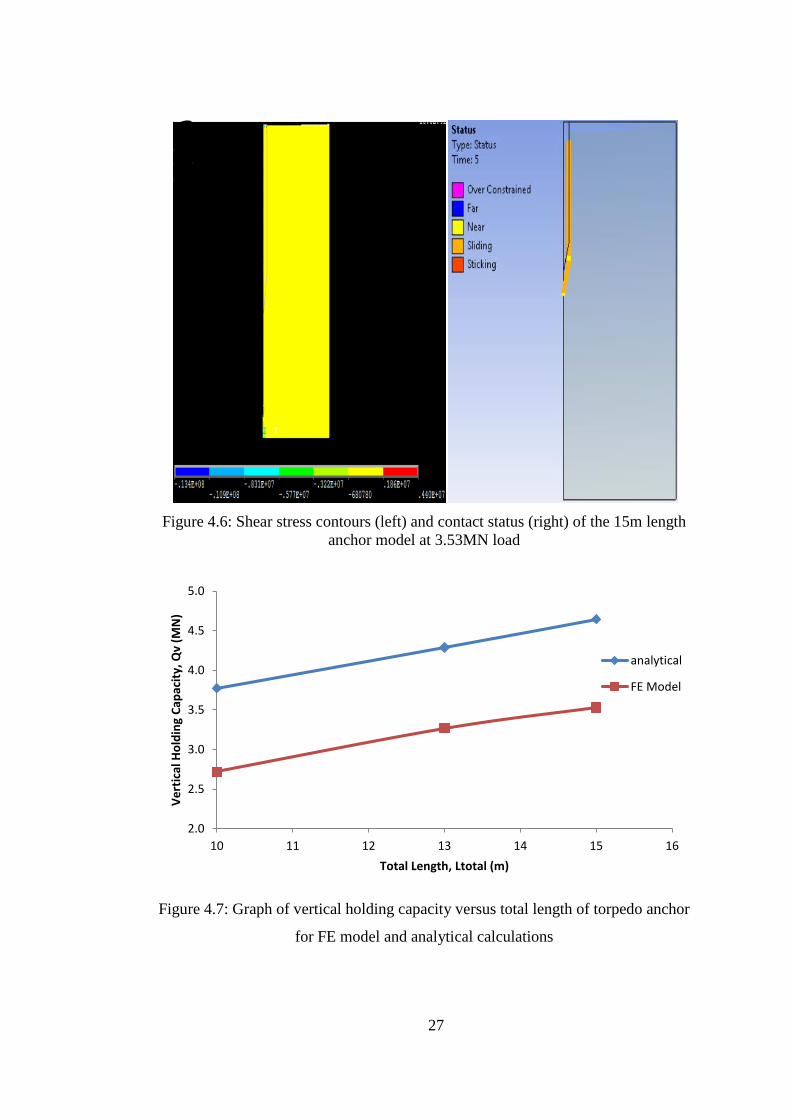
As mentioned in the previous chapter, the simulation of the anchor pullout is
repeated with different magnitudes of load until a shear stress of more than 18kPa is
generated in the region along the anchor body. In Figure 4.6, it is shown that the
minimum shear stress at the expected failure region is 18.6kPa, which surpasses the
failure criterion assumed beforehand. Hence, the load at which this situation occurs
is assumed to be the vertical holding capacity.
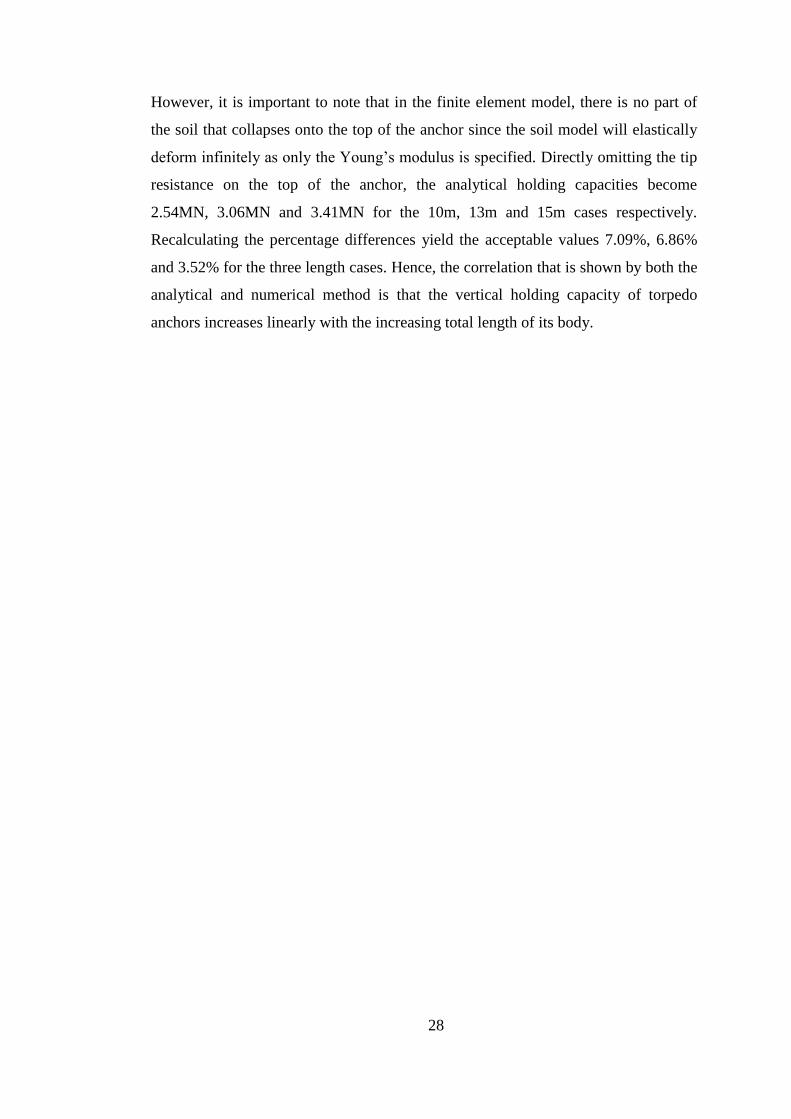
The vertical holding capacity of the 10m, 13m and 15m anchors were observed to be
2.72MN, 3.27MN and 3.53MN respectively. These values were then compared to the
values obtained through the analytical calculations to calculate for the percentage
difference. The percentages difference obtained were 27.91%, 23.74% and 24.01%
respectively.
27
Figure 4.6: Shear stress contours (left) and contact status (right) of the 15m length
anchor model at 3.53MN load
Figure 4.7: Graph of vertical holding capacity versus total length of torpedo anchor
for FE model and analytical calculations
2.0
2.5
3.0
3.5
4.0
4.5
5.0
10 11 12 13 14 15 16
Ve
rtic
al H
old
ing
Cap
acit
y, Q
v (M
N)
Total Length, Ltotal (m)
analytical
FE Model
28
However, it is important to note that in the finite element model, there is no part of
the soil that collapses onto the top of the anchor since the soil model will elastically
deform infinitely as only the Young’s modulus is specified. Directly omitting the tip
resistance on the top of the anchor, the analytical holding capacities become
2.54MN, 3.06MN and 3.41MN for the 10m, 13m and 15m cases respectively.
Recalculating the percentage differences yield the acceptable values 7.09%, 6.86%
and 3.52% for the three length cases. Hence, the correlation that is shown by both the
analytical and numerical method is that the vertical holding capacity of torpedo
anchors increases linearly with the increasing total length of its body.
29
CHAPTER 5
CONCLUSION AND RECOMMENDATION
Analytical and numerical studies have been conducted to study effect of a torpedo
anchor’s total length on its undrained vertical holding capacity. The analytical
method involves the computation of the anchor’s vertical holding capacity at
different total length cases. The vertical holding capacity of the anchor is found to
increase linearly with increasing total lengths. Besides that, it is also concluded that
at any reasonable total length, the load resistance of the anchor tip is always larger
than that of the load resistance due to friction on the anchor body. Thus, the vertical
holding capacity is the maximum holding capacity of a torpedo anchor.
The numerical study was conducted using a two-dimensional axisymmetric finite
element model. Both the soil and anchor were simulated as homogeneous, isotropic
linearly elastic materials using plane elements capable of demonstrating non-linearity
and large displacement behaviour, where the anchor is significantly stiffer than the
soil. Moreover, the interaction between the anchor and soil was represented using
contact elements that allow relative sliding and detachment between the two surfaces
in contact. The pattern of results obtained from both the numerical model and the
analytical calculations agreed upon the premise that the vertical holding capacity of a
torpedo anchor increases as the total length of the anchor increases.
It is recommended that persons with intentions to be involved in this particular
research topic should attempt to simulate the dynamic conditions and responses of
the torpedo anchor via numerical modelling of the anchor’s installation before
applying the pullout load or through scaled laboratory models. Future works on
numerical modelling should also look to apply a material model with properties in
closer resemblance to that of soil to achieve more accurate results and correlations.
Future researchers may also look into softwares such as PLAXIS or ABAQUS which
may provide better functions for solving geotechnical problems such as this one.
30
REFERENCES
Adrezin, R., Bar-Avi, P., & Benaroya, H. (1996). Dynamic response of compliant
offshore structures-review. Journal of Aerospace Engineering,9(4), 114-131.
Andersen, K. H., Murff, J. D., Randolph, M. F., Clukey, E. C., Erbrich, C. T., Jostad,
H. P., ... & Supachawarote, C. (2005, September). Suction anchors for deepwater
applications. In Proceedings of the 1st International Symposium on Frontiers in
Offshore Geotechnics, ISFOG, Perth (pp. 3-30).
Atkinson, J. (n.d.). Stiffness. Retrieved from Universiti of West England website:
http://environment.uwe.ac.uk/geocal/SoilMech/basic/stiffness.htm
Colligan, J. (1999). The economics of deep water.
Das, B. (2012). Fundamentals of geotechnical engineering. Cengage Learning.
de Sousa, J. R. M., de Aguiar, C. S., Ellwanger, G. B., Porto, E. C., Foppa, D., & de
Medeiros, C. J. (2011). Undrained load capacity of torpedo anchors embedded in
cohesive soils. Journal of Offshore Mechanics and Arctic Engineering, 133(2),
021102.
Ehlers, C. J., Young, A. G., & Chen, J. H. (2004). Technology assessment of
deepwater anchors. In Offshore technology conference. Offshore Technology
Conference.
Eltaher, A., Rajapaksa, Y., & Chang, K. T. (2003). Industry trends for design of
anchoring systems for deepwater offshore structures. InOffshore Technology
Conference. Offshore Technology Conference.
Hasanloo, D., & Yu, G. (2011). A Study on the Falling Velocity of Torpedo Anchors
during Acceleration. In The Twenty-first International Offshore and Polar
Engineering Conference. International Society of Offshore and Polar Engineers.
31
Hossain, M. S., Kim, Y., & Gaudin, C. (2014). Experimental investigation of
installation and pullout of dynamically penetrating anchors in clay and
silt.Journal of Geotechnical and Geoenvironmental Engineering, 140(7),
04014026.
Huang, K., & Lee, M. Y. (1998, January). Experiences in classification of deepwater
mooring systems for floating installations. In Offshore Technology Conference.
Offshore Technology Conference.
Lewis, R. E. (1982). An overview of deepwater compliant structures. In Annual
Meeting Papers, Division of Production. American Petroleum Institute.
Lieng, J. T., Hove, F., & Tjelta, T. I. (1999). Deep Penetrating Anchor: Subseabed
deepwater anchor concept for floaters and other installations. In The Ninth
International Offshore and Polar Engineering Conference. International Society
of Offshore and Polar Engineers.
Lieng, J. T., Kavli, A., Hove, F., & Tjelta, T. I. (2000). Deep penetrating anchor:
further development, optimization and capacity verification. In The Tenth
International Offshore and Polar Engineering Conference. International Society
of Offshore and Polar Engineers.
Medeiros Jr, C. J. (2002). Low cost anchor system for flexible risers in deep waters.
In Offshore Technology Conference. Offshore Technology Conference.
Merifield, R. S., & Smith, C. C. (2010). The ultimate uplift capacity of multi-plate
strip anchors in undrained clay. Computers and Geotechnics, 37(4), 504-514.
Murff, J. D., Randolph, M. F., Elkhatib, S., Kolk, H. J., Ruinen, R. M., Strom, P. J.,
& Thorne, C. (2005). Vertically loaded plate anchors for deepwater applications.
In Proc Int Symp on Frontiers in Offshore Geotechnics (pp. 31-48).
32
Pecorini, D., & De, A. (2015). Pull-Out Capacity Analysis of Offshore Torpedo
Anchors Using Finite-Element Analysis. In The Twenty-fifth International
Offshore and Polar Engineering Conference. International Society of Offshore
and Polar Engineers.
Raie, M. S., & Tassoulas, J. L. (2009). Installation of torpedo anchors: numerical
modeling. Journal of geotechnical and geoenvironmental engineering.
Senpere, D., & Auvergne, G. A. (1982). Suction anchor piles-a proven alternative to
driving or drilling. In Offshore Technology Conference. Offshore Technology
Conference.
Sparrevik, P. (2002). Suction pile technology and installation in deep waters.
In Offshore technology conference. Offshore Technology Conference.
Vryhof Anchors, B. V. (2010). Anchor Manual 2010-The Guide to Anchoring.
Wang, M. G., Demars, K. R., & Nacci, V. A. (1978). Applications of suction anchors
in offshore technology. In Offshore Technology Conference. Offshore Technology
Conference.
Weimer, P., Slatt, R. M., & Pettingill, H. S. (2004). Global overview of deepwater
exploration and production. Petroleum Systems of Deepwater Settings. Tulsa.
SEG/EAGE, 21-39.