EFFECT OF SUN RADIATION EXPOSURE ON INDOOR AIR...
36
EFFECT OF SUN RADIATION EXPOSURE ON INDOOR AIR QUALITY OF CAR INTERIOR IN TROPICAL COUNTRY MOHAMAD ASYRAF BIN OTHOMAN A project report submitted in fulfillment of the requirement for the award of the Degree of Master of Mechanical Engineering Faculty of Mechanical and Manufacturing Engineering Universiti Tun Hussein Onn Malaysia JULY 2015
Transcript of EFFECT OF SUN RADIATION EXPOSURE ON INDOOR AIR...
EFFECT OF SUN RADIATION EXPOSURE ON INDOOR AIR QUALITY OF
CAR INTERIOR IN TROPICAL COUNTRY
MOHAMAD ASYRAF BIN OTHOMAN
A project report submitted in fulfillment of the requirement for the award of the
Degree of Master of Mechanical Engineering
Faculty of Mechanical and Manufacturing Engineering
Universiti Tun Hussein Onn Malaysia
JULY 2015

v
ABSTRACT
Number of vehicle in Malaysia increasing rapidly and usually parked at open or un-
shaded parking area due limited of roof parking facilities. Hot car interior after
certain minutes or hours of parking due sun radiation exposure, forced car user to
wait for a period of time to cool down the car interior temperature. Increase of car
interior temperature caused heat stroke to living creature and degradation of material
and finishes. The objective of this research are to determine air quality level in car
interior due sun radiation exposure during a hot and sunny day in tropical country
weather. The studies is focused to assess air quality parameters inside car interior
such as temperature, particle matter (PM10), relative humidity and carbon dioxide.
Parameter data for indoor air quality has been analyzed in five different modes. Each
modes data collection has been repeated for three days to reduce uncertainty. From
experimental results, in sun radiation exposure car interior temperature can exceed
60% from ambient temperature. Sunshade installation and lowered 20 mm all
windows caused reduction of interior temperature between 3% to 7%. Heat
developed inside enclosed vehicle effected scattering of particle matter PM10 in air.
PM10 concentration increased when circulation of air from outside have by windows
gap. Relative humidity decreased when car interior temperature increased. CO2
concentration is high at beginning of test but then gradually decrease to ambient
concentration after certain period

vi
ABSTRAK
Peningkatan jumlah kenderaan di Malaysia naik mendadak dan kebiasaanya
kenderaan ini diletakkan di pakir terbuka disebabkan kurangnya kemudahan pakir
kenderaan berbumbung. Suhu dalaman kereta yang tinggi setelah diletakkan pada
tempoh masa tertentu dibawah sinaran matahari memaksa pengguna kereta
menunggu pada sela masa tertentu sehingga suhu dalaman kereta turun. Sinaran
matahari akan menyebabkan peningkatan suhu dalaman kereta seterusnya
menyebabkan strok haba terhadap manusia dan haiwan yang ditinggalkan didalam
kereta. Bahan yang digunakan untuk kemasan dalaman kereta menghasilkan reaksi
kimia dan membentuk sebatian kimia apabila terdedah dengan suhu panas. Objektif
kajian adalah untuk mengetahui tahap kualiti udara bahagian dalaman kereta di
bawah sinaran penuh cahaya matahari di negara beriklim tropika. Kajian ini fokus
kepada menilai tahap parameter-parameter kualiti udara di bahagian dalaman kereta
seperti suhu, kelembapan, zarah dan gas karbon dioksida. Setiap parameter telah
diukur dalam lima keadaan berbeza dan diulang sebanyak tiga kali untuk
mengelakkan keraguan data. Dari hasil kajian yang telah dijalankan menunjukkan,
pendedahan di bawah sinaran matahari, suhu dalaman kereta boleh melebihi 60%
suhu ambien. Penggunaan pelindung cahaya matahari dan penurunan sebahagian
tingkap hanya menyumbang 3% ke7% penurunan suhu maksimum. Bilangan zarah
meningkat apabila terdapat pengaliran udara dan peningkatan suhu menyebabkan
perawakan zarah yang meningkat. Peratus kelembapan udara menurun apabila suhu
dalaman kereta meningkat. Kandungan gas carbon dioksida pada dalaman kereta
agak tinggi pada permulaan dan menurun kepada nilai kandungan persekitaran.

vii
TABLE OF CONTENTS
TITLE
DECLARATION
DEDICATION
ACKNOWLEDGEMENT
ABSTRACT
CONTENTS
i
ii
iii
iv
v
vii
LIST OF FIGURES
LIST OF TABLES
LIST OF SYMBOLS AND ABBREVIATIONS
LIST OF APPENDIX
ix
xi
xii
xiii
CHAPTER 1 INTRODUCTION
1.1 General background
1.2 Problem statement
1.3 Objective
1.4 Scope
1.5 Significant of study
1
1
2
2
3
3
CHAPTER 2 LITERATURE REVIEW
2.1 Indoor Air Quality
2.2 Temperature Variation
2.3 Relative Humidity
2.4 Carbon dioxide
2.5 Particulate Matter
2.6 Volatile Organic Compound
2.7 Thermal comfort
4
4
5
7
9
11
13
14

viii
CHAPTER 3 METHODOLOGY
3.1 Overall Project Flow
3.2 Available data
3.3 Experiment Mode Preparation
3.4 Data analysis and transfer
3.5 Data Processing and Quality Control
16
16
17
18
22
23
CHAPTER 4 RESULTS AND DISCUSSION
4.1 Temperatures variation measurement
4.2 Particle matter (PM10) concentration
measurement
4.3 Relative humidity levels measurement
4.4 Carbon dioxide concentration measurement
4.5 Comparison result obtained and
recommendation limit
25
25
27
32
35
38
CHAPTER 5 CONCLUSION AND RECOMMENDATIONS
5.1 Conclusion of this study
5.2 Recommendations
40
40
41
REFERENCES 42
APPENDIX 44

ix
LIST OF FIGURES
2.1
2.2
2.3
2.4
2.5
2.6
Solar intensity results of car interior
Ventilation effects to interior temperature
Optimum relative humidity range for
minimizing health risk
Variation of Carbon Dioxide (CO2) in ppm with
time for intermittence test.
Size of particulate matter
Particle types and size
6
6
9
10
11
13
3.1
3.2
3.3
3.4
3.5
3.6
3.7
3.8
3.10
Project methodology flowchart
Testing area for data collection
White Proton Persona, Model 2011
Car Schematic and specification
Aluminium car sunshade
Car sunshade mounted inside vehicle
windscreen
Position of measuring instruments will mounted
inside the car interior
Telaire7001, HOBO data logger and sample of
plotting result
DustTrak II Aerosol Monitors
16
17
18
18
19
21
21
22
23
4.1
4.2
4.3
Temperature of car interior in different modes
Particle concentration of car interior in different
modes
Effect of temperature on particle concentration
in car compartment
26
31
32

x
4.4
4.5
4.6
4.7
Relative humidity of car interior in different
modes
Effect of temperature on relative humidity in car
interior
Carbon dioxide concentration of car interior in
different modes
Effect of temperature on carbon dioxide in car
interior
33
34
36
37

xi
LIST OF TABLES
2.1
2.2
2.3
Recommended indoor air quality standard and
guideline
Estimated vehicle interior air temperature
elapsed time
General guide to TVOC emissions and health
effects.
5
7
14
3.1
3.2
Example of data sheet for each modes
Modes description
20
20
4.1
4.2
4.3
4.4
4.5
4.6
4.7
4.8
4.9
Temperature values in all modes
Summary of maximum, minimum and average
interior temperature values in deferent modes.
Also the percentage reduction car interior
temperature.
Particle matter concentration in all modes.
Summary of maximum, minimum, average and
percentage reduction interior particle
concentration in deferent modes.
Interior relative humidity in all modes.
Summary of maximum, minimum and average
interior relative humidity in various modes
CO2 concentration in all modes.
Summary of maximum, minimum and average
CO2 concentration in various modes
Comparison between result obtained and
recommendation limit
26
26
28
31
33
34
36
36
38
xii
LIST OF SYMBOLS AND ABBREVIATIONS
CO2
IAQ
Max
Min
PM
ppm
RH
VOC
-
-
-
-
-
-
-
-
Carbon dioxide
Indoor air quality
Maximum
Minimum
Particle matter
Part per million
Relative humidity
Volatile organic compound

xiii
LIST OF APPENDIX
A
Gantt Chart for Master Project 1 & 2
44

CHAPTER 1
INTRODUCTION
1.1 Background of study
Vehicle population in Malaysia rapidly increase due strong economy and income
growth and hence most of people afford to buy their own vehicle. Malaysian drivers
typically park the vehicles at open space or un-shaded parking area due lack of roof
parking facilities. The problem that is faced by many car users today is a hot car
interior after certain minutes or hours of parking in open space or un-shaded parking
area. The car user is forced to wait for a period of time to cool down the car interior
temperature either by lowering the window or switch on the air conditioner system at
full that really affect the fuel consumption and other car parts or components due
rapid cooling.
The climate in Malaysia is however, hot and humid. The data obtained by the
Malaysia Meteorological Department (2015) for a ten-year period records relatively
uniform outdoor temperatures with an average of between 23.7°C to 31.3°C
throughout a day with highest maximum recorded temperature as 36.9°C with
average relative humidity of between 67% to 95%.
Temperature, relative humidity, carbon dioxide and total concentration of air
bone particulate matter is a part of indoor air quality components that used to
determine how our air inside our buildings or space is in acceptance level. The rapid
rise of car interior temperature inside static vehicles without nature or auxiliary
ventilation in direct sun radiation exposure will damage property and harm human or
pets left inside.
Excessive heat inside fully closed cabin temperature during hot sunny day will
increase level of air bone chemicals in car interiors. The chemical mixture is consist

2
of volatile organic compounds (VOCs), including formaldehyde; polybrominated
diphenyl ethers (PBDEs), used as flame retardants; and phthalic acid esters
(phthalates), which are emitted from materials and finishes used to make car
interiors, such as plastics, leather, textiles, adhesive and sealants. Some car users
lowering the driver or passenger windows when left the vehicle in un-shaded parking
area to allow natural ventilation to reduce car interior temperature. These option will
allow emission gases, solid particles and liquid droplets suspended in the air traps
inside car interior.
1.2 Problem statement
Without any natural shading or roof in the parking area, the vehicle would be
exposed to the sun radiation during the hot and sunny day at certain period of time.
The sun radiation will strike directly the vehicle body and will also penetrate through
the glass window. The heat from sun radiation will increase car interior temperature
hence will caused heat stroke to human (frequently babies or children's) and pet after
being left in hot vehicles. Material and finishes used to make car interiors will react
to develop chemical substances or emission gases. Solid particles and liquid droplets
suspended in the air will traps inside car interior when lowering the windows.
Exposure to these substances will increase potential to get allergy and asthma
symptoms and cause eye, nose and throat irritation.
1.3 Objective
The objective of this research is to determine indoor air quality level in direct sun
radiation exposure in car interior during a hot and sunny day in tropical country
weather.

3
1.4 Scope
The scopes of studies is focused to assess indoor air quality parameter inside car
interior.
i. The test was carried on sunny day weather.
ii. The condition of testing vehicle is static (parking mode) in open air (un-
shaded) and roof (shaded) parking area.
iii. A white sedan car with approximately 3 m3 volume of size was used and the
vehicle is originally manufactured specification.
iv. The car was located at same orientation and same place during entire
experimental measurement session.
v. Four parameter of indoor air quality has been assessed which are temperature,
carbon dioxide, particle matter (PM10) and percent of relative humidity.
vi. Measuring devices were placed inside car compartment during observation
time from 12.00 hrs to 14.00 hrs to record all parameter data.
vii. Data has been taken in five different modes for shaded and un-shaded
condition.
viii. Each modes data collection has been repeated for three days to reduce
uncertainty.
1.5 Significant of study
The finding of this study will contribute to develop of safety awareness guidelines
about vehicle indoor air quality for car user. Safety awareness guidelines will reduce
the health risk factor. Data from the findings it’s quite useful as reference to design
vehicle active climate and air quality control device.

CHAPTER 2
LITERATURE REVIEW
This chapter describes the principles and characteristics of indoor air quality
standards, air quality variable which are temperature, relative humidity, particle
matter and emission gasses carbon dioxide.
2.1 Indoor Air Quality
According to (ANSI/ASHRAE Standard 62.1-2007) indoor air quality (IAQ) define
as air which are known contaminants at harmful concentrations as and with which a
substantial majority (80% or more) of the people exposed do not express
dissatisfaction. Indoor air quality problems in confined space primarily caused by
internal pollution sources that release gases or particles into the air. Insufficient
ventilation can increase pollutant levels by not bringing in enough fresh air to reduce
emissions from internal sources and by not carrying indoor air pollutants out of the
space. Excessive temperature and humidity levels also will increase level of
pollutants.
Therefore indoor environment in car interior could be viewed as a kind of
residential environment that is equipped with air conditioning system (Yokoyama, et.
al, 2007). Study on the quality of vehicle air indoor has been very limited; e.g. by
Yokoyama, et. al, (2007) and Nakagawa, et. al, (2007). On the other hand, there are a
lot of reports available on study of indoor air quality in buildings; for example in the
work by Sulaiman, et. al, (2013), and Harun, et. al, (2013). Table 2.1 shows
recommended standard and guidelines for indoor air quality for office building from
5
Department of Occupational Safety and Health, Malaysia (2010) and Institute of
Environmental Epidemiology, Singapore (1996).
Table 2.1: Recommended indoor air quality standard and guideline (Source:
1Department of Occupational Safety and Health, 2010 and 2 Institute of
Environmental Epidemiology, 1996)
Indoor air quality parameter Malaysia1
(Maximum limit)
Singapore2
(Maximum
Limit)
Carbon dioxide, (ppm) 1000 1000
Carbon monoxide, (ppm) 10 9
Respirable particulates (PM10),
(mg/m3) 0.15 0.15
Air Temperature, oC 23 - 26 22.5 – 25.5
Relative Humidity, % 40-70 70
2.2 Temperature Variation
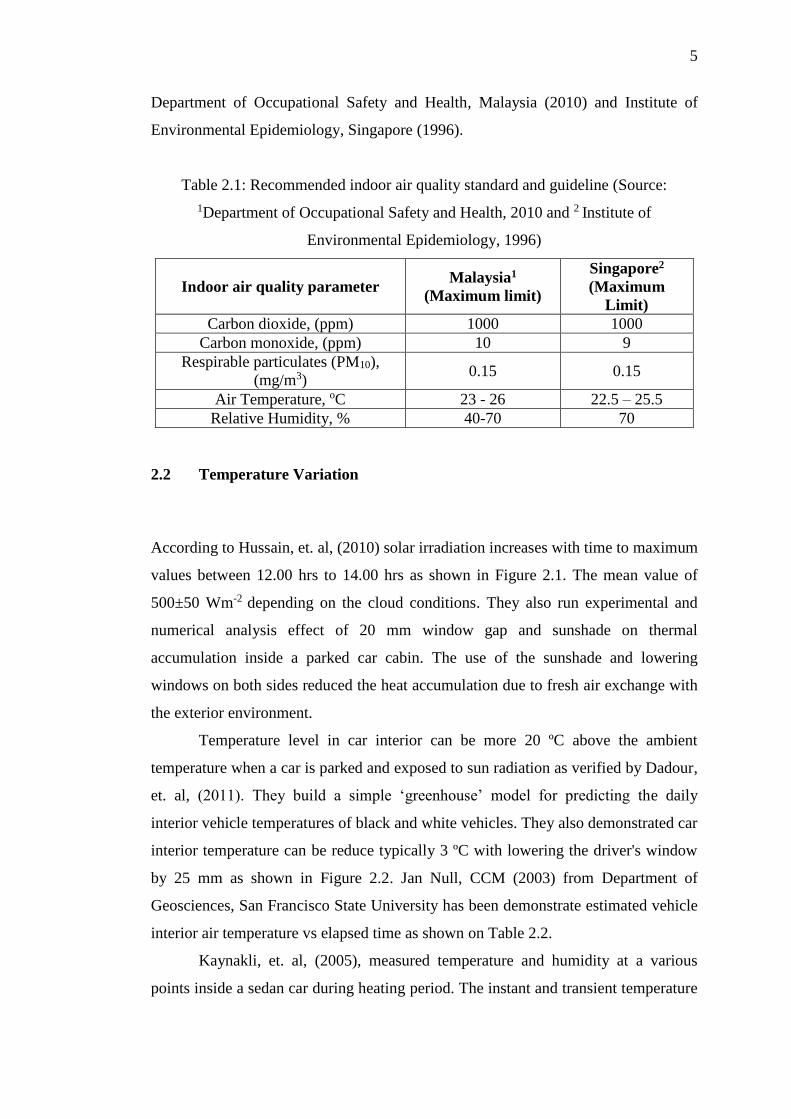
According to Hussain, et. al, (2010) solar irradiation increases with time to maximum
values between 12.00 hrs to 14.00 hrs as shown in Figure 2.1. The mean value of
500±50 Wm-2 depending on the cloud conditions. They also run experimental and
numerical analysis effect of 20 mm window gap and sunshade on thermal
accumulation inside a parked car cabin. The use of the sunshade and lowering
windows on both sides reduced the heat accumulation due to fresh air exchange with
the exterior environment.
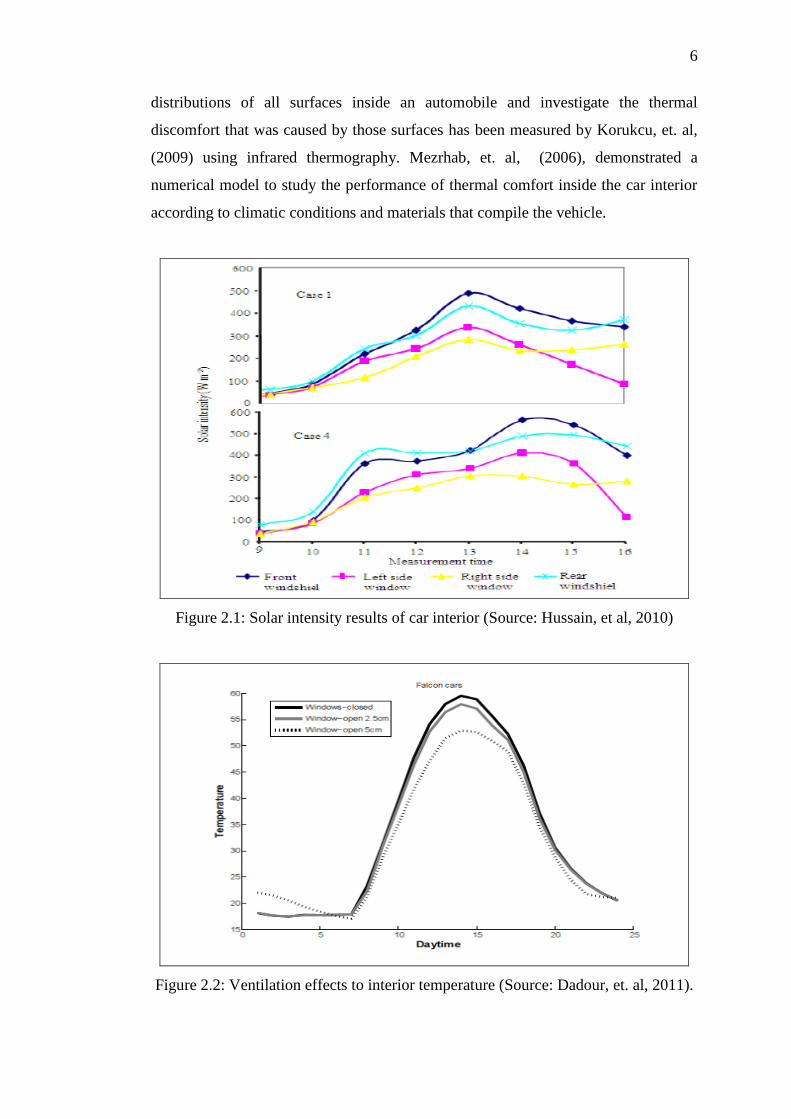
Temperature level in car interior can be more 20 ºC above the ambient
temperature when a car is parked and exposed to sun radiation as verified by Dadour,
et. al, (2011). They build a simple ‘greenhouse’ model for predicting the daily
interior vehicle temperatures of black and white vehicles. They also demonstrated car
interior temperature can be reduce typically 3 ºC with lowering the driver's window
by 25 mm as shown in Figure 2.2. Jan Null, CCM (2003) from Department of
Geosciences, San Francisco State University has been demonstrate estimated vehicle
interior air temperature vs elapsed time as shown on Table 2.2.
Kaynakli, et. al, (2005), measured temperature and humidity at a various
points inside a sedan car during heating period. The instant and transient temperature
6
distributions of all surfaces inside an automobile and investigate the thermal
discomfort that was caused by those surfaces has been measured by Korukcu, et. al,
(2009) using infrared thermography. Mezrhab, et. al, (2006), demonstrated a
numerical model to study the performance of thermal comfort inside the car interior
according to climatic conditions and materials that compile the vehicle.
Figure 2.1: Solar intensity results of car interior (Source: Hussain, et al, 2010)
Figure 2.2: Ventilation effects to interior temperature (Source: Dadour, et. al, 2011).

7
Table 2.2: Estimated vehicle interior air temperature elapsed time (Source: Jan Null,
CCM, 2003)
Elapsed time Outside Air Temperature (ºF)
70 75 80 85 90 95
0 minutes 70 75 80 85 90 95
10 minutes 89 94 99 104 109 114
20 minutes 99 104 109 114 119 124
30 minutes 104 109 114 119 124 129
40 minutes 108 113 118 123 128 133
50 minutes 111 116 121 126 131 136
60 minutes 113 118 123 128 133 138
> 1 hour 115 120 125 130 135 140
2.3 Relative Humidity
According to the American Heritage Science Dictionary (2014) relative humidity is
the ratio of the actual amount of water vapour present in a volume of air at a given
temperature to the maximum amount that the air could hold at that temperature,
expressed as a percentage. Warm air can hold more water vapour than cool air, so a
particular amount of water vapour will yield a lower relative humidity in warm air
than it does in cool air.
Relative humidity can influence comfortable feels of occupants in a certain
space. The ASHRAE (1999) advises a relative humidity range of 30% to 60% in
occupied spaces. The occupied spaces can relates to office or educational buildings,
entertainment venues and medical facilities. Some medical facilities have different
relative humidity requirements which are based on the condition and purpose.
Low relative humidity can have negative effects on human wellbeing and
health. Arundel, et. Al, (1986) stated that low relative humidity cause eye irritation
and may increase the occurrence of “infective aerosols produced by coughing or
exhaling.” People stay indoors for long time period during winter easy to get

8
respiratory infection by weakening the defences provided by the mucous membranes.
They also state relative humidity between 40% and 70% can minimize the infectivity
of bacterial and viral organisms. Oak Ridge National Laboratory (2000) states,
relative humidity below 30% can cause nosebleed, sinus and tracheal irritation and
dry skin.
High relative humidity can considered when it is above 60%. Too high
percentage of humidity can cause occupant discomfort, building and paper-based
materials damage, mold and fungi growth, the existence of dust mites, and develop
infectivity of bacteria and viruses. When humidity is increased, the human body has
more complexity in cooling itself through perspiration. If the perspiration cannot
disappear from the skin due to the increased relative humidity, then the people will
become uncomfortable. Asthma can be triggered by allergens produced by dust
mites.
High relative humidity can contribute problems to building materials.
Moisture from air will absorbed by acoustical ceiling tiles, causing sagging.
Wallboard can absorb enough moisture in a high humidity space to the extent that it
supports mold or fungi growth, which itself can damage wallboard. High relative
humidity also can contribute to the degradation of books and other paper-based
materials as they become attractive place for mold and for house dust mites. House
dust mites can increase in space where the relative humidity exceeds 50% and fine
organic particles are readily available. These dust mites can be found in all types of
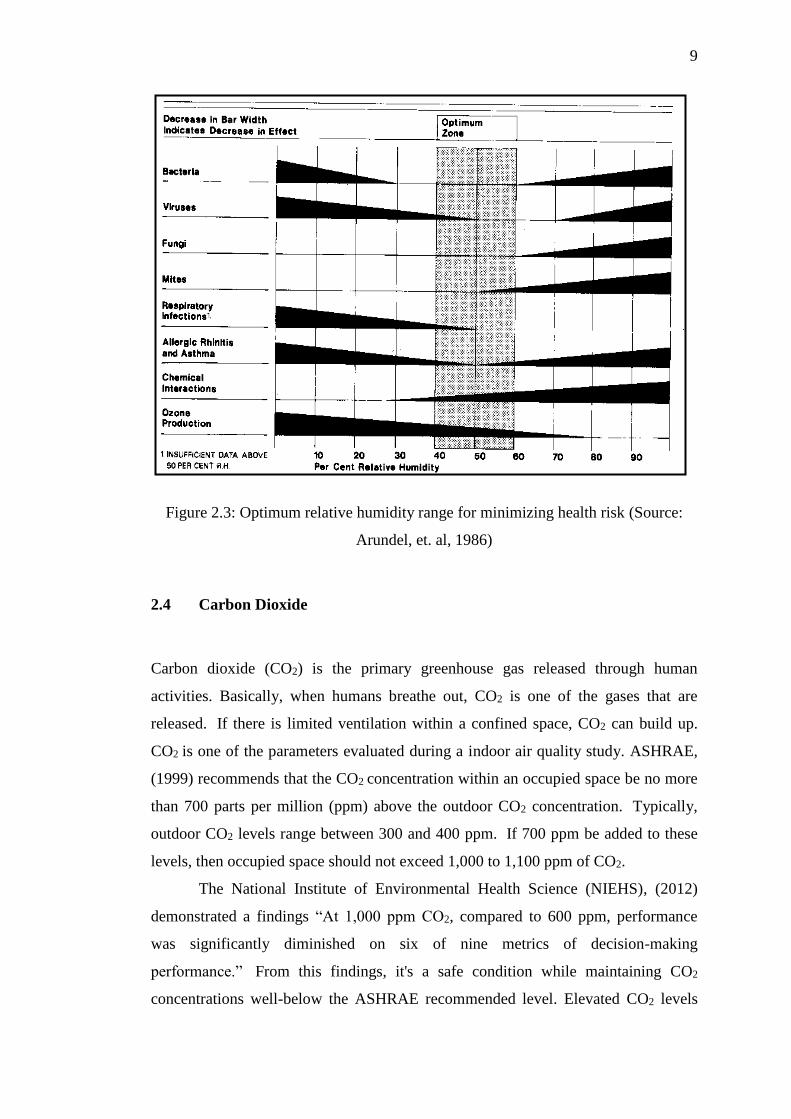
indoor environments besides residential properties. Arundel, et. al, (1986) has been
summarized the effect relative humidity on chemical and biological factor as shown
in Figure 2.3
9
Figure 2.3: Optimum relative humidity range for minimizing health risk (Source:
Arundel, et. al, 1986)
2.4 Carbon Dioxide
Carbon dioxide (CO2) is the primary greenhouse gas released through human
activities. Basically, when humans breathe out, CO2 is one of the gases that are
released. If there is limited ventilation within a confined space, CO2 can build up.
CO2 is one of the parameters evaluated during a indoor air quality study. ASHRAE,
(1999) recommends that the CO2 concentration within an occupied space be no more
than 700 parts per million (ppm) above the outdoor CO2 concentration. Typically,
outdoor CO2 levels range between 300 and 400 ppm. If 700 ppm be added to these
levels, then occupied space should not exceed 1,000 to 1,100 ppm of CO2.
The National Institute of Environmental Health Science (NIEHS), (2012)
demonstrated a findings “At 1,000 ppm CO2, compared to 600 ppm, performance
was significantly diminished on six of nine metrics of decision-making
performance.” From this findings, it's a safe condition while maintaining CO2
concentrations well-below the ASHRAE recommended level. Elevated CO2 levels

10
created from occupants’ respiration inside car interiors can cause drowsiness and
slow reaction times. If CO2 concentration becomes too high, the air gets stale or
ventilation in recycle mode and the occupants will not feel comfortable. Complaints
usually begin when carbon dioxide concentrations reach about 800 ppm and become
more common when carbon dioxide exceeds 1000 ppm. Praml, et. al, (2000) state if
the level of carbon dioxide is too high, more fresh air would be required to dilute the
CO2 content. Mohd Sahril Mohd Fouzi, et. al, (2014), conducted a study of CO2
concentration while a vehicle is driving with three occupants in intermittence mode
(recirculation and fresh air). As shown in Figure 2.4 the CO2 concentration increase
when air conditioning ventilation in recirculation modes and decrease when in fresh
air mode.
Figure 2.4: Variation of Carbon Dioxide (CO2) in ppm with time for intermittence
test (Source: Mohd Sahril Mohd Fouzi, et. al, 2014)
11
2.5 Particulate Matter
Particulate matter (PM) is the word used for a combination of very small solid
particles and liquid droplets suspended in the air. These particles originated from a
variety of activities, such as constructions, industrial, and transportations. Incomplete
combustion from transportation engine and waste from industrial or construction
then transformed to gaseous emissions hence suspended in the atmosphere as
particulate matter. Particles can be carried over long distances by wind and then
settle on ground or water. Particulate matter in a car compartment can be unhealthy.
Particles are small enough to infiltrate nasal, sinus, and bronchial passages where
they can affect passenger’s health and comfort. Small particles less than 10
micrometers in diameter pose the greatest problems, because they can get deep into
lungs, and some may even get into bloodstream and affect heart. Particulate matter
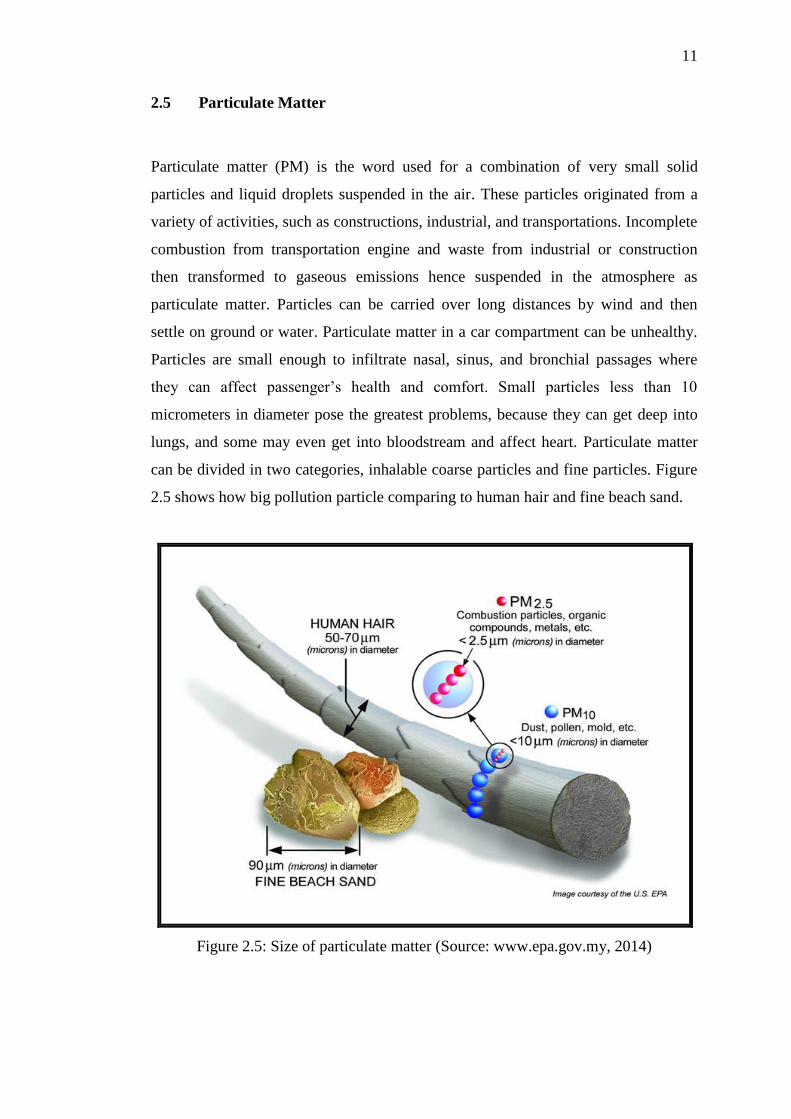
can be divided in two categories, inhalable coarse particles and fine particles. Figure
2.5 shows how big pollution particle comparing to human hair and fine beach sand.
Figure 2.5: Size of particulate matter (Source: www.epa.gov.my, 2014)

12
Coarse particles (PM10) have a diameter size between 2.5 micrometers and 10
micrometers. They are formed by mechanical interference such as crushing, grinding,
abrasion of surfaces and also formed by evaporation of sprays, and suspended of
dust. PM10 is composed of aluminosilicate and other oxides of crustal elements, and
major sources including dust from roads, industry, agriculture, construction and
demolition, and fly ash from fossil fuel combustion. PM10 travel distance varies from
below 1 kilometer to 10 kilometer and its life time from minute to hours. Praml, et.
al, (2000) signified that particulate matter concentration level inside vehicles comes
from external sources. Mohamad Asyraf Othoman, et. al, (2014) demonstrated
concentration level of PM10 achieved maximum value when cars following heavy
vehicle in fresh air ventilation mode and slightly stable when switch to recirculation
mode.
Fine particles (PM2.5) have diameter size less than 2.5 micrometers. These
particles are formed from gas and condensation of high-temperature vapours during
combustion, and they are composed of various combinations of sulphate compounds,
nitrate compounds, carbon compounds, ammonium, hydrogen ion, organic
compounds, metals (Pb, Cd, V, Ni, Cu, Zn, Mn, and Fe), and particle bound water.
The major sources of PM2.5 are forest fires, or they can form when gases emitted
from power plants, industries and automobiles react in the air. PM2.5 travel distance
varies from 100 kilometer to 1000 kilometer and its life time from days to weeks.
Figure 2.6 shows the size range and types or source of particulate matter.

13
Figure 2.6: Particle types and size (Source: TSI Incorporated, 2014)
2.6 Volatile Organic Compound
Volatile organic compounds (VOC) are carbon-based chemicals, which under certain
conditions can evaporate (volatile) into the air. Materials and finishing products used
in car interiors commonly used of organic compounds as a part of their composition.
Some materials include glass and metal can be as VOC collector by absorbing VOCs
emitted from other materials during phases of elevated concentrations VOCs on their
surfaces. These materials later can be a considerable source of VOC emissions that
were not a part of their original composition.
Although there is very limited research conducting on VOC levels in car
interiors, the several research findings indicate serious concerns about how VOCs
emissions can affect the health of people in other indoor environments, such as
homes, schools and workplaces. Yoshida, et. al, (2005) had do VOC assessment in
one new private vehicle and recognized over 160 substances in the interior of the
new vehicle, including BTEX and formaldehyde. The interior temperature,
ventilation, humidity, age and general condition of vehicle mostly will influence the
14
observation of VOC concentration level. Car interior temperature is one of major
concern influencing VOC emission concentration. Temperature level in car interior
can be more 45 ºC above the ambient temperature when a car is parked and exposed
to sun radiation after an hour. The elevated temperature inside a car interior may
irritate increased vaporization and off-gassing of various organic compounds from
car interior materials. Zhang, et. al, (2008) tested 802 new private vehicles (some of
which were up to 3 years old) in parking mode and without passenger and driver. The
main gaseous sub-stances identified were: benzene, toluene, ethylbenzene and
xylenes (BTEX).
Usually, the total concentration of VOCs (TVOC) is measured in the air and
then compare those levels with the general guide in Table 2.3 to evaluate their
potential effect on indoor occupants by Mølhave L (1986). The levels of individual
VOCs to ascertain which VOCs are present will take into account which may have
higher concentrations than others and which may present health risks to those
exposed. This is helpful in determining which VOCs may be the cause of complaints
as well as likely VOC sources.
Table 2.3: General guide to TVOC emissions and health effects.
(Source: Mølhave L 1986)
Less than 0.20 mg/m3 No irritation or discomfort expected
0.20 mg/m3-3.0 mg/m3 Irritation and discomfort may be possible
3.0 mg/m3-25.0 mg/m3 Discomfort expected and headache possible
Greater than 25 mg/m3 Toxic range where other neurotoxic effects may
occur
2.7 Thermal Comfort
Thermal comfort is a term that generally regarded as a desirable or positive state of a
person. The feeling of comfort is a result of mixture sensations that varies depending
on the person, lifestyle, and habits. For example, during winter, when you are from
the outside region and coming in (from temperature of -5oC to temperature 20oC),
warm sensation will be experienced and same goes to cool sensation, from hot to

15
cold area. Thermal comfort mainly concerns the interior temperature of rooms,
maintaining and distributing it evenly and the quality of air.
There are many levels of discussion regarding the meaning and nature of
thermal comfort and there was much activity and debate in 1960s and 1970s on this
topic (McIntyre, et. al, 1980). Much been achieved since 1970 in understanding the
conditions that create thermal comfort. However, because of the need to take the
understanding to a higher level in order to meet increased and new requirements,
these discussions are again coming to the fore. Based on ASHRAE standard 55, a
good thermal comfort achieved where eighty percent or more people in a room feel
comfortable. ‘Thermal comfort is that condition of mind which expresses satisfaction
with the thermal environment’ (Hall 2011). A less neutral and more positive concept
related to thermal comfort is thermal pleasure. Thermal pleasure found in cool
temperatures compensated for by the neat of the sun. Such conditions are usually
beyond thermal comfort.

16
CHAPTER 3
METHODOLOGY
3.1 Overall Project Flow
Figure 3.1: Project methodology flowchart
Not Sufficient
Not Sufficient
Sufficient
Sufficient
Available data and information
gathering
Data collection
Data analysis and transfer
Experiment mode preparation
Results
Findings and Discussion
End
Start
Validation
Validation

17
3.2 Available Data
Meteorological and land use data was available for this research. Meteorological data
from a fixed air quality monitoring station nearby to the study area was provided by
the Malaysia Meteorological Department. Data provided include temperature,
humidity and particle matter concentrations. These data were used to make
comparison between actual ambient data taken in testing area. Malaysia naturally has
plentiful sunshine and consequently solar radiation. On the average, Malaysia
receives about 6 hours of sunshine per day due the cloud cover cuts off a substantial
amount of solar radiation. This study was conducted in selected parking area (latitude
4.57, longitude 101.1) and altitude: 53m above mean sea level in Ipoh, the capital
city of Perak state. The testing area surrounded by residential flats, terrace houses,
schools, and government buildings as shown on Figure 3.2. The area also secluded
by limestone hills; i.e. to the northeast, east and southeast of the testing area.
Figure 3.2: Testing area for data collection (Source: Google map, 2015)

18
3.3 Experiment Mode Preparation and Data Collection
In order to collect data for this study, a white Proton Persona (Model 2011) and car
sunshade were used in the experiments as shown in Figure 3.3. The shape and
dimensions of the front, rear and side of a car are shown in the Figure 3.4. All side
windows are made of white transparent glass. The front and rear windscreen are also
made of white glass. The car sunshade has a silver foil front and back as shown in
Figure 3.5. Material for car sunshade is aluminium foil.
Figure 3.3: A White Proton Persona, Model 2011
Figure 3.4: Car Schematic and specification (Source: Proton, 2011)

19
Figure 3.5: Aluminium car sunshade
The car was parked and exposed to direct sun at a free air in period of time at Ipoh.
The test area was the car park of learning institution at Ipoh, Perak, Malaysia which
is typical bitumen surfaced open car park. Vacant spaces were left between and either
side of the test vehicles to ensure full sun exposure. The test vehicles oriented South-
East to ensure full sun exposure for the whole period of the test. The selected
location was ensured there was no shading of the vehicles during the period of the
test.
The indoor air quality parameter (temperature, relative humidity, carbon
dioxide and particulate matter, PM10) is measured from 12.00 hrs to 14.00 hrs during
three days for each mode at almost constant atmospheric temperatures between
March and May. All experiments are made almost at the same conditions (car
direction and daily hours). The starting temperature of the vehicles was normalised
by parking in an under-roof car park for several hours’ priors to each test sequence.
Air conditioning was off and set at low fan speed, immediately prior to parking the
car in its test and commencing the test, in order to replicate typical driving condition.
As shown in Table 3.1 example of data collection sheet for experiment. Five
different parking conditions were investigated consisting of all side glass windows
openings, front shield shading and normal parking condition. The cases are described
in Table 3.2. All modes except mode 1, the car was tested at open space (un-shaded)
parking area. Mode 2 when the car was parked at open space (un-shaded) parking
area and windows was totally closed. Mode 3 when the car windows were totally

20
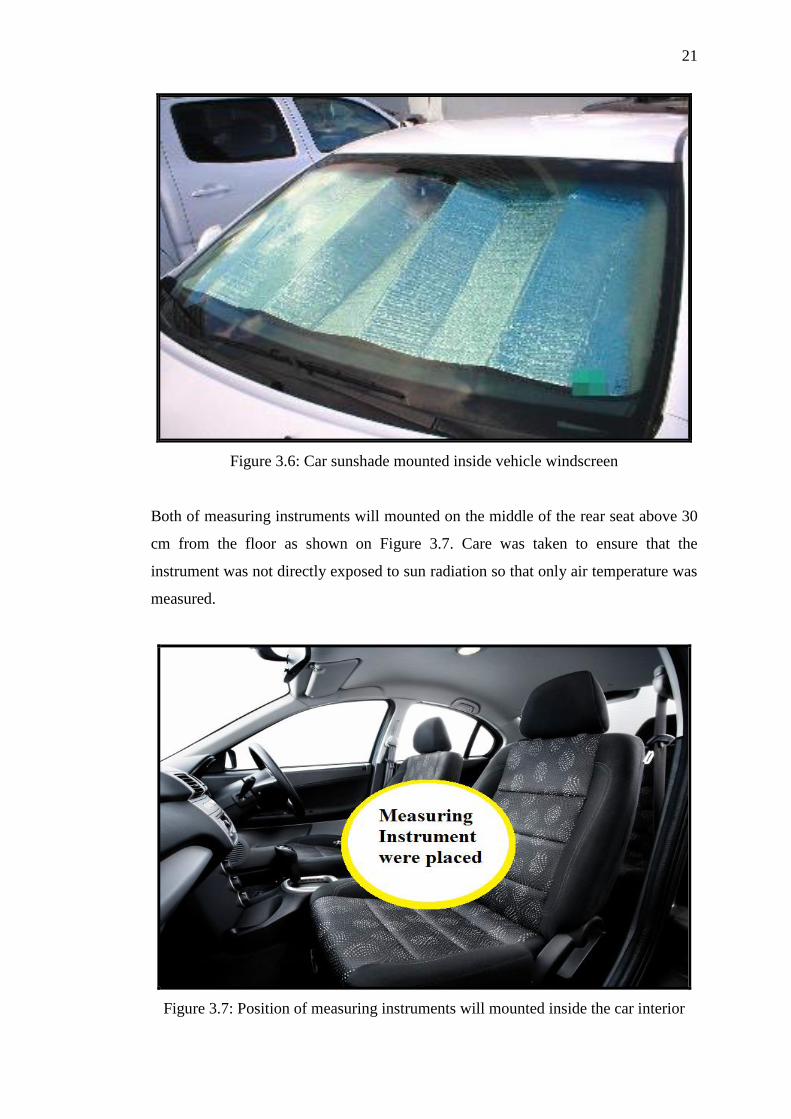
closed with apply car sunshade in front and rear windscreen as shown in Figure 3.6.
Mode 4 when the car is lowering the four windows by 20 mm and mode 5 when the
car is lowering the four windows by 20 mm with installed car sunshade underneath
front and rear windscreen. Indoor air quality parameter data for control (fully shaded)
condition in an under-roof parking area and all windows were totally closed for mode
1 will measured to make comparison study.
Table 3.1: Example of data sheet for each modes
10/3/2015
Time
Interior Ambient
PM10 T CO2 RH PM10 T CO2 RH
12:00
12:15
12:30
12:45
13:00
13:15
13:30
13:45
14:00
Table 3.2: Example of data sheet for each modes
Mode Setup
Roof Parking
Area
Open Parking
Area
All Windows
Closed
Sunshade Windows Gab
20mm
1 √ √
2 √ √
3 √ √ √
4 √ √
5 √ √ √
21
Figure 3.6: Car sunshade mounted inside vehicle windscreen
Both of measuring instruments will mounted on the middle of the rear seat above 30
cm from the floor as shown on Figure 3.7. Care was taken to ensure that the
instrument was not directly exposed to sun radiation so that only air temperature was
measured.
Figure 3.7: Position of measuring instruments will mounted inside the car interior
22
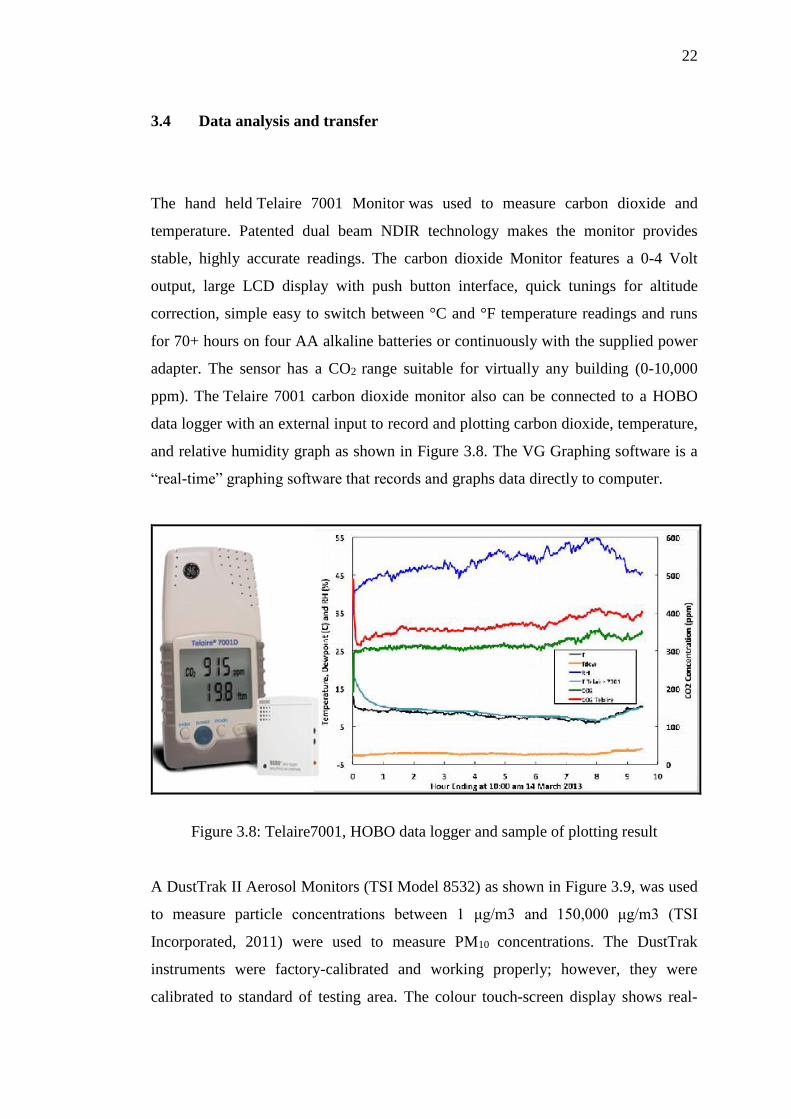
3.4 Data analysis and transfer
The hand held Telaire 7001 Monitor was used to measure carbon dioxide and
temperature. Patented dual beam NDIR technology makes the monitor provides
stable, highly accurate readings. The carbon dioxide Monitor features a 0-4 Volt
output, large LCD display with push button interface, quick tunings for altitude
correction, simple easy to switch between °C and °F temperature readings and runs
for 70+ hours on four AA alkaline batteries or continuously with the supplied power
adapter. The sensor has a CO2 range suitable for virtually any building (0-10,000
ppm). The Telaire 7001 carbon dioxide monitor also can be connected to a HOBO
data logger with an external input to record and plotting carbon dioxide, temperature,
and relative humidity graph as shown in Figure 3.8. The VG Graphing software is a
“real-time” graphing software that records and graphs data directly to computer.
Figure 3.8: Telaire7001, HOBO data logger and sample of plotting result
A DustTrak II Aerosol Monitors (TSI Model 8532) as shown in Figure 3.9, was used
to measure particle concentrations between 1 μg/m3 and 150,000 μg/m3 (TSI
Incorporated, 2011) were used to measure PM10 concentrations. The DustTrak
instruments were factory-calibrated and working properly; however, they were
calibrated to standard of testing area. The colour touch-screen display shows real-

23
time mass concentration and graphical data as well as other statistical information
along with instrument pump, laser and flow status, and much more. Quick walk-
through surveys can be perform by programming the start time, total sampling time,
logging intervals, alarm set points and many other parameters. Long-term sampling
investigations can be done by selected advanced logging modes. It also can even set
up the instrument for continuous unattended operation. Then the data can be saved
on external memory storage and analyzed by data analyzer software such as excel
and sigma plot.
Figure 3.9: DustTrak II Aerosol Monitors (TSI Model 8532)
The TPI 597 digital hygrometer / psychrometer was used as humidity tester designed
to display ambient, dew point, and wet bulb temperature as well as humidity. Small
diameter tip (0.45”) for measuring dew point in air ducts and registers to prevent
mold build up. Measure dew point, humidity, and wet bulb temperature to prevent
mold build up and condensation in HVAC systems. Relative humidity (RH) accuracy
of +/-2% provides accurate reliable readings.

24
3.5 Data Processing and Quality Control
The validity of the data is a high priority while conducting the measurements and
analyzing the results. Steps that were taken to ensure the quality of the data included
a zero point check done on particle measurement devices before and after each
measurement session. This were done by sampling air through a HEPA filter,
cleaning the air of any particulate matter. The gas analyzers have their internally
built zero-point checks that were used daily. To ensure that the carbon dioxide and
temperature measuring instrument was not directly exposed to sun radiation care was
taken so that only interior air temperature was measured. Data was taken in four
different modes for shaded and un-shaded condition. Each modes were repeated for
three days to avoid uncertainty. Cleaning process include dust was carried out for the
testing car interior before every measurement session.

42
REFERENCES
The American Society of Heating, Refrigeration, and Air-Conditioning Engineers.
(2007)ANSI/ASHRAE Standard 62.1-2007
Nakagawa, J., G. Iwashita, Y. Yoshinami, H. Nagayama and Y. Yokoyama. (2007).
Fundamental Study on The Ventilation Rate and VOCS Concentration in
The Car Compartment. In Proceeding of 6th International Conference on
Indoor Air Quality,Ventilation & Energy Conservation in Buildings IAQVEC.
Yokoyama, Y., G. Iwashita, Y. Yoshinami, H. Nagayama and J. Nakagawa. (2007).
Fundamental Study on Particles, Ultra-Fine Particles and Ozone in The Car
Compartment. In Proceeding of 6th International Conference on Indoor Air
Quality,Ventilation & Energy Conservation in Buildings IAQVEC.
Sulaiman, S.A., N. Isa, N.I. Raskan and N.F.C. Harun. (2013). Study of Indoor Air
Quality in Academic Buildings of a University. In Journal of Applied
Mechanics and Materials, 315: 389-393.
Harun, H., N. Buyamin, M.A. Othman and S.A. Sulaiman. (2013). A Case Study on
Indoor Comfort of Lecture Rooms in University Buildings. In Journal of
Applied Mechanics and Materials, 393: 821-826
Department Of Occupational Safety And Health. (2010) Industry Code Of Practice
On Indoor Air Quality. 127/379/4-39
Institute of Environmental Epidemiology, Ministry of the Environment. (1996)
Guidelines for good indoor air quality in office premises. Retrieved June 07,
2009
Hussain H. Al-Kayiem, M. Firdaus Bin M. Sidik and Yuganthira R.A.L
Munusammy. (2010) Study on the Thermal Accumulation and Distribution
Inside a Parked Car Cabin. In American Journal of Applied Sciences 7 (6):
784-789
I.R. Dadour, I. Almanjahie, N. D. Fowkes, G. Keady, K.Vijayan. (2011)
Temperature variations in a parked car. In Journal Forensic Science
International 207.205211.
43
O. Kaynakli, M. Kilic. (2005). An investigation of thermal comfort inside an
automobile during the heating period. In Journal Applied ergonomics 36,301-
312.
M. O. Korukcu, M. Kilic. (2009). The usage of IR thermography for the temperature
measurements inside an automobile cabin, 872-877. In Proceeding
International communications in heat and mass transfer 36.
A. Mezrhab, M. Bouzidi. (2006) Computation of thermal comfort inside a passenger
car compartment. In Journal Applied Thermal Engineering 26,1697–1704
Dictionary.com, "relative-humidity," in The American Heritage® Science
Dictionary.(2014). Source location: Houghton Mifflin Company.
The American Society of Heating, Refrigeration, and Air-Conditioning Engineers
(ASHRAE). (1999). Standard 62-1999
A.V. Arundel, E.M. Sterling, J.H. Biggin, and T.D. Sterling. (1986) Indirect Health
Effects of Relative Humidity in Indoor Environments, 351-361.
Oak Ridge National Laboratory. (2000). Causes of Indoor Air Quality Problems in
Schools: Summary of Scientific Research, Second Editione (2000)
National Institute of Environmental Health Science (NIEHS). (2012) Is CO2 an
Indoor Pollutant? Direct Effects of Low-to-Moderate CO2 Concentrations on
Human Decision-Making Performance.
Praml, G. and R. Schierl. (2000). Dust Exposure in Munich Public Transportation: A
Comprehensive 4-year Survey in Buses and Trams.
Mohd Sahril Mohd Fouzi, Mohamad Asyraf Othoman, Shaharin Anwar Sulaiman.
(2014). Effect of Recirculation on Air Quality in a Car Compartment. In
Aust. J. Basic & Appl. Sci., 8(4): 466-470, 2014
Mohamad Asyraf Othoman, Mohd Sahril Mohd Fouzi, Shaharin Anwar Sulaiman.
(2014) Effect of Air Circulation on Particles Concentration in a Car
Compartment in Tropical Country. In Aust. J. Basic & Appl. Sci., 8(4): 849-
854, 2014
Mølhave L.(1986). Indoor air quality in relation to sensory irritation due to VOCs.
In ASHRAE Transactions Paper No. 2954.92(1)
Hall, M. R. (2010), Materials for energy efficiency and thermal comfort in buildings
Thermal comfort in buildings. In Woodhead Publishing Series in Energy:
Number 14 pg: 127 - 146