NURUL FATIMAH BINTI ABDUL BASIR - umpir.ump.edu.myumpir.ump.edu.my/7083/1/CD7190.pdf · dalam...
24
INVESTIGATING THE EFFECT OF POLYMER MOLECULAR WEIGHT ON DRAG REDUCTION PERFORMANCE USING ROTATING DISK APPARATUS (RDA) NURUL FATIMAH BINTI ABDUL BASIR A thesis submitted in fulfillment of the requirements for the award of the Degree of Chemical Engineering (Gas Technology) Faculty of Chemical & Natural Resources Engineering UNIVERSITI MALAYSIA PAHANG February 2013
Transcript of NURUL FATIMAH BINTI ABDUL BASIR - umpir.ump.edu.myumpir.ump.edu.my/7083/1/CD7190.pdf · dalam...
INVESTIGATING THE EFFECT OF POLYMER MOLECULAR
WEIGHT ON DRAG REDUCTION PERFORMANCE USING
ROTATING DISK APPARATUS (RDA)
NURUL FATIMAH BINTI ABDUL BASIR
A thesis submitted in fulfillment
of the requirements for the award of the Degree of
Chemical Engineering (Gas Technology)
Faculty of Chemical & Natural Resources Engineering
UNIVERSITI MALAYSIA PAHANG
February 2013
vi
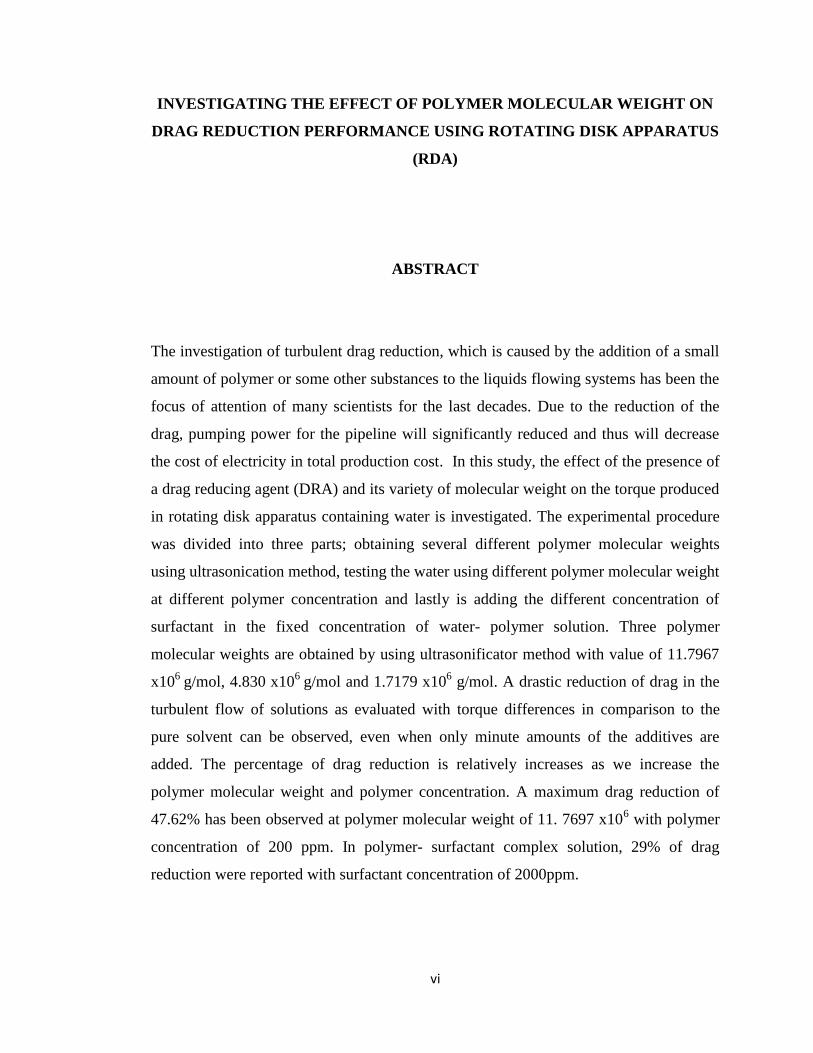
INVESTIGATING THE EFFECT OF POLYMER MOLECULAR WEIGHT ON
DRAG REDUCTION PERFORMANCE USING ROTATING DISK APPARATUS
(RDA)
ABSTRACT
The investigation of turbulent drag reduction, which is caused by the addition of a small
amount of polymer or some other substances to the liquids flowing systems has been the
focus of attention of many scientists for the last decades. Due to the reduction of the
drag, pumping power for the pipeline will significantly reduced and thus will decrease
the cost of electricity in total production cost. In this study, the effect of the presence of
a drag reducing agent (DRA) and its variety of molecular weight on the torque produced
in rotating disk apparatus containing water is investigated. The experimental procedure
was divided into three parts; obtaining several different polymer molecular weights
using ultrasonication method, testing the water using different polymer molecular weight
at different polymer concentration and lastly is adding the different concentration of
surfactant in the fixed concentration of water- polymer solution. Three polymer
molecular weights are obtained by using ultrasonificator method with value of 11.7967
x106
g/mol, 4.830 x10⁶
g/mol and 1.7179 x10⁶ g/mol. A drastic reduction of drag in the
turbulent flow of solutions as evaluated with torque differences in comparison to the
pure solvent can be observed, even when only minute amounts of the additives are
added. The percentage of drag reduction is relatively increases as we increase the
polymer molecular weight and polymer concentration. A maximum drag reduction of
47.62% has been observed at polymer molecular weight of 11. 7697 x106 with polymer
concentration of 200 ppm. In polymer- surfactant complex solution, 29% of drag
reduction were reported with surfactant concentration of 2000ppm.
vii
MENGKAJI KESAN JISIM MOLEKUL POLIMER KE ATAS PENGURANGAN
GESERAN MENGGUNAKAN RADAS CAKERA BERPUTAR
ABSTRAK
Kajian tentang pengurangan geseran dalam pengolakan cecair, yang mana dengan
penambahan sedikit campuran polimer asli atau beberapa bahan cecair yang lain ke
dalam sistem pengaliran cecair telah menjadi tumpuan ramai ahli sains dalam dekad ini.
Dengan pengurangan geseran ini, kuasa pam yang diperlukan untuk mengangkut cecair
telah berjaya dikurangkan dan juga turut mengurangkan kos janakuasa elektrik yang
diperlukan. Dalam kajian ini, kesan kehadiran agen pengurangan geseran dan
kepelbagaian jisim molekul ke atas tork yang dihasilkan di dalam radas cakera berputar
(RDA) yang mengandungi air telah disiasat. Prosedur eksperimen telah dibahagikan
kepada tiga bahagian; mendapatkan beberapa jisim molekul polimer menggunakan
kaedah ultrasonifikator, menguji air menggunakan jisim molekul polimer yang berbeza
pada kepekatan polimer yang berbeza dan yang terakhir menambah kepekatan
„surfactant„ yang berbeza ke dalam larutan air- polimer yang berkepekatan tetap. Tiga
jisim molekul polimer telah diperolehi menerusi kaedah ultrasonifikator dengan nilai
11.7967 x10⁶
g/mol, 4.830 x10⁶
g/mol dan 1.7179 x10⁶ g/mol. Satu pengurangan geseran
yang drastik dalam aliran yang bergelora boleh dilihat apabila terdapat perbezaan tork
dengan pelarut yang tulen walaupun hanya sedikit bahan terlarut ditambah. Peratusan
pengurangan geseran bertambah apabila jisim molekul dan kepekatan polimer
bertambah. Pengurangan geseran yang maksimum iaitu sebanyak 47.62% telah
diperhatikan pada jisim molekul 11.7697 x10⁶ g/mol dengan kepekatan polimer
sebanyak 200 ppm. Dalam larutan kompleks polimer- „surfactant„, pengurangan seretan
sebanyak 29% telah dilaporkan dengan kepekatan „surfactant„ sebanyak 2000ppm.
viii
TABLE OF CONTENTS
PAGE
DECLARATION ii
DEDICATION iv
ACKNOWLEDGEMENT v
ABSTRACT vi
ABSTRAK vii
TABLE OF CONTENTS viii
LIST OF TABLES xi
LIST OF FIGURES xii
LIST OF SYMBOLS xiv
LIST OF ABBREVIATIONS xv
CHAPTER 1 INTRODUCTION
1.1 Background of Study 1
1.2 Problem Statement 4
1.3 Objectives 5
1.4 Scopes of Study 5
1.5 Rationale and Significance of Study 6
CHAPTER 2 LITERATURE REVIEW
2.1 Types of Fluid flow 9
2.1.1 Laminar Flow 12
2.1.2 Turbulent Flows 13
2.2 Transportation of Crude Oil and Problem Encounter 15
2.2.1 Introduction 15
ix
2.2.2 Transportation by Pipeline 16
2.3 Drag Minimization or Reduction 17
2.3.1 Drag reduction Theories 17
2.3.2 Drag Reduction Agent (DRA) 20
2.3.2.1 Polymer as drag reduction agent 22
2.3.2.2 Surfactant as drag reduction agent 23
2.3.2.3 Fiber as drag reduction agent 26
2.3.2.4 Polymer- Surfactant Complex as reduction
agent 27
2.4 Drag Reduction Mechanism 28
2.5 Rotating Disk Apparatus (RDA) 30
CHAPTER 3 METHODOLOGY
3.1 Equipments 32
3.2 Materials 32
3.3 Rotating Disk Apparatus 33
3.4 Research Methods 35
3.4.1 Polymer Molecular Weight Chain Scission 35
3.4.2 Test Fluid 36
3.5 Experimental Calculation 37
3.5.1 Polymer Analysis 37
3.5.1.1 Polymer Molecular Weight Determination 37
3.5.2 Percentage Drag Reduction Calculation 38
3.5.2.1 Reynold No. Calculation 39
3.6 Experimental Procedures 39
3.7 Summary of Research Procedures 40
3.7.1 Molecular Weight Determination 40
3.7.2 Experimental Procedures on Drag Reduction 41
CHAPTER 4 RESULTS AND DISCUSSION
4.1 Introduction 42
x
4.2 Polymer Molecule Weight Determination 43
4.3 Effect of Polymer Molecular Weight on Drag Reduction 46
4.3.1 Torque Obtained for Different Polymer Molecular
Weight 46
4.3.2 Effect of Different Polymer Molecular
Weight on Drag Reduction 48
4.3.3 Drag Reduction as a Function of Various
Polymer Concentration 52
4.3.4 Effects of Polymer Concentration on Reynold
Number 54
4.3.5 Drag Reduction Efficiency 57
4.4 Polymer- Surfactant Complex Solution Analysis 60
4.4.1 Torque Obtained for Different Surfactant
Concentration 60
4.4.2 Effects of Surfactants Concentration onto
Drag Reduction 64
4.4.3 Effects of Types of Surfactants onto Drag
Reduction 67
CHAPTER 5 CONCLUSION AND RECOMMENDATIONS
5.1 Conclusion 70
5.2 Recommendations 75
REFERENCES 77
APPENDICES
Appendix A 82
Appendix B 86
Appendix C 110
xi
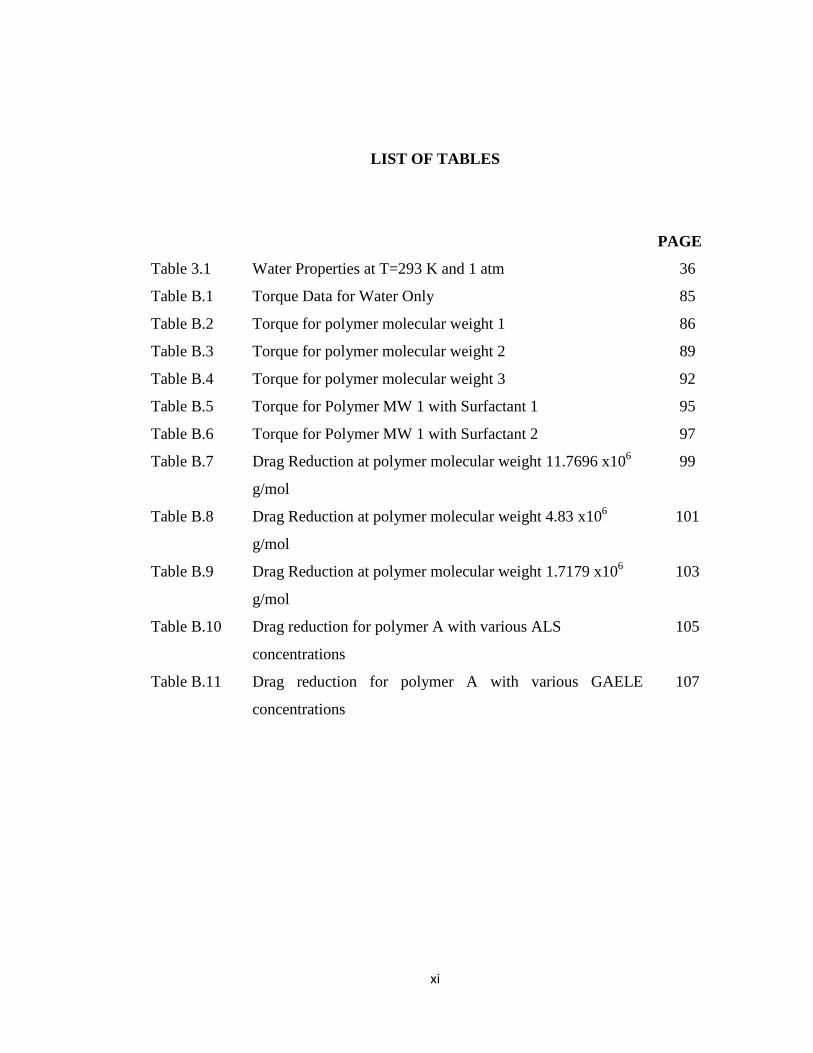
LIST OF TABLES
PAGE
Table 3.1 Water Properties at T=293 K and 1 atm 36
Table B.1 Torque Data for Water Only 85
Table B.2 Torque for polymer molecular weight 1 86
Table B.3 Torque for polymer molecular weight 2 89
Table B.4 Torque for polymer molecular weight 3 92
Table B.5 Torque for Polymer MW 1 with Surfactant 1 95
Table B.6 Torque for Polymer MW 1 with Surfactant 2 97
Table B.7 Drag Reduction at polymer molecular weight 11.7696 x10⁶
g/mol
99
Table B.8 Drag Reduction at polymer molecular weight 4.83 x10⁶
g/mol
101
Table B.9 Drag Reduction at polymer molecular weight 1.7179 x10⁶
g/mol
103
Table B.10 Drag reduction for polymer A with various ALS
concentrations
105
Table B.11 Drag reduction for polymer A with various GAELE
concentrations
107
xii
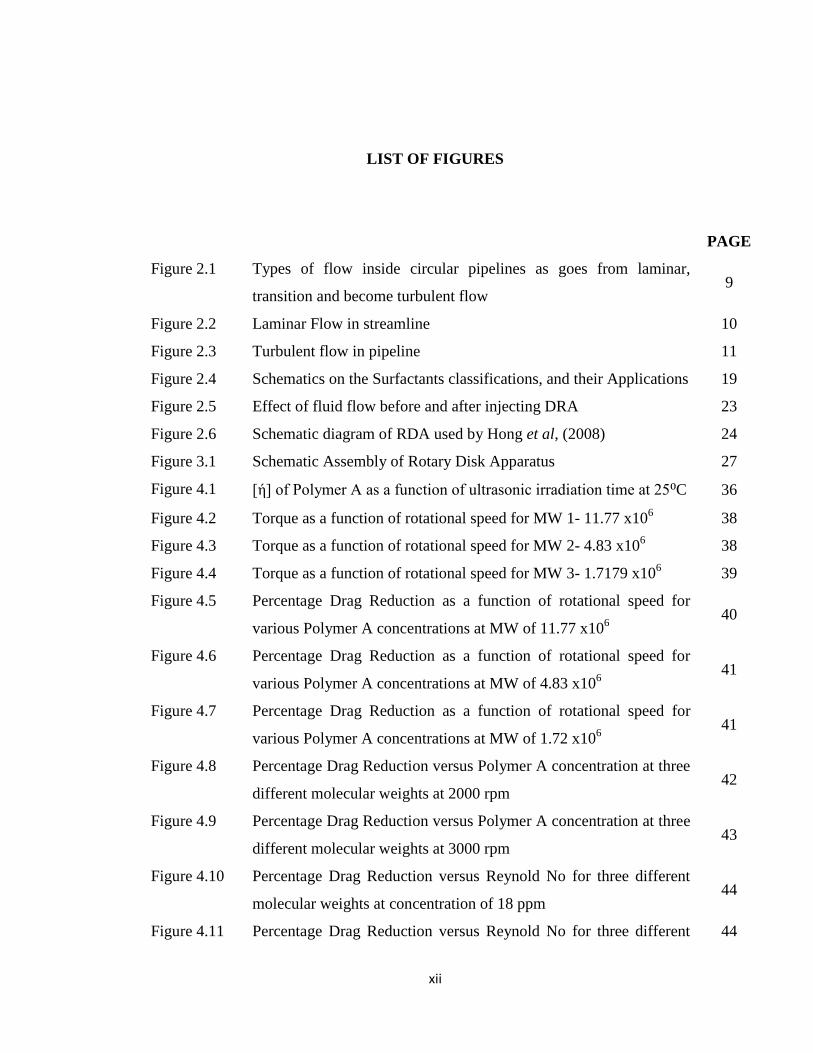
LIST OF FIGURES
PAGE
Figure 2.1 Types of flow inside circular pipelines as goes from laminar,
transition and become turbulent flow 9
Figure 2.2 Laminar Flow in streamline 10
Figure 2.3 Turbulent flow in pipeline 11
Figure 2.4 Schematics on the Surfactants classifications, and their Applications 19
Figure 2.5 Effect of fluid flow before and after injecting DRA 23
Figure 2.6 Schematic diagram of RDA used by Hong et al, (2008) 24
Figure 3.1 Schematic Assembly of Rotary Disk Apparatus 27
Figure 4.1 [ή] of Polymer A as a function of ultrasonic irradiation time at 25⁰C 36
Figure 4.2 Torque as a function of rotational speed for MW 1- 11.77 x10⁶ 38
Figure 4.3 Torque as a function of rotational speed for MW 2- 4.83 x10⁶ 38
Figure 4.4 Torque as a function of rotational speed for MW 3- 1.7179 x10⁶ 39
Figure 4.5 Percentage Drag Reduction as a function of rotational speed for
various Polymer A concentrations at MW of 11.77 x10⁶
40
Figure 4.6 Percentage Drag Reduction as a function of rotational speed for
various Polymer A concentrations at MW of 4.83 x10⁶
41
Figure 4.7 Percentage Drag Reduction as a function of rotational speed for
various Polymer A concentrations at MW of 1.72 x10⁶
41
Figure 4.8 Percentage Drag Reduction versus Polymer A concentration at three
different molecular weights at 2000 rpm 42
Figure 4.9 Percentage Drag Reduction versus Polymer A concentration at three
different molecular weights at 3000 rpm 43
Figure 4.10 Percentage Drag Reduction versus Reynold No for three different
molecular weights at concentration of 18 ppm 44
Figure 4.11 Percentage Drag Reduction versus Reynold No for three different 44
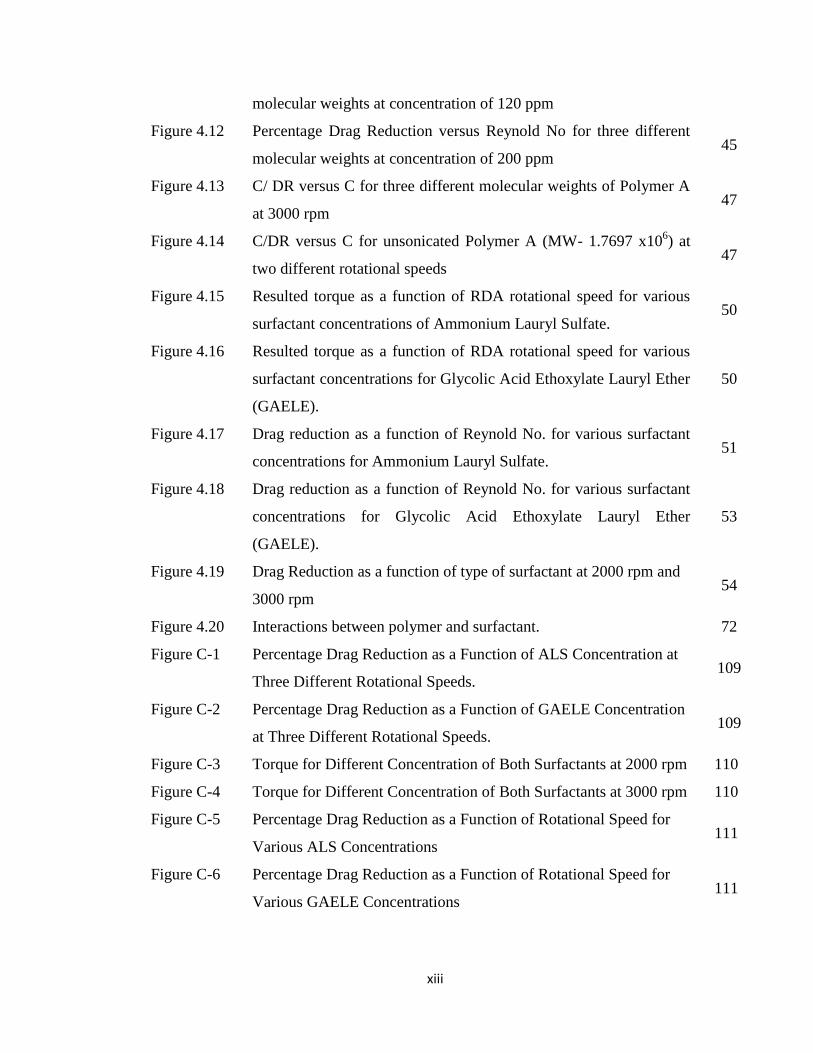
xiii
molecular weights at concentration of 120 ppm
Figure 4.12 Percentage Drag Reduction versus Reynold No for three different
molecular weights at concentration of 200 ppm 45
Figure 4.13 C/ DR versus C for three different molecular weights of Polymer A
at 3000 rpm 47
Figure 4.14 C/DR versus C for unsonicated Polymer A (MW- 1.7697 x10⁶) at
two different rotational speeds 47
Figure 4.15 Resulted torque as a function of RDA rotational speed for various
surfactant concentrations of Ammonium Lauryl Sulfate. 50
Figure 4.16 Resulted torque as a function of RDA rotational speed for various
surfactant concentrations for Glycolic Acid Ethoxylate Lauryl Ether
(GAELE).
50
Figure 4.17 Drag reduction as a function of Reynold No. for various surfactant
concentrations for Ammonium Lauryl Sulfate. 51
Figure 4.18 Drag reduction as a function of Reynold No. for various surfactant
concentrations for Glycolic Acid Ethoxylate Lauryl Ether
(GAELE).
53
Figure 4.19 Drag Reduction as a function of type of surfactant at 2000 rpm and
3000 rpm 54
Figure 4.20 Interactions between polymer and surfactant. 72
Figure C-1 Percentage Drag Reduction as a Function of ALS Concentration at
Three Different Rotational Speeds. 109
Figure C-2 Percentage Drag Reduction as a Function of GAELE Concentration
at Three Different Rotational Speeds. 109
Figure C-3 Torque for Different Concentration of Both Surfactants at 2000 rpm 110
Figure C-4 Torque for Different Concentration of Both Surfactants at 3000 rpm 110
Figure C-5 Percentage Drag Reduction as a Function of Rotational Speed for
Various ALS Concentrations 111
Figure C-6 Percentage Drag Reduction as a Function of Rotational Speed for
Various GAELE Concentrations 111
xiv
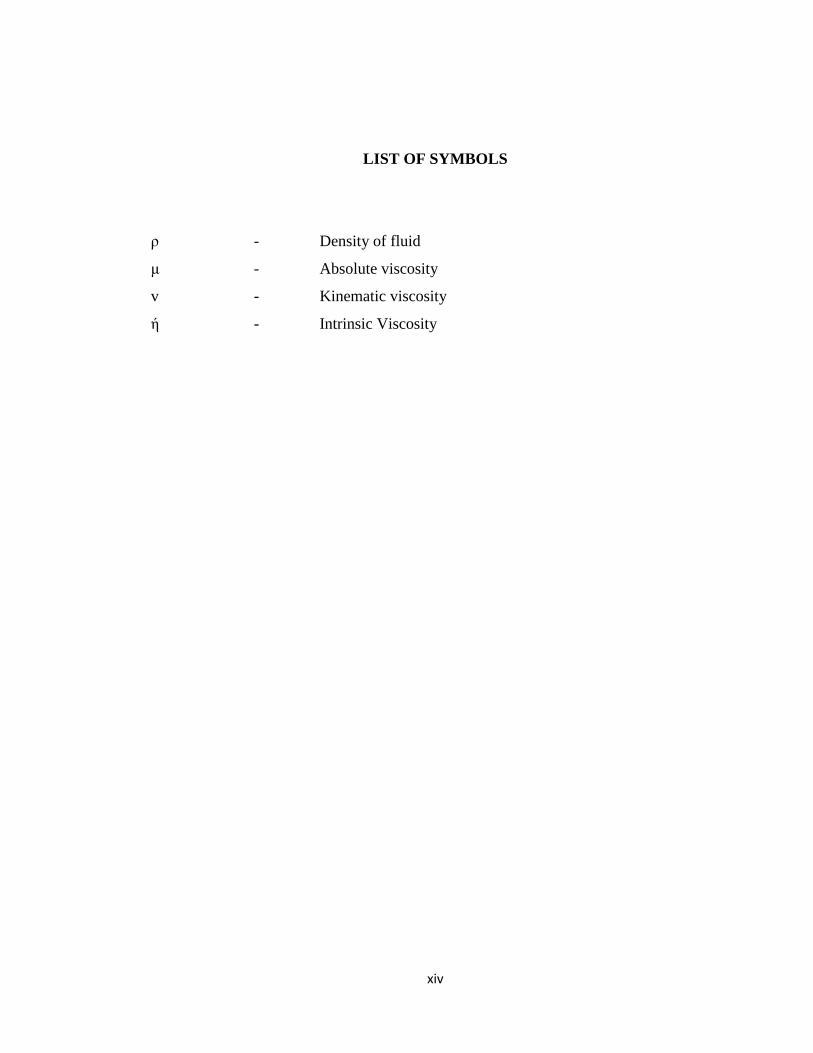
LIST OF SYMBOLS
ρ - Density of fluid
μ - Absolute viscosity
v - Kinematic viscosity
ή - Intrinsic Viscosity
xv
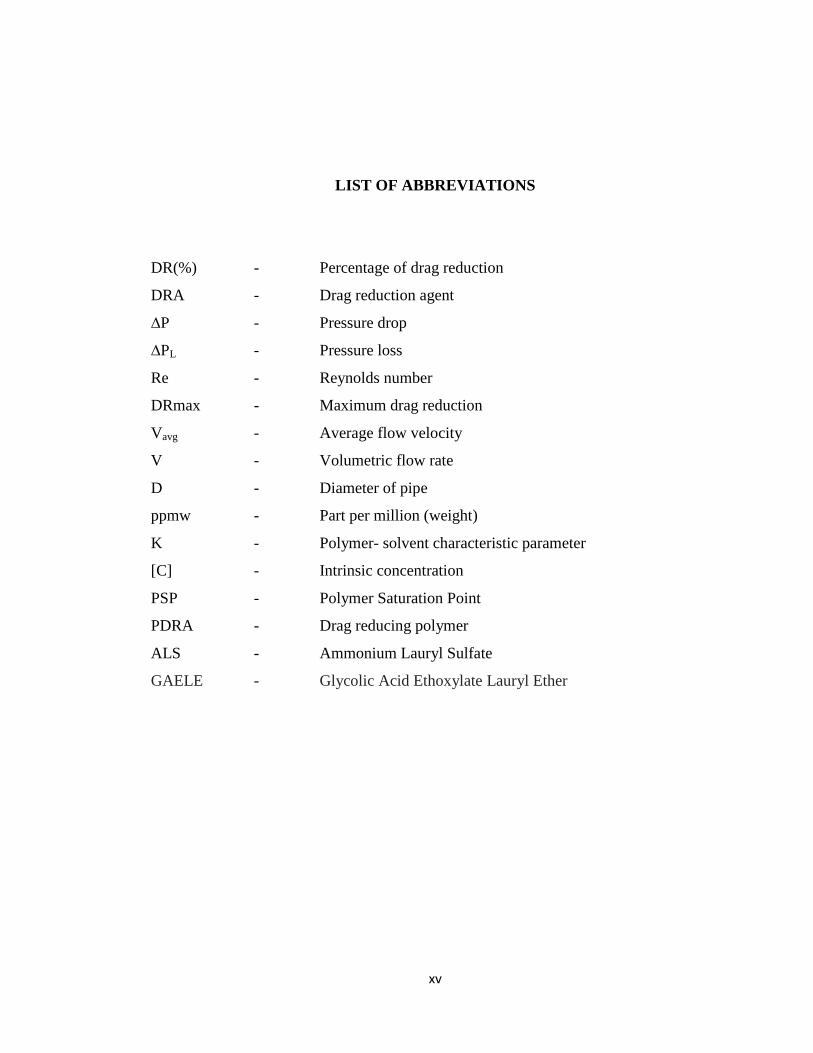
LIST OF ABBREVIATIONS
DR(%) - Percentage of drag reduction
DRA - Drag reduction agent
∆P - Pressure drop
∆PL - Pressure loss
Re - Reynolds number
DRmax - Maximum drag reduction
Vavg - Average flow velocity
V - Volumetric flow rate
D - Diameter of pipe
ppmw - Part per million (weight)
K - Polymer- solvent characteristic parameter
[C] - Intrinsic concentration
PSP - Polymer Saturation Point
PDRA - Drag reducing polymer
ALS - Ammonium Lauryl Sulfate
GAELE - Glycolic Acid Ethoxylate Lauryl Ether
1
CHAPTER 1
INTRODUCTION
1.1 Background of Study
Since 60 years ago, drag has been identified as the main reason for the loss of
energy in pipelines and other similar transportation channels due to the turbulence flow
and the friction between flowing fluid and pipe wall surfaces. These energy losses can
be identified through pressure drop, which will results in more pumping power
consumption.
In the turbulent pipeline flow consists of three regions across the pipe diameter
such as the laminar sublayer, the buffer region, and the turbulent core. Fluid near the
pipe wall (the laminar sublayer) tries to stay stationary while fluid in the center region of
the pipe (the turbulent core) is moving quickly. This large difference in fluid velocity
between the laminar sublayer and the turbulent core causes turbulent bursts to occur in
2
the buffer region. Turbulent bursts propagate and form turbulent eddies, which cause
inefficiencies in the hydraulic energy that drives the fluid down the pipeline.
Drag Reducing Agents (DRA) can be classified into three major categories such
as polymers, surfactants and suspended solids. The most effective drag reducing agent
that commonly used in industry is polymers. Toms (1948) first discovered the idea of
drag reduction when he studied the effect of polymer added into a turbulent Newtonian
fluid. He proved that the addition of small amount of polymers which is in ppm in
turbulent flow can produce a significant result in reducing frictional drag. There are two
types of polymer, which are synthetic polymer and natural polymers. Synthetic
polymers are obtained from petroleum oil and mean while natural polymers can be
extracted from resources in nature.
Nowadays, drag reduction is frequently served as a typical approach to save
pumping power in pipelines or other transportation channels and equipments,
particularly those deal with crude oil and refinery products. A pumping power saving
corresponds to the reduction of pressure drop in these medium. Studies on various drag
reduction agent have proven its ability in reducing pressure drop (Li et al., 2006; Cho et
al., 2007; Abdul Bari et al., 2008).
To analyze turbulent drag reduction, most research groups used closed loop pipe
flows, which is using produced pressure difference as drag reduction measurement. In
contrast, this study will use a high-precision rotating disk apparatus (RDA) to measure
3
drag reduction. RDA systems have been used for measuring both the mechanical shear
degradation of polymeric materials and frictional reduction (Choi et al, 1987; Gyr et al,
1995; Choi and Jhon, 1996, Cadot et al, 1998). The flow in the neighborhood of a
rotating disk is a great practical importance, particularly in connection with rotary
machines. In addition, because the rotating disk flow is drag flow with no imposed
pressure gradients, the origin of the turbulent boundary layer is different compared to
the pressure driven flow case in pipelines (Kim et al, 1999). The RDA system,
interfaced with the computer control unit and combines high speed data sampling with
controlled disk rotational speed will accurately measure fluid friction from laminar to
turbulent flow.
According to Kim et al, (1999) flow in rotating disk is used to describe external
flow, the simplest turbulent boundary layer, which occurs on a flat plate at zero
incidences. Many researchers typically studies frictional drag for an internal flow occurs
within pipeline, whereas for an external flow, one studies the total drag (frictional plus
form drag). External flow includes flow over flat plates as well as flow around sub-
merged objects. The drag reduction phenomenon is only related to the frictional part. A
maximum of 80% of the drag reduction can be achieved in tube flow, while the rotating
disk flow generally produces about 50% of the maximum drag reduction because of the
difference in the ratio between the frictional drag and the total drag for tube flow (inner
flow) and rotating disk flow (outer flow).
4
In this investigation, a polymer solution will be mixed in water solution in rotary
disk apparatus. Drag reduction performance will be investigated with varied polymer
molecular weight and concentration correlating with speed of the RDA due to the
injection of polymer. The injection of this polymer can enhance rotating torque and as a
result, the pattern flow will move more smoothly. The benefits when using drag
reducing phenomenon is the allowing of a greater production flow rate at an economical
cost and simultaneously reduction of operating costs such as pumping power.
1.2 Problem Statement
Note that drag reduction is a 60 year old problem associated with originally with
the name Toms as the Toms phenomena, where the addition of even very small (i.e. 5
ppm) of polymeric material can cause the reduction of turbulent drag by 80% in fully
developed boundary layer and channel flows. Drag reduction by polymers in turbulent
flows is an extremely complicated problem. It combines the complexity of turbulent
flow (difficult even for a Newtonian fluid) with the problems of polymer physics; their
combination changes the character of the turbulence and leads to a yet more complex
and difficult problem. Many flows in industrial applications such as oil pipelines are
turbulent flow. The turbulent flow with high velocity in the pipe flow system causes the
formation of eddies or wakes in many different length scales and characterized by larger
pressure drops and larger pumping power requirements than those of laminar flows. The
scale of turbulent eddies in a larger contribution of turbulent energy production to mean
5
mechanical energy loss. The energy losses in the pipe flow system can affect the
production efficiency and economical cost like pumping power. Pump is widely use for
effective fluid transportation before drag reduction phenomenon. The installations of
pump cause the plant more costly because of drag in the turbulent flow. By using pump
into the plant, the higher energy consumption is needed.
1.3 Objectives
Based on the research background and problem statements described in the
previous section, these are the following objectives of this research:
1) To investigate the effect of polymer molecular weights on the drag reduction in
pipeline water system.
2) To study the effect of polymer concentration on percentage of drag reduction in
water system.
3) To study the effect of polymer- surfactant complex solution on percentage of
drag reduction in water system using RDA.
1.4 Scopes of Study
The following scopes have been identified in order to achieve the objectives:
6
1. Three different molecular weight of polymer ( 11.7697 × 10⁶𝑔/𝑚𝑜𝑙, 4.830 ×
106𝑔/𝑚𝑜𝑙 𝑎𝑛𝑑 1.7179 × 10⁶ 𝑔/𝑚𝑜𝑙), were produce using ultrasonication method
and were experimented with significance to their effect in the turbulent drag
reduction in rotary disk apparatus.
2. Different polymer molecular weight and concentration will be utilized to
investigate the effect of this polymer used in the drag reduction phenomenon.
3. Distilled water will be the test fluid in this study.
4. The torque readings for pure distilled water and additional of polymer in the
rotary disk apparatus was collected to calculate the corresponding torque,
followed by the percentage of drag reduction.
5. Density and viscosity of pure fluid was used to calculate the Reynolds Number
(NRe) of the fluid.
6. Two different surfactants were used to investigate the effect of polymer-
surfactant complex solution on drag reduction at fixed polymer molecular weight
and concentrations.
1.5 Rationale and Significance of Study
Drag reduction is an alternative way to reduce pumping power losses during
transportation through pipelines. By injecting the drag reduction agent into a pipeline,
the friction pressure losses in a pipeline would be decreased. The significance of this
study was to discover a new scheme to reduce the turbulent drag, which is the main step
7
to the pumping power saving and ultimately lead to cost saving. Furthermore, power
saving is very essential to the cost saving in the plants. Originally from the name Toms
as the Toms phenomena, he said that the addition of even very small (i.e. 5 ppm) of
polymeric material can cause the reduction of turbulent drag by 80% in fully developed
boundary layer and channel flows. It was showed that the presence of turbulence can be
reduced with the addition of small amount of polymer. Also, recently studies found that
the addition of surfactant into a polymer solution could be an effective method in
reducing the mechanical degradation of polymer especially in high temperature flow
system. So, two different surfactants were used to enhance the polymer solution
characteristics.
8
CHAPTER 2
LITERATURE REVIEW
To flow liquid or gas in pipes, energy must be extended to overcome frictional
losses. This energy is extracted from the fluid pressure, which is decrease along the pipe
in the direction of flow. For a fixed pipe diameter, these pressure drops increase with
increasing pipe length until a maximum is reached when the pressure drop along the
pipe is equal to the supply pressure at the beginning of the flow. When flow in the pipe
is turbulent, this maximum flow rate can be increase by the addition of small amounts of
certain high molecular weight polymer to the fluid. These polymers intermingle with the
turbulent flow processes and reduce the frictional pressure. This phenomenon
commonly called drag reduction. Adding small amount of polymer been used in
commercial oil pipelines, fire hoses and storm sewer to increase the flow capacities of
the existing system. It also can be used to reduce supply pressures, pumping cost and
pipe diameter for a given flow capacities.
9
2.1 Types of Fluid Flows
Fluid is a substance that existed in liquid or gaseous phase. The difference
between a solid and fluid is illustrious based on the substance‟s ability to resist an
applied shear or tangential stress that would change its shape. A solid can resist an
applied shear stress and bowed temporarily or permanently depending on the force of
the stress; whereas a fluid will continuously deforms under the influence of the stress
(Cengel and Cimbala, 2006).
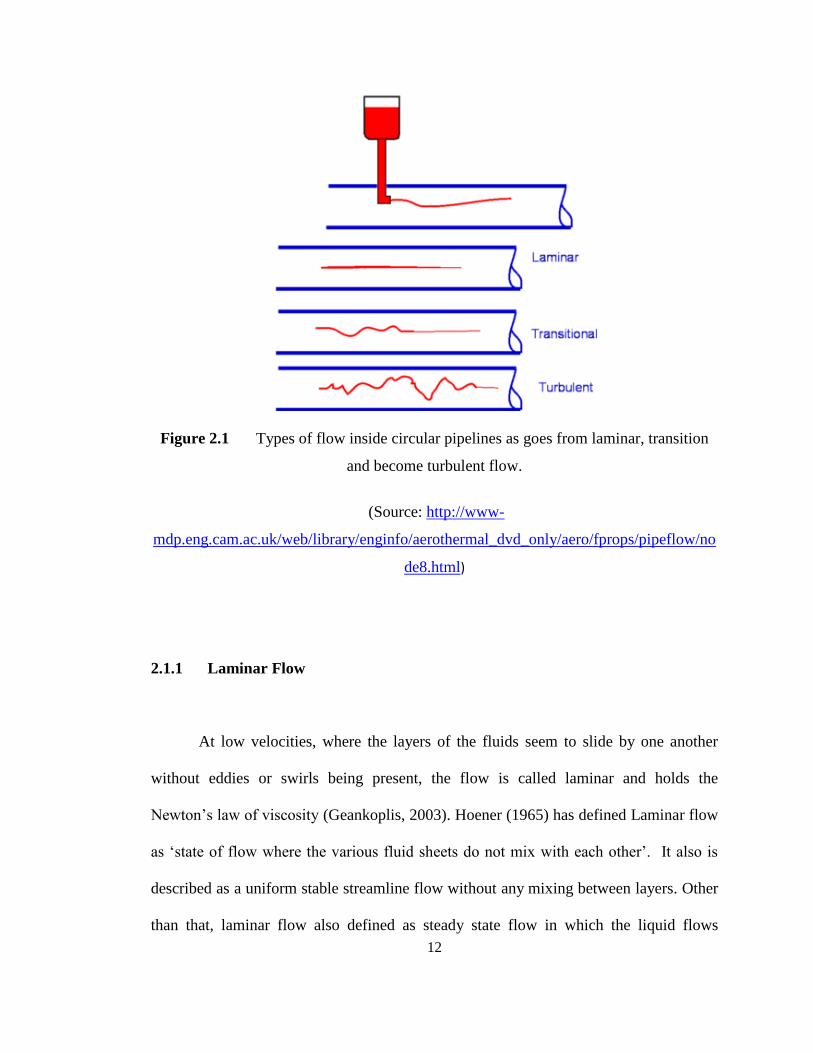
Essentially, there are three types of flow in pipeline which are Laminar,
Transitional and Turbulent flow. When calculating heat or mass transfer or head loss, it
is important to know the type of fluid flow whether it is laminar, transitional or turbulent.
Laminar flow happens when dealing with small pipes and low flow velocities. Laminar
flow can be regarded as a series of liquid cylinders in the pipe. Non – laminar flow is
called turbulent flow. Turbulent flow happens at high flow rates and with larger pipes
diameter. In turbulent flow, eddies, wakes or vortexes make the flow is unpredictable
and unstable. The transitional flow actually is a mixture of laminar and turbulent flow.
This happens when the turbulent in the center of pipe and the laminar flow near the
edges. Each of these flows behaves in different equations that predict their behavior and
have different manners in terms of their frictional energy loss while flowing in the
pipelines (Witold, 2008).
10
In these cases, turbulent or laminar flow in circular pipeline could be determined
by the dimensionless Reynolds Number. As discovered by Osborne Reynolds (1842 –
1912) the Reynolds number is important in analyzing at any type of flow when there is
substantial velocity gradient such as shear. The Reynolds number is proportional to
inertial force that divided by viscous force.
𝑅𝑒 =𝐼𝑛𝑒𝑟𝑡𝑖𝑎𝑙 𝑓𝑜𝑟𝑐𝑒𝑠
𝑉𝑖𝑠𝑐𝑜𝑢𝑠 𝑓𝑜𝑟𝑐𝑒𝑠=
𝑉𝑎𝑣𝑔𝐷
𝑣=
𝜌𝑉𝑎𝑣𝑔𝐷
𝜇 (2.1)
Where D is diameter of the pipe in m, ρ is the density of the fluid in kg/m³, V is the
average velocity of the object relative to the fluid (m/s), μ is the dynamic viscosity of
the fluid (Pa·s or N·s/m² or kg/(m·s)). (Geankoplis, 2003)
However, if calculation involved investigation of fluid flow using rotary disk
apparatus (RDA), equipment that used to describe external flow, Reynold number for
rotational flow is described by Kim et al (2001) as
𝑁𝑅𝑒 =𝜌𝜔𝑟2
𝜇 (2.2)
Where r is fluid density, ω is angular velocity [2 p× (revolutions per minute)/60
rad/s], r is radius of disk and μ is fluid viscosity [Pa·s]. Kim et al (2001) also state that
the flow becomes turbulent in an RDA at a critical Reynold number of 3 ×10⁵. Critical
Reynolds number, Recr is the value where the flow becomes turbulent and this value
11
varies for different geometries and flow conditions. The transition from laminar to
turbulent flows is also dependent on other factors; such as pipe surface roughness,
surface temperature, vibration and fluctuations in the flow
At high Reynolds numbers, the inertial forces, which are proportional to the fluid
density and the square of the fluid velocity, are more significant compared to viscous
forces, and therefore the viscous forces cannot inhibit the random and rapid fluctuation
of the fluid. This condition of flow is known as turbulent flow and Reynold number can
be defined as above than 4000 (NRe ˃4000). Whereas in low or moderate Reynolds
number that is less than 2300 (NRe < 2300), the viscous forces are significant enough to
restrict the fluid fluctuation and keep the fluid under smooth ordered motion; and this is
known as laminar flow. In most practical conditions, having Reynolds in-between 2000
until 4000(2000 < NRe < 4000), is called transitional flow (Cengel and Cimbala, 2006).
12
Figure 2.1 Types of flow inside circular pipelines as goes from laminar, transition
and become turbulent flow.
(Source: http://www-
mdp.eng.cam.ac.uk/web/library/enginfo/aerothermal_dvd_only/aero/fprops/pipeflow/no
de8.html)
2.1.1 Laminar Flow
At low velocities, where the layers of the fluids seem to slide by one another
without eddies or swirls being present, the flow is called laminar and holds the
Newton‟s law of viscosity (Geankoplis, 2003). Hoener (1965) has defined Laminar flow
as „state of flow where the various fluid sheets do not mix with each other‟. It also is
described as a uniform stable streamline flow without any mixing between layers. Other
than that, laminar flow also defined as steady state flow in which the liquid flows
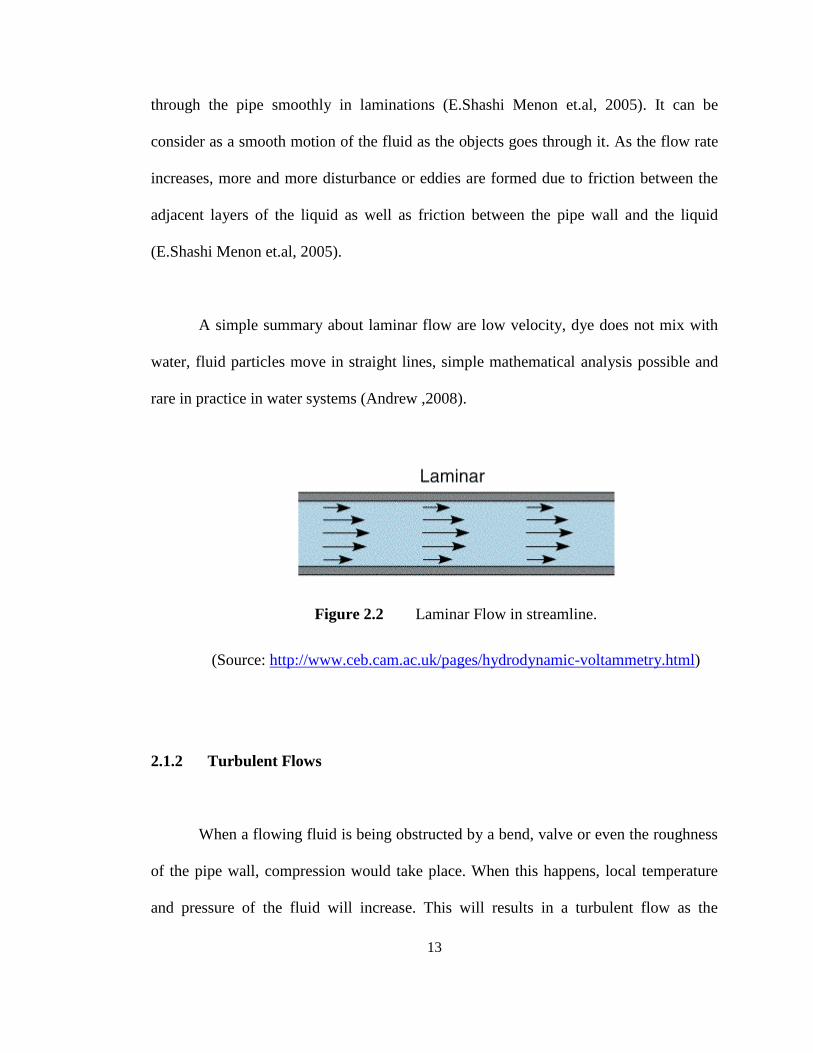
13
through the pipe smoothly in laminations (E.Shashi Menon et.al, 2005). It can be
consider as a smooth motion of the fluid as the objects goes through it. As the flow rate
increases, more and more disturbance or eddies are formed due to friction between the
adjacent layers of the liquid as well as friction between the pipe wall and the liquid
(E.Shashi Menon et.al, 2005).
A simple summary about laminar flow are low velocity, dye does not mix with
water, fluid particles move in straight lines, simple mathematical analysis possible and
rare in practice in water systems (Andrew ,2008).
Figure 2.2 Laminar Flow in streamline.
(Source: http://www.ceb.cam.ac.uk/pages/hydrodynamic-voltammetry.html)
2.1.2 Turbulent Flows
When a flowing fluid is being obstructed by a bend, valve or even the roughness
of the pipe wall, compression would take place. When this happens, local temperature
and pressure of the fluid will increase. This will results in a turbulent flow as the