Effect of steam addition on gas turbine combustor design ... · PDF fileEffect of steam...
27
Effect of steam addition on gas turbine combustor design and performance Rui Xue a,b , Chunbo Hu a , Vishal Sethi b , Theoklis Nikolaidis b , Pericle Pilidis b Abstract Adding steam influences the combustion process inside the combustor, which should be taken into account during combustor design. The design of combustor has long been the most challenging process. This study integrated the gas turbine performance with the combustor design, and formulated a detailed procedure for single annular combustors with steam addition consideration in particular. To accomplish this, a computer code has been developed based on the design procedures. The design model could provide the combustor geometry and the combustor performance. The inlet parameters for combustor design are obtained and validated through the calculation of gas turbine engine performance provided by our own home code. The model predictions are compared with operational and configuration data from two real engines and show reasonably good accuracy. The influence of steam addition on combustor design is investigated and results showed the variation of geometrical size is highest for components where intense combustion takes place while the design is almost kept the same for components where only pure flow exists. After conforming the feasibility of the combustor design code, we investigated the effects of steam addition on combustor performance. It revealed that steam injection is an effective way to reduce the temperature in the burner while other performance like the total pressure loss would be slightly deteriorated. Keywords Gas turbine combustor; steam addition; preliminary combustor design; performance Published by Elsevier. This is the Author Accepted Manuscript issued with: Creative Commons Attribution Non-Commercial No Derivatives License (CC:BY:NC:ND 3.0).
Transcript of Effect of steam addition on gas turbine combustor design ... · PDF fileEffect of steam...

Effect of steam addition on gas turbine combustor design
and performance
Rui Xuea,b
, Chunbo Hua, Vishal Sethi
b, Theoklis Nikolaidis
b, Pericle Pilidis
b
Abstract
Adding steam influences the combustion process inside the combustor, which should be taken into
account during combustor design. The design of combustor has long been the most challenging process.
This study integrated the gas turbine performance with the combustor design, and formulated a detailed
procedure for single annular combustors with steam addition consideration in particular. To accomplish
this, a computer code has been developed based on the design procedures. The design model could
provide the combustor geometry and the combustor performance. The inlet parameters for combustor
design are obtained and validated through the calculation of gas turbine engine performance provided by
our own home code. The model predictions are compared with operational and configuration data from
two real engines and show reasonably good accuracy. The influence of steam addition on combustor
design is investigated and results showed the variation of geometrical size is highest for components
where intense combustion takes place while the design is almost kept the same for components where
only pure flow exists. After conforming the feasibility of the combustor design code, we investigated the
effects of steam addition on combustor performance. It revealed that steam injection is an effective way to
reduce the temperature in the burner while other performance like the total pressure loss would be slightly
deteriorated.
Keywords
Gas turbine combustor; steam addition; preliminary combustor design; performance
Published by Elsevier. This is the Author Accepted Manuscript issued with: Creative Commons Attribution Non-Commercial No Derivatives License (CC:BY:NC:ND 3.0).
e101575
Text Box
Applied Thermal Engineering, Vol. 104, 5 July 2016, pp. 249–257 DOI:10.1016/j.applthermaleng.2016.05.019
e804426
Text Box
Published by Elsevier. This is the Author Accepted Manuscript issued with: Creative Commons Attribution Non-Commercial No Derivatives License (CC:BY:NC:ND 4.0). The final published version (version of record) is available online at DOI:10.1016/j.applthermaleng.2016.05.019 Please refer to any applicable publisher terms of use.

1. Introduction
At present, global demands for transportation and energy are met through the combustion of fossil fuels
such as petroleum-based liquid fuels. As a result, emissions are an increasingly important consideration in
the design of aircraft engines. Among the different kinds of emissions, nitrogen oxides are a primary air
pollutant linked to photochemical smog, acid rain, and tropospheric ozone at ground-level, such as in the
case aircraft takeoff in airports. With increasing concerns about the effects of aircraft emissions on the
local air quality in the vicinity of airports, it has become necessary for engine manufacturers to develop
more environmentally friendly technologies that could be efficiently applied to the reduction of
combustion emissions.
Among the emission reduction technologies that have been developed for aircraft engines, steam or
water injection methods are becoming popular for NOx emission reduction at takeoff conditions due to
the low technology risk and cost. Several studies have been undertaken to understand the influence of
steam addition on fuel combustion and NOx emissions [1-5]. A preliminary aircraft performance
investigation including system design, engine performance, maintenance, and the cost implications of
using this technology in aircrafts at takeoff was carried out on at the NASA Glenn Research Center [6, 7].
Unlike old-style water-injection methods, this approach was found to be capable of reducing the specific
fuel consumption (SFC), NOx emissions, and turbine inlet temperatures. Furthermore, an experimental
and numerical study conducted by Benini et al. [8] showed that steam injection led to a reduction in the
NO formation in a proprietary turbojet chamber. Applying steam/water-injection schemes in future
aircraft and power plants could effectively reduce pollution and operating costs as well as improve
performance [6-13]. Zhang et al. integrated the partial oxidation gas turbine (POGT) with a steam injected
gas turbine cycle (STIG) and investigated the overall performance of this cycle and the influences of key
variables [9]. Calculation results showed that the combustor outlet temperature and the compressor

pressure ratio of the bottoming gas turbine cycle, and the temperature of partial oxidation affected the
efficiency and specific work output of this cycle obviously. Compared to other simple cycles, the
efficiency of this cycle was two percentage points higher, the oxygen concentration decreased, and the
cooling flow rate increased. The investigation of steam injected gas turbine cycle with steam conducted
by Elwekeel and Abdala [13] showed the total exergy destruction rate decreased with saturated steam
coolant temperature and the network and plant efficiency increased at a higher saturated steam coolant
temperature.
Generally, for all the current emission-prediction models, from the simple correlation-based model to
complicated high-fidelity CFD simulation, the determination of the basic combustor dimensions is a
prerequisite. Combustor design, which includes many disciplines such as aerodynamics, materials
science, combustion, mechanical design, and production engineering, is assumed one of the most
challenging aspects of gas turbine engine development [14]. Over many decades, many experimental data
and analysis results have been gathered as a result of scientific and industrial research across the world.
However, the empirical and analytical methods are still the most widely used tools for current gas turbine
combustor design. Mellor [15] and Lefebvre [16] established an extensive list of empirical and analytical
tools for application to combustor design. They illustrated the assumptions behind the design equations as
well as their range of validity. Mohammad [17] and Mattingly [18] collected these methods to devise a
combustor design procedure. In modern gas turbine combustors, the compressor outlet temperature is
always higher than 800K (the critical temperature of water is 647.5K). Thus, the injected water would be
vaporized in the front of the combustor when water is injected into the low-pressure compressors. This
would surely lead to the physical and chemical processes becoming more complicated in the combustor.
Therefore, this should be considered during the preliminary design stage to drive down development costs
and the business risk associated with the engine design.

This study set out to investigate the effects of steam addition on combustor design and performance at
the conceptual design stage. First, a preliminary design procedure for annular gas turbine combustors was
established. Two representative annular combustors were used to validate this model, based on the
required design requirements and operating conditions at the design point. This design program will also
enable the designer to fine-tune several critical parameters and check their impact on the combustor’s size
and performance in a timely manner. Next, the operating conditions were fixed and the combustor was
redesigned while taking steam addition technology into consideration. Finally, the combustor
performance with steam injection was calculated and compared with the results obtained under dry
conditions.
2. Design methodology
In this combustor design model, we split the combustor into a number of elements/components. Here,
“elements” do not simply refer to actual components. Some of the elements are actual components (e.g.
the primary zone and the swirler) while others are used for calculating the necessary gas and flow
parameters. Each element contains theoretical, analytical, and experimental correlations for calculating
the corresponding gas and steam properties, flow distribution, cooling flow control, steam addition
modification, or component dimensions/ performance.
2.1 Gas property model
The calculation of the flame temperature and gas properties is pivotal to flow field simulation.
Generally, the most commonly used procedure for temperature and composition computation is based on
the minimization of the Gibbs free energy technique. However, at the preliminary design stage, the Gibbs
free energy method involves long iteration procedures resulting in time-consuming and expensive
calculations. Therefore, a correlation technique, developed by Gulder [23, 24] is adopted to predict the

adiabatic flame temperature and gas properties of fuel/air combustion. Detailed definitions or the values
of the parameters in Eq. (1) and (2) are shown in Appendix 1.
2exp[ ( ) ] x y z
adT A (1)
2exp[ ( ) ] x y z
k AS (2)
2.2 Geometry model
Geometry calculation is conducted for the various parts of the design model. From an overview
prospective, the combustor may be tilted from the diffuser inlet to the transition duct exit. This tilt angle
between the combustor “mean line” and engine axis is assumed to be constant and varies until the exit
mean radius matches the high-pressure turbine mean radius. The combustor geometry model consists of a
diffuser, swirler, injector, primary zone, secondary zone, and dilution zone. The overall combustor layout
is shown in Fig. 1.
Fig.1. Gas turbine combustor layout [18].
2.2.1 Diffuser
The diffuser is the first component in a combustor system. The primary task of the diffuser is to slow
down the inlet flow Mach number to a level at which the flame in the burner is stable. There are different
types of diffusers in applications, such as the conventional flat-wall diffuser, the dump diffuser, and the
combined flat-wall + dump diffuser. In the diffuser design, the diffusion process is assumed to be

adiabatic but not isentropic, while the pressure loss efficiency is a key factor for determining the final
configuration. Previous research [11] has shown that, for simple configurations like the flat-wall diffuser,
this factor is related to the diffuser half-angle, and empirical relationships have been established to
compute this. As the required total area ratio exceeds the maximum ratio of the flat-wall diffuser, an
additional dump duct should be added to form a combined diffuser. Then, the total diffusion efficiency is
computed as shown in Eq. (3) [18]. Furthermore, to prevent flow separation, splitters, which divide the
diffuser duct into multiple passages, could be installed. The objective of diffuser design is to achieve the
desired burner inlet Mach number with minimum losses for given constraints.
2 2
1 1
2
(1 [ / ] ) 2( [ / ] 1)
( 1)
Dm m mtot
AR A A AR A A
AR
(3)
2.2.2 Design reference parameter and air distribution.
After achieving the required velocity reduction in the diffuser, the air flows into the burner where it
mixes and reacts with the injected fuel. Before starting to design the specific combustion zones, some
assumptions and important reference parameters should be illustrated first. Throughout the entire burner
design process, the total pressure, as well as the liner and casing cross-sectional areas in different zones is
assumed to be constant. A transition part is added at the end of the burner to reduce the outlet area and
thus choke the outflow. Given these hypotheses, a constant velocity is obtained for every jet flowing from
the casing into the liner. The pressure-loss coefficient, /t rP q , which is defined as the ratio of the total
pressure loss to the diffuser outlet dynamic pressure, is an important reference parameter during the
burner design process. This parameter can be assumed to be constant provided the combustor dimensions
are fixed.
1/3
sin
3/2
optimum( ) 1Ca g
Liner tPZ
tot r
A Pm
A m q
(4)
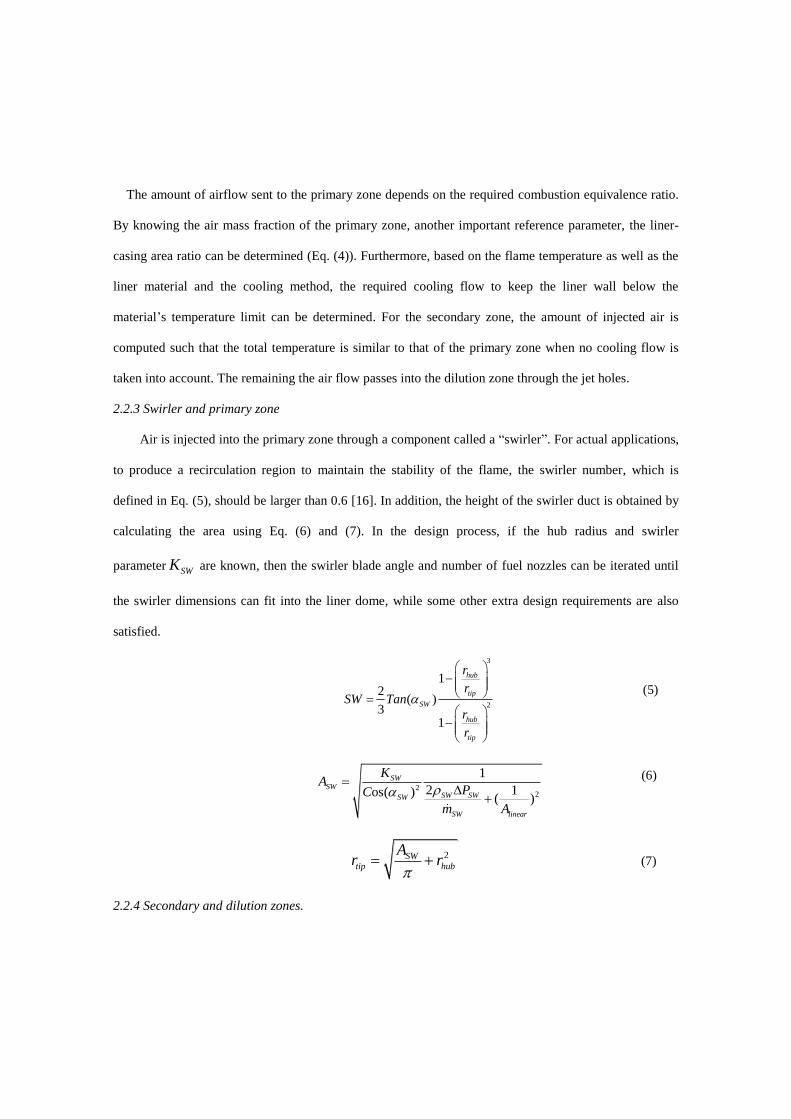
The amount of airflow sent to the primary zone depends on the required combustion equivalence ratio.
By knowing the air mass fraction of the primary zone, another important reference parameter, the liner-
casing area ratio can be determined (Eq. (4)). Furthermore, based on the flame temperature as well as the
liner material and the cooling method, the required cooling flow to keep the liner wall below the
material’s temperature limit can be determined. For the secondary zone, the amount of injected air is
computed such that the total temperature is similar to that of the primary zone when no cooling flow is
taken into account. The remaining the air flow passes into the dilution zone through the jet holes.
2.2.3 Swirler and primary zone
Air is injected into the primary zone through a component called a “swirler”. For actual applications,
to produce a recirculation region to maintain the stability of the flame, the swirler number, which is
defined in Eq. (5), should be larger than 0.6 [16]. In addition, the height of the swirler duct is obtained by
calculating the area using Eq. (6) and (7). In the design process, if the hub radius and swirler
parameter SWK are known, then the swirler blade angle and number of fuel nozzles can be iterated until
the swirler dimensions can fit into the liner dome, while some other extra design requirements are also
satisfied.
3
2
12
( )3
1
hub
tip
SW
hub
tip
r
rSW Tan
r
r
(5)
22
1
2 1os( )( )
SWSW
SW SWSW
SW linear
KA
PC
m A
(6)
2SWtip hub
Ar r
(7)
2.2.4 Secondary and dilution zones.

The flow then enters the secondary and dilution zones through the air jet holes. The diameter of the
holes is computed by specifying the penetration ratio of the dilution jets in the secondary and dilution
zones in Eq. (8) and (9) [18]. The corresponding dynamic pressure ratios in these two equations are
calculated based on the laws of conservation and the Boussinesq assumption. The length of both the
secondary zone and the dilution zone are determined by specifying the height-to-length ratios, which are
obtained according to the combustor design requirements and the engineering ranges.
max 1.15 (1 )jet annular
j liner jet
qY q
d q q (8)
1
max max1orifice liner
liner jd
Y Yd H
H dc
(9)
2 Case study and validation
This section addresses the testing and validation of the proposed preliminary design methodology. Due
to more open data on combustor parameters being available in the public domain, two typical turbofan
engines which are similar to the CFM56 series of engines [21] as well as the NASA Energy Efficient
Engine (E3) [22, 23] respectively, are established under the environment of the in-house software,
TurboMatch [24, 25]. Therefore, the combustor design operating parameters such as the total temperature
and pressure, and fuel /air flow rates can be obtained.
The takeoff condition is chosen as the design point. Other conditions are defined by the Federal
Aviation Administration (FAA) requirements: 1) Climb-out: the period during which the aircraft leaves
the mixing zone (85% power setting); 2) Approach: the period during which the aircraft enters the mixing
zone and during which it lands (30% power setting); and 3) Idle: the period while the aircraft is taxiing
before takeoff and after landing (7% power setting). These conditions are used as the off-design

calculation points. The validation and detailed engine performance data for these two engine models are
not shown here for brevity. The inlet operating values for these two model combustors under the design
condition are as shown in Table 1.
Table 1. Combustor inlet operating values at design condition
Parameters CFM56 model E3 model
Inlet total pressure (atm) 28.5 30.0
Inlet total temperature (K) 800.5 815.0
Fuel flow rate (kg/s) 1.30 1.35
Air flow rate (kg/s) 43.92 55.2
Table 2. Combustor preliminary design results
CFM56 model E3 model
Model Data[21] % Deviation Model Data[23] % Deviation
Overall dimension
Diffuser length (m) 0.123 0.119 2.56 0.085 0.099 -13.40
Primary zone length (m) 0.051 0.053 -3.98 0.035 0.034 1.48
Secondary zone length (m) 0.059 0.060 -0.85 0.041 0.040 2.56
Dilution zone length (m) 0.066 0.065 1.57 0.054 0.053 0.48
Linear height (m) 0.084 0.086 -2.06 0.074 0.076 -2.67
Casing height (m) 0.106 0.012 -11.08 0.097 0.119 -18.58
Jet holes
Fuel nozzle number (-) 20 20 0 19 20 -5.00 Secondary zone jet hole number (-) 79 80 -1.25 81 80 1.25
Dilution zone jet hole number (-) 120 120 0 120 120 0
Table 2 shows the calculated results obtained with the design model, compared with the open data
[21-23]. There is good agreement between the model results and the open data. The discrepancy for most
of the design parameters is within 5% but a noticeable discrepancy exists in the casing height of the
model combustors. The reason for this is that the casing height is assumed to be equal to the diffuser
outlet height for which the value is calculated according to the final total area ratio. This area ratio is a
function of both the flow property and the pressure loss coefficient, as shown in Eq. (3). This equation
requires the flat-wall diffuser pressure loss efficient and the flat-wall diffuser outlet area, which are
computed based on the experimental empirical correlations. At present, to the best of our knowledge,

most proposed diffuser design models are based on results obtained with specific diffusers. Therefore, the
inaccuracy of the diffusion efficiency models employed in this paper is the reason for this deviation. More
generic diffuser efficiency models should be investigated in the future.
In addition, to reduce the overall combustor length and avoid flow separation, two splitters are inserted
into the diffuser duct of the combustor, in much the same way as in the E3 engine. Thus, unlike the single
duct in the diffuser model of the CFM engine, there are three passages in the E3 diffuser model. The
diffuser design model presented in this paper enables the calculation of the parameters for single duct
diffusers. It should be noted that no other models capable of performing multiple duct diffuser
calculations appear to have been published in the literature. Accordingly, the calculation discrepancy for
the E3 model diffuser length is greater than that for the CFM diffuser model. The differences for other
parameters such as the burner zone length and number of air jet holes is small. In general, based on these
results, we could conclude that the method in this investigation demonstrates acceptable prediction
capabilities in the preliminary design stage and could therefore be adopted for the steam addition study
described in the next section.
3 Steam addition effect on combustor design
It is known that steam has a high heat capacity, which is nearly double that of dry air. Thus, the
property of the inlet gas mixture would be altered considerably when steam is injected in front of the
diffuser. In addition, due to its physical and chemical properties, steam could also effectively reduce the
flame temperature. The physical effect of steam addition is easy to understand while its chemical
influence is complicated. Research into chemical mechanisms [5] has shown that steam exhibits a high
chaperon efficiency (a parameter used to quantify the chemical enhancement effects of a third-body) in
elementary reactions for hydrocarbon fuel reactions. Thus, the most important terminating reaction H +
O2 + M = HO2 + M, by which a relatively inactive product HO2 product could be obtained by consuming
the active H atom, would be enhanced with the addition of steam. This could reduce the total heat release

to some extent. By using data generated by CEA, a correlation was developed to determine the flame
temperature as a function of the water to fuel mass ratio in Eq. (10) [26]:
0.151
, , (1 )flame wet flame dryT T (10)
, ,p mix i p iC wC (11)
In general, the assumption of an ideal gas for the gas mixture is reasonable under the normal gas
turbine combustor operating conditions. Therefore, the total heat capacity of the mixture is computed as
given by Eq. (11). Details of the steam heat capacity model are given in Reference [27]. Then, other
parameters such as the gas constant and the isentropic coefficient of the mixture could be obtained based
on their relationship with the heat capacity.
Four different steam mass fractions (steam/ (steam + dry air)): 5%, 10%, 15%, and 20%, which involve
the maximum steam content in an application, are selected to investigate the effect of the steam addition
on the combustor design in this section. To enable a comparison with the results of the previous reference
design, the operating conditions were not altered and the same total gas mixture flow rate was also used.
Fig. 2 shows the relative change in combustor design parameters compared to the dry air reference
parameters when different amounts of steam are added.

Fig. 2. Combustor design parameters change percent for the two model combustors at different steam
mass fractions (steam/ (steam + dry air)).
With either of these two annular model combustors, the results show that the relative change in the
design parameters of the diffuser is smallest, relative to that for the other components. As there is no
combustion, the diffuser design is mainly determined by the inlet gas properties and its type. In addition,
since the operating conditions are fixed in this study, the influence of steam addition on the diffuser
design is primarily through changing the gas properties like the gas constant and the isentropic
coefficient. Take the CFM engine model combustor as an example. When the steam mass fraction reaches
20%, the inlet mixture constant R increases from 287.2 J/(mol∙K) to 322.2 J/(mol∙K), while the isentropic
coefficient is reduced slightly from 1.35 to 1.32. Based on the flow area computation Eq. (12), the
dimension of the diffuser should be increased if the burner inlet Mach number and flow rate to be held
constant in this situation.
tot
tot
m TA
P wff
1
2 2( 1)1(1 )
2wff M M
R
(12)
As the steam mass fraction increases, both the length and the height are increased for those zones in the
burner, especially the primary zone. The equivalence ratio of the primary zone is kept the constant.
Therefore, the total flow rate in the primary zone will be increased, which directly results in the height of
the primary zone increasing. Furthermore, the length of the primary zone is obtained by calculating the
swirler dimension (blade tip diameter tipr ) and its swirl number. As shown in Eq. (5), the swirler area is
influenced by the diffuser outlet gas density. Based on the ideal gas state equation, when steam is added,
the mixture gas constant should be reduced. This could cause the mixture density to become smaller at the
diffuser outlet. Therefore, by taking this density value into the swirler model, both the swirler tip diameter
and swirl number are increased, which jointly result in the primary zone becoming longer. For other

zones such as the secondary and dilution zones, as no general and accurate models have so far been
developed to calculate the zone length, the height to length ratios are used to compute the length of these
two zones in this study. Therefore, the trends of the length change are in line with the change in their
height for these two zones.
In addition, another obvious change is the number of air jet holes. In the secondary zone, as the steam
mass fraction increases, the number of jet holes decreases, with the rate of decrease being proportional to
the injected steam mass fraction. For the dilution zone, however, the number of jet holes is increased with
steam addition when the steam mass fraction is less than 10%. After that, adding more steam would lead
to the number of holes being reduced and the reduction rate being greater than the rate of increase when a
small amount of steam is injected. From Eq. (8) and (9), it can be seen that the number of jet holes is
influenced by both the flow state and the flame temperature in the burner, which means that the number
of jet holes is determined by the coupled physical and chemical processes in the combustor. Therefore,
unlike the change in the diffuser dimensions that is determined only by thermodynamic process, the
variation in the number of jet holes is a non-monotonic transition.
When considering the number of fuel nozzles, these two model combustors exhibit different
characteristics. For the CFM engine model combustor, the number of fuel nozzles first decreased when
the steam mass fraction is less than 10%. Subsequently, adding more steam would not change the fuel
nozzle number until the steam content is quite high (a steam mass fraction of 15%), after which the fuel
nozzle number starts to fall again. For the E3 engine model combustor, however, the number of fuel
nozzles is not affected until the steam mass fraction reaches 20%. As the fuel nozzle is connected to the
swirlers that are installed in the dome of the burner, its amount is influenced by the dimensional
restriction of both the liner and the swirler. When steam is added to the air, the relative change in the
component design differs for these two model combustors, which results in the different characteristics of
the fuel nozzle number variation for these two model combustors. This is another instance where multiple

physical and chemical processes should be taken into account during combustor design with the addition
of steam.
4 Steam effect on combustor performance
Analysis and evaluation of the combustor performance is also an important step during the conceptual
design stage. Unlike the design calculation described in the previous section, the geometric size of the
combustor components and the power setting conditions will be kept the same as those for the reference
dry air design conditions. Thus, only the performance changes caused by the addition of steam need be
studied.
The pressure loss coefficients for both the diffuser and the burner are fixed as both the configuration
and dimensions of the combustors do not vary. The flow rates for different zones in the burner are
calculated based on the corresponding swirler and air jet hole areas. When analyzing the combustor
performance in the preliminary stage, many empirical and semi-empirical models are widely used for
calculating the general parameters such as efficiency and NOx emissions. However, as a 1D flow field
model is established in this paper, more detailed combustor performance information for different zones
could be calculated based on the flow equations.
Fig. 3. Pressure loss percentage vs steam mass fraction.

Fig. 3- 7 shows the change in the combustor performance for these two model combustors at different
steam mass fractions. In Fig. 3, as the steam mass fraction increases, the total pressure loss percentage of
the burner increases while the diffuser value is basically held constant. For CFM model, when the steam
mass fraction reaches to 15%, the pressure loss percentage becomes 4.87%. So the relative change of this
parameter for CFM combustor is 7.2%. Meanwhile, in E3 combustor, the relative change of this
parameter is about 7.4%. Based on the definition of the pressure loss coefficient, the burner pressure loss
is determined from the diffuser outlet dynamic pressure and the total pressure. Therefore, in this model,
the steam chemical effect on the pressure loss is neglected in the calculation and these two parameters are
altered due to the change in the gas properties with the addition of steam in the diffuser.
Fig. 4. Temperature at different zones vs steam mass fraction.
As shown in Fig. 4, the temperature in all of the zones is reduced when steam is injected into the
combustor. In addition, the temperature reduction rate becomes smaller when the steam content is already
high. Thus adding steam is not an economical way of reducing the combustor temperature if the steam
mass fraction is already high. In CFM model, as steam mass fraction increases to 15%, the outlet
temperature of primary zone decreases 396.3K while the secondary zone exit temperature reduces 291.3K.
For E3 model, the outlet temperature for both the primary zone and the secondary zone are almost the
same. It also reflects that the hot reactive zones are more sensitive to the addition of steam. Due to the

total air flow rate and the combustor configuration being kept the same, the air distribution for different
zones changes little, as shown in Fig. 5.
Fig. 5. Air distribution at different zones vs steam mass fraction.
Since the equivalence ratio is defined according to the dry air content in the mixture, it increases
linearly with the steam mass fraction, as shown in Fig. 6. However, it should be noted that the
equivalence ratio here is merely used as the measure of the air/fuel ratio, not as an indicator of the real
temperature. As the steam mass fraction can reach a value as high as 15%, the equivalence ratio in the
secondary zone is nearly equal to the stoichiometric ratio. The high flame temperature under the
stoichiometric ratio would partially offset the heat release reduction caused by the addition of steam. This
partial heat compensation in the secondary zone is illustrated in Fig. 4, which shows that the outlet
temperature of the secondary zone approaches that of the primary zone when the steam mass fraction
reaches 15%.

Fig. 6 Equivalence ratio at different zones vs steam mass fraction.
Generally, to guarantee that the flow field in the turbine will not influence the upstream flow in the
combustor, the combustor outlet flow is usually designed to be in the choked state. As shown in Fig. 7,
for a given total flow rate, if steam is mixed with the air in front of the diffuser, the combustor outlet
Mach number will be decreased, leading to the outflow being unchoked. Since the flow area, the total
pressure and temperature and the mass flow rate are fixed, it can be seen from Eq. (12) that steam
addition influences the Mach number primarily as a result of changing the gas constant and the isentropic
coefficient. As the density becomes larger as a result of the temperature falling at the outlet, the velocity
is reduced to maintain a fixed outflow rate. Thus, the Mach number will not reach 1 unless the outlet area
of the transition duct is designed to be varied when steam is added.

Fig. 7 Mach number at different zones vs steam mass fraction.
5 Conclusion
A combustor design procedure which takes the steam injection into account was established and
validated for studying the effect of steam addition on the combustor design and performance at the
conceptual stage.
The results show both the height and the length for different components in the combustor should be
designed larger. Comparison of the relative change of the design dimension illustrates that the dimension
variation extent is smallest for the diffuser where no combustion exists while for components which are in
the drastic combustion environment like the primary zone, the dimension change is remarkable even not
so much steam is added. The demand of the amount of air jet holes at the secondary zone would be
reduced while the dilution zone needs more air jet holes when steam is injected. More specifically, the
height of the combustor casing needs to be increased nearly 10% if 20% of steam in the inlet mixture is
added.
Furthermore, adding steam could reduce the temperature in the burner. As the steam mass fraction
increases, the outlet temperature of the secondary zone approaches that of the primary zone due to the
heat compensation effect caused by higher equivalence ratio in the secondary zone. Other combustor

performance, like the total pressure loss percent and the combustor outlet Mach number, would be
slightly deteriorated with steam addition.
Funding
China Scholarship Council is gratefully acknowledged for the grant to R. Xue. This work has been
supported by the National Natural Science Foundation of China (Grant No. 51576166).
Declaration of conflicting interests
The authors declare that there is no conflict of interest.
References
[1] V. Babkin and A. V'yun, Effect of water vapor on the normal burning velocity of a methane-air
mixture at high pressures, Combust. Explo. Shock. 7(3) (1971) 339-341.
[2] E.V. Gurentsov, O.G. Divakov and A.V. Eremin, Ignition of multicomponent hydrocarbon/air
mixtures behind shock waves, High Temp 40(3) (2002) 379-386.
[3] D.J. Hwang, J.W. Choi, J. Park, et al., Numerical study on flame structure and NO formation in CH4–
O2–N2 counterflow diffusion flame diluted with H2O, Int. J. Energy. Res. 28 (2004) 1255–1267.
[4] A. Mazas, B. Fiorina, D. Lacoste, et al., Effects of water vapor addition on the laminar burning
velocity of oxygen-enriched methane flames, Combust Flame 158(12) (2011) 2428-2440.
[5] S. Göke, M. Füri, G. Bourque, et al., Influence of steam dilution on the combustion of natural gas and
hydrogen in premixed and rich-quench-lean combustors, Fuel Process Technol 107 (2012) 14-22.
[6] D.L. Daggett, Water misting and injection of commercial aircraft engines to reduce airport NOx,
NASA Contractor Report, Report no.212957, March 2004. Ohio: NASA’s Glenn Research Center.
[7] V. Balepin, C. Ossello and C. Snyder, NOx emission reduction through water injection in Commercial
Jets through water injection, NASA Contractor Report, Report no. 211978, October 2002. Ohio: NASA’s
Glenn Research Center.
[8] E. Benini, S. Pandolfo and S. Zoppellari, Reduction of NO emissions in a turbojet combustor by direct
water/steam injection: Numerical and experimental assessment, Appl. Therm. Eng. 29(17) (2009) 3506-
3510.
[9] S.J. Zhang, J.L. Chi, Y.H. Xiao, Performance analysis of a partial oxidation steam injected gas turbine
cycle, Appl. Therm. Eng. 91(2015) 622-629.
[10] G. Heyen, B. Kalitventzeff, A comparison of advanced thermal cycles suitable for upgrading existing
power plant, Appl. Therm. Eng. 19 (1999) 227-237.
[11] A.H. Mamaghani, B. Najafi, A. Shirazi, F. Rinaldi, Exergetic, economic, and environmental
evaluations and multi-objective optimization of a combined molten carbonate fuel cell-gas turbine system,
Appl. Therm. Eng. 77 (2015) 1-11.
[12] Carmona, J.. Gas turbine evaporative cooling evaluation for Lagos–Nigeria, Applied Thermal
Engineering, 89 (2015) 262-269.
[13] F. N.M. Elwekeel, A. M.M. Abdala, Effect of mist cooling technique on exergy and energy analysis
of steam injected gas turbine cycle, Applied Thermal Engineering, 98 (2016) 298-309.
[14] Timothy C. Lieuwen and Vigor Yang, Gas Turbine Emissions, London: Cambridge University Press,
2013, p.3.
[15] A.M. Mellor, Design of modern turbine combustors, London:Academic Press, 1990.
[16] Lefebvre and H. Arthur, Gas turbine combustion, 3rd ed. Philadelphia: Taylor& Francis, 1999.
[17] B.S. Mohammad and S.M. Jeng, Design procedures and a developed computer code for preliminary
single annular combustor design. In: 45th
AIAA/ASME/SAE/ASEE Joint Propulsion Conference&
Exhibit, Denver, Colorado, 2-5 August, paper no. AIAA 2009-5208. New York: ASME.

[18] J.D. Mattingly, W.H. Heiser and D.T. Pratt, Aircraft Engine Design. 2nd ed. Reston: American
Institute of Aeronautics and Astronautics, 2002, p. 235.
[19] O.L. Gulder, Flame temperature estimation of conventional and future jet fuels, J. Eng. Gas Turb
Power 108(2) (1986) 376-380.
[20] O.L. Gulder, Combustion gas properties: Part III—prediction of the thermodynamic properties of
combustion gases of aviation and diesel fuels, J. Eng. Gas Turb Power 110(1) (1988) 94-99.
[21] W. Dodds, Engine and aircraft Technologies to reduce emissions, In: UC Technology Transfer
Symposium -Dreams of Flight. San Diego, USA, 1 March 2002.
[22] D. Burrus, P.E. Sabla and D.W. Bahr, Energy Efficient Engine (E3): component development and
integration of single-annular combustor technology, Report, NASA Center, USA, October 1980.
[23] D. Burrus, P.E. Sabla and D.W. Bahr, et al., Energy Efficient Engine (E3): combustion system
component technology performance, Report, NASA Center, USA, March 1984.
[24] J.R. Palmer, The TURBOMATCH scheme for gas turbine, Unpublished TURBOMATCH manual,
September 2011.
[25] A.P. Vassilios. Gas turbine performance simulation, Unpublished lecture notes, September 2011.
[26] M. Molnar and C.J.Marek, New reduced two-time step method for calculating combustion and
emission rates of Jet-A and methane fuel with and without water injection. In: 38th Joint Propulsion
Conference an d Exhibit cosponsored by the AIAA, ASME, SAE, and ASEE, Indiana,USA, 7-10 July, 2
002, paper no. NASA/TM 2004-213046. New York: ASME.
[27] D. Bucker, R. Span and W. Wagner, Thermodynamic property models for moist air and combustion
gases, J Eng Gas Turb Power 125(1) (2003) 374-384.
Appendix 1
Flame temperature equation

Based on the CEA results and the hydrocarbon fuel combustion performance, Gulder [19] proposed an
expression to predict the adiabatic flame temperature of jet fuels. The equation is applicable in the
following ranges: 0.3 1.6 , 0.1 a 7.5 aMP P MP , 275 950uK T K , and 0.8 / 2.5H C .
2exp[ ( ) ] x y zadT A (A1.1)
where 2
1 1 1x a b c (A1.2)
2
2 2 2y a b c (A1.3)
2
3 3 3z a b c (A1.4)
is the dimensionless pressure 0/P P where 0 0.1013P MPa , the dimensionless initial temperature
0/T T where 0 300T K , the H/C atomic ratio, for 1 where is the fuel-air equivalence
ratio and 0.7 for 1 , and A , , , , ia , ib and ic are constants. In order to have an
accurate prediction equation, four sets constants have been determined for the following ranges:
0.3 1.0 and 0.92 2
0.3 1.0 and 2 3.2
1.0 1.6 and 0.92 2
1.0 1.6 and 2 3.2
The values of constants for each range classification are listed in Table A.1
Table A.1 Constants for flame temperature estimation equation [19]
Constants 0.3 1.0 1.0 1.6
0.92 2 2 3.2 0.92 2 2 3.2
A
2361.7644
0.1157
-0.9489
-1.0976
2315.752
-0.0493
-1.1141
-1.1807
916.8261
0.2885
0.1456
-3.2771
1246.1778
0.3819
0.3479
-0.20365

1a
1b
1c
2a
2b
2c
3a
3b
3c
0.0143
-0.0553
0.0526
0.3955
-0.4417
0.1410
0.0052
-0.1289
0.0827
0.0106
-0.045
0.0482
0.5688
-0.5500
0.1319
0.0108
-0.1291
0.0848
0.0311
-0.0780
0.0497
0.0254
0.2602
-0.1318
0.0042
-0.1781
0.0980
0.0361
-0.0850
0.0517
0.0097
0.5020
-0.2471
0.0170
-0.1894
0.1037
Combustion gas properties equation
The equations [20] are applicable in the following ranges: 0 1.0 , 0.1 a 7.5 aMP P MP ,
300 2500uK T K , and 0.8 / 2.5H C .
2exp[ ( ) ] x y z
k AS (A1.5)
For the temperature range 1500 2500T K
1 pC (A1.6)
/1000S t T (A1.7)
2 3 41.2358 1.03316 2.63325 3.77256 1.07368t t t t (A1.8)
2
1 1 1x a b t c t (A1.9)
2
2 2 2y a b t c t (A1.10)
2
3 3 3z a b t c t (A1.11)
where 0.45 (A1.12)
For the temperature range 400 1500T K
0.5
2 pC (A1.13)

2( 0.5)S (A1.14)
2
1 1 1x a b c (A1.15)
2
2 2 2y a b c (A1.16)
2
3 3 3z a b c (A1.17)
And is the dimensionless temperature, i.e.,
/ 300T (A1.18)
For the temperature range 300 2500T K
3 MW (A1.19)
2( 1)S (A1.20)
x , y , z and are the same as those given by equations (A1.15)- (A1.18).
A , , , , ia , ib and ic are constants, and their values are tabulated in Table A.2 for the two
temperature ranges for both pC and MW .
Table A.2 Constants for combustion gas properties estimation equation [19]
Const. Specific Heat, pC Molecular Weight, MW
400 1500T 1500 2500T 300 1500T 1500 2800T
A 0.99318 0.91153 30.0346 0.20501
0.006 1 0.00266 -0.01537
0.00098 0.02103 -0.00121 0.000091
-0.96083 1.8395 -6.48722 232.731
1a 0 -0.33224 0 0.000013
1b 0 0.3948 0 0.00112
1c 0 -0.11764 0 -0.000029
2a 0.06712 0.27269 0 -0.00435
2b 0.01452 -0.57967 0 -0.00643

2c -0.002282 0.15654 0 -0.00176
3a -0.00405 0.02401 0.02478 0.02502
3b 0.01853 -0.53774 -0.02762 -0.02809
3c -0.00246 0.323 0.00219 0.00232
Appendix 2
Nomenclature
A area
1A diffuser inlet area
sinCa gA casing area
LinerA liner area
mA flat-wall diffuser outlet area
AR combined flat-wall + dump diffuser area ratio
SWA swirler area
dc hole discharge coefficient
,p mixC mixture gas heat capacity
,p iC ith component gas heat capacity
jd jet diameter
orificed dilution hole diameter
linerH , _H L linear height
SWK swirler design parameter

_L diff diffuser length
_L PZ primary zone length
_L SZ secondary zone length
_L DZ dilution zone length
_H ref casing height
_N FN fuel nozzle number
_N SN number of dilution holes for the secondary zone
_N DN number of dilution holes for the dilution zone
M Mach number
m mass flow rate
PZm air flow rate of the primary zone
SWm swirler mass flow rate
totm total air flow rate
totP total pressure
SWP pressure drop across swirler
tP total pressure loss
annularq annulus flow dynamic pressure
linerq linear flow dynamic pressure
jetq jet dynamic pressure
rq reference dynamic pressure
R gas constant
hubr swirler hub raidus
tipr swirler tip raidus
SW swirl number
,flame wetT flame temperature with steam addition
,flame dryT flame temperature at dry air condition
totT total temperature
wff weight flow function
iw ith component gas mass fraction
maxY maximum radial jet penetration
SW swirler blade angle
SW air density through swirler
tot diffusion efficiency of the combined flat-wall + dump diffuser
Dm diffusion efficiency of the flat-wall diffuser
steam to fuel mass ratio
isentropic coefficient