Effect of soil moisture on landmine detection using Ground...
10
Effect of soil moisture on landmine detection using Ground Penetration Radar Timothy Miller a , Brian Borchers b , Jan M. H. Hendrickx a , Sung-Ho Hong a , Henk A. Lensen c , Piet B.W. Schwering c , and Jan Rhebergen c a Department of Earth and Environmental Sciences, New Mexico Tech, Socorro, NM 87801 b Department of Mathematics, New Mexico Tech, Socorro, NM 87801 c TNO Physics and Electronics Laboratory, The Hague, the Netherlands ABSTRACT The contrast in relative dielectric constant between landmines and the surrounding soil is one of the most important elements for radar detection purposes. For most geologic materials the relative dielectric constant lies within the range of 3-30, with dry sand at the lower end of this range at about 3-5. Nonmetallic landmines have a dielectric constant range of 3.2-9.8 whereas metallic landmines have a much higher relative dielectric constant. In previous work, literature data were used to compose a MATLAB model that determines whether or not field conditions are appropriate for use of GPR instruments. This model has been verified for dry and moist sand, silt, and clay soils in New Mexico. The objective of this paper is to validate this model over a wider range of soil texture and soil moisture conditions. Therefore, GPR measurements will be taken on experimental test facilities for landmine detection at Yuma Proving Grounds in Arizona and at the TNO Physics and Electronics Laboratory in The Netherlands. These facilities cover a wide range of soil textures from ferruginous sand to clay and peat as well as many levels of soil moisture. Keywords: Landmine Detection, Ground Penetrating Radar, Dielectric Constant, Soil Moisture. 1. INTRODUCTION Many researchers have studied the effects of soil physical properties on the performance of Ground Penetrating Radar (GPR) systems in locating buried landmines and have discovered the following. Fritzsche 1 showed through modeling that GPR signals at 900 MHz would be strongly attenuated in moist soils and in clay soils especially. Trang 2 found in both simulations and actual experiments with a GPR operating in the 600-800 MHz frequency range that it was easier to detect nonmetallic mines when the soil was moist. Johnson and Howard 3 found that the EG&G vehicle mounted GPR system was better able to detect nonmetallic mines when the soil was relatively moist at the Energetic Materials Research and Testing Center test site (New Mexico Tech, Socorro, New Mexico). Scheers et al. 4 modeled the performance of an ultra wide band GPR operating in the 1-5 GHz range for detection of metallic mines, and found that the maximum depth at which the mine could be detected decreased as the soil moisture increased. In Borchers et al. 5 we presented a suite of models from the literature that can be used to predict the electrical properties of soil from the soil physical properties: bulk density and soil texture. Then from these electrical properties we predicted the amount of loss from attenuation that would occur for each soil type as a function of increasing soil water content. From this model we found that in general, the best conditions for landmine detection using GPR are extremely dry conditions (less than 1% volumetric soil water content) or moist conditions (soil water contents exceeding 15%). The objectives of this paper are (1) to use these models to predict the amount of loss that will occur to radar waves under dry and moist field conditions for a range of soil textures and (2) to validate our model by presenting radar images from our Socorro, New Mexico site and other landmine testing sites around the world. 2. METHODS AND MATERIALS 2.1 New Mexico Tech, New Mexico For this study three soils were chosen from the Socorro, New Mexico area on the basis of their USDA textural classification. Two of the soil types are located at the Sevilleta National Wildlife Refuge and the other at the Bosque Del Apache Wildlife Refuge. The first soil at the Sevilleta site is a dry sandy soil, with typical soil water content of 5% and a soil texture of 95% sand, 2% silt, and 3% clay. The bulk density of the soil is approximately 1.6 g/cm 3 . The second soil at the Sevilleta site is a silty clay loam with similar soil water content and a soil texture of 2.4% sand, 65.7% silt, and 31.9% clay. The bulk density
Transcript of Effect of soil moisture on landmine detection using Ground...

Effect of soil moisture on landmine detection using Ground Penetration Radar
Timothy Millera, Brian Borchersb, Jan M. H. Hendrickxa, Sung-Ho Honga, Henk A. Lensenc, Piet B.W.
Schweringc, and Jan Rhebergenc
aDepartment of Earth and Environmental Sciences, New Mexico Tech, Socorro, NM 87801 bDepartment of Mathematics, New Mexico Tech, Socorro, NM 87801
cTNO Physics and Electronics Laboratory, The Hague, the Netherlands
ABSTRACT
The contrast in relative dielectric constant between landmines and the surrounding soil is one of the most important elements for radar detection purposes. For most geologic materials the relative dielectric constant lies within the range of 3-30, with dry sand at the lower end of this range at about 3-5. Nonmetallic landmines have a dielectric constant range of 3.2-9.8 whereas metallic landmines have a much higher relative dielectric constant. In previous work, literature data were used to compose a MATLAB model that determines whether or not field conditions are appropriate for use of GPR instruments. This model has been verified for dry and moist sand, silt, and clay soils in New Mexico. The objective of this paper is to validate this model over a wider range of soil texture and soil moisture conditions. Therefore, GPR measurements will be taken on experimental test facilities for landmine detection at Yuma Proving Grounds in Arizona and at the TNO Physics and Electronics Laboratory in The Netherlands. These facilities cover a wide range of soil textures from ferruginous sand to clay and peat as well as many levels of soil moisture. Keywords: Landmine Detection, Ground Penetrating Radar, Dielectric Constant, Soil Moisture.
1. INTRODUCTION
Many researchers have studied the effects of soil physical properties on the performance of Ground Penetrating Radar (GPR) systems in locating buried landmines and have discovered the following. Fritzsche1 showed through modeling that GPR signals at 900 MHz would be strongly attenuated in moist soils and in clay soils especially. Trang2 found in both simulations and actual experiments with a GPR operating in the 600-800 MHz frequency range that it was easier to detect nonmetallic mines when the soil was moist. Johnson and Howard3 found that the EG&G vehicle mounted GPR system was better able to detect nonmetallic mines when the soil was relatively moist at the Energetic Materials Research and Testing Center test site (New Mexico Tech, Socorro, New Mexico). Scheers et al.4 modeled the performance of an ultra wide band GPR operating in the 1-5 GHz range for detection of metallic mines, and found that the maximum depth at which the mine could be detected decreased as the soil moisture increased. In Borchers et al.5 we presented a suite of models from the literature that can be used to predict the electrical properties of soil from the soil physical properties: bulk density and soil texture. Then from these electrical properties we predicted the amount of loss from attenuation that would occur for each soil type as a function of increasing soil water content. From this model we found that in general, the best conditions for landmine detection using GPR are extremely dry conditions (less than 1% volumetric soil water content) or moist conditions (soil water contents exceeding 15%). The objectives of this paper are (1) to use these models to predict the amount of loss that will occur to radar waves under dry and moist field conditions for a range of soil textures and (2) to validate our model by presenting radar images from our Socorro, New Mexico site and other landmine testing sites around the world.
2. METHODS AND MATERIALS
2.1 New Mexico Tech, New Mexico For this study three soils were chosen from the Socorro, New Mexico area on the basis of their USDA textural classification. Two of the soil types are located at the Sevilleta National Wildlife Refuge and the other at the Bosque Del Apache Wildlife Refuge. The first soil at the Sevilleta site is a dry sandy soil, with typical soil water content of 5% and a soil texture of 95% sand, 2% silt, and 3% clay. The bulk density of the soil is approximately 1.6 g/cm3. The second soil at the Sevilleta site is a silty clay loam with similar soil water content and a soil texture of 2.4% sand, 65.7% silt, and 31.9% clay. The bulk density

of the soil is approximately 1.3 g/cm3. The soil at the Bosque site is a clay soil, with an average soil water content range of approximately 4% to 45% depending on the time of year. It has a soil texture of 1.3% sand, 26.5% silt, and 72.2% clay. The bulk density of this soil is approximately 1.8 g/cm3. The soil texture and bulk density of these samples were determined using standard methods.6,7 The simulant landmines used in this experiment were completely inert and composed of Dow Corning 3110 RTV Silicon Rubber. They are designed to simulate a Netherlands landmine of type NR26, which is a low-metal landmine and has dimensions of 30.0 cm in diameter and 11.5 cm in height. The TNO Physics and Electronics Laboratory in the Netherlands, which specializes in producing inert landmines for detection purposes, manufactured the landmines. For imaging the simulant landmines we used a Ground Penetrating Radar (pulseEKKO 1000) system, which is manufactured by Sensors and Software Ltd, Canada. We chose their 900 MHz antenna configuration that has an antenna separation of 17 cm. For data collection, we conducted a reflection survey with a step size of 2.0 cm, 64 stacks per trace, Automatic Gain Control (AGC), and we set our trace correction to DEWOW. These parameters provided enough spatial resolution to locate the simulant landmines under most of the field conditions encountered. For the three soils listed above, we chose a 2 meters by 2 meters study area. Inside the study area we positioned a wooden frame with dimensions of 1 meter by 2 meters. The frame was used to house the target landmine and provided a reference frame for the Ground Penetrating Radar system. The target landmine was buried inside the frame area and its location was recorded. For the sand and silt sites, we placed the target landmine 60 cm from the end and 50 cm from the side of the frame and buried it 11 cm below the ground surface. For the clay site, the target landmine was also buried 11 cm deep, but it was positioned 100 cm from the end and 50 cm from the side of the frame. We also placed a second landmine outside the wooden frame, which was used to observe soil water content. The soil water content was recorded using TDR probes6 that were placed around this second landmine. There were 4 TDR probes in total that were buried 3, 8, 23, and 28 cm below the ground surface. To apply water to the sites we used a sprinkler system for the sand and silt sites and “ponding” for the clay site. Before and after the application of water we measured the volumetric soil water content with the TDR probes and collected GPR data. The raw radar data was then processed using Seismic Un*x, a program developed by the Center for Wave Phenomena, Colorado School of Mines. In processing the data we zeroed out the ground bounce and applied a low pass filter to each image. 2.2 Yuma Proving Grounds, Arizona For this study we visited the Yuma Proving Ground (YPG) Countermine Testing and Training Range. At their countermine range we tested our GPR on a variety of landmines. There were two soil types encountered at the YPG Countermine Testing and Training Range. The first soil encountered was at the handheld detector mine lanes, which is a loamy sand soil with a soil texture of 79.6% sand, 13.9% silt, and 6.5% clay. The second soil encountered was at the vehicle testing lanes. This soil is a sandy loam with a soil texture of 57% sand, 28% silt, and 15% clay. Both of these soils have bulk densities of approximately 1.6 g/cm3 and are very dry soils with soil water contents typically around 1%. The landmines buried at the Countermine Testing and Training Range were real targets with the exception of their detonators being removed for safety purposes. In this study we will report on two metallic antitank landmines imaged at this site, which include the TM-62M, and the M15. Both of these landmines were buried 12.7 cm below the ground surface. The GPR system used in this study, methods of water content measurement, watering scheme, and image processing were all the same as listed in the Socorro, New Mexico study. 2.3 Physics and Electronics Laboratory, The Netherlands The TNO Physics and Electronics Laboratory has four GPR systems at its disposal. Two of these are considered handheld systems and the other two are more suitable for mounting on a vehicle. These GPR systems were all tested extensively at the TNO test site. This site consists of six test lanes (w = 3m, l = 10m, d = 1.5 m) with different soil types; sand, clay, peat, ferruginous soil, forest soil, and rocky soil. The latter soil type has since been replaced by a test lane with vegetation (i.e. grass). Ground water levels typical for each type of soil are simulated by means of wells that are connected to each test lane. All test lanes have a selection of antitank (AT) and antipersonnel landmines (AP) buried in them at various depths. Some are on the surface, some are buried flush with the soil surface, and some are buried deeper depending on if it is an AP or AT mine. A measurement bridge with an automated moving platform is used to mount the GPR sensors on. Precise sensor position information is determined by means of a laser distance meter. A more detailed description of this test site including some drawings and pictures can be found in Jong et al. 8 To complement the tests done in the US it was decided to look at

the GPR results from the TNO test lanes filled with peat and ferruginous soil. These soil types may present a more challenging scenario for GPR systems, as the results will show. The GPR system used was a PulseEkko 1000 with a 900MHz antenna fitted to it. Stepping was set at 1 cm intervals. The radar was mounted in such a way, that when moving it over the test lane, it would just miss the ground surface at its highest point. In practice this means that the distance between the antennas and the surface was mostly around 2 cm. Apart form positioning information, meteorological information is also (permanently) logged and available. 2.3.1 TNO-FEL test lanes soil characteristics The peat and ferruginous soils (and others) were analyzed by an independent laboratory certified to this end. The results of the analysis that characterize the soils are presented in Table 1. The moisture levels were measured with a handheld “Trime” TDR. The prod-like sensor was inserted into two places separated by about a meter. Two measurements were taken to average out possible wet spots.
3. MODEL PREDICTIONS For a complete overview of the mathematical models used in this section see Borchers et al.5. These models have been integrated into a MATLAB package, which can be found online at http://www.nmt.edu/~borchers/dielectrics.html. The model inputs consist of the volumetric soil water content θ, the frequency f, the fraction of sand particles S, the fraction of clay particles C, the density of the soil particles ρS (a typical value is 2.66 g/cm3), and the bulk density of the soil ρB. Figures 1 and 2 show the attenuation losses and the bulk dielectric constant for a GPR system operating at 900 MHz at the Sevilleta sand site. Figure 2 shows that for low water contents (less than 5%) the bulk dielectric constant of the soil will be very close to the dielectric constant of nonmetallic landmines (between 3.2-9.8). As volumetric soil water content increases the bulk dielectric constant of the soil increases linearly, where the dielectric constant of the nonmetallic landmine will remain low. Figure 1 shows that as the soil water content increases, the attenuation of the radar wave will remain below 20 db/m up to 40% soil water content.

Figure 1 Attenuation loss for Sevilleta sand soil. Figure 2 Dielectric constant for the Sevilleta sand soil.
Figures 3 and 4 show the amount of attenuation and the bulk dielectric constant for a silt loam soil at 900 MHz as a function of increasing soil water content. A similar linear trend in dielectric constant (as seen in Figure 2) can be seen for the silt loam soil (See Figure 4). However, the silt loam soil has a much larger interval over which the bulk dielectric constant remains relatively low per increase in soil water content. Over the zero to 10% soil water content range, the real part of the dielectric constant of the soil in Figure 4 is below 5, where in Figure 2 by 10% soil water content, the real part of the dielectric constant is above 10. This buffering of bulk dielectric constant as soil water content increases in silt loam soil may have the effect of making the landmine less visible over a wider range of soil water contents. At saturation (40% volumetric soil water content), for the silt loam soil the bulk dielectric constant is only about 20, where in the sand soil the dielectric constant is about 40. Figure 3 shows that for the silt loam soil, the loss due to attenuation increases rapidly with an increase in soil water content. The attenuation for the silt loam soil at 40% soil water content is 50 db/m where for the sand soil it is only about 20 db/m at this same soil water content. These two effects, larger signal attenuation and buffering of bulk dielectric contrast, may result in a poor radar image quality for silt loam soils.
Figure 3 Attenuation loss for Sevilleta silt loam soil. Figure 4 Dielectric constant for the Sevilleta silt loam soil.
For the Bosque clay soil, Figures 5 and 6 show how our model predicts the loss of the radar signal due to attenuation, and the bulk dielectric constant of the soil as functions of increasing soil water content. The clay soil is similar to the silt loam soil

in that attenuation increases rapidly as soil water content increases and that the dielectric contrast between the soil and the landmine is buffered for low water contents (Compare Figures 3 to 5, and 4 to 6). The clay soil seems to have the most amount of radar signal attenuation when compared to the sand and silt loam soil. This is due to the high electrical conductivity and other double layer properties of clay soils. Figure 5 shows that the clay soil will have a loss in signal strength of about 55 db/m due to attenuation at 40% soil water content.
Figure 5 Attenuation loss for the Bosque clay soil. Figure 6 Dielectric constant for the Bosque clay soil.
These previous figures illustrate that sand soils undergo large increases in bulk dielectric constant and relatively little increase in signal attenuation as the soil water content is raised to saturation. Silt loam and clay rich soils undergo smaller changes in bulk dielectric constant between about zero and 20% soil water content but then increase steadily to significant values at saturated soil water conditions. The loss due to attenuation as soil water content increases for the silt and clay soils are very high when compared to the sand soil, with the clay soil showing the greatest loss at saturated soil water contents. 4. RESULTS FROM LANDMINE TEST SITES
4.1 Results from New Mexico Tech test sites In this section we present wiggle trace plots of our processed GPR data. Figure 7 shows two GPR wiggle trace plots for the Sevilleta sand site. The first plot in this figure was imaged under normal field conditions (7% volumetric soil water content), and the second plot was imaged after raising the volumetric soil water content above the landmine to 29%. The simulant landmine in this figure is indicated by the hyperbolic feature below the 20 trace mark on the horizontal scale. This figure clearly shows that raising the volumetric soil water content of dry sandy soils can enhance the ability of the GPR to image landmines, which coincides with what our model predicts. Figure 8 shows two GPR wiggle trace plots for the Sevilleta silt loam site. The first plot was imaged under dry field conditions at about 9% volumetric soil water content, and the second was imaged after raising the water content to about 38% above the simulant landmine. The landmine in the first plot is difficult to see, showing only a slight indication of a diffraction tail. This is because of the low contrast between the bulk dielectric constant of the soil and the landmine. The simulant landmine in the second plot is indicated by the hyperbolic feature under the 20 trace mark on the horizontal scale. This figure demonstrates that for dry silt loam soils the image of buried landmines will improve by increasing soil water content. Applying water to very dry clay soils, however, does not appear to enhance detection. Figure 9 shows wiggle trace plots from the Bosque Del Apache clay site. The first plot in Figure 9 is an image taken during dry field conditions (5% volumetric soil water content), and the second plot is an image from the same site after applying 2700 liters of water (raising the volumetric soil water content to 36%). The landmine is detectable under the dry clay soil conditions shown in the first plot. The landmine in this figure is also shown by the hyperbolic feature directly below the 35 trace mark on the horizontal
Figure 7 Wiggle trace plots of a silicon rubber simulant antitank landmine buried 11 cm below the ground surface at the Sevilleta sand soil site, both plots imaged using 900 MHz GPR system .
Figure 8 Wiggle trace plots of a silicon rubber simulant antitank landmine buried 11 cm below the ground surface at the Sevilleta silt loam soil site, both plots imaged using 900 MHz GPR system.

Figure 9 Wiggle trace plots of a silicon rubber simulant antitank landmine buried 11 cm below the ground surface at the Bosque clay soil site, both plots imaged using 900 MHz GPR system.
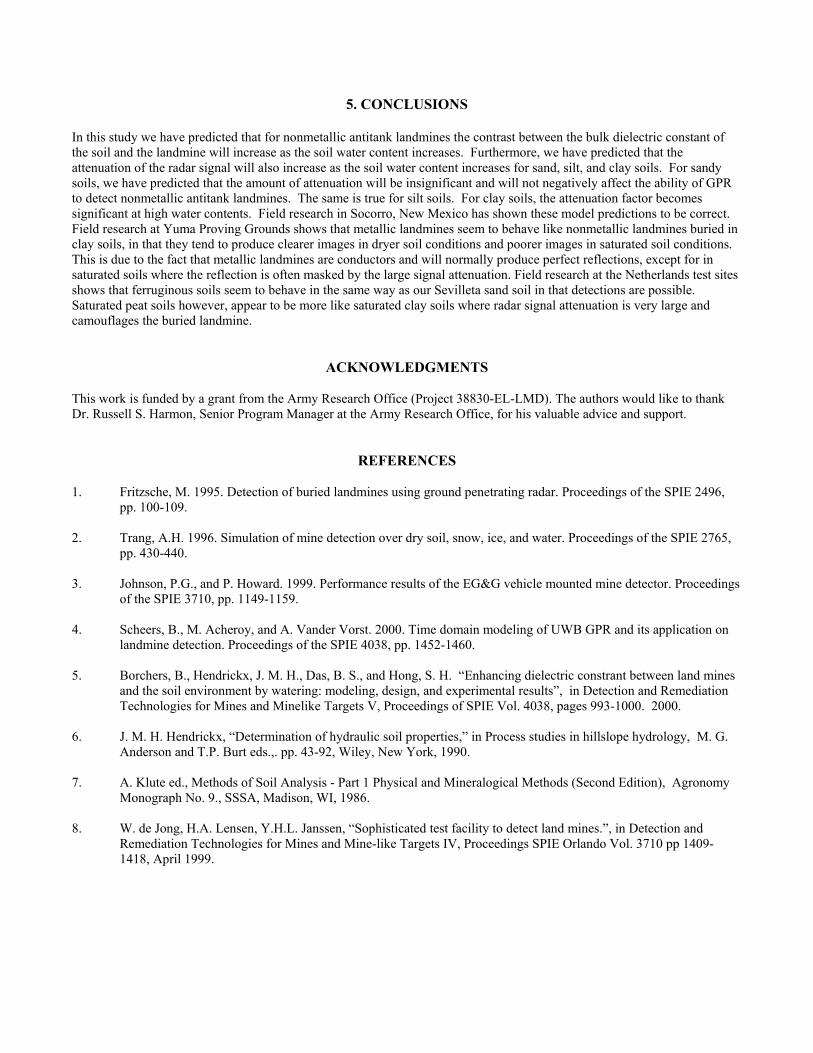
scale. After application of water (See second plot, Figure 9) the landmine is clearly invisible to GPR. This is expected because in clay soils the electrical conductivity is high and adding water greatly increases the attenuation of the radar signal. Nonmetallic landmines usually have dielectric constants that are low, very close to the dielectric constant of dry soil, where metallic landmines have dielectric constants that approach infinity since they are by definition conductors. So metallic landmines in theory should produce perfect reflections under all soil conditions where nonmetallic landmines will produce reflections governed by the contrast in the dielectric constant of the soil and the landmine. 4.2 Results from Yuma Proving Grounds test sites Figure 10 shows two wiggle trace plots of an M15 metallic antitank landmine buried in a sandy loam soil at the YPG Countermine Testing and Training Range. In the first plot of this figure the landmine shows a very clear hyperbolic pattern directly in the center of the image. This was imaged under 6% volumetric soil water content. The second plot is for the same landmine but after raising the soil water content to 23% above the landmine. In this second plot the landmine is not as clear due to the increase in radar signal attenuation caused by an increase in soil water content. Figure 11 shows two wiggle trace plots of a TM-62M metallic antitank landmine buried in a loamy sand at the YPG Countermine Testing and Training Range. The first plot shows another very clear image of the landmine under low soil water content (5%). The second plot in this figure is of the same landmine but after raising the soil water content to 26% above the mine. The image in this second plot is very poor and without prior knowledge of a landmine present it could be overlooked. 4.3 Results from the TNO Physics and Electronics Laboratory test site Looking at the results from the lane with the ferruginous soil (See Figure 12) one can clearly see the AT landmine even at the depth of 30 cm. In fact the performance of the GPR does not seem to be much different from that shown for the Sevilleta sand soil (See Figure 7). In the peat lane the extremely high moisture levels influence the GPR performance negatively (See Figure 13). It is hard to see even a big object like an AT landmine at the depth of 30 cm. Although the ground water level in the peat lane has been set to be at between 35 and 40 cm below the surface, the practice is that often the ground water level is

Figure 10 Wiggle trace plots of an M15 metallic antitank landmine buried 12.7 cm deep in a sandy loam soil at Yuma Proving Grounds Countermine Testing and Training Range, both plots imaged using 900 MHz GPR system.
Figure 11 Wiggle trace plots of an TM-62M metallic antitank landmine buried 12.7 cm deep in a loamy sand soil at Yuma Proving Grounds Countermine Testing and Training Range, both plots imaged using 900 MHz GPR system.
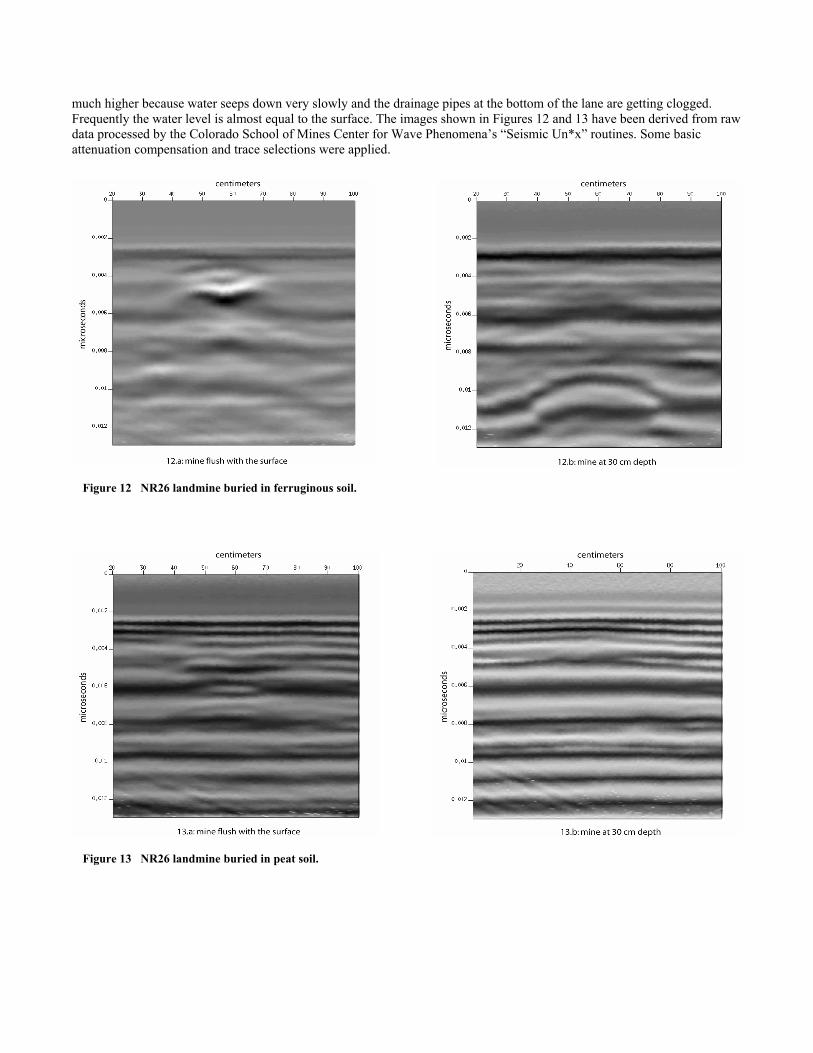
much higher because water seeps down very slowly and the drainage pipes at the bottom of the lane are getting clogged. Frequently the water level is almost equal to the surface. The images shown in Figures 12 and 13 have been derived from raw data processed by the Colorado School of Mines Center for Wave Phenomena’s “Seismic Un*x” routines. Some basic attenuation compensation and trace selections were applied.
Figure 13 NR26 landmine buried in peat soil.
Figure 12 NR26 landmine buried in ferruginous soil.
5. CONCLUSIONS
In this study we have predicted that for nonmetallic antitank landmines the contrast between the bulk dielectric constant of the soil and the landmine will increase as the soil water content increases. Furthermore, we have predicted that the attenuation of the radar signal will also increase as the soil water content increases for sand, silt, and clay soils. For sandy soils, we have predicted that the amount of attenuation will be insignificant and will not negatively affect the ability of GPR to detect nonmetallic antitank landmines. The same is true for silt soils. For clay soils, the attenuation factor becomes significant at high water contents. Field research in Socorro, New Mexico has shown these model predictions to be correct. Field research at Yuma Proving Grounds shows that metallic landmines seem to behave like nonmetallic landmines buried in clay soils, in that they tend to produce clearer images in dryer soil conditions and poorer images in saturated soil conditions. This is due to the fact that metallic landmines are conductors and will normally produce perfect reflections, except for in saturated soils where the reflection is often masked by the large signal attenuation. Field research at the Netherlands test sites shows that ferruginous soils seem to behave in the same way as our Sevilleta sand soil in that detections are possible. Saturated peat soils however, appear to be more like saturated clay soils where radar signal attenuation is very large and camouflages the buried landmine.
ACKNOWLEDGMENTS This work is funded by a grant from the Army Research Office (Project 38830-EL-LMD). The authors would like to thank Dr. Russell S. Harmon, Senior Program Manager at the Army Research Office, for his valuable advice and support.
REFERENCES 1. Fritzsche, M. 1995. Detection of buried landmines using ground penetrating radar. Proceedings of the SPIE 2496,
pp. 100-109. 2. Trang, A.H. 1996. Simulation of mine detection over dry soil, snow, ice, and water. Proceedings of the SPIE 2765,
pp. 430-440. 3. Johnson, P.G., and P. Howard. 1999. Performance results of the EG&G vehicle mounted mine detector. Proceedings
of the SPIE 3710, pp. 1149-1159. 4. Scheers, B., M. Acheroy, and A. Vander Vorst. 2000. Time domain modeling of UWB GPR and its application on
landmine detection. Proceedings of the SPIE 4038, pp. 1452-1460. 5. Borchers, B., Hendrickx, J. M. H., Das, B. S., and Hong, S. H. “Enhancing dielectric constrant between land mines
and the soil environment by watering: modeling, design, and experimental results”, in Detection and Remediation Technologies for Mines and Minelike Targets V, Proceedings of SPIE Vol. 4038, pages 993-1000. 2000.
6. J. M. H. Hendrickx, “Determination of hydraulic soil properties,” in Process studies in hillslope hydrology, M. G.
Anderson and T.P. Burt eds.,. pp. 43-92, Wiley, New York, 1990. 7. A. Klute ed., Methods of Soil Analysis - Part 1 Physical and Mineralogical Methods (Second Edition), Agronomy
Monograph No. 9., SSSA, Madison, WI, 1986. 8. W. de Jong, H.A. Lensen, Y.H.L. Janssen, “Sophisticated test facility to detect land mines.”, in Detection and
Remediation Technologies for Mines and Mine-like Targets IV, Proceedings SPIE Orlando Vol. 3710 pp 1409-1418, April 1999.