Effect of Oxidation on Surface-Enhanced Raman Scattering Activity
8
Published: June 06, 2011 r2011 American Chemical Society 5873 dx.doi.org/10.1021/ac2005839 | Anal. Chem. 2011, 83, 5873–5880 ARTICLE pubs.acs.org/ac Effect of Oxidation on Surface-Enhanced Raman Scattering Activity of Silver Nanoparticles: A Quantitative Correlation Yun Han, † Robert Lupitskyy, ‡ Tseng-Ming Chou, † Christopher M. Stafford, § Henry Du,* ,† and Svetlana Sukhishvili* ,‡ † Department of Chemical Engineering and Materials Science and ‡ Department of Chemistry, Chemical Biology and Biomedical Engineering, Stevens Institute of Technology, Castle Point on Hudson, Hoboken, New Jersey 07030, United States § Polymers Division, National Institute of Standards and Technology, Gaithersburg, Maryland 20899, United States b S Supporting Information S urface-enhanced Raman scattering (SERS) is an attractive analytical technique for label-free detection and identification of chemical and biological species at trace concentrations. 13 While signi ficant advances have been made in engineering various SERS- active metal (mainly Ag and Au) nanostructures, 413 SERS is far from being adopted as a routine analytical technique. This is mainly due to the strong dependence of SERS enhancement on structural, morphological features of metal nanostructures 1320 as well as on surface chemistry and details of molecular binding. Signi ficant challenges remain, in particular, when Ag, often a metal of choice because of its inherently higher SERS activity compared to its Au counterpart, is used in preparation of SERS-active nanostructures. Silver is prone to oxidation even under ambient conditions, and this results in signi ficant changes in the chemical and plasmonic properties of Ag nanoparticles (Ag NPs). 2125 For example, exposure to air or oxygen has been reported to cause a red shift of Ag NP plasmonic bands 21,23,24 Another example is an interesting observation of the dependence of oxidation of Ag NPs on the NP size. 22,26 In this report, we aim to identify and quantify surface oxidation species using X-ray photoelectron spectroscopy (XPS) and to demonstrate their effect on SERS activity of Ag NPs. The effects of oxidation on SERS activity of Ag nanostructures are far from being understood, and experimental reports are both rare and fragmented. In one earlier study of cryogenically deposited (32 K) porous silver film, Raman signals from ethylene and pyridine adsorbed at porous silver film were quenched upon exposure to small amounts of oxygen (approximately 0.1 monolayer). 27 This effect was hypothetically attributed to dis- sociative adsorption of oxygen at SERS active sites of silver surface and changes in the chemical component of the SERS enhancement. Recently, we have demonstrated that exposure of SERS substrates with immobilized Ag NPs synthesized in Ar to the lab ambient environment was sufficient to result in 5 orders of magnitude penalty in the detection limit for nitroaromatic molecules in aqueous solutions. 28 Qi et al. 26 reported similar observations regarding the instability of Ag NPs in air. While oxidation of Ag nanostructures has previously been shown to decrease their SERS activity, here we have revealed the chemical identity of oxidized surface species (different forms of Ag oxides), quantified their amounts, and for the first time established quantitative correlations between the degree of Ag NP oxidation and SERS enhancement factors (EFs). Our studies Received: March 5, 2011 Accepted: June 6, 2011 ABSTRACT: We quantitatively studied, using X-ray photoelectron spectroscopy (XPS), oxidation of substrate-immobilized silver nano- particles (Ag NPs) in a wide range of conditions, including exposure to ambient air and controlled ozone environment under UV irradia- tion, and we correlated the degree of silver oxidation with surface- enhanced Raman scattering (SERS) enhancement factors (EFs). The SERS activity of pristine and oxidized Ag NPs was assessed by use of trans-1,2-bis(4-pyridyl)ethylene (BPE) and sodium thiocynate as model analytes at the excitation wavelength of 532 nm. Our study showed that the exposure of Ag NPs to parts per million (ppm) level concentrations of ozone led to the formation of Ag 2 O and orders of magnitude reduction in SERS EFs. Such an adverse effect was also notable upon exposure of Ag NPs under ambient conditions where ozone existed at parts per billion (ppb) level. The correlated XPS and SERS studies suggested that formation of just a submonolayer of Ag 2 O was sufficient to decrease markedly the SERS EF of Ag NPs. In addition, studies of changes in plasmon absorption bands pointed to the chemical enhancement as a major reason for deterioration of SERS signals when substrates were pre-exposed to ambient air, and to a combination of changes in chemical and electromagnetic enhancements in the case of substrate pre-exposure to elevated ozone concentrations. Finally, we also found UV irradiation and ozone had a synergistic effect on silver oxidation and thus a detrimental effect on SERS enhancement of Ag NPs and that such oxidation effects were analyte-dependent, as a result of inherent differences in chemical enhancements and molecular binding affinities for various analytes.
Transcript of Effect of Oxidation on Surface-Enhanced Raman Scattering Activity

Published: June 06, 2011
r 2011 American Chemical Society 5873 dx.doi.org/10.1021/ac2005839 |Anal. Chem. 2011, 83, 5873–5880
ARTICLE
pubs.acs.org/ac
Effect of Oxidation on Surface-Enhanced Raman Scattering Activity ofSilver Nanoparticles: A Quantitative CorrelationYun Han,† Robert Lupitskyy,‡ Tseng-Ming Chou,† Christopher M. Stafford,§ Henry Du,*,† andSvetlana Sukhishvili*,‡
†Department of Chemical Engineering and Materials Science and ‡Department of Chemistry, Chemical Biology and BiomedicalEngineering, Stevens Institute of Technology, Castle Point on Hudson, Hoboken, New Jersey 07030, United States§Polymers Division, National Institute of Standards and Technology, Gaithersburg, Maryland 20899, United States
bS Supporting Information
Surface-enhanced Raman scattering (SERS) is an attractiveanalytical technique for label-free detection and identification
of chemical and biological species at trace concentrations.1�3 Whilesignificant advances have been made in engineering various SERS-active metal (mainly Ag and Au) nanostructures,4�13 SERS is farfrom being adopted as a routine analytical technique. This is mainlydue to the strong dependence of SERS enhancement on structural,morphological features of metal nanostructures13�20 as well as onsurface chemistry and details of molecular binding. Significantchallenges remain, in particular, when Ag, often a metal of choicebecause of its inherently higher SERS activity compared to its Aucounterpart, is used in preparation of SERS-active nanostructures.Silver is prone to oxidation even under ambient conditions, and thisresults in significant changes in the chemical andplasmonic propertiesof Ag nanoparticles (Ag NPs).21�25 For example, exposure to air oroxygen has been reported to cause a red shift of Ag NP plasmonicbands21,23,24 Another example is an interesting observation of thedependence of oxidation ofAgNPs on theNP size.22,26 In this report,we aim to identify and quantify surface oxidation species using X-rayphotoelectron spectroscopy (XPS) and to demonstrate their effecton SERS activity of Ag NPs.
The effects of oxidation on SERS activity of Ag nanostructuresare far from being understood, and experimental reports are both
rare and fragmented. In one earlier study of cryogenicallydeposited (32 K) porous silver film, Raman signals from ethyleneand pyridine adsorbed at porous silver film were quenched uponexposure to small amounts of oxygen (approximately 0.1monolayer).27 This effect was hypothetically attributed to dis-sociative adsorption of oxygen at SERS active sites of silversurface and changes in the chemical component of the SERSenhancement. Recently, we have demonstrated that exposure ofSERS substrates with immobilized Ag NPs synthesized in Ar tothe lab ambient environment was sufficient to result in 5 orders ofmagnitude penalty in the detection limit for nitroaromaticmolecules in aqueous solutions.28 Qi et al.26 reported similarobservations regarding the instability of Ag NPs in air.
While oxidation of Ag nanostructures has previously beenshown to decrease their SERS activity, here we have revealed thechemical identity of oxidized surface species (different forms ofAg oxides), quantified their amounts, and for the first timeestablished quantitative correlations between the degree of AgNP oxidation and SERS enhancement factors (EFs). Our studies
Received: March 5, 2011Accepted: June 6, 2011
ABSTRACT: We quantitatively studied, using X-ray photoelectronspectroscopy (XPS), oxidation of substrate-immobilized silver nano-particles (Ag NPs) in a wide range of conditions, including exposureto ambient air and controlled ozone environment under UV irradia-tion, and we correlated the degree of silver oxidation with surface-enhanced Raman scattering (SERS) enhancement factors (EFs). TheSERS activity of pristine and oxidized Ag NPs was assessed by use oftrans-1,2-bis(4-pyridyl)ethylene (BPE) and sodium thiocynate asmodel analytes at the excitation wavelength of 532 nm. Our studyshowed that the exposure of Ag NPs to parts per million (ppm) level concentrations of ozone led to the formation of Ag2O andorders of magnitude reduction in SERS EFs. Such an adverse effect was also notable upon exposure of Ag NPs under ambientconditions where ozone existed at parts per billion (ppb) level. The correlated XPS and SERS studies suggested that formation ofjust a submonolayer of Ag2O was sufficient to decrease markedly the SERS EF of Ag NPs. In addition, studies of changes in plasmonabsorption bands pointed to the chemical enhancement as a major reason for deterioration of SERS signals when substrates werepre-exposed to ambient air, and to a combination of changes in chemical and electromagnetic enhancements in the case of substratepre-exposure to elevated ozone concentrations. Finally, we also found UV irradiation and ozone had a synergistic effect on silveroxidation and thus a detrimental effect on SERS enhancement of Ag NPs and that such oxidation effects were analyte-dependent, asa result of inherent differences in chemical enhancements and molecular binding affinities for various analytes.

5874 dx.doi.org/10.1021/ac2005839 |Anal. Chem. 2011, 83, 5873–5880
Analytical Chemistry ARTICLE
embrace a wide range of environmental conditions, starting fromambient ones (situation usually met during analytical SERS-based sensing) to environments with enhanced and controlledconcentrations of an oxidizing species (ozone). Simultaneousobservations of plasmonic and chemical changes during Ag NPoxidation, and correlating these changes with Ag NP SERSperformance, allowed us to understand the relative importance ofchemical and electromagnetic mechanisms in SERS quenching atvarious stages of AgNP preoxidation. Interestingly, while SERS EFsdropped dramatically upon long-term (days) exposure of AgNPs toambient air, we foundneither evidence of formation of silver oxide atthe surface nor significant changes in AgNPplasmon bands (factorspointing to changes in SERS chemical enhancement at this timescale). At controlled higher levels of ozone content (∼17 ppm),growth of Ag2O occurred, resulting in a sharp degradation ofSERS activity due to a simultaneous decrease in chemical andelectromagnetic enhancements. Finally, at concentrations of ozone.20 ppm, Ag2O was converted to AgO, and the SERS signals werecompletely degraded.
Moreover, seeking to imitate SERS measurements outdoorswhen substrates are exposed to sunlight, we studied the combinedeffect of ozone and UV�vis light exposure on oxidation and SERSperformance of Ag NP-based substrates, and we also explored howAgNP preoxidation affects the SERS activity toward various analytemolecules. Our study contributes strongly to the understanding ofplasmonic andmolecular consequences of AgNP oxidation on theirSERS enhancement. The results and conclusions will be useful forthe development of stable and reproducible SERS substrates forultrasensitive chemical and biological sensing.
’EXPERIMENTAL SECTION
General. Equipment and instruments or materials are identi-fied in the paper in order to adequately specify the experimentaldetails. Such identification does not imply recommendation by theNational Institute of Standards andTechnology (NIST), nor does itimply thematerials are necessarily the best available for the purpose.Materials. All chemical reagents were purchased from the
indicated suppliers and used without further purification: sodiumcitrate dehydrate (enzyme grade, Fisher), silver nitrate (ultra-pure grade, Acros), HAuCl4 solution (99.99% trace metals basis,30 mass % by mass in dilute HCl, Aldrich), sodium thiocyanate(NaSCN, 99.99%, Aldrich), trans-1,2-bis(4-pyridyl)ethylene (BPE;97%, Aldrich), poly(allylamine hydrochloride) (PAH;mass-averagemolecular massMw of 15 000 g/mol, Aldrich), and ethanol (anhy-drous, 99.8%, Aldrich).Water used for experiments was filteredwithBarnstead ion-exchange columns and then further purified bypassage through Millipore (Milli-Q) columns. All glassware andsubstrates were cleaned in Nochromix (Godax Laboratories, Inc.)solution in concentrated sulfuric acid overnight, followed bythorough rinsing with Milli-Q water.Synthesis of Ag and Au NPs. Ag NPs were synthesized by a
modified Lee and Meisel procedure.4 AgNO3 (424 μL of100 mM solution) was diluted in 39.576 mL of water to give a1 mM AgNO3 solution. Sodium citrate (0.8 mL of 1% by masssolution in water) was then added dropwise into the AgNO3
solution under continuous stirring. The mixture was stirred forapproximately 1 min and then transferred into a UV chamber(UV flood curing system, cure zone 2; CON-TROL-CURE,Chicago, IL). A water bath was used to keep the reaction mixturebetween 25 and 50 �C. The bath water was changed every halfhour. The chosen temperature interval assured fast growth of
relatively monodispersed, spherically shaped Ag NPs. The reac-tion mixture was kept under UV irradiation with continuousstirring for 2 h in an argon-filled glovebox. The resultant Ag colloidalsolution was orange-brown in color. The colloidal solution waswrapped in aluminum foil to avoid light exposure and stored in theargon-filled glovebox. The ζ-potential of produced Ag colloidsmeasured on a Zetasizer Nano-ZS (Malvern Instruments, Inc.)was �40 mV ( 5 mV in Milli-Q water. The average particlediameter of the Ag colloids characterized by Zetasizer was 48 nmwith a polydispersity index of 0.12. Moreover, transmission electronmicroscopy (TEM; data not shown) and scanning electron micro-scopy (SEM) measurements (see, for example, Figure 1) were usedto further confirm the size of synthesized Ag NPs. The results fromdifferent techniques are consistent. UV�visible absorption spec-trum of Ag nanoparticle solution obtained with the Synergy HTmultidetection microplate reader (BioTek Instruments) showed anabsorbance peak at 410 nmwith full width at half-mazimum (fwhm)∼60 nm. These results indicate a narrower Ag NP size distributionwhen compared to Ag NPs produced by the Lee and Meiselreduction method.AuNPs were synthesized bymixing 20mL ofHAuCl4 (4mM)
and 20 mL of citrate (6.24 mM) and exposing the mixture to UVlight for 30 min, otherwise following the same procedure of Agnanoparticle synthesis. The resultant gold colloids were reddish incolor with a plasmonic absorption peak at 550 nm. The average sizeof the resultant gold nanoparticles was 80 nm with a polydispersityindex of 0.16 and ζ-potential 38 mV( 5 mV in Milli-Q water. Thecolloidal solution was protected with aluminum foil to avoid lightexposure and stored in the argon-filled glovebox.Preparation of SERS Substrates and XPS Samples. SERS
substrates were prepared by immobilizing Ag or Au NPs on thebottom of homemade glass cells following the detailed proceduredescribed earlier.28 Glass cells were filled with 1 M NaOH for5 min to increase the negative charge on the glass surface andthen rinsed thoroughly with Milli-Q water. They were then filledwith 0.2 mg/mL PAH solution, the pH was adjusted to 9 for30 min, and the glass cells were rinsed thoroughly with Milli-Qwater. From ellipsometric measurements, the thickness of drymonolayers of adsorbed PAH was ∼9 Å. Finally, PAH-coatedglass cells were filled with Ag colloidal solution for 24 h, thenrinsed with argon-purgedMilli-Q water, and kept full with argon-purged Milli-Q water. SERS substrates were prepared and storedin the argon-filled glovebox.
Figure 1. SEM image of Ag NPs synthesized in argon environment andimmobilized on a glass slide with PAH as an anchoring layer by 24 hdeposition from 1012 particle/mL solution at pH 5.6.

5875 dx.doi.org/10.1021/ac2005839 |Anal. Chem. 2011, 83, 5873–5880
Analytical Chemistry ARTICLE
For the preparation of XPS samples, silicon wafers were pre-coated with a 90 nm thick gold film by atomic layer deposition toeliminate oxygen contribution from native oxide during XPSanalysis. Ag NPs were then immobilized onto silicon wafers follow-ing the same procedure as that for SERS substrate preparation.Oxidative Treatment of SERS and XPS Samples. Oxidation
of Ag NPs with controlled ozone concentration was performedby use of an Air-Duct 2000 ozone generator (Air-Zone Inc., Suffolk,VA). Oxygen flow was used to maintain ozone concentration at17 ( 1 ppm level. Ozone concentration was measured via OS-4Ozone Switch sensor (Eco Sensors, Inc.) with a detection rangefrom 10 ppb to 20 ppm. UV exposure was performed in a CureZone 2UV flood curing system (CON-TROL-CURE,Chicago, IL)with a 400 W metal halide lamp as a source of UV irradiation(spectral range 320�400 nm). The intensity of the UV irradiationwas 80 mW/cm2 at a distance of 5 cm from the protective shield ofthe lamp. The samples were placed 22.5 cm from the protectiveshield of the UV lamp.Oxidation at high ozone concentration was performed by use
of a mercury UV grid lamp (BHK Inc., Claremont, CA) with a185 nm ozone-producing band. The intensity of the UV light was7.5 mW/cm2 at 2.5 in. from the lamp. The ozone level generatedby this lamp (.20 ppm) was beyond the detection limit of ourozone sensor. Samples were placed 10 cm from the lamp foroxidation treatment.SERS and XPS Measurements. SERS setup and measure-
ments were described in our earlier publication.28 SERS signal wascollected by use of an Olympus 40� objective, N.A. 0.85, with thelaser beam probing the surface-immobilized Ag NPs through thetransparent glass substrate adhesively bonded to one end of precutglass tubes to form a watertight sample cell for in situ measure-ments. The cell was filled with 400 μL of an analyte solution at itsbottom prior to SERSmeasurements. In this work SERSmeasure-ments were performed at the excitation wavelength of 532 nm andthe power of 2.8mWforAgNPs and at 633 nmand 3.7mWfor AuNPs.While typical spectra were collected for 10� 20 s, at this laserpower the SERS features were not affected by illumination time,and similar results were obtained when spectra were collected via20 � 1 s exposure. Nikon 20� 0.4 N/A objective was used toproduce a large laser focusing beam (∼1 mm in diameter). Theselarge, defocused excitation spots, as well as the uniform Ag NPcoverage density, resulted in a relatively small, <15% spot-to-spotvariation in SERS intensity. Measurements were performed inthree different spots of each substrate and averaged. Data wereprocessed with Grams32 v5 and Origin 7.5 software.A Kratos Axis Ultra DLD X-ray photoelectron spectrometer
with monochromatic Al KR X-rays was used to determine theoxidation state of the Ag NPs. Samples were removed from Arstorage, mounted on a sample holder, and quickly installed intothe load lock to minimize air exposure. Scans at spectral resolu-tion 0.1 eV were collected at 20 eV pass energy for the Ag 3d, Au4f, C 1s, and O 1s regions at three separate locations on eachsample. A low-energy electron flood gun was used to minimizecharging. All peaks were corrected by referencing the primarypeak of the Au 4f signal at 84.0 eV. XPS data were processed withCasaXPS and Origin 7.5 software.
’RESULTS AND DISCUSSION
Because of our focus on quantifying the effect of Ag NPoxidation on their SERS activity, it was important that AgNPs were synthesized in an argon environment. To avoid
environmental oxidation of as-synthesized Ag NPs during theirimmobilization on PAH-modified, gold-coated silicon wafers(for XPS only) or glass slides (for SERS studies), NP surfaceimmobilization was also performed in an argon-filled glovebox.Figure 1 shows a typical SEM image of immobilized Ag NPs at adense particle coverage containing 19( 1dimers, 6( 1 trimers, and3 ( 1 larger aggregates per square micrometer. These aggregatesincluded∼69% of the total number of surface-immobilized Ag NPsand served as SERS “hot spots” in SERS measurements, contribut-ing to themajority of the SERS signal.2,29 Here, we followed a line ofthought that molecular oxygen does not oxidize silver underambient conditions30,31 and ozone is considered as the primaryoxidant that initiates the process of silver oxidation,26,28,32,33 and weaimed to monitor and control the ozone content during substrateoxidative pretreatment. The concentration of ozone in our experi-ments varied from 250 to 400 ppb in ambient air and was alsocontrolled at the mild level of 17 ( 1 ppm in order to establishquantitative correlation between the degree of Ag NP oxidation(probed by XPS) and SERS performance of Ag NP-immobilizedsubstrates. In addition, the effect of higher ozone concentrations.20 ppm on Ag NP SERS activity was also investigated.Quantitative Correlation of Oxidation of Ag NPs with
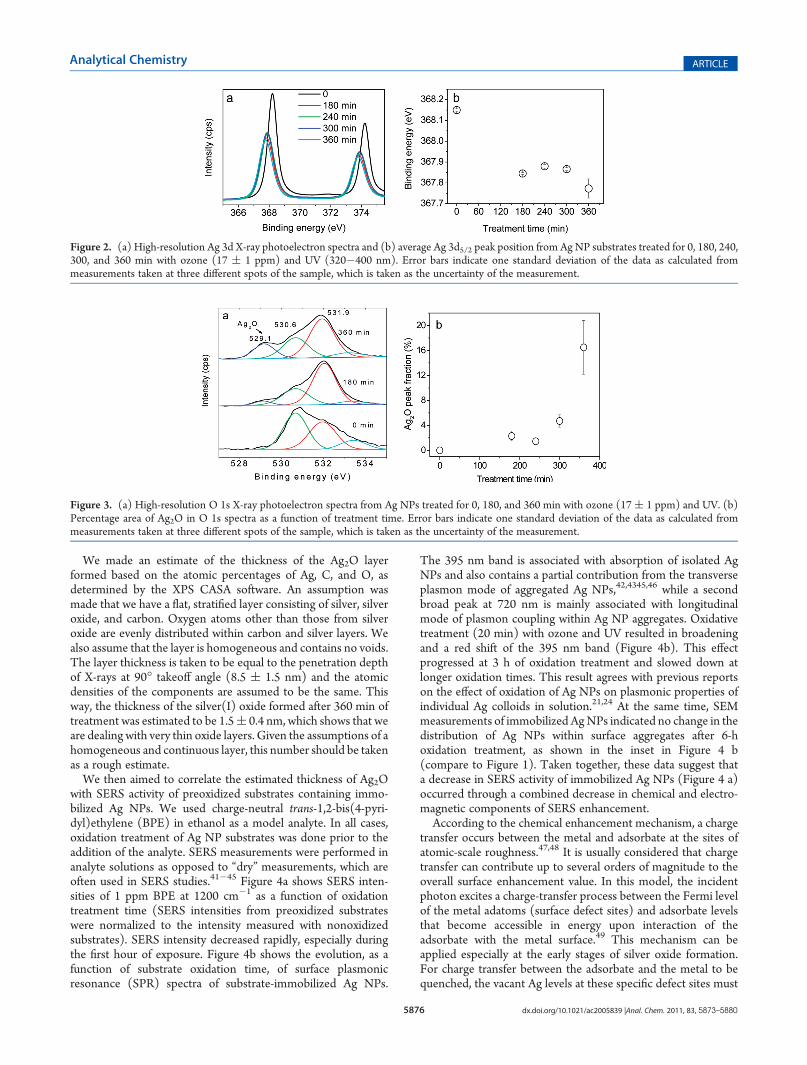
Their SERS Activity. For XPS and SERS experiments describedin this section, dry substrates containing immobilized unoxidized AgNPs were simultaneously exposed to ozone at 17( 1 ppm and UVirradiation. These substrates were then either analyzed by XPS todetermine the silver oxide formation, or exposed to analyte solutionsfor SERS measurements. Figure 2 shows (a) high-resolution Ag 3dspectra and (b) binding energies of Ag 3d peaks. The Ag 3d bindingenergy of 368.15 eV for the unoxidized sample is close to the valuereported for metallic Ag.34,35 Samples oxidized for 180, 240, 300, and360min have a significant∼0.3 eV shift in the Ag 3d peak position tolower binding energies. There is no significant difference, however,between Ag 3d binding energies of oxidized samples. CorrespondingAg 3d peak positions are within the uncertainty of the measurement(∼0.1 eV). Unlike other metals, silver exhibits a yet-to-be-explainedshift to lower binding energy as the oxidation state of Ag occurs.According to the literature, the shift is usually smaller for Ag2O(0.3�0.4 eV) and larger for AgO (0.8�1.0 eV).30,36 The directionand magnitude of the Ag 3d peak shift in our case suggests theformation of Ag2O. Additionally, formation of silver oxidation on AgNPs was also confirmed by energy-dispersive X-ray spectroscopy(EDS), as shown in Figure S-1, Supporting Information.Spectral changes in the O 1s region of XPS spectra provided
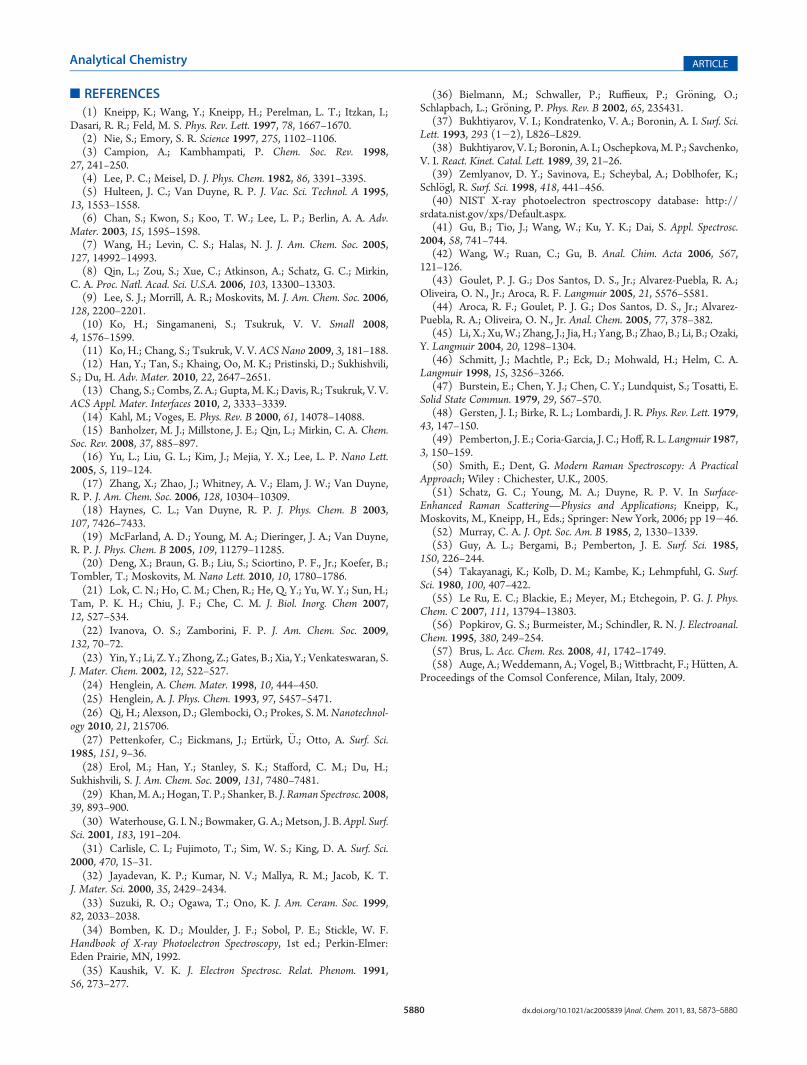
more quantitative information on the kinetics of Ag2O formation.High-resolution spectra of O 1s obtained from the samples oxidizedfor 0, 180, and 360min are presented in Figure 3a. The O1s spectraare broad and complex, suggesting contributions of several oxygenspecies. A peak at 530.6 eV is attributed to Ag2CO3 and adsorbedCO2 (530.5�531.0 eV).30,37 A broad peak at 531.9�532.0 eV isassociated with dissolved oxygen (530.5�531.5 eV),38,39 as well asoxygen originating from citrate molecules or products of citrateoxidation.40 A change in the relative intensities of these two peaksafter longer oxidation treatment time can be attributed to theoxidation of the organic layer around Ag NPs. Starting from 180min of exposure to the oxidative environment; a shoulder appears at529.1 eV. The intensity of the shoulder grows with treatment time.The position of the shoulder agrees well with the literature data forthe O 1s binding energy for Ag2O (529.5 eV for lightly oxidizedsilver surface and 529.2 eV for bulk Ag2O have been reported).30
The O 1s spectra were curve-fitted and Ag2O peak fraction wasplotted as a function of oxidation time in Figure 3b.
5876 dx.doi.org/10.1021/ac2005839 |Anal. Chem. 2011, 83, 5873–5880
Analytical Chemistry ARTICLE
We made an estimate of the thickness of the Ag2O layerformed based on the atomic percentages of Ag, C, and O, asdetermined by the XPS CASA software. An assumption wasmade that we have a flat, stratified layer consisting of silver, silveroxide, and carbon. Oxygen atoms other than those from silveroxide are evenly distributed within carbon and silver layers. Wealso assume that the layer is homogeneous and contains no voids.The layer thickness is taken to be equal to the penetration depthof X-rays at 90� takeoff angle (8.5 ( 1.5 nm) and the atomicdensities of the components are assumed to be the same. Thisway, the thickness of the silver(I) oxide formed after 360 min oftreatment was estimated to be 1.5( 0.4 nm, which shows that weare dealing with very thin oxide layers. Given the assumptions of ahomogeneous and continuous layer, this number should be takenas a rough estimate.We then aimed to correlate the estimated thickness of Ag2O
with SERS activity of preoxidized substrates containing immo-bilized Ag NPs. We used charge-neutral trans-1,2-bis(4-pyri-dyl)ethylene (BPE) in ethanol as a model analyte. In all cases,oxidation treatment of Ag NP substrates was done prior to theaddition of the analyte. SERS measurements were performed inanalyte solutions as opposed to “dry” measurements, which areoften used in SERS studies.41�45 Figure 4a shows SERS inten-sities of 1 ppm BPE at 1200 cm�1 as a function of oxidationtreatment time (SERS intensities from preoxidized substrateswere normalized to the intensity measured with nonoxidizedsubstrates). SERS intensity decreased rapidly, especially duringthe first hour of exposure. Figure 4b shows the evolution, as afunction of substrate oxidation time, of surface plasmonicresonance (SPR) spectra of substrate-immobilized Ag NPs.
The 395 nm band is associated with absorption of isolated AgNPs and also contains a partial contribution from the transverseplasmon mode of aggregated Ag NPs,42,4345,46 while a secondbroad peak at 720 nm is mainly associated with longitudinalmode of plasmon coupling within Ag NP aggregates. Oxidativetreatment (20 min) with ozone and UV resulted in broadeningand a red shift of the 395 nm band (Figure 4b). This effectprogressed at 3 h of oxidation treatment and slowed down atlonger oxidation times. This result agrees with previous reportson the effect of oxidation of Ag NPs on plasmonic properties ofindividual Ag colloids in solution.21,24 At the same time, SEMmeasurements of immobilized AgNPs indicated no change in thedistribution of Ag NPs within surface aggregates after 6-hoxidation treatment, as shown in the inset in Figure 4 b(compare to Figure 1). Taken together, these data suggest thata decrease in SERS activity of immobilized Ag NPs (Figure 4 a)occurred through a combined decrease in chemical and electro-magnetic components of SERS enhancement.According to the chemical enhancement mechanism, a charge
transfer occurs between the metal and adsorbate at the sites ofatomic-scale roughness.47,48 It is usually considered that chargetransfer can contribute up to several orders of magnitude to theoverall surface enhancement value. In this model, the incidentphoton excites a charge-transfer process between the Fermi levelof the metal adatoms (surface defect sites) and adsorbate levelsthat become accessible in energy upon interaction of theadsorbate with the metal surface.49 This mechanism can beapplied especially at the early stages of silver oxide formation.For charge transfer between the adsorbate and the metal to bequenched, the vacant Ag levels at these specific defect sites must
Figure 2. (a) High-resolution Ag 3d X-ray photoelectron spectra and (b) average Ag 3d5/2 peak position from Ag NP substrates treated for 0, 180, 240,300, and 360 min with ozone (17 ( 1 ppm) and UV (320�400 nm). Error bars indicate one standard deviation of the data as calculated frommeasurements taken at three different spots of the sample, which is taken as the uncertainty of the measurement.
Figure 3. (a) High-resolution O 1s X-ray photoelectron spectra from Ag NPs treated for 0, 180, and 360 min with ozone (17( 1 ppm) and UV. (b)Percentage area of Ag2O in O 1s spectra as a function of treatment time. Error bars indicate one standard deviation of the data as calculated frommeasurements taken at three different spots of the sample, which is taken as the uncertainty of the measurement.

5877 dx.doi.org/10.1021/ac2005839 |Anal. Chem. 2011, 83, 5873–5880
Analytical Chemistry ARTICLE
be altered in energy so that the incident radiation is no longer inresonance with the energy difference between these levels. Over-layer atoms fill vacant levels at the defect sites, thereby raising theFermi energy at these sites. Another significant component in SERSactivity is electromagnetic enhancement, usually considered as amajor contributor to SERS, which provides an EF from 106 to1011.50,51 The electromagnetic model of the surface enhancementdeveloped byMurray,52 for example, considers that the deposition ofan overlayer may increase the imaginary part of the macroscopicsurface dielectric function,53,54 leading to a decrease in electromag-netic field and SERS enhancement. In our case, the formation of Agoxide increases the dielectric constant of AgNPs, causing red shift anda decrease in intensities of plasmonic bands.46
We further aimed to establish quantitatively how the SERSenhancement factor (EF) is affected by oxidation of Ag NPs(Figure 5). EFs were calculated for BPE in ethanol by use of the1200 cm�1 band according to eq 1 with integrated intensities of thecharacteristic bands:
EF ¼ISERSCSERSINRCNR :
ð1Þ
where ISERS,CSERS and INR,CNR are integratedRaman intensities andconcentrations of analytes in solutions used in SERS and normalRaman measurements, respectively. This analytical method is fairlyintuitive andprovides a simplemeans to compare SERS efficiencies ofvarious substrates without making specific assumptions about thesurface densities of SERS-active sites and/or the surface density ofadsorbed molecules.55 An illustration of EF calculation is provided inthe Supporting Information. Note that SERS data used in EF cal-culation were obtained at the analyte concentration of detectionlimit. Figure 5 correlates the estimated Ag2O thickness with SERSEF. As shown in the graph, in the early stage of oxidation on Ag NPsurface, SERS EF drops sharply with increasing Ag2O thickness.Up to 3 orders of magnitude decrease in SERS EF compared tothat for unoxidized Ag NPs has been observed when only ∼0.4 nmthick Ag2O formed on Ag NPs. In the later stage of silver oxidation,further increase in Ag2O thickness causes an additional yet smallerdecrease in SERS EF.
Analyte-Dependent Effect of Oxidation. We have alsoexplored the effect of Ag NP oxidation on SERS activity usinga different analyte, NaSCN. SCN� is a common anionic analytewith high affinity to the silver surface. It has a pronounced band at2108 cm�1, corresponding to C�N stretching vibration. Asshown in Figure 6a, SERS intensity of 2108 cm�1 from 1 ppmSCN� in water decreased when immobilized Ag NPs wereoxidized by exposure to ozone and UV irradiation, similar toour observation with BPE. However, compared with BPE, adecrease in SERS activity of SCN� was significantly smaller afterthe same oxidation treatment of Ag NPs, as shown in Figure 6b.This distinct behavior of the analytes is especially dramaticduring the first hour of oxidative exposure, suggesting that BPEis more sensitive to the oxidation of Ag NPs than SCN�.Analyte dependence of SERS sensitivity to silver oxidation can
be attributed to two factors. The first factor is different effects of AgNP oxidation on the binding strength of various analytes. The affinityof BPE for Ag NP surface diminishes more dramatically as a result ofoxidation than the affinity of SCN�, because of stronger binding ofSCN� with the surface of silver. Stronger binding SCN� ions maydisplace silver oxide from the thin layer of silver oxide to formAgSCN,which still contributes to SERS of SCN�. The second factor for thedifference could be accounted for by changes in the chemicalcontribution to SERSEFs. This can be attributed to different energies
Figure 4. (a) Normalized SERS intensity of 1 ppm BPE in ethanol at 1200 cm�1 as a function of oxidation time of Ag NPs. (Inset) SERS spectra of1 ppm BPE in ethanol at the surface of immobilized Ag NPs treated for 0, 20, and 360 min with ozone (17( 1 ppm) and UV. Spectra were acquired with2.8 mW laser power at 532 nm excitation with 20 s acquisition time. Intensities were normalized to intensities measured with corresponding unoxidizedsubstrates. Error bars indicate standard deviation of the data as calculated frommeasurements taken at three different spots of the sample, which is taken as theuncertainty of the measurement. Because of the statistical uniformity of aggregated AgNPs within the defocused beam (∼1 mm in diameter) SERS probingarea, the spot-to-spot of SERS signal variationwas less than 15%. (b) Surface plasmon resonance (SPR) absorption of SERS substrates (immobilized AgNPs)treated with ozone (17 ( 1 ppm) and UV for various time periods. (Inset) SEM image of immobilized Ag NPs after 6-h oxidation treatment.
Figure 5. Correlation between EFs calculated for BPE in ethanol andestimated thickness of Ag2O (from data in Figure 3). Error bars indicateone standard deviation of the data as calculated from measurementstaken at three different spots of the sample, which is taken as theuncertainty of the measurement.

5878 dx.doi.org/10.1021/ac2005839 |Anal. Chem. 2011, 83, 5873–5880
Analytical Chemistry ARTICLE
of the electron levels that participated in charge transfer in the case ofadsorbed BPE and SCN� analytes. Upon adsorption of oxygenatoms, the Fermi levels at the defect sites increase in their energy.49
Therefore, BPE, probably having lower than SCN� electron levelsparticipating in the charge transfer, requires lower degrees of surfaceoxidation to move the charge transfer to the Fermi level out ofresonance with the incident radiation.Synergistic Effect of Ozone and UV. Since silver(I) oxide is
known to be a photosensitive semiconductor,56 electromagneticradiation is expected to promote Ag NP oxidation. Here, wedirectly demonstrate the effect of such a synergistic oxidation onSERS performance of Ag NPs achieved by the use of ozone incombination with UV irradiation. As a reference, we conductedexperiments where the samples were exposed to ozone only and toUV only in the absence of oxygen. SERS measurements wereperformed with 1 ppm solution of BPE in ethanol as an analyte. Asseen in Figure 7, SERS intensities from the samples treated by UVonly up to 60min remain the same as the initial one from untreatedsample, suggesting no oxidation occurred when Ag NPs wereexposed to UV light without oxygen in the environment. As com-pared to samples treated with ozone only, SERS intensitiesdecreased much more dramatically for the samples treated with acombination of ozone and UV irradiation. This can be explainedthrough the surface charge-transfer photochemistry.57 The surfaceplasmonic absorption band of Ag NPs is on the edge of the UVsource spectrum (320�400 nm) used in the experiment. Silversurface electrons, excited by the UV irradiation, are transferred to
the adsorbed O3 molecules, increasing dissociative sticking prob-ability and facilitating oxidation of silver atoms. For nanoparticles,the electric field building up upon ionization of adsorbed oxygenatoms on Ag surface is the driving force of the oxide growth.58 Be-cause of the photosensitive semiconducting properties of Ag2O,
56
UV irradiation promotes electron tunneling from the metal�oxideinterface to the adsorbed oxygen, leading to ionization of the oxygenatoms and an increase in the oxidation driving force.Oxidation of Silver by Atmospheric Ozone.We then sought
to assess the effect of outdoor exposure on SERS activity of silversubstrates. SERS cells with immobilized NPs were covered with aquartz slide in a way that prevents contamination by dust yet allowsfree air to penetrate inside. The samples were exposed for up to 20 houtdoors. Ambient ozone concentrations varied depending on thelocation and weather conditions. Our experiments were performedon sunny days of the summer withmeasured ozone concentration of250�400 ppb. This concentration was 50�100 times lower thanthe ozone concentration used in our laboratory experiments with∼17 ppm ozone concentration shown in Figures 4�7. The SERSmeasurements were performed with BPE as an analyte. Ag NPsshowed a 3-fold decrease in EF as a result of the outdoor exposure, asshown in Figure 8(9). The formation of Ag2O layer under suchmildoxidative conditions, however, could not be detected by XPS after20 h of exposure time. The lack of detectable Ag2O was alsoconfirmed by the UV�vis data that showed no significant shift in
Figure 6. (a) SERS spectra of 1 ppm SCN� in water at the surface of immobilized Ag NPs treated for 0, 20, and 360 min with ozone and UV. (b)Normalized SERS intensity of (O) 1 ppmBPE in ethanol at 1200 cm�1 and (4) 1 ppmSCN� in water at 2108 cm�1 as a function of oxidation time of AgNPs. Spectra were acquired with 2.8 mW laser power at 532 nm excitation with 20 s acquisition time. Error bars indicate one standard deviation of thedata as calculated from measurements taken at three different spots of the sample, which is taken as the uncertainty of the measurement.
Figure 7. Normalized SERS intensity of 1 ppm BPE in ethanol at1200 cm�1 as a function of oxidation time from Ag NPs exposed (4) toozone only, (]) toUV only, and (O) to a combination of ozone andUV.Error bars indicate one standard deviation of the data as calculated frommeasurements taken at three different spots of the sample, which is takenas the uncertainty of the measurement.
Figure 8. (a) SERS intensity of 1 ppmBPE in ethanol at 1200 cm�1 as afunction of exposure time with (9) Ag NPs and (O) Au NPs exposed toenvironmental ozone and sunlight, and (b) UV�vis absorption spectraof SERS substrates (immobilized Ag NPs) freshly prepared withoutoxidation and exposed to ambient air for 3 days. Error bars indicate onestandard deviation of the data as calculated from measurements taken atthree different spots of the sample, which is taken as the uncertainty ofthe measurement.

5879 dx.doi.org/10.1021/ac2005839 |Anal. Chem. 2011, 83, 5873–5880
Analytical Chemistry ARTICLE
the surface plasmon bands of immobilized Ag NPs after 3-dayexposure to environmental air (Figure 8b). Note that, unlike thedata reported byQi et al.,26 we are reporting here a short-term effectof exposure of AgNP to air, and all samples were pre-exposed to airfor a 1-min duration. Importantly, control experiments with SERSsamples kept in a nitrogen-filled glovebox in either dry or wet statefor over a week showed no decrease in SERS activity for BPE.Moreover, no deterioration of SERS signal was observed whenSERS substrates were exposed to light in a nitrogen atmosphere.We suggest that chemisorbed oxygen might be responsible for thedecrease of the Raman signal in Figure 8a, mostly due to a decreasein chemical enhancement and/or decreased binding of the BPEmolecules to the surface of Ag NPs. In contrast, similar experi-ments with immobilized Au NPs did not demonstrate changes inthe NP SERS activity (Figure 8,O), linking high oxidative stabilityof Au NPs with their consistent SERS performance.Oxidation of Ag NPs at High Ozone Concentration.
Although we have successfully detected and quantified the formationof Ag2O at 17( 1 ppmozone concentration, usingXPS, wewere notable to detect Ag�O stretching vibrations at 490 cm�1 30 in SERSexperiments, likely due to both low Raman activity and the smallamount of Ag2O formed at this moderate ozone concentration.Therefore, oxidation of Ag NPs was conducted at a much higherozone concentration of.20 ppm (see Experimental Section).Figure 9a shows SERS spectra of immobilized AgNPs oxidized
for different amounts of time, which were collected in the absence ofanalyte. A broad Raman peak at 490 cm�1 associated with Ag�Ostretching vibrations in Ag2O
30 emerges after 1�2 min of such asevere oxidative treatment. The intensity of this peak decreases after5 min of exposure, giving rise to another peak at ∼412 cm�1,attributed to Ag�O stretching vibrations in AgO. After 15 min ofoxidation treatment, a drastic change in particle morphology and fullconversion from metallic Ag to AgO occurred, as indicated by high-resolution TEM and X-ray diffraction (XRD) spectroscopy (FigureS-2, Supporting Information). Figure 9b shows SERS EFs acquiredwith Ag NP substrates as a function of the oxidation time in thesesevere conditions. EFs calculated from integrated intensities of 1608and 1639 cm�1 SERS bands obtained with 100 ppb BPE solutionsbrought in contact with oxidized silver NP substrates (Figure S-3,Supporting Information) decreased with oxidation time and fellvirtually to zero with 10-min preoxidized substrates, when Ag wasalmost completely converted to AgO.
’CONCLUSIONS
Our systematic oxidation treatment of AgNPs immobilized onplanar substrates coupled with detailed analytical examination andSERS measurements have led us to correlate quantitatively theextent of oxidationwith SERSEFs of AgNPs. Particularly, the SERSEF significantly drops when pristine Ag NPs undergo even a milddegree of oxidation in the form of only submonolayer Ag2Ocoverage on Ag NPs. At this stage of NP oxidation, the decreasein SERS activity of Ag NPs can be attributed primarily to decreasedadsorption of the analyte and changes in chemical contribution toSERS enhancement. However, at the later stage of oxidation,changes in EFs originate from a combined effect of chemical andelectromagnetic components of the SERS enhancement. In addi-tion, the effect of oxidation of Ag NPs on their SERS performancewas dependent on the nature of the analyte, due to differentchemical enhancement features, as well as varied molecular bindingstrength to the silver surface. These findings will serve as animportant reminder regarding the complexity of the SERS phenom-enon. Furthermore, they will form a valuable knowledge base for thedevelopment of stable and reproducible SERS platforms for chemi-cal and biological sensing in the real world.
’ASSOCIATED CONTENT
bS Supporting Information. Additional text and three fig-ures, showing SEM images and EDSmaps of Ag andO of AgNPsunoxidized and treated for 6 h with ozone and UV; TEM imagesand XRD spectra of Ag NPs before and after treatment at highozone concentration; and SERS spectra of BPE acquired with AgNP substrates treated at high ozone concentration for varioustime periods. This material is available free of charge via theInternet at http://pubs.acs.org/.
’AUTHOR INFORMATION
Corresponding Author*E-mail [email protected] (H.D.) or [email protected] (S.S.).
’ACKNOWLEDGMENT
This research project has been supported by the DefenseAdvanced Research Projects Agency through Grant N66001-09-1-2076.
Figure 9. (a) SERS spectra of immobilized Ag NPs after different treatment time periods and (b) corresponding SERS EFs as a function of oxidationduration. Ozone concentration, . 20 ppm; UV source, mercury lamp (185�400 nm). Spectra were acquired with 2.8 mW laser power at 532 nmexcitation with 20 s acquisition time. Error bars indicate one standard deviation of the data as calculated frommeasurements taken at three different spotsof the sample, which is taken as the uncertainty of the measurement.
5880 dx.doi.org/10.1021/ac2005839 |Anal. Chem. 2011, 83, 5873–5880
Analytical Chemistry ARTICLE
’REFERENCES
(1) Kneipp, K.; Wang, Y.; Kneipp, H.; Perelman, L. T.; Itzkan, I.;Dasari, R. R.; Feld, M. S. Phys. Rev. Lett. 1997, 78, 1667–1670.(2) Nie, S.; Emory, S. R. Science 1997, 275, 1102–1106.(3) Campion, A.; Kambhampati, P. Chem. Soc. Rev. 1998,
27, 241–250.(4) Lee, P. C.; Meisel, D. J. Phys. Chem. 1982, 86, 3391–3395.(5) Hulteen, J. C.; Van Duyne, R. P. J. Vac. Sci. Technol. A 1995,
13, 1553–1558.(6) Chan, S.; Kwon, S.; Koo, T. W.; Lee, L. P.; Berlin, A. A. Adv.
Mater. 2003, 15, 1595–1598.(7) Wang, H.; Levin, C. S.; Halas, N. J. J. Am. Chem. Soc. 2005,
127, 14992–14993.(8) Qin, L.; Zou, S.; Xue, C.; Atkinson, A.; Schatz, G. C.; Mirkin,
C. A. Proc. Natl. Acad. Sci. U.S.A. 2006, 103, 13300–13303.(9) Lee, S. J.; Morrill, A. R.; Moskovits, M. J. Am. Chem. Soc. 2006,
128, 2200–2201.(10) Ko, H.; Singamaneni, S.; Tsukruk, V. V. Small 2008,
4, 1576–1599.(11) Ko, H.; Chang, S.; Tsukruk, V. V. ACS Nano 2009, 3, 181–188.(12) Han, Y.; Tan, S.; Khaing, Oo, M. K.; Pristinski, D.; Sukhishvili,
S.; Du, H. Adv. Mater. 2010, 22, 2647–2651.(13) Chang, S.; Combs, Z. A.; Gupta, M. K.; Davis, R.; Tsukruk, V. V.
ACS Appl. Mater. Interfaces 2010, 2, 3333–3339.(14) Kahl, M.; Voges, E. Phys. Rev. B 2000, 61, 14078–14088.(15) Banholzer, M. J.; Millstone, J. E.; Qin, L.; Mirkin, C. A. Chem.
Soc. Rev. 2008, 37, 885–897.(16) Yu, L.; Liu, G. L.; Kim, J.; Mejia, Y. X.; Lee, L. P. Nano Lett.
2005, 5, 119–124.(17) Zhang, X.; Zhao, J.; Whitney, A. V.; Elam, J. W.; Van Duyne,
R. P. J. Am. Chem. Soc. 2006, 128, 10304–10309.(18) Haynes, C. L.; Van Duyne, R. P. J. Phys. Chem. B 2003,
107, 7426–7433.(19) McFarland, A. D.; Young, M. A.; Dieringer, J. A.; Van Duyne,
R. P. J. Phys. Chem. B 2005, 109, 11279–11285.(20) Deng, X.; Braun, G. B.; Liu, S.; Sciortino, P. F., Jr.; Koefer, B.;
Tombler, T.; Moskovits, M. Nano Lett. 2010, 10, 1780–1786.(21) Lok, C. N.; Ho, C. M.; Chen, R.; He, Q. Y.; Yu, W. Y.; Sun, H.;
Tam, P. K. H.; Chiu, J. F.; Che, C. M. J. Biol. Inorg. Chem 2007,12, 527–534.(22) Ivanova, O. S.; Zamborini, F. P. J. Am. Chem. Soc. 2009,
132, 70–72.(23) Yin, Y.; Li, Z. Y.; Zhong, Z.; Gates, B.; Xia, Y.; Venkateswaran, S.
J. Mater. Chem. 2002, 12, 522–527.(24) Henglein, A. Chem. Mater. 1998, 10, 444–450.(25) Henglein, A. J. Phys. Chem. 1993, 97, 5457–5471.(26) Qi, H.; Alexson, D.; Glembocki, O.; Prokes, S. M.Nanotechnol-
ogy 2010, 21, 215706.(27) Pettenkofer, C.; Eickmans, J.; Ert€urk, €U.; Otto, A. Surf. Sci.
1985, 151, 9–36.(28) Erol, M.; Han, Y.; Stanley, S. K.; Stafford, C. M.; Du, H.;
Sukhishvili, S. J. Am. Chem. Soc. 2009, 131, 7480–7481.(29) Khan,M. A.; Hogan, T. P.; Shanker, B. J. Raman Spectrosc. 2008,
39, 893–900.(30) Waterhouse, G. I. N.; Bowmaker, G. A.; Metson, J. B. Appl. Surf.
Sci. 2001, 183, 191–204.(31) Carlisle, C. I.; Fujimoto, T.; Sim, W. S.; King, D. A. Surf. Sci.
2000, 470, 15–31.(32) Jayadevan, K. P.; Kumar, N. V.; Mallya, R. M.; Jacob, K. T.
J. Mater. Sci. 2000, 35, 2429–2434.(33) Suzuki, R. O.; Ogawa, T.; Ono, K. J. Am. Ceram. Soc. 1999,
82, 2033–2038.(34) Bomben, K. D.; Moulder, J. F.; Sobol, P. E.; Stickle, W. F.
Handbook of X-ray Photoelectron Spectroscopy, 1st ed.; Perkin-Elmer:Eden Prairie, MN, 1992.(35) Kaushik, V. K. J. Electron Spectrosc. Relat. Phenom. 1991,
56, 273–277.
(36) Bielmann, M.; Schwaller, P.; Ruffieux, P.; Gr€oning, O.;Schlapbach, L.; Gr€oning, P. Phys. Rev. B 2002, 65, 235431.
(37) Bukhtiyarov, V. I.; Kondratenko, V. A.; Boronin, A. I. Surf. Sci.Lett. 1993, 293 (1�2), L826–L829.
(38) Bukhtiyarov, V. I.; Boronin, A. I.; Oschepkova,M. P.; Savchenko,V. I. React. Kinet. Catal. Lett. 1989, 39, 21–26.
(39) Zemlyanov, D. Y.; Savinova, E.; Scheybal, A.; Doblhofer, K.;Schl€ogl, R. Surf. Sci. 1998, 418, 441–456.
(40) NIST X-ray photoelectron spectroscopy database: http://srdata.nist.gov/xps/Default.aspx.
(41) Gu, B.; Tio, J.; Wang, W.; Ku, Y. K.; Dai, S. Appl. Spectrosc.2004, 58, 741–744.
(42) Wang, W.; Ruan, C.; Gu, B. Anal. Chim. Acta 2006, 567,121–126.
(43) Goulet, P. J. G.; Dos Santos, D. S., Jr.; Alvarez-Puebla, R. A.;Oliveira, O. N., Jr.; Aroca, R. F. Langmuir 2005, 21, 5576–5581.
(44) Aroca, R. F.; Goulet, P. J. G.; Dos Santos, D. S., Jr.; Alvarez-Puebla, R. A.; Oliveira, O. N., Jr. Anal. Chem. 2005, 77, 378–382.
(45) Li, X.; Xu,W.; Zhang, J.; Jia, H.; Yang, B.; Zhao, B.; Li, B.; Ozaki,Y. Langmuir 2004, 20, 1298–1304.
(46) Schmitt, J.; Machtle, P.; Eck, D.; Mohwald, H.; Helm, C. A.Langmuir 1998, 15, 3256–3266.
(47) Burstein, E.; Chen, Y. J.; Chen, C. Y.; Lundquist, S.; Tosatti, E.Solid State Commun. 1979, 29, 567–570.
(48) Gersten, J. I.; Birke, R. L.; Lombardi, J. R. Phys. Rev. Lett. 1979,43, 147–150.
(49) Pemberton, J. E.; Coria-Garcia, J. C.; Hoff, R. L. Langmuir 1987,3, 150–159.
(50) Smith, E.; Dent, G. Modern Raman Spectroscopy: A PracticalApproach; Wiley : Chichester, U.K., 2005.
(51) Schatz, G. C.; Young, M. A.; Duyne, R. P. V. In Surface-Enhanced Raman Scattering—Physics and Applications; Kneipp, K.,Moskovits, M., Kneipp, H., Eds.; Springer: New York, 2006; pp 19�46.
(52) Murray, C. A. J. Opt. Soc. Am. B 1985, 2, 1330–1339.(53) Guy, A. L.; Bergami, B.; Pemberton, J. E. Surf. Sci. 1985,
150, 226–244.(54) Takayanagi, K.; Kolb, D. M.; Kambe, K.; Lehmpfuhl, G. Surf.
Sci. 1980, 100, 407–422.(55) Le Ru, E. C.; Blackie, E.; Meyer, M.; Etchegoin, P. G. J. Phys.
Chem. C 2007, 111, 13794–13803.(56) Popkirov, G. S.; Burmeister, M.; Schindler, R. N. J. Electroanal.
Chem. 1995, 380, 249–254.(57) Brus, L. Acc. Chem. Res. 2008, 41, 1742–1749.(58) Auge, A.; Weddemann, A.; Vogel, B.; Wittbracht, F.; H€utten, A.
Proceedings of the Comsol Conference, Milan, Italy, 2009.